
Relocation of Major Ions in Snow along the Tundra-Taiga Ecotone
18
Nordic Hydrology, 24, 1993, 151-168 No part may be reproduced by any process without complete reference Relocation of Major Ions in Snow along the Tundra-Taiga Ecotone Paper presented at the 9th Northern Res. Basin Symposium~Workshop (Whitehorse/Dawson/Inuvik, Canada - August 1992) J. W. Pomeroy and P. Marsh Environment Canada, Saskatoon, Sask. S7N 3H5, Canada L. Lesack Simon Fraser University, Burnaby, V5A IS6 Canada The chemistry of seasonal snowcovers north of Inuvik, Northwest Territories, Canada was stratified by biophysical landscape. In this region, deposition of ions in winter occurs largely through the redistribution of wind-blown snow with accumulations in forest-edges and valley sides 8 to 12 times that of the open tundra. While dominated by this snow redistribution, the loading of most ions, except for SO^^-, does not scale exactly with that of snow, there being several mechanisms by which ion concentrations become relatively enriched or depleted in various landscape units. Vaporisation during temperature-gradient metamorphism in shallow-snow and uptake during either photochemical reac- tions or gaseous scavenging to well-exposed snow transformed concentrations of NOs- by 50 %. Dry deposition of aerosols to forested terrain and valley bottoms enriched C1-, ~ a + , M~~+, K+ and ca2+ concentrations up to more than two-fold, however scavenging of aerosols to blowing snow particles contri- buted an additional 40% to the sea-salt enrichment and 20 % to the ca2+ enrichment in wind-blown treeline forests. It is concluded that central measure- ments of snow chemistry in the Arctic cannot be reliably extrapolated without reference to changes caused by over-winter physical and chemical metamorphic processes. Associating the physicaVchemica1 changes with readily identifiable Arctic landscape units suggests a simple and robust method for spatial extrapo- lation. Introduction As snow accumulates on the ground it incorporates some of the major atmospheric geochemical elements (N, S, C1, C, P, Na, K, Mg, Ca) in its structure, either
Transcript of Relocation of Major Ions in Snow along the Tundra-Taiga Ecotone

Nordic Hydrology, 24, 1993, 151-168 No part may be reproduced by any process without complete reference
Relocation of Major Ions in Snow along the Tundra-Taiga Ecotone
Paper presented at the 9th Northern Res. Basin Symposium~Workshop (Whitehorse/Dawson/Inuvik, Canada - August 1992)
J. W. Pomeroy and P. Marsh Environment Canada, Saskatoon, Sask. S7N 3H5, Canada
L. Lesack Simon Fraser University, Burnaby, V5A IS6 Canada
The chemistry of seasonal snowcovers north of Inuvik, Northwest Territories, Canada was stratified by biophysical landscape. In this region, deposition of ions in winter occurs largely through the redistribution of wind-blown snow with accumulations in forest-edges and valley sides 8 to 12 times that of the open tundra. While dominated by this snow redistribution, the loading of most ions, except for SO^^-, does not scale exactly with that of snow, there being several mechanisms by which ion concentrations become relatively enriched or depleted in various landscape units. Vaporisation during temperature-gradient metamorphism in shallow-snow and uptake during either photochemical reac- tions or gaseous scavenging to well-exposed snow transformed concentrations of NOs- by 50 %. Dry deposition of aerosols to forested terrain and valley bottoms enriched C1-, ~ a + , M ~ ~ + , K+ and ca2+ concentrations up to more than two-fold, however scavenging of aerosols to blowing snow particles contri- buted an additional 40% to the sea-salt enrichment and 20 % to the ca2+ enrichment in wind-blown treeline forests. It is concluded that central measure- ments of snow chemistry in the Arctic cannot be reliably extrapolated without reference to changes caused by over-winter physical and chemical metamorphic processes. Associating the physicaVchemica1 changes with readily identifiable Arctic landscape units suggests a simple and robust method for spatial extrapo- lation.
Introduction
A s snow accumulates o n the ground it incorporates some of the major atmospheric geochemical elements (N, S, C1, C , P, Na, K, Mg, Ca) in its structure, either

J . W. Pomeroy et al.
through direct atmospheric deposition as ions in vapour or aerosols or previous incorporation as ions in falling snow crystals. Upon snowmelt, delivery of these atmospheric elements to soils and streams of the tundra and taiga is considered to be extremely important to ecosystem productivity and health because,
1) biological productivity in these ecosystems is usually nutrient limited (Van Cleve et al. 1983),
2) in high concentrations, some substances are considered contaminants and can become highly concentrated in the food chain of the region.
It would hence be useful to characterize the relative accumulations of geochemical elements in Arctic snowcovers on spatial scales that are meaningful to biogeoche- mica1 budgets of catchments and plant communities.
Atmospheric delivery of geochemical ions to the Canadian Arctic is strongly affected by snowcover because the long snowcovered winter permits substantial direct deposition to the snowpack (Barrie 1986). This winter deposition has a distinctive chemistry, characterized, in part, by atmospheric concentrations of a pollutant aerosol containing so4?- that are 20 to 40 times summer levels (Rahn and McCaffrey 1980). As well, coastal areas receive sea-salt aerosols until freeze- up and aeolian erosion contributes soil aerosols until a continuous snowcover forms.
During the winter and spring periods the processes of snow transport and melt relocate and fractionate ions contained in snowcovers, influencing their release to the soil, atmosphere or stream systems (Pomeroy et al. 1991a, 1991b; Davies et al. 1987; Tranter et al. 1986). Pomeroy and Male (1987) suggested that saltating snow particle impact on soil during blowing snow, induces erosion of aerosols that are subsequently deposited in snow drifts. Sublimation of ice from blowing snow par- ticles during wind transport of snow has been shown to significantly increase the concentrations of major ions in snow as snow was eroded, blown some distance and deposited (Pomeroy et al. 1991a). The exception is NOs- which vaporised some- what after deposition, causing it to return to pre-transport concentrations; this N vaporisation during drifting was first reported by Delmas and Jones (1987). Pomeroy et al. found so4?- concentrations increased about 1.2 fold after trans- port, scaling with sublimation losses over the 1 km transport distance, whilst the sea-salt ion concentrations (C1-, ~ a ' , K+ and increased from 1.5 to 2 fold over the same distance. Electrophoretic attraction of micron-sized sea-salt aerosols to saltating snow particles was suggested to explain the enrichment of sea-salt ions beyond their concentration due to sublimation of ice.
Snowcover in the Canadian subarctic/arctic transition is highly heterogeneous because of redistribution by wind and the great variety of landscape types, from windswept tundra to dense coniferous forests. Stratification of snowcover proper- ties by landscape units has been used to describe the spatial variation in this snowcover (Steppuhn and Dyck 1974; Timoney et al. 1992).

Relocation of Major Ions in Snow
The intent of this study is to assess the control exerted by snow redistribution on the spatial distribution of major ion accumulation in seasonal snowcovers. By examining the snowcover chemical and physical parameters over a diverse land- scape just before the melt period, sites dominated by particular snow transport phenomena may be identified and linked to distinctive ionic concentrations or loadings in snowcover. The distinctive ion concentrations or loadings in snow may then be associated with specific vegetation communities or topographic features that influence the aerodynamics of snow transport and accumulation.
Study Site
The site chosen for this study is part of the Trail Valley Creek catchment, 68"45'N, 133"30'W, 40 km north-northeast of Inuvik, NWT, Canada and 80 km south of the Arctic Ocean. The site consists of an upland tundra plateau incised by a broad, u- shaped river valley that runs from west to east into the Eskimo Lakes (see Fig. 1). Elevations range from 70 to 140 m above sea level. Vegetation on the upland plateau is open tundra with short (0.3 m high) willows, moss and grass, on some of the south-facing valley walls patches of stunted black-spruce forest occur and on the poorly-drained valley sides and bottom higher bushes (labrador tea, willows, alders 0.3-2 m high) cover generally hummocky terrain.
Trail Valley Creek usually has an eight month snow season with heavy snowfalls in October/November followed by a dryer cold period (-25" to -45" C) and then snowfalls again in MarchIApriVMay with melt in May or June. Winter wind speeds in the region vary from 2.3 m s-' at Inuvik (forested location) to 6.0 m s-' at Tuktoyaktuk (tundra coastal location), Trail Valley tends towards the Tuktoyak- tuk rather than the Inuvik wind regime. Snow transport is primarily from the northwest and south directions, roughly perpendicular to the valley.
The arctic SO?- aerosol reaches maximum concentration during January, Fe- bruary and March. Barrie (1986) shows ground level atmospheric concentrations of SO?- in the Trail Valley Creek area exceeding 2.2 yg mP3 for this period in 1980 compared with 2.1 yg m-3 for the For& Montmorency, north of Quebec City and 1.2 yg mP3 fo; Kenora, in northwest Ontario, hence the potential for SO?- deposition is quite high in mid-winter. The Beaufort Sea remains partially open until roughly October/November. Autumn sea storms introduce high concentra- tions of sea-salt aerosols into the atmosphere, which could be incorporated in precipitation crystals and deposited as snowfall or carried to Trail Valley as aerosols by the predominant northerly winds. Local soils contain calcareous mate- rial, and there are sites of active aeolian erosion west and north of our sampling area. A calcareous aerosol could therefore be entrained in the atmosphere early in the winter before a complete snowcover forms, or, for well-exposed sites, over the whole winter when strong winds are present.

J . W. Pomeroy et al.
Trail Valley Creek Site, NWT
Fig. 1. Trail Valley Creek Study Site, north of Inuvik, NWT.
Measurements
Measurements were conducted in late April, 1991 just before the spring melt. Snow water equivalent surveys used a snow depth rod with measurements every 5- m or less and occasional bulk snow density measurements with an ESC-30 gravimetric snow density sampler. Densities were confirmed for snow chemistry sampling locations by sampling from snow strata (3 to 5 strata per snow-pit) with small scoops of known volume which were weighed on an electronic balance to determine snow density for each stratum.
Snow samples for chemical analysis were collected from pits dug with teflon coated shovels and scraped clean with scoops that had been acid-washed and rinsed with deionised water. Snow was sampled from distinct snow strata (3 to 5 per pit) that corresponded to separate deposition or metamorphic sequences. Densities and snow crystal habit and size were also recorded for these strata. Snow samples were placed in HDPE bottles that had been acid washed then rinsed several times with deionised water. The bottles were returned to NHRI in a completely frozen state.
Snow chemistry samples were thawed and immediately filtered through 0.45 pm nucleopore filters. pH was measured with a Hach-one meter and low-ionic-strength research probe before and after filtering, with small increases after filtering; the before-filtering values are used here. Anion analyses were conducted on a Dionex 2010i ion chromatograph with a 100 pl injection loop, 0.75 mM NaHC03/ 1.5 mM

Relocation of Major Ions in Snow
Na2C03 eluent and suppressed conductivity detection. Samples were introduced by Technicon sampler into the loop after mixing 9 parts sample to 1 part concen- trated eluent (10X the working eluent concentration). A Dionex 4270 Integrator measured peak area and a Linear 100 Recorder measured peak height of Dionex concentration traces. Cation analyses were performed using flame atomic absorp- tion spectrophotometry on Perkin Elmer AAS Models 460, 2380 and 5000. Flame mixtures for Na and K were Air:Hz, for Mg were Air:Acetylene and for Ca were N20:Acetylene. 1000 pglml Na was added to samples and standards for Mg analy- ses and 2000 pglml K for Ca analyses. Numerous blanks on scoops, bottles, filters and analytical equipment were consistently below detection limits, indicating that no measurable contamination of samples occurred. The level of precision and limits of detection of the AAS and Dionex are normally at least an order of magnitude less than the levels measured.
Measurements of snow water equivalent and snow chemistry were conducted along transects. The major transect of snow depths, densities and 20 snow chemis- try sampling pits ran 1.3 km NW to SE from a rolling short-vegetation tundra through a shrub transition, down the north valley side through a wind-swept forest and eventually into a more sheltered forest. Smaller transects of a) 8 pits and b) 5 pits ran along 200 m of valley bottom (tundra vegetation up to 1 m height) and 20 m of a south valley side drift respectively (see Fig. 1).
Analysis and Results
The loading of an ion, L, (peq m-2), was calculated by multiplying the concentra- tion of the ion x , in a stratum, z, c,(z) (peq m-3), by the depth of the stratum ds(z) and the volumetric density of snow in the stratum es(z)lei (ratio of the density of snow to that of ice) and summing over the snow profile from stratum from z = 1 to z = Z a s
where ~i is equal to 1,000 kg m-3. Bulk concentration of an ion, C,, was calculated as
where D is the total depth of snow. Ion charge balances (cations - anions) were performed on each snow stratum as
a quality control index and to identify any major missing ions. Charge balance residuals were typically less than 10 peq 1-I and often less than 5 peq 1-I in centre and surface snow layers. However the depth hoar layers occasionally contained

J . W Pomeroy et al.
high concentrations of ca2+ and K+ from windblown soil dust, the concentrations of these ions corresponding to large charge imbalances, up to 80 peq 1-l. It is more likely that previously undissolved soil aerosols dissolved during melting and filter- ing, hence disturbing the charge balance, than a major unmeasured anion was present in wind-blown soil.
The pH of samples ranged from 4.7 to 5.6, centring on 4.9 to 5.1, indicating acidic conditions. The lowest pH occurred in surface snows and was associated with high concentrations of NOs- while the highest pH occurred in depth hoar and was associated with high concentrations of ca2+.
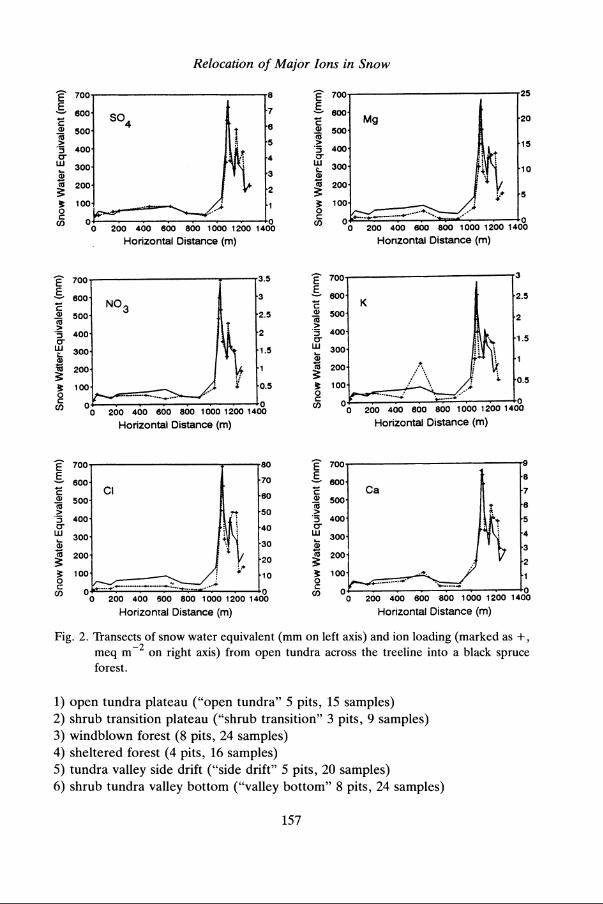
Landscape Transects The loadings of some of the major cations and anions and that of snow water equivalent (SWE) are shown for the major transect, crossing from short-vegetation tundra through the forest in Fig. 2. Though loadings and SWE are shown separate- ly, some appreciation of the change in ion concentration is given by comparing the two variables. For the first 900 m, the small hills and depressions on the tundra correspond to low and high SWE respectively on the scale of 100's of metres. There is a decrease in the variability of SWE but no change in the mean as the transect enters the shrub transition, however a tenfold increase in the mean SWE occurs upon entering the wind-swept forest, where the transect now declines sharply in elevation. This increase describes a large drift, formed from snow blown from the tundra and deposited within the forest. One hundred metres further a sheltered forest is reached with SWE about one-half that in the wind-blown forest. The loadings of SO^^-, NOg- and ca2+ scale approximately with SWE, though there is evidence of slightly enriched ~0~2.- and ca2+ at some sites in the forest. The loadings for the sea-salts, C1-, K+, M ~ ~ + (and ~ a + though not shown), do not scale consistently with SWE, showing an enrichment in the wind-blown forest relative to the tundra and sheltered forest.
Ion Loading by Landscape Class Stratification of SWE measurements by landscape class has been used in wind- blown areas (Prairies, High Arctic) and areas subject to variable interception of snow by vegetation (Mackenzie Valley) to describe the mean and coefficient of variation of SWE for certain classes of vegetationlterrain in the landscape (Steppuhn and Dyck 1974; Gray 1978; Woo and Marsh 1978). The technique lessens the requirement for extensive sampling to produce areal averages and permits a meaningful extrapolation from small to large scales using a few central snow measurements and landscape parameters that can be measured from maps, aerial photographs or satellite imagery. Reasoning that the physics of deposition of ions and snow are linked, ions loadings/concentrations in Trail Valley may be stratified into six classes based upon observed differences in biophysical landscape and SWE:
Sno
w W
ater
Equ
ival
ent (
mm
)
00
00
00
00
Sno
w W
ater
Equ
ival
ent (
mm
)
Sno
w W
ilter
cEqu
ival
ent (
mm
)
Sno
w W
ater
Equ
ival
ent (
mm
)
Snow
Wat
er E
quiv
alen
t (m
m) I
Ad
Bi
um
4m
Sno
w W
ater
zEqu
ival
ent (
mm
)
OU
OU

J . W. Pomeroy et al.
Table 1 - SWE (mm) and Ion Loadings (meq m-2) on the Open Tundra.
Landscape SWE H+ ~ a + ~ M ~ + ~ ~ a + K+ C1- NO3- so4?- Class
Open Tundra 51 0.45 0.52 0.64 1.36 0.16 2.14 0.23 0.59
Table 2 - SWE and Ion Loadings by Landscape Class Relative to Tundra.
Landscape SWE H+ ~ a + ~ M ~ + ~ ~ a + K+ C1- NO3- so4?- Class
Open 1 1 1 1 1 1 1 1 1 Tundra Shrub 1.1 1.11 1.22 1.31 0.78 2.17 0.85 0.84 1.02 Transition Windblown 8.19 8.74 11.2 20.7 25.6 9.1 22.4 9.5 8.07 Forest Sheltered 5.07 4.18 6.75 10.3 11.6 6.07 9.94 4.92 4.79 Forest Valleyside 12.5 18.1 5.68 6.51 6.97 4.31 6.1 16.7 9.25 Drift Valley 3.35 3.44 3.53 5.52 6.43 3.1 5.28 3.24 2.88 Bottom
Table 1 shows the loading of SWE, anions and cations on the open tundra, the dominant landscape class by area. Table 2 shows the loading by landscape class, relative to that on the open tundra. These mean values should be interpreted with reference to their variation. The coefficients of variation for SWE loading fall between 0.22 and 0.4 for the open tundra, shrub transition, side drift and wind- blown forest, however the valley bottom displays 0.49 and the sheltered forest as high as 0.65. The ion loadings have similar coefficients of variation to that of SWE except at the valley bottom where they range from 1.4 to 2.3 times the level for SWE (except for H+ at 1.05 times). For comparison, the coefficient of variation for SWE with all classes lumped is 0.8. Loadings of ca2+, K+ and ~0~2.- for this lumped class have similar coefficients of variation to SWE whilst H', M ~ ~ ' , ~ a ' , C1- and NOs- have coefficients of variation which are 20 to 35 % greater.
The greater variability of SWE and ions in the sheltered forest and valley bottom is due to the location of sampling points with respect to trees and shrubs which intercept falling snow and sometimes induce quite uneven snowdrifts. A further stratification into "near-treelbush" and "between-treeslbushes" snow would be desirable, however there are insufficient measurements in this experiment to attempt this. Pair-wise t-tests show that the shrub transition is indistinguishable from open tundra in terms of SWE and ion loading and will be included with the

Relocation of Major Ions in Snow
open tundra class in further discussion. The other landscape classes display distinct snowlion accumulations at the 90 % confidence level for at least two major ions (or snow accumulation), justifying the stratification despite the relatively small number of chemical sampling sites.
SWE is about 8 fold greater in the windblown forest and 12 fold greater in the valley side drift than on the open tundra. For the windblown forest this difference is notably exceeded by C1-, M ~ + and ~ a + with loadings more than 21 times greater than on the open tundra. Comparing the side drift and open tundra, the difference in SWE is exceeded somewhat by NOs- and H+ loadings but most ion loadings have notably less difference than does the SWE, particularly the sea-salts and ca2+. Hence though the side drift contains the greatest loading of snow, the wind-blown forest contains the greatest loadings of most ions. To put the wind- blown forest loadings in context, s ~ ~ ~ - , which scales well with SWE, has a winter loading in the wind-blown forest equal to that reported for rural Michigan, near to the industrial cities of the US Midwest and southern Ontario (Cadle et al. 1986).
The sheltered forest and valley bottom have accumulations of SWE about 5 and 3 times respectively greater than open tundra. In both cases the sea-salt loadings double this effect as does ca2+ for the sheltered forest; the other ion loadings scale well with the SWE.
It is evident in the above discussion that ion loading does not vary proportionate- ly to SWE and that the difference is specific to particular ions. To describe the enrichment of ion loading with respect to SWE and with reference to conditions oh the most common landscape class, the ion loading, L, is divided by its value on the open tundra and this ratio divided by the ratio of SWE to SWE on the open tundra,
L x / L x ( 0 t ) I o n Enrichment =
SWE/SWE(ot )
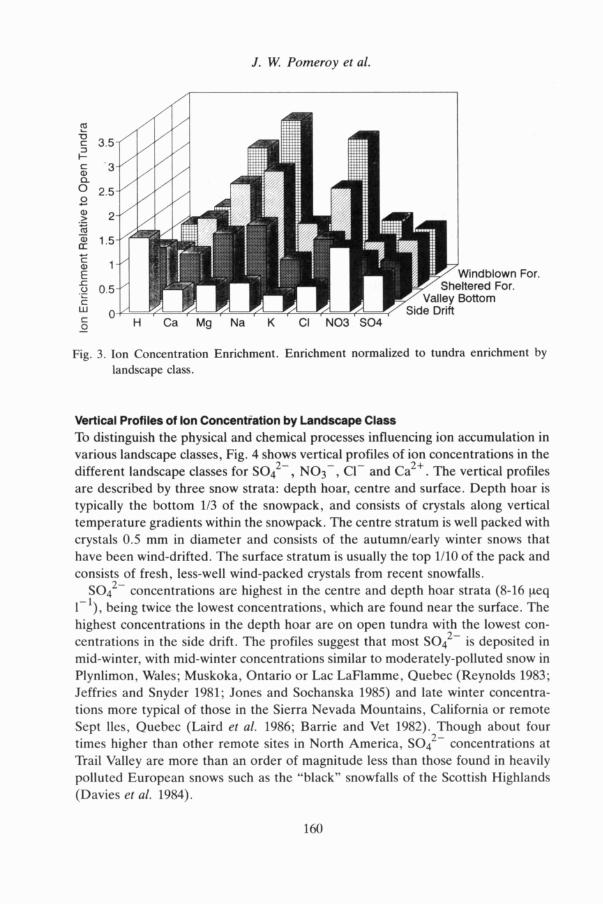
this is equivalent to the bulk concentration normalised with respect to the bulk concentration on the tundra. The resulting parameter, the relative ion enrichment relative to the open tundra, is shown in Fig. 3 for the four other landscape classes. so4!- enrichment appears quite stable among landscape classes, however the sea- salt ion enrichments vary by a factor of seven. As a class, the valley bottom enrichments are similar to open tundra and relatively stable, this is not true for the other classes though. A simple distinction by snow accumulation process does not explain all cases, for instance the windblown forest and the side drift are dominated by blowing snow inputs, yet sea-salt enrichment in the forest is much greater than the side-drift. The sheltered forest receives very little blowing snow yet its sea-salt enrichment is also quite high, suggesting another deposition mechanism. The following sections describe the vertical structure of ion concentrations by landscape class and then use this information to discuss processes of ion deposition and relocation that explain the patterns of ion loading and enrichment noted above.
J. W. Pomeroy er al.
I For.
Fig. 3. Ion Concentration Enrichment. Enrichment normalized to tundra enrichment by landscape class.
Vertical Profiles of Ion Concentfation by Landscape Class To distinguish the physical and chemical processes influencing ion accumulation in various landscape classes, Fig. 4 shows vertical profiles of ion concentrations in the different landscape classes for SO:-, NO3-, Cl- and ca2+. The vertical profiles are described by three snow strata: depth hoar, centre and surface. Depth hoar is typically the bottom 113 of the snowpack, and consists of crystals along vertical temperature gradients within the snowpack. The centre stratum is well packed with crystals 0.5 mm in diameter and consists of the autumnlearly winter snows that have been wind-drifted. The surface stratum is usually the top 1/10 of the pack and consists of fresh, less-well wind-packed crystals from recent snowfalls.
SO:- concentrations are highest in the centre and depth hoar strata (8-16 peq I-'), being twice the lowest concentrations, which are found near the surface. The highest concentrations in the depth hoar are on open tundra with the lowest con- centrations in the side drift. The profiles suggest that most s ~ ~ ~ - is deposited in mid-winter, with mid-winter concentrations similar to moderately-polluted snow in Plynlimon, Wales; Muskoka, Ontario or Lac LaFlamme, Quebec (Reynolds 1983; Jeffries and Snyder 1981; Jones and Sochanska 1985) and late winter concentra- tions more typical of those in the Sierra Nevada Mountains, California or remote Sept Iles, Quebec (Laird et al. 1986; Barrie and Vet 1982). Though about four times higher than other remote sites in North America, SO:- concentrations at Trail Valley are more than an order of magnitude less than those found in heavily polluted European snows such as the "black" snowfalls of the Scottish Highlands (Davies et al. 1984).

Relocation of Major Ions in Snow
Valley Bottom
Side Drift
Shelt. Forest
Windblwn Forest
Shrub Transition
Open Tundra - -
Concentration of SO4 (ueqll)
Centre p
Windblwn Forest
Shrub Transition
Concentration of NO3 (ueqll)
Windblwn Forest
Shrub Transition
Concentration of CI (ueqll)
Surface
Centre
Windblwn Forest
Shrub Transition
Concentration of Ca (ueqll)
Fig. 4. Vertical Profiles of Ion Concentration in Snow by Landscape Class.

J. W Pomeroy et al.
NO3- concentrations are lowest in depth hoar and twice as high in the centre and surface strata. Surface strata on the open tundra and side drift have concentrations that are notably higher than other sites. The NO3- concentrations at Trail Valley are well below those of eastern North America, except for eastern Quebec (Barrie and Vet 1982), similar to the lowest found in Wales and Scotland and more than an order of magnitude less than extremely polluted cases (Reynolds 1983; Tranter et al. 1986).
C1- concentrations indicate episodic deposition of sea-salt with extremely high concentrations in centre and depth hoar strata and moderate to low concentrations near the surface. The highest concentrations of CL- are in the forest and the valley bottom, with the lowest concentrations in the side drift and open tundra. The C1- concentrations are an order of magnitude greater than those reported from other regions in North America (Jeffries and Snyder 1982; Laird et al. 1986) and roughly equivalent to those of "non-black" snowfalls of marine origin in Scotland (Tranter et al. 1986), however they remain about four times less than concentrations in Scottish "black" snow where a large anthropogenic component exists.
Concentrations of ~ a + ~ also indicate episodic deposition, being highest in the depth hoar and much lower in the centre and surface strata. The highest ~ a + ~ concentrations are in the sheltered forest, windblown forest and open tundra. Depth hoar ca2+ concentrations are as high or higher than those reported for North America and northern Europe (even the Scottish "black" snows), and an order of magnitude greater than levels typical for marine locations (Davies et al. 1992).
Processes of Ion Accumulation and Relocation Metamorphism - Because of extremely cold air temperatures and large radiative energy losses from the surface, Arctic snowcovers sustain strong temperature gra- dients over the winter. These thermal gradients result in vertical gradients of water vapour pressure, hence snow crystals vaporise and recrystallize on colder surfaces of the snowpack. Temperature gradients of about 10°C m-' are sufficient for the growth of the "kinetic" form of snow crystals usually associated with depth hoar (faceted crystals up to 5 mm in diameter) (Colbeck 1986). Sturm (1991) shows notable water transport as vapour from the lower to upper snowpack under strong temperature gradients (25 to 50°C m-I) in Alaskan snow. Hewitt et al. (1991) suggest that both ~ 0 ~ ~ - and C1- remain incorporated in recrystallizing snow (Cl- most effectively); Pomero et al. (1991b) show similar findings for sublimating
- Y snow but show that NO3- is lost from sublimating snow crystals. A February visit to Trail Valley indicated temperatures at the snow/soil interface
of -10°C and -35°C at the surface (air temperature was -38"C, normal for that season). The gradients from these boundary conditions of 50°C m-I for the open tundra and 11°C m-I for the side drift would produce strong vapour transport on the open tundra but only marginal kinetic metamorphism in the side drift. If initial

Relocation of Major Ions in Snow
70 h
0
c 1 NO3 .P 30- Q
+ I
.I * * X )*
%bo 2i0 240 260 280 300 320 3io 360 380 400 Density Depth Hoar
Fig. 5. Changes in Concentrations of SO^-^, C1- and NO3- in Depth Hoar with Density of Depth Hoar. Points: landscape class means, lines: linear regressions.
snow deposition densities of 300-400 kg m-3 are presumed for all sites, then low depth hoar densities at the open tundra, sheltered forest and valley bottom (all shallow snowpacks) suggest sublimation of snow from the depth hoar layers. This may explain relatively high concentrations of so4?- and C1- in depth hoar at these same sites, if the concentrations of these ions were initially uniform. To examine this hypothesis, ion concentrations in depth hoar are plotted against the density of depth hoar in Fig. 5. Linear regressions between ion concentration and depth hoar density yield correlation coefficients, R ~ , of 0.79 for SO^^-, 0.82 for C1- and 0.28 for NO3-, the linear relationships from the successful regressions are plotted for comparison in Fig. 5. NO3- concentration does not show any relationship with snow loss and is therefore not conservative during temperature-gradient metamorphism. Its generally low concentrations in depth hoar compared with the upper pack suggest possible depletion during temperature-gradient metamorphism over the winter. Compensating for initial concentrations, the relative changes in ~ 0 ~ ~ - and C1- are identical. The increase in concentrations of ~ 0 ~ ~ - and C1- is clearly due to loss of snow in the depth hoar layer, indicating that these ions are conservative and not depleted during temperature-gradient metamorphism.
Photochemical Reactions and Gaseous Scavenging - Surface snow on the side drift and open tundra has notably high concentrations of NO3-. As these two locations are subje~t to the strongest surface winds, this may reflect pre-melt gaseous uptake of N by surface snow crystals, the rate of uptake being related to surface ventila- tion. An alternative explanation suggested by Duchesneau and Jones (1992) is that HN03 is produced from NO3 and OH radicals during photochemical reactions on sunny, warm (>-5°C) snow surfaces (ideal conditions existed for this). As the side drift and open tundra experience both the best exposure to sunlight and to wind, it is impossible to distinguish between the aerodynamic and photochemical mechan- isms for the increase in NO3- loading without further information.

J. W. Pomeroy et al.
Wind Transport of Snow andAerosols -The loadings of ~ 0 ~ ~ - and to a lesser extent H+ and NOs- scale linearly with the loading of snow in various landscape classes (see Table 2 and Fig. 3), suggesting that
1) the primary accumulation mechanisms for these ions are via falling snow or wind transport of blowing snow particles,
2) these ions are relatively conservative with respect to these mechanisms, and 3) bulk concentrations of these ions are relatively uniform in snow across the
region.
The sea-salt and ca2+ loadings, however, scale non-linearly with wind deposi- tion of snow, suggesting additional accumulation mechanisms. Pomeroy et al. (1991b) suggested that electrophoretic attraction of aerosols to blowing snow par- ticles may increase concentrations of the aerosol constituents in windblown snow. Wind deposition of aerosols is another pathway and is controlled by surface turbu- lence in manners similar to blowing snow accumulation (Cadle 1991).
The windblown forest and side drift snowpacks are dominated by windblown snow, however the aerosol-ion composition of these packs differs. The difference may be due to varying ion accumulation processes. If C1- and ca2+ are contributed when attached to blowing snow particles, then snow transported from the north (direction of ocean and aeolian sources) would have a greater aerosol component than snow transported from the south. The timing of blowing snow events with regard to atmospheric concentrations of aerosol may be important. The windblown forest receives its blowing snow from the north (as does the valley bottom site) and the side drift receives its blowing snow from the south, hence source area may explain differences in concentration. However, high concentrations of C1- and ca2+ in the sheltered forest cannot be explained by this mechanism.
Alternatively, aerosols contributed by dry deposition accumulate preferentially to aerodynamically rough surfaces. The quantity deposited is influenced by source area, wind direction and episodic concentrations. The sudden embankment of the side drift cannot accumulate sea-salt and soil aerosols (1-2 ym) as efficiently as it does blowing snow particles (40-100 ym) because the aerosols have lower fall velocities and a greater proportion of mass flux well above the surface. In contrast, the wind-blown and sheltered forests could receive similarly large fluxes of aerosol wind deposition because their roughness heights and fetches are large. Valley bottom vegetation does not fill with snow and hence would receive a higher season- al dry deposition than would the snowcovered open tundra. The dry deposition hypothesis could explain much of the relative enrichments and the concentration profiles in Figs. 3 and 4.
Dry deposition alone cannot explain why the concentrations of ca2+ and espe- cially C1- are higher in the windblown forest than in the sheltered forest however. Presuming that concentrations in excess of those on the open tundra are due solely to dry deposition to the sheltered forest and to either aerosol scavenging by blow-

Relocation of Major Ions in Snow
ing snow or dry deposition in the windblown forest, then the relative contribution of dry deposition and blowing snow scavenging may be assessed. Comparisons of C1- concentration along the centre stratum are appropriate for this assessment, as during its accumulation open tundra vegetation was mostly filled by snow, and hence was a poor collector of blowing snow or aerosols. Taking the percent differ- ence between forest and tundra centre concentrations, about 60 % of C1- enrich- ment is contributed by dry deposition to the windblown forest and 40 % by some blowing snow process, presumably electrophoretic scavenging by blowing snow particles.
Most ca2+ was deposited early in the winter (while the local source was still exposed) and is found in the depth hoar stratum. Exposed vegetation on the open tundra makes it a poor reference for depth hoar concentrations, but the side drift probably had a smooth snowcover and could not receive blowing snow from the source area. Taking the percent difference with the side drift, about 80 % of ca2+ enrichment is contributed by dry deposition to the windblown forest and 20 % by some blowing snow process. Most ca2+ deposition occurred very early in the winter when occurrence of blowing snow is impeded by exposed vegetation, hence the smaller contribution by blowing snow processes to ca2+ enrichment relative to C1- enrichment is not unexpected.
Conclusions
In regions prone to redistribution of snow, stratifying the accumulation and con- centration of major ions in snowcover by landscape units provides a useful method to describe the spatial variation in snow chemistry over a catchment and to extrapo- late from small-scale measurements to larger scales. North of Inuvik, NWT, the technique indicates that treeline forests can accumulate eight times more snow and ion than does the open tundra plateau. Enrichment, with respect to the tundra, of sea-salt and soil aerosols in these forests results in up to 25 greater loading than on the tundra. Valley side drifts can accumulate an even greater snow loading, about 12 times that of the tundra, but only six times the ion loading of tundra except for NO3-, ~ 0 ~ - ~ and H+ which nearly match or exceed the increase in snow accumu- lation. Hence, though winter ion deposition occurs primarily with the accumulation of windblown snow in this region, the loading of most ions does not scale exactly with that of snow. The exception to this rule is ~ 0 4 2 . - which has low rates of dry deposition and is conserved during over-winter metamorphism; the relative loading of so4!- can be described quite accurately by the relative loading of windblown snow.
Comparison of surface aerodynamic roughness, the vertical profiles of snowpack ion concentrations and snow physical properties suggested several mechanisms by which ion concentrations become relatively enriched or depleted in various land-

J . W Pomeroy et al.
scape units. Temperature-gradient metamorphism at the base of shallow snow- covers redistributed snow upward within the packs and may have removed small amounts of NO3-. Either photochemical reactions or gaseous scavenging incorpo- rated large amounts of NO3- to the surface of well-exposed snowcovers. Metamor- phic loss and surface accumulation resulted in a 50 % variation in NO3- concentra- tion over the landscape units. Dry deposition of aerosols to forested terrain and valley bottoms enriched sea-salt and ca2+ concentrations over two-fold with re- spect to smooth terrain, however scavenging of aerosols to blowing snow particles contributed an additional 40 % to the sea-salt enrichment and 20 % to the ca2+ enrichment in wind-blown treeline forests.
The results demonstrate that central measurements of seasonal snow chemistry in the Arctic cannot be reliably extrapolated either spatially or temporally without reference to compositional transformations by over-winter physical and chemical processes. However, the association of transformations resulting from these pro- cesses with readily identifiable Arctic landscapes suggests stratification by land- scape unit as a simple and robust method for spatial extrapolation. Further work to test the repeatability of the associations from year to year and to confirm the processes involved is recommended.
Acknowledgements
The gracious support of the Polar Continental Shelf Project, Energy, Mines and Resources Canada, the Inuvik Science Centre, Science Institute of the Northwest Territories, the Natural Sciences and Engineering Research Council and the Na- tional Hydrology Research Institute made this experiment possible. Ken Supeene and Kerry Peru of NHRI are thanked for their careful chemical analysis and Robert Reid, now of Indian and Northern Affairs Canada, is thanked for his assistance in difficult field conditions with field logistics, measurements and sample preparation.
References
Barrie, L.A. (1986) Arctic air pollution: an overview of current knowledge, Atmospheric Environment, Vol. 20(4), pp. 643-663.
Barrie, L.A., and Vet, R.J. (1982) Concentration and deposition of acidity, major ions:and trace metals in the snowpack of the eastern Canadian Shield, Atmospheric Environment, Vol. 12, pp. 1459-1469.
Cadle, S.H., Dasch, J.M., and Grossnickle, N.E. (1986) Wintertime wet and dry deposition in northern Michigan, Atmospheric Environment, Vol. 20(6), pp. 1171-1178.


J . W Pomeroy et al.
Pomeroy, J.W., Davies, T.D., and Tranter, M. (1991b) Relationships between snow chemistry and blowing snow: initial findings. In: Northern Hydrology: Selected Perspec- tives, T.D. Prowse and C.S.L. Ommanney (Editors), NHRI Symposium No. 6, Minister of Supply and Services Canada, Saskatoon, pp. 277-292.
Rahn, K.A., and McCaffrey, R.J. (1980) On the origin and transport of the winter Arctic aerosol, Annals of the New York Academy of Science, Vol. 338, pp. 486-503.
Reynolds, B. (1983) The chemical composition of snow at rural upland site in mid-Wales, Atmospheric Environment, Vol. 17(9), pp. 1849-1851.
Steppuhn, H., and Dyck, G.E. (1974) Estimating true basin snowcover. In: Advanced Concepts and Techniques in the Study of Snow and Ice Resources, National Academy of Sciences, Washington, D.C., pp. 304-313.
Sturm, M. (1991) The role of thermal convection in heat and mass transport in the subarctic snow cover. CRREL Report No. 91-19. US Army Cold Regions Research and Engineer- ing Laboratory, Hanover, NH, 84 p.
Timoney, K., Kershaw, G.P., and Olesen, D. (1992) Late winter snow-landscape relation- ships in the subarctic near Hoarfrost River, Great Slave Lake, Northwest Territories, Canada, Water Resources Research, Vol. 28(7), pp. 1991-1998.
Tranter, M., Brimblecombe, P., Davies, T.D., Vincent, C.E., Abrahams, P.W., and Black- wood, I. (1986) The composition of snowfall, snowpack and meltwater in the Scottish Highlands, evidence for preferential elution, Atmospheric Environment, Vol. 20(3), pp. 517-525.
Van Cleve, K., Oliver, L., Schlentner, R., Viereck, L.A., and Dryness, C.T. (1983) Pro- ductivity and nutrient cycling in taiga forest ecosystems, Canadian Journal of Forest Research, Vol. 13, pp. 747-766.
Woo, M., and Marsh, P. (1978) Analysis of error in the determination of snow storage for small high Arctic basins, Journal of Applied Meteorology, Vol. 17(10), pp. 1537-1541.
First received: 25 September, 1992 Revised version received: 19 February, 1993 Accepted: 22 February, 1993
Address: J. W. Pomeroy and P. Marsh National Hydrology Research Institute, 11 Innovation Blvd., Saskatoon, Sask., S7N 3H5 Canada.
L. Lesack, Department of Geography, Simon Fraser University, Burnaby, B.C., V5A IS6 Canada.


![Multisensor NDVI-Based Monitoring of the Tundra-Taiga ... · The TTI is interchangeably named tundra-taiga boundary, ecotone, zone or interface [48,49]. For this study, the TTI is](https://static.fdocuments.in/doc/165x107/5f0c62317e708231d435218c/multisensor-ndvi-based-monitoring-of-the-tundra-taiga-the-tti-is-interchangeably.jpg)


