Reliability Analysis of the Electrical Control System of Subsea Blowout … · Reliability Analysis...
9
Reliability Analysis of the Electrical Control System of Subsea Blowout Preventers Using Markov Models Zengkai Liu, Yonghong Liu*, Baoping Cai College of Mechanical and Electrical Engineering, China University of Petroleum, Qingdao, Shandong, China Abstract Reliability analysis of the electrical control system of a subsea blowout preventer (BOP) stack is carried out based on Markov method. For the subsea BOP electrical control system used in the current work, the 3-2-1-0 and 3-2-0 input voting schemes are available. The effects of the voting schemes on system performance are evaluated based on Markov models. In addition, the effects of failure rates of the modules and repair time on system reliability indices are also investigated. Citation: Liu Z, Liu Y, Cai B (2014) Reliability Analysis of the Electrical Control System of Subsea Blowout Preventers Using Markov Models. PLoS ONE 9(11): e113525. doi:10.1371/journal.pone.0113525 Editor: Miguel A. Fernandez, Universidad de Valladolid, Spain Received September 12, 2014; Accepted October 27, 2014; Published November 19, 2014 Copyright: ß 2014 Liu et al. This is an open-access article distributed under the terms of the Creative Commons Attribution License, which permits unrestricted use, distribution, and reproduction in any medium, provided the original author and source are credited. Data Availability: The authors confirm that all data underlying the findings are fully available without restriction. All relevant data are within the paper. Funding: The study was financially supported by the financial support of Open Fund of Key Laboratory of Oil & Gas Equipment, Ministry of Education (Southwest Petroleum University) (NO. OGE201403-24), National Natural Science Foundation of China (No. 51309240), Specialized Research Fund for the Doctoral Program of Higher Education (No. 20130133120007), Applied Basic Research Programs of Qingdao (NO. 14-2-4-68-jch), Science and Technology Project of Huangdao District (No. 2014-1-48), National High-Technology Research and Development Program of China (No. 2013AA09A220), and Incubation Program of Excellent Doctoral Dissertation of China University of Petroleum (No. 2013-4). The funders had no role in study design, data collection and analysis, decision to publish, or preparation of the manuscript. Competing Interests: The authors have declared that no competing interests exist. * Email: [email protected] Introduction During offshore drilling, a subsea blowout preventer (BOP) is attached to the wellhead to seal an open wellbore, close the annular portion of the well around the drill pipe or casing, or cut through the drill pipe and then seal the well. A typical BOP system can enable certain well pressure tests as well as the injection and removal of fluid from the well through its lines [1]. Devastating consequences could be caused by failures of subsea BOP systems, for example, the Deepwater Horizon accident in the Gulf of Mexico on April 20, 2010. Eleven crew members died in the accident, and oil gushed out of the damaged well for months, which became the worst environmental disaster in US history [2]. Hence, ensuring the reliable and safe operation of subsea BOPs is essential. A distributed control system is employed to develop the electrical control system of a subsea BOP stack based on triple modular redundancy [3]. The issue with reliability of subsea BOP systems is of significance, which is not studied extensively enough. Failure modes and effects analysis method has been adopted for reliability analysis of a BOP [4]. The fault trees of subsea BOP system are built by collecting the data about subsea BOP failures and malfunctions [5]. However, the two methods are only suitable for non-repair systems and time element is not included [6]. For reliability analysis, Markov models are widely used in various fields. Duan et al. [7] propose an arithmetic coding based on Markov model as a general tool for joint encryption and compression. Ellis et al. [8] present a new Markov model for packet loss that can more accurately describe the characteristics of residential broadband links, and quantify the effectiveness of this model. Karami-Horestani et al. [9] propose a reliability model for a static VAr compensator based on Markov process. Jiang et al. [10] propose a Markov model and corresponding methods in term of human factors and other relating factors. Guo and Yang [11] present a new method to automatically develop Markov models for reliability assessment of safety instrumented systems, consid- ering failure modes, self-diagnostic, restorations, common cause and voting. Lisnianski et al. [12] present a multi-state Markov model for a coal power generating unit and a technique for estimation of transition rates between the various generating capacity levels of the unit based on field observation. Tanrioven and Alam [13] present a method for reliability analysis of stand- alone PEM FCPPs using Markov model, which includes different states such as operation, derated, fully faulted or maintenance. Pil et al. [14] propose a Markov model to assess the reliability of reliquefaction systems for boil-off gas on LNG carriers with focus on redundancy optimization and maintenance strategies. Owing to its flexibility for modeling, Markov method has been used to evaluate the redundant systems. A Markov-based model is presented for evaluating the performance of subsea BOP stack configurations and mounting types for control pods [15]. Wang et al. [16] perform the Markov analysis to analyze the redundant and non-redundant building cooling, heating, and power system, where the failure rate, the repair rate, the availability and the MTBF are deduced. Mendes et al. [17] develop a Markov model to analyze the reliability and determine the optimal interval between inspections of redundant system subjected to periodic inspections. Li [18] studies a k-out-of-n: G repairable system with n identical machines and R repairmen using Markov model, considering the redundant dependency and the multiple vacations policy for repairmen. Azaron ea al. [19] introduce a new method, by using Markov model and shortest path technique, for the reliability assessment of an l-dissimilar-unit non-repairable cold- standby redundant system, where each unit consists of many PLOS ONE | www.plosone.org 1 November 2014 | Volume 9 | Issue 11 | e113525
Transcript of Reliability Analysis of the Electrical Control System of Subsea Blowout … · Reliability Analysis...

Reliability Analysis of the Electrical Control System ofSubsea Blowout Preventers Using Markov ModelsZengkai Liu, Yonghong Liu*, Baoping Cai
College of Mechanical and Electrical Engineering, China University of Petroleum, Qingdao, Shandong, China
Abstract
Reliability analysis of the electrical control system of a subsea blowout preventer (BOP) stack is carried out based on Markovmethod. For the subsea BOP electrical control system used in the current work, the 3-2-1-0 and 3-2-0 input voting schemesare available. The effects of the voting schemes on system performance are evaluated based on Markov models. In addition,the effects of failure rates of the modules and repair time on system reliability indices are also investigated.
Citation: Liu Z, Liu Y, Cai B (2014) Reliability Analysis of the Electrical Control System of Subsea Blowout Preventers Using Markov Models. PLoS ONE 9(11):e113525. doi:10.1371/journal.pone.0113525
Editor: Miguel A. Fernandez, Universidad de Valladolid, Spain
Received September 12, 2014; Accepted October 27, 2014; Published November 19, 2014
Copyright: � 2014 Liu et al. This is an open-access article distributed under the terms of the Creative Commons Attribution License, which permits unrestricteduse, distribution, and reproduction in any medium, provided the original author and source are credited.
Data Availability: The authors confirm that all data underlying the findings are fully available without restriction. All relevant data are within the paper.
Funding: The study was financially supported by the financial support of Open Fund of Key Laboratory of Oil & Gas Equipment, Ministry of Education (SouthwestPetroleum University) (NO. OGE201403-24), National Natural Science Foundation of China (No. 51309240), Specialized Research Fund for the Doctoral Program ofHigher Education (No. 20130133120007), Applied Basic Research Programs of Qingdao (NO. 14-2-4-68-jch), Science and Technology Project of Huangdao District(No. 2014-1-48), National High-Technology Research and Development Program of China (No. 2013AA09A220), and Incubation Program of Excellent DoctoralDissertation of China University of Petroleum (No. 2013-4). The funders had no role in study design, data collection and analysis, decision to publish, orpreparation of the manuscript.
Competing Interests: The authors have declared that no competing interests exist.
* Email: [email protected]
Introduction
During offshore drilling, a subsea blowout preventer (BOP) is
attached to the wellhead to seal an open wellbore, close the
annular portion of the well around the drill pipe or casing, or cut
through the drill pipe and then seal the well. A typical BOP system
can enable certain well pressure tests as well as the injection and
removal of fluid from the well through its lines [1]. Devastating
consequences could be caused by failures of subsea BOP systems,
for example, the Deepwater Horizon accident in the Gulf of
Mexico on April 20, 2010. Eleven crew members died in the
accident, and oil gushed out of the damaged well for months,
which became the worst environmental disaster in US history [2].
Hence, ensuring the reliable and safe operation of subsea BOPs is
essential. A distributed control system is employed to develop the
electrical control system of a subsea BOP stack based on triple
modular redundancy [3].
The issue with reliability of subsea BOP systems is of
significance, which is not studied extensively enough. Failure
modes and effects analysis method has been adopted for reliability
analysis of a BOP [4]. The fault trees of subsea BOP system are
built by collecting the data about subsea BOP failures and
malfunctions [5]. However, the two methods are only suitable for
non-repair systems and time element is not included [6]. For
reliability analysis, Markov models are widely used in various
fields. Duan et al. [7] propose an arithmetic coding based on
Markov model as a general tool for joint encryption and
compression. Ellis et al. [8] present a new Markov model for
packet loss that can more accurately describe the characteristics of
residential broadband links, and quantify the effectiveness of this
model. Karami-Horestani et al. [9] propose a reliability model for
a static VAr compensator based on Markov process. Jiang et al.
[10] propose a Markov model and corresponding methods in term
of human factors and other relating factors. Guo and Yang [11]
present a new method to automatically develop Markov models
for reliability assessment of safety instrumented systems, consid-
ering failure modes, self-diagnostic, restorations, common cause
and voting. Lisnianski et al. [12] present a multi-state Markov
model for a coal power generating unit and a technique for
estimation of transition rates between the various generating
capacity levels of the unit based on field observation. Tanrioven
and Alam [13] present a method for reliability analysis of stand-
alone PEM FCPPs using Markov model, which includes different
states such as operation, derated, fully faulted or maintenance. Pil
et al. [14] propose a Markov model to assess the reliability of
reliquefaction systems for boil-off gas on LNG carriers with focus
on redundancy optimization and maintenance strategies.
Owing to its flexibility for modeling, Markov method has been
used to evaluate the redundant systems. A Markov-based model is
presented for evaluating the performance of subsea BOP stack
configurations and mounting types for control pods [15]. Wang et
al. [16] perform the Markov analysis to analyze the redundant and
non-redundant building cooling, heating, and power system,
where the failure rate, the repair rate, the availability and the
MTBF are deduced. Mendes et al. [17] develop a Markov model
to analyze the reliability and determine the optimal interval
between inspections of redundant system subjected to periodic
inspections. Li [18] studies a k-out-of-n: G repairable system with
n identical machines and R repairmen using Markov model,
considering the redundant dependency and the multiple vacations
policy for repairmen. Azaron ea al. [19] introduce a new method,
by using Markov model and shortest path technique, for the
reliability assessment of an l-dissimilar-unit non-repairable cold-
standby redundant system, where each unit consists of many
PLOS ONE | www.plosone.org 1 November 2014 | Volume 9 | Issue 11 | e113525

independent units arranged in any general configuration. Yu et al.
[20] model the redundant dependency by embedding the
dependence function into Markov models, describing a redundant
system with dependent components.
The electrical control system of subsea BOP system is also a
redundant system. In order to take into account the effects of
different input voting schemes on system reliability indices, this
paper develops Markov models for evaluation of the electrical
control systems. A sensitivity analysis is performed to determine
the influences of failure rates. The paper is structured as follows.
Section 2 describes a subsea BOP electrical control system in
detail. Section 3 presents the Markov models and analysis methods
for the two input voting schemes. Section 4 delves into the effects
of input voting schemes and variances of failure rates for each
module. Section 5 summarizes the paper.
System Description
Fault tolerance technique is widely utilized in subsea BOP
systems in order to improve reliability. The fault tolerant system
has a redundancy, whereby minor faults can occur without halting
normal operation [21]. For a typical subsea BOP stack, two
annular BOPs and four ram BOPs are used [22]. A triple modular
redundancy control system is developed to control a subsea BOP
stack. The electrical control system mainly consists of a central
control unit (CCU), a connecting umbilical cable, and subsea
components, as shown in Figure 1. CCU is the central control
point for controlling and monitoring system functions and
communications. It has two main control panels, namely, Driller’s
panel and Toolpusher’s panel. They can control all the functions
of the subsea BOP system, which display push buttons designed to
mimic the BOP stack and other functions. The Driller’s panel is
mounted by the driller on the rig floor for convenient access,
whereas the Toolpusher’s panel is located in a non-hazardous area
away from the drill floor [23]. They are mainly industrial
computers with equal functionality.
Two control pods are above the BOP stack, affording
redundant control of subsea functions. Each pod contains a
subsea electrical module (SEM), which is contained in domed
containers made of thick steel under external water pressure [24].
One of the pods is functional, whereas the other one acts as a
warm standby. Two complete independent subsea umbilical
cables, including optical fibers and electrical wires, are used to
transmit signals and electric power from the surface to the SEMs
[25]. Fiber optic repeaters are used for transforming electrical and
optical signals.
A redundancy technique is applied to develop the system in
order to form a highly reliable electrical control system. The SEMs
contain processor modules, input modules, and output modules, as
well as other secondary components. Three processors are used to
form a processor subsystem. Each processor runs the same
application programs, processing data and sending command
signals. The processor subsystem performs 2 out 3 voting, which
means the system can hence detect and correct a single failure.
The input and output modules are connected to three processors
via three independent field buses. Output voting is performed in
the H-module group, which is composed of two source output
modules (A and B) and two sink modules (C and D). The source
modules are connected in parallel on one side of the load, whereas
the sink modules are connected in parallel on the other side.
Module D is dependent on module A and module B and its logic is
D~A&B. Therefore, modules A, B and C form a 2 out of 3 voting
system. Data from the processors are voted in the H-module
group, where one fault of the three modules can be masked.
Compared with output voting, input voting is accomplished by
programs in the processors. Two input voting schemes adopted in
this work, namely, the 3-2-1-0 scheme and the 3-2-0 scheme, are
used to deal with failures in the modules. Aside from the input
values, the configured Duplex and Default values may also be used
to determine the final voted results. The Duplex value is used
when only two input modules survive. It may be configured as any
value according to the need in the field. The Default value will be
provided directly to the application programs instead of a voted
result; it may be configured as the last input value, or a specific
value. For both schemes, when all three input values are available,
the software performs two out of three voting runs, whereby the
Duplex and Default values are not used. If any of the three input
values are not available, the software will employ the configured
Duplex value for performing two out of three voting runs, in order
to replace the unavailable actual input. Configuration of the
Duplex State value has to be in accordance with particular
systems. The two input voting schemes have different ways to cope
when two input modules fail. In the 3-2-0 input voting scheme, the
Default value is applied to replace the remaining actual input
value; however, the available input value will be the final result
without voting in the 3-2-1-0 scheme. Thus, if two or more
modules are not available, the electrical control system will fail in
the 3-2-0 voting scheme. Unless all three input modules are
unavailable, the system fails in the 3-2-1-0 voting scheme.
Therefore, the main difference is that 3-2-0 voting scheme only
can bear one fault and 3-2-1-0 scheme can bear two faults.
Table 1 illustrates how the two voting schemes work, where the
Duplex State and Default State are set as 0. ‘-’ means the input is
unavailable and it will be replaced by the configured Duplex State
value for voting.
System Modeling and Analysis
System modelingAlthough two different input voting schemes are available, the
effects of different schemes on the reliability of the electrical
control system are unknown. Therefore, a quantitative analysis
about this issue is necessary. For the electrical control system of
subsea BOPs, only control panels, processor modules, input
modules, and output modules are covered in this paper; other
secondary components of the system are considered completely
reliable. If the surface components, namely, control panels fail,
they will be repaired immediately without removing the BOP
system from the water. The subsea components, namely input
modules, output modules and processors will be pulled to the
surface and repaired when the control system cannot work due to
their failures.
The state transition diagrams of the 3-2-1-0 and 3-2-0 input
voting schemes are shown in Figure 2 and Figure 3, respectively.
These schemes adhere to the input voting principle described in
Section 2. In the figures, circles represent states, and directed arcs
represent transitions caused by failures or repairs. A total of 25
states, denoted by S00-S24, are numbered in sequence in
Figure. 2. The four digits below the state in the circle denote the
number of the processors, input modules, control panels and
output modules in normal operation, respectively. For example,
the system starts with the perfect state, S00 and ‘‘3323’’means 3
processors, 3 input modules, 2 control panels and 3 output
modules work normally. In this state, when any failure occurs in
the modules, the system moves to another state. The degrading
states, S01 to S23, indicate continued performance of the system
despite ongoing failures. In S02, for example, ‘‘3313’’ means only
one control panel works, as the other one has failed and is being
Reliability Analysis of the Electrical Control System of Subsea BOP
PLOS ONE | www.plosone.org 2 November 2014 | Volume 9 | Issue 11 | e113525

repaired, whereas the other modules are operating as expected. At
this time, the system has tolerated a fault and is still viable.
However, if another failure occurs in the working control panel,
the control system will move from state S02 to state S24, which is
the hazardous state. This state denotes that the control system is
unavailable for users. According to the memoryless property of
Markov model, the lifetime of components and repair time follow
exponential distributions. The corresponding transition rate is
marked on the directed arc form one state to another state. For
example, 3lp is the transition rate from state S00 to S01. The
definitions of transition rates and the values are listed in Table 2.
For the sake of simplicity, repair rates of all the components are
defined as u.
Model analysisIn this section, the method to perform model analysis is
proposed. The analysis process of the model for the 3-2-1-0 voting
scheme is illustrated in detail as follows. The transition matrix of
the model for 3-2-1-0 voting scheme are shown in Eq. (1), which is
represented in simple forms.
Figure 1. Architecture of subsea BOP electrical control system.doi:10.1371/journal.pone.0113525.g001
Table 1. Voted results for the two schemes.
Input A Input B Input C Voted results (3-2-1-0) Voted results (3-2-0)
1 1 1 1 1
1 1 0 1 1
1 0 0 0 0
0 0 0 0 0
1 1 - 1 1
1 0 - 0 0
0 0 - 0 0
- - 1 1 0
- - 0 0 0
- - - 0 0
doi:10.1371/journal.pone.0113525.t001
Reliability Analysis of the Electrical Control System of Subsea BOP
PLOS ONE | www.plosone.org 3 November 2014 | Volume 9 | Issue 11 | e113525

Figure 2. Markov model for 3-2-1-0 input voting scheme.doi:10.1371/journal.pone.0113525.g002
Figure 3. Markov model for 3-2-0 input voting scheme.doi:10.1371/journal.pone.0113525.g003
Reliability Analysis of the Electrical Control System of Subsea BOP
PLOS ONE | www.plosone.org 4 November 2014 | Volume 9 | Issue 11 | e113525

Q3210~
a0000 a0001::: 0 0
a0100 a0101 � � � 0 0
..
. ... ..
. ... ..
.
a2300 0 � � � a2323 a2324
a2400 0 � � � 0 a2424
266666664
377777775
ð1Þ
In the matrixes, element aij(i=j) is the transition rate from state
i to state j. Specially, the diagonal element aii is obtained as
follows:
aii~{Xr
j~0j=i
aij ð2Þ
For example, a00~{(a0001za0002za0004za0005)~{(3lpz
3liz2lcz3lo).Availability and steady-state availability. Availability is
defined as the probability that the system is performing its required
function at a given time. No operational time interval is involved.
If the system is operational, it is available. History does not matter,
that is, whether it has failed in the past and has been repaired or
has been operating continuously without failure [26]. Pi(t) is the
occupation probability of state i at time t. It can be calculate by
Eq. (3).
fP0(t),P0(t), � � � ,P24(t)gQ3210~f _PP0(t), _PP0(t), � � � , _PP24(t)gP24i~0 Pi(t)~1
P0(0)~1
8><>:
ð3Þ
where P0(0)~1 means that the system starts from state 0 at time
0. For the model of 3-2-1-0 voting scheme, only state S24 is
unavailable for users. Therefore, the transient availability is given
by
A(t)~X23
i~0
Pi(t),i[E: ð4Þ
The steady-state availability is defined as:
Ast~ limt??
A(t) ð5Þ
Reliability. Reliability describes the ability of a system or
component to perform its required functions under stated
conditions for a specified period of time [0, t]. No failures are
allowed for an entire time interval. It is a function of failure
probabilities and operating time interval. Therefore, to obtain the
reliability of repairable systems, the transition arcs related to
repairs after failures have to be omitted when to calculate the
reliability. The transition matrix Q0
3210 for reliability is obtained:
Table 2. Definition of transition rates.
Notation Description Values/h-1
lp Failure rate of a processor module 1.820e-5
li Failure rate of an input module 9.798e-6
lc Failure rate of a control panel 3.152e-5
lo Failure rate of an input module 9.780e-6
u Repair rate 1.388e-2
doi:10.1371/journal.pone.0113525.t002
Figure 4. Availability of the systems in two input votingschemes.doi:10.1371/journal.pone.0113525.g004
Figure 5. Effects of the failure rate of input module on steady-state availability in two schemes.doi:10.1371/journal.pone.0113525.g005
Reliability Analysis of the Electrical Control System of Subsea BOP
PLOS ONE | www.plosone.org 5 November 2014 | Volume 9 | Issue 11 | e113525
Q03210~
a0000 a0001 � � � 0 0
0 a0101 � � � 0 0
..
. ... ..
. ... ..
.
0 0 � � � a2323 a2324
0 0 � � � 0 a2424
266666664
377777775
ð6Þ
Q3210 is replaced by Q0
3210 in Eq. (3) and reliability can be
calculated by
R(t)~X23
i~0
Pi(t),i[E: ð7Þ
MTTF. Mean time to failure (MTTF) is an important
reliability index for the system. It is defined as the mean time to
the first system failure, when the system starts from the fully
functioning state. The specific steps for calculating MTTF of 3-2-
1-0 voting scheme are as follows [26]:
(1) P(t)~½P0(t),P1(t),:::,P24(t)� denotes the vector of state
occupation probabilities at time t. The initial condition is
P(0)~½1,0, � � � ,0� and it means that the system is in normal
operation. The system will fail when it enters into state 24, which
are defined as the absorbing states. Deleting the related elements
of the absorbing states in transition matrix, the QR3210 can be
obtained:
QR3210~
a0000 a0001 � � � a0022 a0023
0 a0101 � � � a0122 a0123
..
. ... ..
. ... ..
.
0 a2201 � � � a2222 a2223
0 a2301 � � � a2322 a2323
266666664
377777775
ð8Þ
(2) P�(s)~½P0�(s),P1
�(s),:::,P24�(s)� is defined as the Laplace
transform of P(t). Hence, Eq. (9) is derived.
½P0�(0), � � � ,P23
�(0)�QR~½0, � � � ,0,{1� ð9Þ
Figure 6. Effects of the failure rate of output module on steady-state availability in two schemes.doi:10.1371/journal.pone.0113525.g006
Figure 7. Effects of the failure rate of processor module onsteady-state availability in two schemes.doi:10.1371/journal.pone.0113525.g007
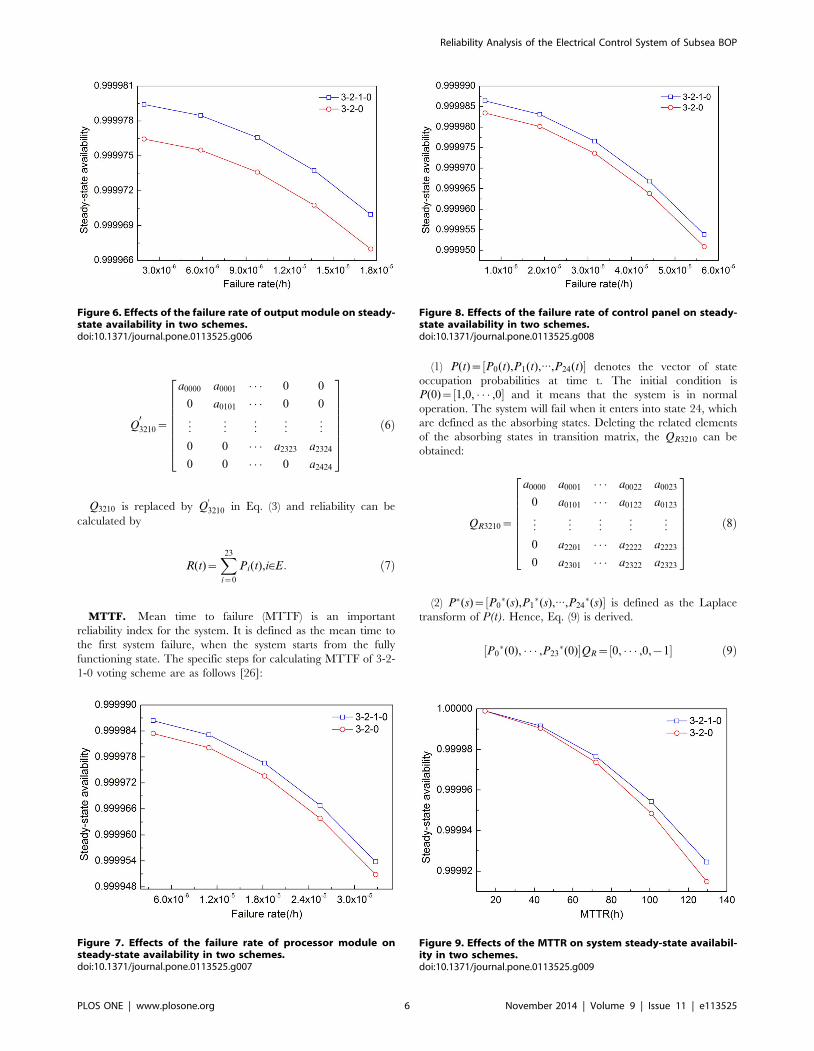
Figure 8. Effects of the failure rate of control panel on steady-state availability in two schemes.doi:10.1371/journal.pone.0113525.g008
Figure 9. Effects of the MTTR on system steady-state availabil-ity in two schemes.doi:10.1371/journal.pone.0113525.g009
Reliability Analysis of the Electrical Control System of Subsea BOP
PLOS ONE | www.plosone.org 6 November 2014 | Volume 9 | Issue 11 | e113525

(3) Finally, the equation to compute MTTF is
MTTF~X23
i~0Pi�(0) ð10Þ
Results and Discussion
AvailabilityBy solving the Chapman-Kolmogorov Eq.(3), availability of the
system with two input voting schemes can be obtained by Eq. (4),
which is shown in Figure 4. It shows that availability decreases
quickly in the first hundred hours and reaches steady-state values
in about seven hundred hours. The 3-2-1-0 voting scheme has
higher availability than 3-2-0 voting scheme.
Steady-state availabilityFigures 5–8 illustrates the effects of modules’ failure rates on the
steady-state availability of the system in the two input voting
schemes adopted in this work. With the same failure rate value,
steady-state availability in the 3-2-0 input voting scheme is lower
than that in the 3-2-1-0 voting scheme. As shown in Figure 5,
steady-state availability decreases slowly in the 3-2-1-0 scheme, but
rapidly in the 3-2-0 scheme, as input module failure rate increases.
Hence, steady-state availability of the system is more sensitive to
the input module in the 3-2-0 scheme compared with the 3-2-1-0
scheme. For other modules shown in Figures 6–8, the variation
trends of steady-state availability in these two schemes are similarly
connected with sensitivity. As the failure rates increase, the steady-
state availability decreases.
Mean time to repair (MTTR) is the average time required to
repair a failed component or system. The reciprocal of repair rate
m is MTTR. As availability is related to repairs, the effects of
MTTR change on system availability are plotted in Figure 9.
MTTR varies by 20% to 180% of the original value in this paper.
Figure 9 shows that the steady-state availability decreases as
MTTR increases for both schemes. However, the 3-2-0 voting
scheme is more sensitive to MTTR change, which indicates that
the availability of the 3-2-0 scheme is more easily influenced by
MTTR than that of the 3-2-1-0 scheme.
Figure 10. Reliability of the systems in two input votingschemes.doi:10.1371/journal.pone.0113525.g010
Figure 11. Effects of the failure rate of input module on MTTFin the two schemes.doi:10.1371/journal.pone.0113525.g011
Figure 12. Effects of the failure rate of output module on MTTFin the two schemes.doi:10.1371/journal.pone.0113525.g012
Figure 13. Effects of the failure rate of processor module onMTTF in the two schemes.doi:10.1371/journal.pone.0113525.g013
Reliability Analysis of the Electrical Control System of Subsea BOP
PLOS ONE | www.plosone.org 7 November 2014 | Volume 9 | Issue 11 | e113525

ReliabilityBased on Eqs. (3) and (7), reliability of the system with two input
voting schemes is shown in Figure 10. It shows that reliability
decreases over time and reliability of 3-2-0 input voting scheme
decreases more quickly than that of 3-2-1-0 scheme. The 3-2-1-0
voting scheme has higher reliability than 3-2-0 voting scheme.
MTTFBy solving Eqs. (8)–(10), MTTF can be obtained. Figures 11–14
illustrate the effects of modules’ failure rates on MTTF of the
system in the two input voting schemes adopted in this work. With
the same failure rate value, MTTF in the 3-2-0 input voting
scheme is lower than that in the 3-2-1-0 voting scheme. For the
input module, as shown in Figure 11, MTTF decreases more
rapidly in the 3-2-0 voting scheme as the failure rate rises. Input
voting schemes greatly affects MTTF of the system with high
failure rate of input module. For the other components, MTTF
decreases in both schemes as the failure rates increase. Figure 13
and 14 show that the processor module and control panel module
have similar influences on MTTF of the system in both schemes.
Conclusions
This paper presents Markov models for the reliability analysis of
subsea BOP electrical control systems. The effects of the 3-2-1-0
and 3-2-0 input voting schemes on reliability indices of the system
are examined. In addition, the effects of failure rates of modules
and repair time on system performance are also presented.
(1) Compared with the 3-2-0 input voting scheme, the 3-2-1-0
input voting scheme has higher availability and reliability.
From the aspect of high reliability, the 3-2-1-0 scheme is
recommended for use.
(2) For the both input voting schemes, the input module has the
most different influence on system steady-state availability and
MTTF. Processor module and control panel have similar
influences on system performance with the two schemes. If the
3-2-1-0 voting scheme is applied, the input module will affect
the system performance most slightly compared with the other
modules.
(3) The steady-state availability of the system decreases as MTTR
increases. The 3-2-0 voting scheme is more sensitive to the
change of MTTR than the 3-2-1-0 scheme. Therefore, if
MTTR is reduced, the availability of the 3-2-0 scheme can
obviously increase.
Acknowledgments
The authors would like to thank Ting Ma from Xi’an Jiaotong University
and the anonymous reviewer whose constructive comments were very
helpful for strengthening the presentation of this paper.
Author Contributions
Conceived and designed the experiments: ZKL. Performed the experi-
ments: YHL BPC. Analyzed the data: ZKL BPC. Wrote the paper: ZKL.
References
1. (2011) Committee for Analysis of Causes of the Deepwater Horizon Explosion,
Fire, and Oil Spill to Identify Measures to Prevent Similar Accidents to the
Future; National Academy of Engineering and National Research Council.
Macondo Well-Deepwater Horizon Blowout: Lessons for Improving Offshore
Drilling Safety. Washington, DC: The National Academics Press.
2. Harlow WF, Brantley BC, Harlow RM (2011) BP initial image repair strategies
after the Deepwater Horizon spill. Public Rela Rev 37: 80–83.
3. Cai BP, Liu YH, Liu ZK, Wang F, Tian XJ, et al. (2012) Development of an
automatic subsea blowout preventer stack control system using PLC based
SCADA. ISA Trans 51: 198–207.
4. Fowler JH, Roche JR (1994) System safety analysis of well-control equipment.
SPE Drill Complet 3: 193–198.
5. Holand P, Awan H (2012) Reliability of deepwater subsea BOP systems and well
kicks. Report no. ES 201252/02.
6. Bucci P, Kirschenbaum J, Mangan LA (2008) Construction of event-tree/fault-
tree models from a Markov approach to dynamic system reliability. Reliab Eng
Syst Saf 93: 1616–27.
7. Duan L, Liao X, Xiang T (2011) A secure arithmetic coding based on Markov
model. Comm Nonlinear Sci Numer Simul 16: 2554–2562.
8. Ellis M, Pezaros DP, Kypraios T, Perkins C (2014) A two-level Markov model
for packet loss in UDP/IP-based real-time video applications targeting
residential users. Comput Networks 70: 384–399.
9. Karami-Horestani A, Hamedani GME, Hajian-Hoseinabadi H (2014) Reliabil-
ity modeling of TCR-FC type SVC using Markov process. Int J Electr Power
Energy Syst 55: 305–311.
10. Jiang J, Zhang L, Wang Y, Peng Y, Zhang K, et al. (2011) Markov reliability
model research of monitoring process in digital main control room of nuclear
power plant. Saf Sci 49: 843–851.
11. Guo H, Yang X. (2008) Automatic creation of Markov models for reliability
assessment of safety instrumented systems. Reliab Eng Syst Saf 93: 829–837.
12. Lisnianski A, Elmakias D, Laredo D, Haim HB (2012) A multi-state Markov
model for a short-term reliability analysis of a power generating unit. Reliab Eng
Syst Saf 98: 1–6.
13. Tanrioven M, Alam MS (2006) Reliability modelling and analysis of stand-alone
PEM fuel cell power plants. Renew Energy 31: 915–933.
14. Pil CK, Rausand M, Vatn J (2008) Reliability assessment of reliquefaction
systems on LNG carriers. Reliab Eng Syst Saf 93: 1345–1353.
15. Cai BP, Liu YH, Liu ZK, Tian XJ, Zhang YZ, et al. (2012) Performance
evaluation of subsea blowout preventer systems with common-cause failures.
J Pet Sci Eng 90–91: 18–25.
16. Wang JJ, Fu C, Yang K, Zhang XT, Shi G, et al. (2013) Reliability and
availability analysis of redundant BCHP(building cooling, heating and power)
system. Energy 61: 531–540.
17. Mendes AA, Coit DW, Ribeiro JLD (2014) Establishment of the optimal time
interval between periodic inspections for redundant systems. Reliab Eng Syst Saf
131: 148–165.
18. Yuan L (2012) Reliability analysis for a k-out-of-n:G system with redundant
dependency and repairmen having multiple vacations. Appl Math Comput 218:
11959–11969.
19. Azaron A, Katagiri H, Kato K, Sakawa M (2006) Reliability evaluation of multi-
component cold-standby redundant systems. Appl Math Comput 173: 137–149.
20. Yu H, Chu C, Chatelet E, Yalaoui F (2007) Reliability optimization of a
redundant system with failure dependencies. Reliab Eng Syst Saf 92: 1627–
1634.
21. Kim H, Lee H, Lee K (2005) The design and analysis of AVTMR (all voting
triple modular redundancy) and dual-duplex system. Reliab Eng Syst Saf 88:
291–300.
Figure 14. Effects of the failure rate of control panel on MTTFin the two schemes.doi:10.1371/journal.pone.0113525.g014
Reliability Analysis of the Electrical Control System of Subsea BOP
PLOS ONE | www.plosone.org 8 November 2014 | Volume 9 | Issue 11 | e113525

22. Fougere P, Roche JR (1997) Multiplex BOP system utilizes updated technology,
decreases riser disconnect time. Oil Gas J 95: 90–94.23. (2004) API 16D. Specification for control systems for drilling well control
equipment and control systems for diverter equipment, 2nd ed. Washington,
DC: API.24. Shanks E, Dykes A, Quilici M, Pruitt J (2003) Deepwater BOP Control System-
A Look at Reliability Issues. Offshore Technology Conference, pp. 1–10.
25. Childers MA, Buckley MP, Curtiss J (2004) Fast response retrofitable ultra
deepawater BOP control system. IADC/SPE Drilling Conference, Dallas,
Texas, USA.
26. Rausand M, Hoyland A (2003) System reliability theory: Models, Statistical
methods, and applications, 2nd ed., Wiley.
Reliability Analysis of the Electrical Control System of Subsea BOP
PLOS ONE | www.plosone.org 9 November 2014 | Volume 9 | Issue 11 | e113525