Reliability analysis of low-cost, full-scale domestic ... · Reliability analysis of low-cost,...
9
Reliability analysis of low-cost, full-scale domestic wastewater treatment plants for reuse in aquaculture and agriculture Michael P. Alderson a,1 , André B. dos Santos b , Cesar R. Mota Filho a, 2, * a Newcastle University, School of Civil Engineering of Geosciences, Newcastle upon Tyne, United Kingdom b Universidade Federal do Ceará, Department of Hydraulic and Environmental Engineering, Fortaleza, Ceará, Brazil A R T I C L E I N F O Article history: Received 31 July 2014 Received in revised form 20 March 2015 Accepted 10 April 2015 Available online xxx Keywords: Wastewater reuse Wastewater treatment Aquaculture Irrigation Reliability A B S T R A C T The current paper assesses the reliability coefficients of fifty six low-cost, full-scale wastewater treatment plants, including nine different treatment technologies for wastewater reuse in aquaculture and agriculture in northeast Brazil. This was carried out with the aim to evaluate alternatives for sustainable wastewater reuse in communities experiencing water scarcity. The technologies evaluated include septic tanks (ST); septic tanks + anaerobic filters (ST + AF); septic tanks + anaerobic filters + chlorination (ST + AF + Cl); facultative ponds (FP); facultative + maturation ponds (FP + MP); anaerobic + facultative + maturation ponds (AP + FP + MP); facultative aerated ponds + facultative + maturation ponds (FAP + FP + MP); upflow anaerobic sludge blanket reactors (UASB); and upflow anaerobic sludge blanket reactors + chlorination (UASB + Cl). The parameters used for the analysis include chemical oxygen demand, total suspended solids, Escherichia coli and biochemical oxygen demand. By applying an 80% reliability level for standard compliance, the study aimed at presenting relevant, realistic and achievable targets for the evaluated parameters. Discharge limits for agriculture and aquaculture were obtained from a compilation of international and Brazilian guidelines. Performance data showed, in some cases, great variability among wastewater treatment plants of the same type, highlighting the importance of good management and operation. The technologies that presented the highest reliability for wastewater reuse were AP + FP + MP systems (waste stabilization ponds), followed by ST + AF + Cl and FAP + FP + MP. UASB and UASB + Cl performed similarly to ST + AF systems whilst the worst performances were observed for ST, FP + MP and FP. Results have shown that low-cost, full scale wastewater treatment plants are able to provide a suitable effluent for wastewater reuse in agriculture and aquaculture when an 80% reliability standard is applied. ã 2015 Elsevier B.V. All rights reserved. 1. Introduction It is estimated that over 50% of the world’s population will suffer water shortages in the next 30 years (Postel, 1997; United Nations Environment Programme, 2002; Hunt, 2003). The areas which will be worst affected are those found in the developing world, thus affecting mostly countries with fragile and susceptible socio-economic conditions, presenting significant levels of poverty (Hinrichsen et al., 1998). Currently, over half the world’s rivers, lakes and coastal waters are heavily contaminated with untreated industrial, domestic and agricultural wastewater (United Nations Environment Programme, 2002), presenting high numbers of faecal bacteria (Ceballos et al., 2003) and imposing an unprecedented burden of excreta related- disease upon the poorest populations (Mara, 2003). Furthermore, the pressure exerted by agriculture – which consumes around 70% of the water available globally (FAO, 2009) – in conjunction with other industrial activities and high population growth in develop- ing countries, calls for a more sustainable and ecological approach to the management of the global water abstraction. Wastewater is produced throughout the year and contains nutrients necessary for * Corresponding author at: Newcastle University, School of Civil Engineering and Geosciences, Cassie Building, Room 1.06, Newcastle upon Tyne NE1 7RU, United Kingdom. Tel.: +44 191 2226406; fax: +44 191 2226502. E-mail addresses: [email protected] (M.P. Alderson), [email protected] (A.B. dos Santos), [email protected] (C.R. Mota Filho). 1 Current address: EcoSwell, Granville Court, NE2 1TR, Newcastle upon Tyne, United Kingdom. 2 Current address: Universidade Federal de Minas Gerais, Department of Sanitary and Environmental Engineering, Av. Antônio Carlos, 6.627, Bloco 1 – Sala 4529, CEP 31270-901 Belo Horizonte, Minas Gerais, Brazil. http://dx.doi.org/10.1016/j.ecoleng.2015.04.081 0925-8574/ ã 2015 Elsevier B.V. All rights reserved. Ecological Engineering 82 (2015) 6–14 Contents lists available at ScienceDirect Ecological Engineering journal homepage: www.elsevier.com/locate/ecoleng
-
Upload
truongtuong -
Category
Documents
-
view
222 -
download
2
Transcript of Reliability analysis of low-cost, full-scale domestic ... · Reliability analysis of low-cost,...

Ecological Engineering 82 (2015) 6–14
Reliability analysis of low-cost, full-scale domestic wastewatertreatment plants for reuse in aquaculture and agriculture
Michael P. Alderson a,1, André B. dos Santos b, Cesar R. Mota Filho a,2,*aNewcastle University, School of Civil Engineering of Geosciences, Newcastle upon Tyne, United KingdombUniversidade Federal do Ceará, Department of Hydraulic and Environmental Engineering, Fortaleza, Ceará, Brazil
A R T I C L E I N F O
Article history:Received 31 July 2014Received in revised form 20 March 2015Accepted 10 April 2015Available online xxx
Keywords:Wastewater reuseWastewater treatmentAquacultureIrrigationReliability
A B S T R A C T
The current paper assesses the reliability coefficients of fifty six low-cost, full-scale wastewatertreatment plants, including nine different treatment technologies for wastewater reuse in aquacultureand agriculture in northeast Brazil. This was carried out with the aim to evaluate alternatives forsustainable wastewater reuse in communities experiencing water scarcity. The technologies evaluatedinclude septic tanks (ST); septic tanks + anaerobic filters (ST + AF); septic tanks + anaerobic filters +chlorination (ST + AF + Cl); facultative ponds (FP); facultative + maturation ponds (FP + MP); anaerobic +facultative + maturation ponds (AP + FP + MP); facultative aerated ponds + facultative + maturation ponds(FAP + FP + MP); upflow anaerobic sludge blanket reactors (UASB); and upflow anaerobic sludge blanketreactors + chlorination (UASB + Cl). The parameters used for the analysis include chemical oxygendemand, total suspended solids, Escherichia coli and biochemical oxygen demand. By applying an 80%reliability level for standard compliance, the study aimed at presenting relevant, realistic and achievabletargets for the evaluated parameters. Discharge limits for agriculture and aquaculture were obtainedfrom a compilation of international and Brazilian guidelines. Performance data showed, in some cases,great variability among wastewater treatment plants of the same type, highlighting the importance ofgood management and operation. The technologies that presented the highest reliability for wastewaterreuse were AP + FP + MP systems (waste stabilization ponds), followed by ST + AF + Cl and FAP + FP + MP.UASB and UASB + Cl performed similarly to ST + AF systems whilst the worst performances were observedfor ST, FP + MP and FP. Results have shown that low-cost, full scale wastewater treatment plants are ableto provide a suitable effluent for wastewater reuse in agriculture and aquaculture when an 80% reliabilitystandard is applied.
ã 2015 Elsevier B.V. All rights reserved.
Contents lists available at ScienceDirect
Ecological Engineering
journal homepage: www.elsevier .com/ locate /ecoleng
1. Introduction
It is estimated that over 50% of the world’s population willsuffer water shortages in the next 30 years (Postel, 1997; UnitedNations Environment Programme, 2002; Hunt, 2003). The areas
* Corresponding author at: Newcastle University, School of Civil Engineering andGeosciences, Cassie Building, Room 1.06, Newcastle upon Tyne NE1 7RU, UnitedKingdom. Tel.: +44 191 2226406; fax: +44 191 2226502.
E-mail addresses: [email protected] (M.P. Alderson),[email protected] (A.B. dos Santos), [email protected] (C.R. Mota Filho).
1 Current address: EcoSwell, Granville Court, NE2 1TR, Newcastle upon Tyne,United Kingdom.
2 Current address: Universidade Federal de Minas Gerais, Department of Sanitaryand Environmental Engineering, Av. Antônio Carlos, 6.627, Bloco 1 – Sala 4529, CEP31270-901 Belo Horizonte, Minas Gerais, Brazil.
http://dx.doi.org/10.1016/j.ecoleng.2015.04.0810925-8574/ã 2015 Elsevier B.V. All rights reserved.
which will be worst affected are those found in the developingworld, thus affecting mostly countries with fragile and susceptiblesocio-economic conditions, presenting significant levels of poverty(Hinrichsen et al., 1998).
Currently, over half the world’s rivers, lakes and coastal watersare heavily contaminated with untreated industrial, domestic andagricultural wastewater (United Nations Environment Programme,2002), presenting high numbers of faecal bacteria (Ceballos et al.,2003) and imposing an unprecedented burden of excreta related-disease upon the poorest populations (Mara, 2003). Furthermore,the pressure exerted by agriculture – which consumes around 70%of the water available globally (FAO, 2009) – in conjunction withother industrial activities and high population growth in develop-ing countries, calls for a more sustainable and ecological approachto the management of the global water abstraction. Wastewater isproduced throughout the year and contains nutrients necessary for
M.P. Alderson et al. / Ecological Engineering 82 (2015) 6–14 7
fish and plant growth. Treated wastewater is therefore a reliablewater source for agriculture and aquaculture, especially in areaswhich present high levels of aridity and those prone to an increasein climate change induced droughts (Mara, 2003; Angelakis et al.,2003; Friedler, 2000).
Water quality standards for agriculture and aquaculture areusually set by international and local standards (WHO, 2006a,b;Dos Santos, 2006; Mota et al., 2007; Silva et al., 2001) in order tominimise health risks and environmental impacts. Furthermore,such limits can often be based on pertinent values required for thelocal area and communities, aiming to avoid the concept of‘overkill’, as described by Mara (2003). This concept refers toexaggerated, overly conservative discharge standards sometimesadopted by developing countries following the example ofindustrialised ones (Johnstone and Horan, 1996). This leads tothe implementation of overly expensive wastewater treatmentplants requiring high capital and maintenance costs and, as aconsequence, local communities being unable to pay theassociated high charges. This in certain cases has led tomunicipalities and wastewater companies halting constructionand operation of wastewater treatment plants, resulting inexposure to untreated water and leading to even higher healthrisks and environmental impacts. It is crucial to set dischargeguidelines which take into consideration local and regional socio-economic, institutional, and climatic conditions (Blumenthal et al.,2000; Oliveira and von Sperling 2008a,b).
The current study is aimed at evaluating a wide range of low-cost, full-scale wastewater treatment technologies for reuse inagriculture and aquaculture using a more realistic and less onerouscompliance standard of 80%. A 95% reliability level is frequentlyadopted for surface water effluents (Oliveira and von Sperling2008a), which represents a requirement for more stringenteffluent standards to be achieved when compared to those neededfor irrigation and aquaculture.
Reliability refers to the percentage of time the expected effluentvalues meet the pre-set discharge limits (Dean and Forsythe,1976a,b; Niku et al., 1979, 1981; Tanaka et al., 1998; Crites andTchobanoglous, 2000; Metcalf and Eddy, 2002; Oliveira and vonSperling 2008a,b). For example, a WWTP will be 100% reliable if theeffluent it produces never exceeds the discharge limits. Due tovariations in raw wastewater characteristics and in actual
Fig. 1. Ceará, northeast Brazil –
wastewater treatment performance, the probability of failure tomeet discharge standards should always be considered duringdesign and policy making.
Therefore, a mean value should be applied which would ensurethis failure is avoided within a certain reliability level. This can becalculated by means of the coefficient of reliability (also known asCOR), which relates the mean effluent values of individualparameters to the standards that must be achieved, as describedby Niku et al. (1979) and demonstrated in more detail by Oliveiraand von Sperling (2008a,b).
However, reliability analyses of this kind have never beenconducted as the primary methodology to evaluate the reuse oftreated wastewater in aquaculture and agriculture. Alternativemethodologies are based on risk assessments, probabilisticmodelling, probability functions, and generalised linear models(WHO, 2006a,b; Benedetti et al., 2010; Vera et al., 2011; Weirichet al., 2011).
The current paper assesses the reliability coefficients of fifty sixlow-cost, full-scale wastewater treatment plants, including ninedifferent treatment technologies for wastewater reuse in aquacul-ture and agriculture in northeast Brazil.
2. Methodology
2.1. Technologies evaluated
The data gathered for the analysis of reliability of wastewatertreatment technologies was obtained directly from CAGECE, thewater company operating for the state of Ceará in northeast Brazil(Fig. 1). The dataset was comprised of 12,275 values recorded from56 wastewater treatment plants (WWTP) situated within andaround the city of Fortaleza, including the 9 different wastewatertreatment technologies described below. Values have beenobtained from late 2005 until early 2009. During that time span,data for a few months were absent for certain parameters indifferent treatment plants as sampling and measurements werenot carried out consistently. The technologies evaluated were:
� 5 septic tanks (ST);� 17 septic tanks + anaerobic filters (ST + AF);� 3 septic tanks + anaerobic filters + chlorination (ST + AF + Cl);
WWTPs regional location.

Table 1Mean parameter concentrations of 9 wastewater treatmenttechnologies.
Cumulative probability (1 � a) = reliability Z1�a
50 0.00060 0.25370 0.52580 0.84290 1.28295 1.64598 2.05499 2.326
8 M.P. Alderson et al. / Ecological Engineering 82 (2015) 6–14
� 8 facultative ponds (FP);� 2 facultative ponds + maturation ponds (FP + MP);� 6 anaerobic ponds + facultative ponds + maturation ponds (AP +
FP + MP);� 1 single aerated facultative pond + single facultative pond +
single maturation pond (AFP + FP + MP);� 3 upflow anaerobic sludge blanket (UASB) without posttreatment;
� 11 upflow anaerobic sludge blanket + chlorination (UASB + Cl).
2.2. Discharge limits
Discharge limits for agriculture and aquaculture were obtainedfrom a compilation of international and Brazilian sources (DosSantos, 2006; WHO 2006a,b; Governo do Estado do Ceará, 2002;Mota et al., 2007; Silva et al., 2001). COD and BOD, effluent releaseto surface waters standards were adopted as the upper parameterlimits, as no other parameter limits were found to be pertinent.
The discharge limits determined as suitable for reuse inagriculture and aquaculture (in line with biological requirementsneeded by crops and fish to thrive) on the context of this study andappropriate for developing countries in general are shown below:
- Chemical oxygen demand (COD): 200 mg/L (Governo do estadodo Ceará, 2002)
- Biochemical oxygen demand (BOD): 60 mg/L (Dos Santos et al.,2007; Mota et al., 2007)
- Escherichia coli for unrestricted irrigation: 103 for every 100 mL(Dos Santos, 2006; Dos Santos et al., 2007; WHO, 2006a)
- E. coli for restricted irrigation and aquaculture: 104 MPN forevery 100 mL (Dos Santos, 2006; Dos Santos et al., 2007; WHO,2006a,b)
- Total suspended solids (TSS): 60 mg/L (Oliveira and von Sperling,2008a)
The diverse effluent parameter values obtained showed greatvariability in their sampling frequency and monitoring periods foreach wastewater treatment technology. Some important param-eters such as free residual chlorine, total nitrogen, ammoniacnitrogen and total phosphorous had to be excluded from theanalysis due to poor data availability from full-scale plants. Heavymetal contaminants have also been excluded as the WWTPevaluated received primarily domestic wastewater, which usuallydo not contain substantial amounts of heavy metals, as opposed tosome industrial wastewaters.
2.3. Reliability analysis
2.3.1. Coefficient of reliability (COR)The reliability of WWTPs can be calculated by using a
coefficient of reliability (COR) as developed by Niku et al.,(1979) based on assumed log-normality of the data. This has beenconfirmed for the data used in this study, as log-normality wasshown to be the best fit for the referred parameters (Kolmogorov,Chi-squared and Anderson tests were applied). Log-normality hasfrequently been reported as the most representative fit for theparameters being analyzed as shown by Dean and Forsythe(1976a,b); Niku et al. (1979, 1981); Niku and Schroeder (1981);Charles et al. (2005); Oliveira (2006) and Oliveira and vonSperling (2008a,b).
Coefficients of variation (CV) of the WWTP technologiesanalysed in this study were calculated for the parameter measure-ments available. The COR relates mean design or operationconcentrations of each parameter being analysed to the standardsrequired based on probability:
mx ¼ ðCORÞXs; (1)
where mx is the mean design or operation effluent concentration(units according to parameter type), Xs the effluent concentrationsparameter standard or limit (its units according to the parametertype) and COR represents the coefficient of reliability.
The coefficient of reliability COR can be calculated from thefollowing equation:
COR ¼ffiffiffiffiffiffiffiffiffiffiffiffiffiffiffiffiffiCV2 þ 1
q� exp �Z1�a
ffiffiffiffiffiffiffiffiffiffiffiffiffiffiffiffiffiffiffiffiffiffiffiffiffiffiffiln CV2 þ 1� �r� �
; (2)
where CV is the coefficient of variation (standard deviation dividedby the mean actual effluent value), a represents the probability ofmeeting the discharge standards and Z1�arepresents the stan-dardized normal variate as represented in the values of standard-ized normal distributions table (Oliveira and von Sperling 2008a,b)(Table 1).
It should be noted that COR values have been obtained based onthe values provided by the original data and not from the logarithmof the data (Oliveira and von Sperling 2008a,b). Once the CORvalues were obtained, the design/operational values that wouldresult in an optimum performance, reaching the requireddischarge standards/limits, were calculated by means of Eq. (1)for all of the wastewater treatment technologies.
2.3.2. Expected compliance with adopted discharge standardsOnce the CV values were obtained, an expected percentage of
compliance with the set limits could be calculated using the actualeffluent values for each wastewater treatment technology andtheir parameters.
Expected compliance percentages were calculated by applyingEq. (3) described by Niku et al. (1979), which takes intoconsideration the relationship between normal and log-normaldistributions, and some algebraic manipulations that take intoaccount the CV values.
Z1�a ¼lnXs � lnm0
x � 12ln CV2 þ 1
� �h iffiffiffiffiffiffiffiffiffiffiffiffiffiffiffiffiffiffiffiffiffiffiffiffiffiffiffiln CV2 þ 1� �r (3)
where m0x is the actual mean effluent value for the analysed
parameter.Once ð1 � aÞ. values have been calculated, a value belonging to
the cumulative probability of the standardized normal distribution(distribution Z) can be obtained. This was carried out applying themeans of the NORMSDIST function in Microsoft Excel, which canalso be found in other statistical sources as shown by Snedecor andCochran (1989) and Montgomery and Runger (1999).
2.3.3. Mean ideal design concentration (MIDC)The effluent values required for the parameter limits to be met
can be calculated using Eq. (1) for each wastewater treatmenttechnology, by applying their mean CV value and a = 20. This hasbeen calculated to easily compare the mean ideal design

Table 2Mean parameter concentrations of 9 wastewater treatment technologies.
Parameters Technologies
ST ST + AF ST + AF + Cl FP FP + MP AP + FP + MP FAP + FP + MP UASB UASB + Cl
COD Raw influent (mg/L) 974 996 538 709 701 803 571 721 803Treated effluent (mg/L) 646 656 299 284 209 137 188 266 364
E. coli (NMP/100 ml)a Raw influent (MPN/100 mL) 2.E + 07 4.E + 07 2.E + 07 5.E + 07 7.E + 07 2.E + 07 3.E + 07 8.E + 07 1.E + 07Treated effluent (MPN/100 mL)L) 8.E + 02 3.E + 02 4.E + 02 8.E + 04 4.E + 03 9.E + 01 5.E + 02 7.E + 02 4.E + 02
TSS (mg/L) Raw influent (mg/L) 372 717 191 280 268 354 178 391 316Treated effluent (mg/L) 295 323 66 149 93 61 94 131 148
BOD (mg/L) Treated effluent (mg/L) – – – 109 – 50 – – –
aGeometric mean for coliforms.
Table 3CV and COR values from the 9 WWTP technologies at an 80% reliability level.a
Technologies Coefficient of variation (CV) Coefficient of reliability (COR)
COD BOD TSS E. coli COD BOD TSS E. coli
ST 1.06 – 1.15 2.72 1.06 – 0.76 0.99ST + AF 2.74 – 5.52 6.44 1.15 – 1.14 1.90ST + AF + Cl 2.01 – 2.21 9.61 1.30 – 0.91 2.11FP 0.77 0.63 0.48 3.34 0.88 0.75 0.79 0.97FP + MP 1.01 – 0.78 0.31 1.34 – 0.77 1.31AP + FP + MP 0.71 0.22 0.84 0.70 0.88 1.02 0.78 0.84AFP + FP + MP 0.48 – 0.48 0.67 1.15 – 0.78 0.75UASB 0.51 – 1.54 2.19 0.97 – 0.80 1.16UASB + Cl 0.83 – 1.05 6.60 0.79 – 0.76 1.56
aRefers to both; unrestricted and restricted irrigation.
Fig. 2. COD coefficients of variation (CV) and coefficients of reliabi
M.P. Alderson et al. / Ecological Engineering 82 (2015) 6–14 9
concentration (MIDC) and the actual mean concentration (AMC)obtained for each parameter and each WWTP type.
3. Results and discussion
The mean influent and effluent concentrations per parameter ofthe 9 WWTP technologies are shown in Table 2.
3.1. Coefficient of variation (CV) and coefficient of reliability (COR)values
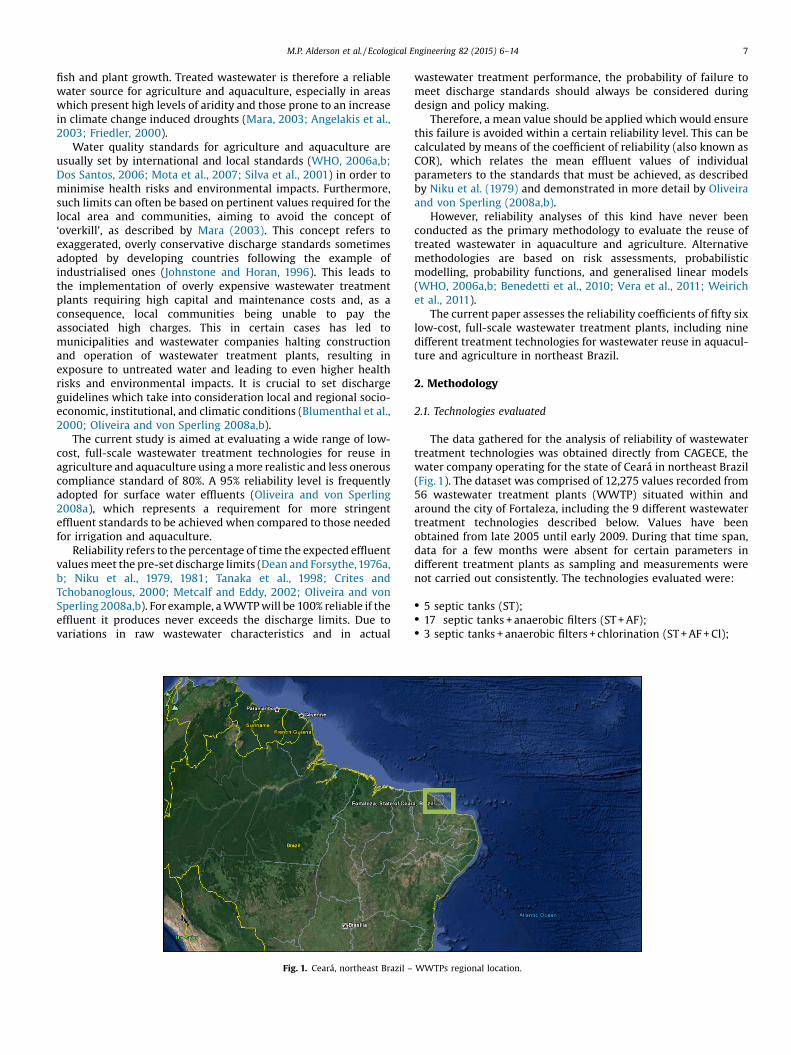
The mean CV values and COR values of the 9 wastewatertreatment technologies for each parameter are shown in Table 3and as box whisker plots (Figs. 2–5), presenting all the values of theWWTPs from each treatment technology.
Table 3 shows that there are great differences for mean CV andCOR values in each parameter when the different wastewatertreatment technologies are compared. The differences are evenmore extreme when box whisker plots are analysed (Figs. 2–5),
lity (COR) values for the 9 wastewater treatment technologies.

Fig. 3. TSS coefficients of variation (CV) and coefficients of reliability (COR) values for the 9 wastewater treatment technologies.
10 M.P. Alderson et al. / Ecological Engineering 82 (2015) 6–14
illustrating great ranges from the maximum and minimum values.Most mean CV values do not fall below 1.0, as would be expected,according to Oliveira and von Sperling (2008a). This difference ismainly due to the fact that there is great variance and unevennessin the effluent values. On a general basis, such is the case in mostanaerobic treatment technologies when compared to aerobicsystems. These high mean CV values are thus representative ofunstable operational levels by these technologies which could becaused by a lack of maintenance, influent disturbances (Oliveiraand von Sperling, 2006, 2008a) or erroneous parameter readings.The most stable operational values according to the CV values are
Fig. 4. E. coli coefficients of variation (CV) and coefficients of reliab
observed for FAP + FP + MP (as its only 1 WWTP) and theAP + FP + MP systems (6 WWTPs with different numbers offacultative and maturation ponds), followed by the other pondsystems (FP and FP + MP); then by the UASB + Cl and UASB systems;and finally by ST systems.
Increasing CV values showed little correlation with decreasingCOR values. This is thought to be due to the extreme variationsbetween the CV values and the surpassing of COR values above1.0 obtained in this study. These higher COR values are attributed tothe lower effluent values in this study and due to the reliabilitylevel applied (80%). Furthermore, many of the effluent values as
ility (COR) values for the 9 wastewater treatment technologies.
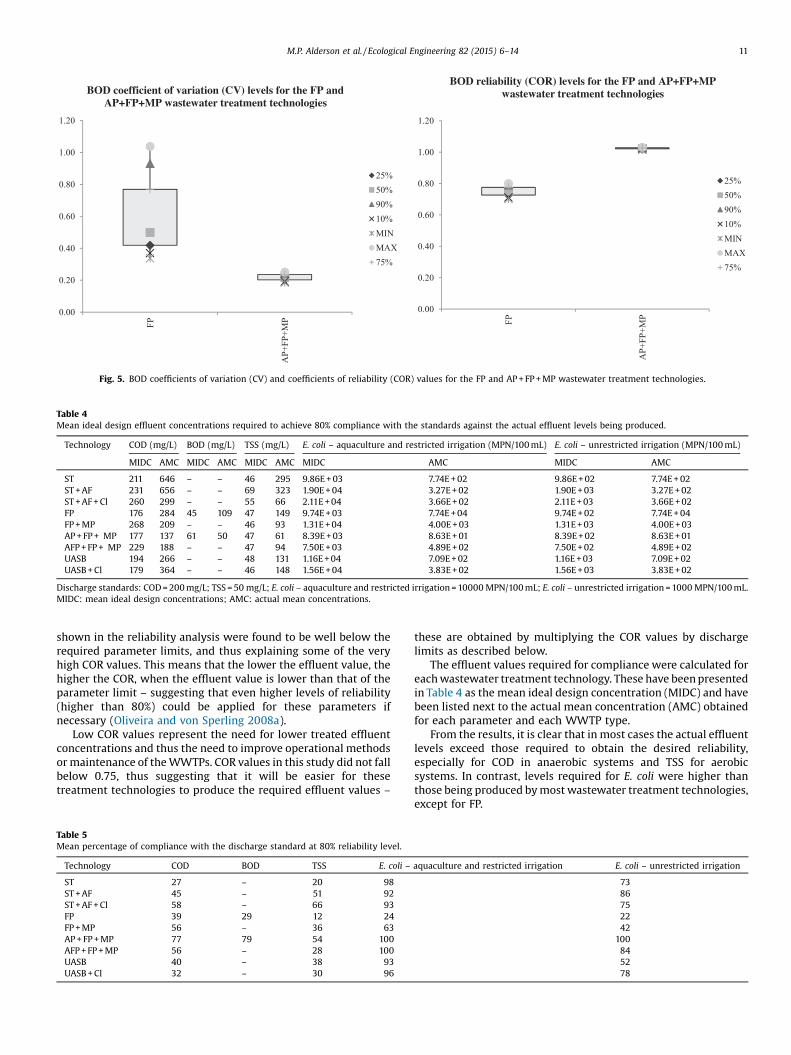
Table 4Mean ideal design effluent concentrations required to achieve 80% compliance with the standards against the actual effluent levels being produced.
Technology COD (mg/L) BOD (mg/L) TSS (mg/L) E. coli – aquaculture and restricted irrigation (MPN/100 mL) E. coli – unrestricted irrigation (MPN/100 mL)
MIDC AMC MIDC AMC MIDC AMC MIDC AMC MIDC AMC
ST 211 646 – – 46 295 9.86E + 03 7.74E + 02 9.86E + 02 7.74E + 02ST + AF 231 656 – – 69 323 1.90E + 04 3.27E + 02 1.90E + 03 3.27E + 02ST + AF + Cl 260 299 – – 55 66 2.11E + 04 3.66E + 02 2.11E + 03 3.66E + 02FP 176 284 45 109 47 149 9.74E + 03 7.74E + 04 9.74E + 02 7.74E + 04FP + MP 268 209 – – 46 93 1.31E + 04 4.00E + 03 1.31E + 03 4.00E + 03AP + FP + MP 177 137 61 50 47 61 8.39E + 03 8.63E + 01 8.39E + 02 8.63E + 01AFP + FP + MP 229 188 – – 47 94 7.50E + 03 4.89E + 02 7.50E + 02 4.89E + 02UASB 194 266 – – 48 131 1.16E + 04 7.09E + 02 1.16E + 03 7.09E + 02UASB + Cl 179 364 – – 46 148 1.56E + 04 3.83E + 02 1.56E + 03 3.83E + 02
Discharge standards: COD = 200 mg/L; TSS = 50 mg/L; E. coli – aquaculture and restricted irrigation = 10000 MPN/100 mL; E. coli – unrestricted irrigation = 1000 MPN/100 mL.MIDC: mean ideal design concentrations; AMC: actual mean concentrations.
Fig. 5. BOD coefficients of variation (CV) and coefficients of reliability (COR) values for the FP and AP + FP + MP wastewater treatment technologies.
M.P. Alderson et al. / Ecological Engineering 82 (2015) 6–14 11
shown in the reliability analysis were found to be well below therequired parameter limits, and thus explaining some of the veryhigh COR values. This means that the lower the effluent value, thehigher the COR, when the effluent value is lower than that of theparameter limit – suggesting that even higher levels of reliability(higher than 80%) could be applied for these parameters ifnecessary (Oliveira and von Sperling 2008a).
Low COR values represent the need for lower treated effluentconcentrations and thus the need to improve operational methodsor maintenance of the WWTPs. COR values in this study did not fallbelow 0.75, thus suggesting that it will be easier for thesetreatment technologies to produce the required effluent values –
Table 5Mean percentage of compliance with the discharge standard at 80% reliability level.
Technology COD BOD TSS E. coli –
ST 27 – 20 98
ST + AF 45 – 51 92
ST + AF + Cl 58 – 66 93
FP 39 29 12 24
FP + MP 56 – 36 63
AP + FP + MP 77 79 54 100
AFP + FP + MP 56 – 28 100
UASB 40 – 38 93
UASB + Cl 32 – 30 96
these are obtained by multiplying the COR values by dischargelimits as described below.
The effluent values required for compliance were calculated foreach wastewater treatment technology. These have been presentedin Table 4 as the mean ideal design concentration (MIDC) and havebeen listed next to the actual mean concentration (AMC) obtainedfor each parameter and each WWTP type.
From the results, it is clear that in most cases the actual effluentlevels exceed those required to obtain the desired reliability,especially for COD in anaerobic systems and TSS for aerobicsystems. In contrast, levels required for E. coli were higher thanthose being produced by most wastewater treatment technologies,except for FP.
aquaculture and restricted irrigation E. coli – unrestricted irrigation
7386752242
100845278
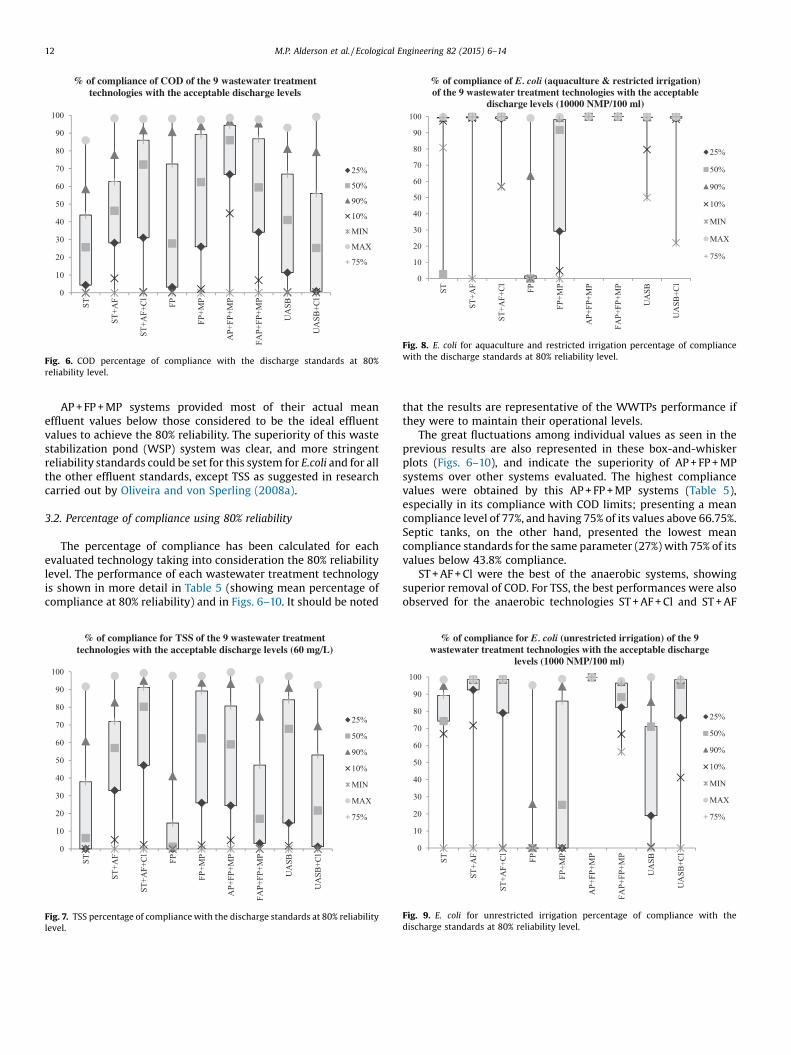
Fig. 6. COD percentage of compliance with the discharge standards at 80%reliability level.
Fig. 8. E. coli for aquaculture and restricted irrigation percentage of compliancewith the discharge standards at 80% reliability level.
12 M.P. Alderson et al. / Ecological Engineering 82 (2015) 6–14
AP + FP + MP systems provided most of their actual meaneffluent values below those considered to be the ideal effluentvalues to achieve the 80% reliability. The superiority of this wastestabilization pond (WSP) system was clear, and more stringentreliability standards could be set for this system for E.coli and for allthe other effluent standards, except TSS as suggested in researchcarried out by Oliveira and von Sperling (2008a).
3.2. Percentage of compliance using 80% reliability
The percentage of compliance has been calculated for eachevaluated technology taking into consideration the 80% reliabilitylevel. The performance of each wastewater treatment technologyis shown in more detail in Table 5 (showing mean percentage ofcompliance at 80% reliability) and in Figs. 6–10. It should be noted
Fig. 7. TSS percentage of compliance with the discharge standards at 80% reliabilitylevel.
that the results are representative of the WWTPs performance ifthey were to maintain their operational levels.
The great fluctuations among individual values as seen in theprevious results are also represented in these box-and-whiskerplots (Figs. 6–10), and indicate the superiority of AP + FP + MPsystems over other systems evaluated. The highest compliancevalues were obtained by this AP + FP + MP systems (Table 5),especially in its compliance with COD limits; presenting a meancompliance level of 77%, and having 75% of its values above 66.75%.Septic tanks, on the other hand, presented the lowest meancompliance standards for the same parameter (27%) with 75% of itsvalues below 43.8% compliance.
ST + AF + Cl were the best of the anaerobic systems, showingsuperior removal of COD. For TSS, the best performances were alsoobserved for the anaerobic technologies ST + AF + Cl and ST + AF
Fig. 9. E. coli for unrestricted irrigation percentage of compliance with thedischarge standards at 80% reliability level.

Fig. 10. BOD percentage of compliance with the discharge standards at 80%reliability level for FP and AP + FP + MP treatment technologies.
M.P. Alderson et al. / Ecological Engineering 82 (2015) 6–14 13
(corroborating observations by Von Sperling and Oliveira, 2009),followed by the AP + FP + MPs.
Fig.11 shows the differences in performances of the wastewatertreatment technologies evaluated. AP + FP + MP systems providedthe best compliance. Further to this, if efficiency is calculated usingthe values from Table 2 it is clear that this technology also presentsthe best overall removal efficiencies (77% for COD, 79% for BOD and100% for E. coli for aquaculture/restricted irrigation and forunrestricted irrigation (Table 2).
It is important to note that this study has focused in comparingtreatment technologies, composed of varying number of WWTPs,which in some cases differ in design especially for the AP + FP + MPsystems. Furthermore, they will also have undergone differentmaintenance standards, differing in frequency and quality,resulting in large differences between maximum and minimum
Fig. 11. Percentile values for the expected compliance with
values (as well as high CV values). There is also a considerabledifference in the number of WWTPs included in the analysis pertreatment technology, which can make the results biased depend-ing on the number of measurements for individual parameters andtheir validity. This is represented for E. coli values for example,where ST (presenting only 2 measurements in 1 WWTP) providedbetter results than technologies considered to be superior, such asFP + MP (presenting various measurements for 2 WWTP’s for thisparameter).
4. Conclusion
Results have shown that low-cost, full scale wastewatertreatment plants are able to provide a suitable effluent forwastewater reuse in agriculture and aquaculture when an 80%reliability standard is applied – with the AP + FP + MP (WSP system)presenting the highest levels of compliance.
The reliability analyses showed to be a simple and straightfor-ward methodology that can be used by sanitation companies toselect appropriate wastewater treatment processes for reusepurposes.
The 80% reliability used represents a more pertinent target forwater-scarce communities in developing regions which may beaffected further by the impacts of climate change, and which usethese low cost full-scale domestic wastewater treatment technolo-gies. In such context, most treatment systems can be successfullyused for wastewater reuse in agriculture and aquaculture at highcompliance rates. Moves to implement such re-uses of wastewatershould be implemented where identified to be feasible and relevant.
However, it is important to note that the current study focusedonly on the evaluation of treatment performances of variouslow-cost, sustainable, ecological technologies, and did notconcentrate on assessing the potential health impacts whichcould result from using such technologies at lower reliabilitylevels. Ideally, cost-effective public health policy on wastewaterreuse should be based on the use of empirical epidemiologicalstudies supplemented by microbiological studies of the transmis-sion of pathogens in conjunction with model-based quantitativerisk assessment for selected pathogens.
standards for all parameters, at an 80% reliability level.

14 M.P. Alderson et al. / Ecological Engineering 82 (2015) 6–14
Acknowledgements
This work was financially supported by the Royal Society (grantreference number JP090804), Engineers without Borders UK andby the School of Civil Engineering and Geosciences at NewcastleUniversity. The authors would like to thank CAGECE for providingthe raw data.
References
Angelakis, A.N., Bontoux, L., Lazarova, V., 2003. Challenges and prospectives forwater recycling and reuse in EU countries. Water Sci. Technol.: Water Supply 3(4), 59–68.
Benedetti, L., De Keyser, W., Nopens, I., Vanrolleghem, P.A., 2010. Probabilisticmodelling and evaluation of wastewater treatment plant upgrades in a waterquality based evaluation context. J. Hydroinf. 12 (4), 380–395.
Blumenthal, U.J., Mara, D., Peasey, A., Ruiz-Palacios, G., Stott, R., 2000. Guidelines forthe microbiological quality of treated wastewater used in agriculture:recommendations for revising WHO guidelines. Bull. World Health Organ. 78(9), 1104–1116.
Ceballos, B.S.O., Soares, N.E., Moraes, M.R., Catão, R.M.R., Konig, A., 2003.Microbiological aspects of an urban river used for unrestricted irrigation in thesemi-arid region of north-east Brazil. Water Sci. Technol. 4 (3), 51–57.
Charles, K.J., Ashbolt, N.J., Roser, D.J., McGuinness, R., Deere, D.A., 2005. Effluentquality from 200 on-site sewage systems: design values for guidelines. WaterSci. Technol. 51 (10), 163–169.
Crites, R., Tchobanoglous, G., 2000. Water Treatment of Residual Waters in SmallPopulations (Tratamiento de aguasresiduales en pequeñas poblaciones).McGraw-Hill Interamericana, Bogotá, Colombia p. 776.
Dean, R.B., Forsythe, S.L., 1976a. Estimating the reliability of advanced wastetreatment. Water Sewage Works 1, 87–89.
Dean, R.B., Forsythe, S.L., 1976b. Estimating the reliability of advanced wastetreatment. Water Sewage Works 2, 87–89.
Dos Santos, M.L., 2006. Treatment and Use of Sewage (Tratamento e utilização deesgotos sanitários). Abes, Rio de Janeiro.
Dos Santos, A.B., Mota, S., Machado, T.F., Bezerra, F.M.L., De Aquino, B.F., 2007. FruitsProduced with Wastewater Treated in Stabilization Ponds Systems: Evaluationin a Quality Prospective. Federal University of Ceará, Fortaleza.
FAO, 2009. Natural Resources. ftp://ftp.fao.org/docrep/fao/011/i0765e/i0765e13.pdf. Last updated 24/04/2009, last seen 04/12/2011.
Friedler, E., 2000. Water reuse an integral part of water resources management:Israel as a case study. Water Policy 3 (2001), 29–39.
Government of the State of Ceara (Governo do estado do Ceará), 2002. Semace –
Directives (Portarias). http://www.semace.ce.gov.br/biblioteca/legislacao/conteudo_legislacao.asp?cd=95. Last updated 22/07/2002, last seen 14/06/2009.
Hinrichsen, D., Robey, B., Upadhyay, U.D., 1998. Solutions for a water-short world.Hunt, C.E., 2003. Thirsty Planet: Strategies for Sustainable Water Management. Zed
Books, London.Johnstone, D.W.M., Horan, N.J., 1996. Institutional developments, standards and
river quality: a UK history and some lessons for industrialising countries. WaterSci. Technol. 33 (3), 211–222.
Mara, D., 2003. Domestic Wastewater Treatment in Developing Countries.Earthscan, London.
Metcalf & Eddy, 2002. Tchobanoglous, G., Burton, F.L., Stensel, H.D., 2002.Wastewater Engineering: Treatment and Reuse, 4th ed. McGraw-Hill HigherEducation, New York.
Mota, S., de Aquino, M.D., Dos Santos, A.B., 2007. Wastewater reuse: concepts,importance (Reúso de água: conceitos, importância; tipos.). In: Mota, S., deAquino, M.D., Dos Santos, A.B. (Eds.), Reuse of Water in Irrigation and FishFarming (Reúso de águas em irrigação e piscicultura). Federal University ofCeara (Universidade Federal do Ceará), Fortaleza, pp. 21–39.
Niku, S., Schroeder, S.D., 1981. Factors affecting effluent variability from activatedsludge processes. Water Pollut. Control Assoc. 53 (5), 546–559.
Niku, S., Schroeder, S.D., Samaniego, F.J., 1979. Performance of activated sludgeprocess and reliability-based design. Water Pollut. Control Assoc. 51 (12),2841–2857.
Niku, S., Schroeder, S.D., Tchobanoglous, G., Samaniego, F.J., 1981. Performance ofactivated sludge process: reliability, stability and variability. Environ. Protect.Agency (1), 1–124.
Oliveira, S.C., 2006. Analisys of Performance and Reliability of Sewage TreatmentPlants. PhD Thesis. Escola de Engenharia, Universidade Federal de Minas Gerais,Belo Horizonte.
Oliveira, S.C., von Sperling, M., 2006. Wastewater characteristics in a developingcountry, based on a large survey (166 treatment plants). Proceedings of the FifthIWA World Water Congress, IWA, China.
Oliveira, S.C., von Sperling, M., 2008a. Reliability analysis of wastewater treatmentplants. Water Res. 42 (4–5), 1182–1194.
Oliveira, S.C., von Sperling, M., 2008b. Elements for setting up discharge standardsin developing countries based on actual wastewater treatment plantperformance. Water Sci. Technol. 58 (10), 2001–2008.
Postel, S., 1997. The Last Oasis: Facing Water Scarcity. Worldwatch Institute,Washington, D.C.
Silva, F.J.A., Ferreira, M.W., Logato, P.V.R., 2001. Water Quality in Aquaculture(Qualidade da água na piscicultura). Boletim de Extensão da Ufla, Lavras, MG n. 94.
Snedecor, G.W., Cochran, W.G., 1989. Statistical Methods, 8th ed. IOWA StateUniversity Press, Ames, IA, pp. 503.
Tanaka, H., Asano, T., Schroeder, E.D., Tchobanoglous, G., 1998. Estimating the safetyof wastewater reclamation and reuse using enteric virus monitoring data. WaterEnviron. Res. 70 (1), 39–51.
United Nations Environment Programme, 2002. Global Environment Outlook 3.Earthscan, London.
Vera, I., García, J., Sáez, K., Moragas, L., Vidal, G., 2011. Performance evaluation ofeight years experience of constructed wetland systems in Catalonia asalternative treatment for small communities. Ecol. Eng. 37 (2), 364–371.
Von Sperling, M., Oliveira, S.C., 2009. Comparative performance evaluation of full-scale anaerobic and aerobic wastewater treatment processes in Brazil. IWAWater Res. 59 (1), 15–22.
Weirich, S.R., Silverstein, J.A., Rajagopalan, B., 2011. Effect of average flow andcapacity utilization on effluent water quality from US municipal wastewatertreatment facilities. Water Res. 45 (14), 4279–4286.
WHO, 2006a. Guidelines for the safe use of wastewater, excreta and greywater.Wastewater Use in Agriculture, vol. 2. WHO, Geneva.
WHO, 2006b. Guidelines for the safe use of wastewater, excreta and greywater.Wastewater and Excreta Use in Aquaculture, vol. 3. WHO, Geneva.
Glossary
AF: Anaerobic filters
AMC: Actual mean concentration
AP: Anaerobic pond
BOD: Biochemical oxygen demand
CAGECE: Companhia de Água e Esgoto do Ceará
Cl: Chlorination
COD: Chemical oxygen demand
COR: Coefficient of reliability
CV: Coefficient of variation
E. coli: Escherichia coli
FAO: Food and Agriculture Organization
FAP: Facultative aerated pond
FP: Facultative pond
mg/l: Milligrams per litre
MIDC: Mean ideal design concentrations
MP: Maturation pond
MPN: Most probable number
ST: Septic tank
TSS: Total suspended solids
UASB: Upflow anaerobic sludge blanket
UN: United Nations
WHO: World Health Organization
WSP: Waste stabilization ponds
WWTP: Waste water treatment plant