Reliability Revie actions that should be addressed are outlined. RELIABILITY IS ALL AROUND US........
35
Featured In This Issue... Apply Object Oriented Design & Analysis to Reliability Model by N.Schneidewind, Ph.D. RR Bookshelf: Lean Maintenance by R.Smith and B. Hawkins. THE R & M ENGINEERING JOURNAL Published Quarterly (ISBN 0277-9633) 2007 December, Volume 27, Number 4 Reliability Review
Transcript of Reliability Revie actions that should be addressed are outlined. RELIABILITY IS ALL AROUND US........
Featured In This Issue...
Apply Object Oriented Design & Analysisto Reliability Model
byN.Schneidewind, Ph.D.
RR Bookshelf:Lean Maintenance
by R.Smith and B. Hawkins.
THE R & M ENGINEERING JOURNAL
Published Quarterly (ISBN 0277-9633)
2007 December, Volume 27, Number 4
Reliability Review

IDENTIFICATION STATEMENT: Reliability Review (ISSN 0277-9633) is published quarterly (March, June, September, December)
2678 Brown Bear Court, Cool, CA 95614. Subscription rates for non-members are as follows: Within USA $40.00 yearly; Canada and Mexico, $45.00; Outside North America, $50.00. INDIVIDUAL COPIES: $12.50 per copy plus postage. POSTMASTER:Send address changes to: A S Q, P.O.Box 3005, Milwaukee, WI 53205-3005
COPYRIGHT AND REPRINT INFORMATION: Permission of the publisher is required for reprinting or copying for circulation of any article. Write to the Executive Editor, Reliability Review, (address above).All rights resrved. CAVEAT: Comments of individuals
.Copyright ©2007 by the American Society of Quality. Printed in the USA.
ASQ: The Society of Professionals Dedicated to the Advancement of Quality.
Manuscripts: Submit a print out of the complete draft of all text and illustrative material. In addition transmit not PDF or Read only) or Word
Perfect, or ASCI Text]. Email delivery address is [email protected]: It is our policy to own the copyright to each article we publish. We will supply the author(s) an ASQ
Copyright Form which must be completed before publication. The agreement does grant to the authors and their employers the right to reuse their material for their own internal purposes.
Illustrations, Tables, Figures, Charts: Supply camera ready illustrations, graphics, charts and tables generated
using Microsoft Equation Editor. Most illustrations, tables and charts will be reduced to one column 3.25” wide; be sure the lettering is large enough to be legible after reduction.
Submittal: If more than one author, name each and designate correspondence author. Explicitly show addresses including Email for correspondence. Always supply a hard copy of manuscript, too via postal mail to:
We encourage R& M professionals to submit original writings discussing concepts, practices and improvement ideas for reliability engineering and management; maintainability,,and systems engineering. Our purposes:
to improve design of products and processes; third, to reduce or mitigate risk. Request our template for authors.
Authors submitted articles receive staff review to ascertain that facts are correctly stated and opinion and fact are clearly distinguished one from another. Technical content may be refereed by selected specialists. The Editor reserves the right to edit any article, and will usually exercise that right.
RRand December. If your publishable submittal is received three months before a publication date, your article may be in the next issue - subject to space and reviewing constraints.
Submit draft copy to Harold Williams, Editor, with Request for Quote. Indicate size desired or sizes of interest. Specify whether you will provide camera-ready
Reliability Review welcomes letters from readers. We offer the following guidelines. Letters should clearly state whether the author is expressing opinion or presenting facts with supporting information. Commendation, encouragement, constructive critique, suggestions and alternative approaches are accepted. Berating is not appropriate. If the content is more than 200 words, we may delete portions to hold to that limit. We reserve the right to edit letters. Address letters to: RR Dialogue, 2678 Brown Bear Court, Cool, CA 95614.
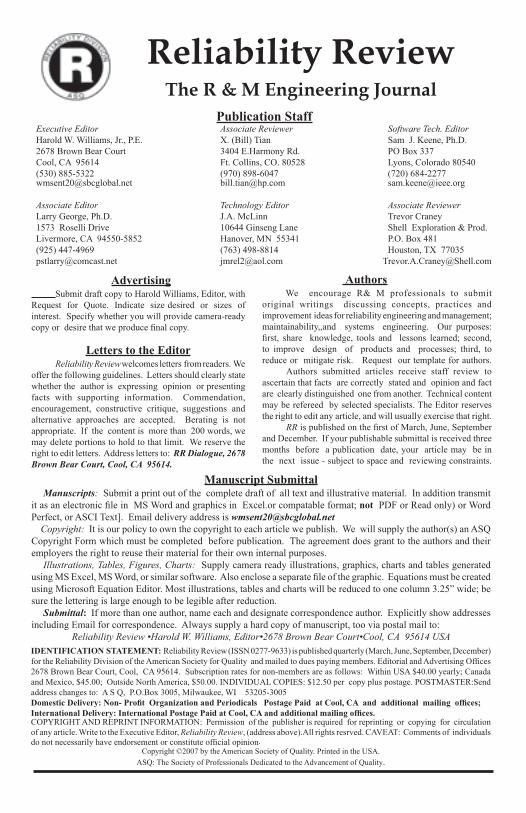
Harold W. Williams, Jr., P.E. X. (Bill) Tian Sam J. Keene, Ph.D.2678 Brown Bear Court 3404 E.Harmony Rd. PO Box 337Cool, CA 95614 Ft. Collins, CO. 80528 Lyons, Colorado 80540(530) 885-5322 (970) 898-6047 (720) [email protected] [email protected] [email protected]
Larry George, Ph.D. J.A. McLinn Trevor Craney1573 Roselli Drive 10644 Ginseng Lane Shell Exploration & Prod.Livermore, CA 94550-5852 Hanover, MN 55341 P.O. Box 481 (925) 447-4969 (763) 498-8814 Houston, TX [email protected] [email protected] [email protected]
Reliability ReviewThe R & M Engineering Journal
The Review Presents
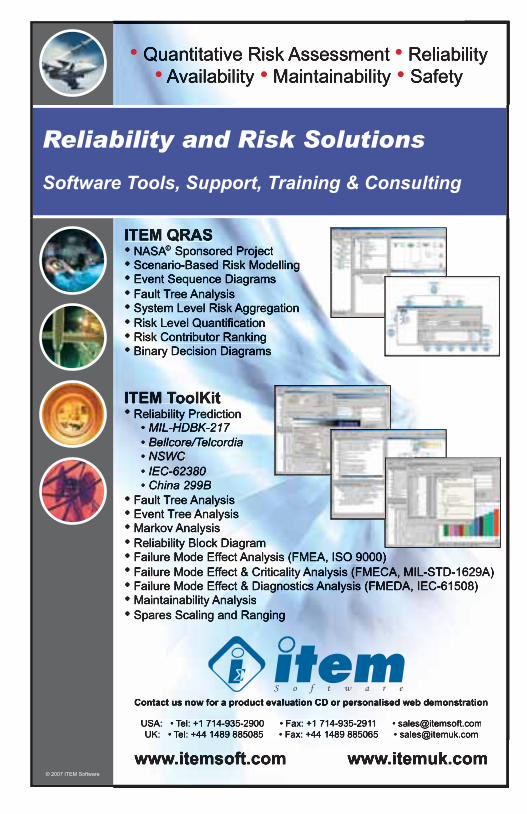
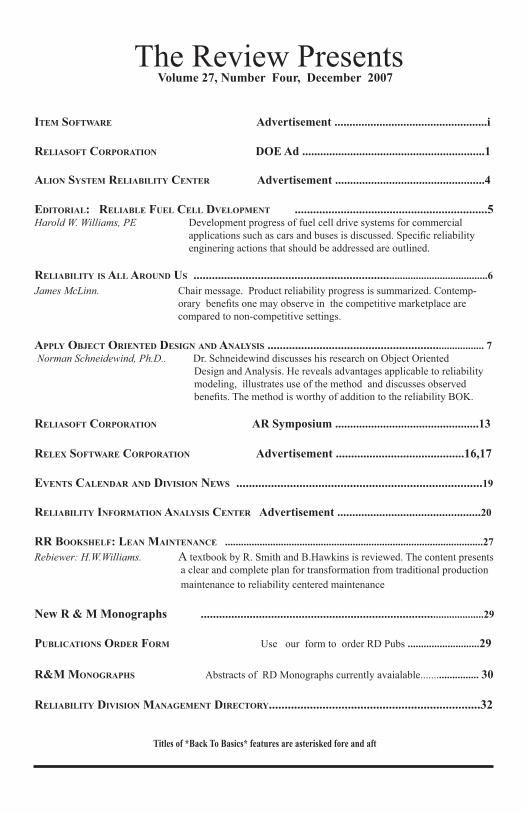
ITEM SOFTWARE ...................................................i
RELIASOFT CORPORATION .............................................................1
ALION SYSTEM RELIABILITY CENTER .................................................4
EDITORIAL: RELIABLE FUEL CELL DVELOPMENT ...............................................................5Development progress of fuel cell drive systems for commercial
enginering actions that should be addressed are outlined.
RELIABILITY IS ALL AROUND US ................................................................Chair message. Product reliability progress is summarized. Contemp-
compared to non-competitive settings.
APPLY OBJECT ORIENTED DESIGN AND ANALYSIS ........................................................ Dr. Schneidewind discusses his research on Object Oriented
Design and Analysis. He reveals advantages applicable to reliability modeling, illustrates use of the method and discusses observed
RELIASOFT CORPORATION ...............................................13
RELEX SOFTWARE CORPORATION A ....................................16,17
EVENTS CALENDAR AND DIVISION NEWS 19
RELIABILITY INFORMATION ANALYSIS CENTER ...........................................20
RR BOOKSHELF: LEAN MAINTENANCE .................................................................................................27A textbook by R. Smith and B.Hawkins is reviewed. The content presents
a clear and complete plan for transformation from traditional production maintenance to reliability centered maintenance
............................................................................
PUBLICATIONS ORDER FORM Use our form to order RD Pubs
R&M MONOGRAPHS Abstracts of RD Monographs currently avaialable.......
RELIABILITY DIVISION MANAGEMENT DIRECTORY 2

TH
E ONEIs your organization faced with any of the following?• Specifying the reliability of an item you are contracting to an
outside vendor.
• Developing a reliability program plan that focuses on costeffective reliability tasks.
• Leveraging the “lessons learned” from historical data.
• Balancing deadlines associated with RMS tasks usingan overburdened staff.
• Establishing “best-in-class” RMS practiceswithout fully understanding the steps toreach this goal.
• Performing maintenance practices withlimited resources while ensuring thatrequirements are not compromised.
• Quantifying the reliability of yourproduct through effective accelerated
life tests.
• Identifying the root cause of repeatedwarranty claims against your product.
Alion SRC consulting services address reliability,maintainability and supportability (RMS) challenges.
Since 1968, Alion’s staff has provided integral support tocommercial and defense customers to achieve their RMS goals.Our professionals provide expert support to improve yourbottom line and meet customer needs.
Visit src.alionscience.comor call 888.722.8737 today.
source for reliability.
Alion System Reliability Center
© 2007 Alion Science and Technology Corporation
System & Part Integrated
Data Resource
TM
Page 5 Reliability Review Vol. 27, December 2007
RELIABLE FUEL CELL SYSTEMS Editorial by Harold W.Williams
Other readers may be associated with transportation vehicle enterprises such as automotive power systems or such systems for other transportation vehicle designs such as buses, trains, golf carts, etc. R & M engineers, system engineers, and designers involved in such enterprises will be well advised to ensure priority attention is allocated to failure modes and effects analysis of all components; especially, the membrane electrode,
for Safety Hazard Analysis is the hydrogen storage vessel.
Achievement of fuel cell technology reliability and durability milestones for the next two phases will involve refinements and upgrades in parts, materials and processes. Usually, designed experiments and trade-off studies precede introduction of the upgrades. After the “improvements“ are introduced into engineering evaluation models, they are subjected to environmental tests. Use of fault tree reviews and assessments
Fuel cell technology initially captured my interest over thirty years ago in my design and development engineering efforts for spacecraft power generation applications. Reliable performance was achieved.
Possibly many RR readers are somewhat acquainted with the fact that fuel cell technology has progressed substatantiallyin the USA and other nations to emerge as a commercially viable source of energy for powering transportation vehicles and also for stationary and portable power generation applications. Fuel cell drive systems in automobiles and buses are in the third generation of demonstration testing. Users are extremely pleased with power, acceleration and acoustics. The development units are exceeding milestone targets toward commercially acceptable performance and costs by 2010.
Challenges at this time are durability, reliability and safety. Since we have a keen interest in these areas I have chosen to write on the topic today. Some RR readers are employed in industries or projects where fuel cell power may be a candidate for

Reliability Review, Vol. 27, December 2007 Page 6
CHAIR MESSAGE
RELIABILITY IS ALL AROUND US
by Jim McLinn
Everyday we see evidence of the success of our profession. No giant billboards scream out the word Reliability and no rock stars endorse the process. The world is not like that. The evidence of our success is subtle. Only failures are spectacular and newsworthy. Success is not considered important enough to note. It has become common place and expected.
Did you get up this morning to an alarm clock? Most are electronic now and are highly reliable. I own a 1972 Heathkit Digital Alarm clock (remember Heathkit?). It was built while I was in college and it worked up to last week. Some trouble shooting showed that a main solder
That’s 35 years of continuous operation without failure. Every day I assumed it would work. This includes after being dropped several times and through a few moves over the years. It was a success until it stopped working.
Walk out into your kitchen and look around. High tech is everywhere. New coffee maker, high tech toaster, new oven and even a modern dishwasher might be present. Are these appliances reliable? For the most part yes! The least reliable might
be the electronic controlled dishwasher. Mechanical control dishwashers seldom failed. Some companies still don’t protect the electronics from the high humidity and steam generated in the wash cycle. Thus, early failures from humidity may occur. Next pick up your cell phone. How has this complex electronic device been working? Many companies make reliable phones. You can drop them and abuse them and they work. My wife and I have collectively about 12 years of digital cell phone experience. During that time, one phone developed a bad battery and one had an internal electronic problem. The others never failed. This may not sound like the best record, but every phone had more capability and cost less than the one before it. Aren’t these digital phones better than the older analog phones of the mid to late 1990s? The sound is better, the working network is wider, there are fewer dropped calls, and phone weight is about one-quarter of the old phones. We only think about phones when they fail. If a company produces an unreliable cell phone we hear about it on the web, through the TV news or even via the newspaper. Competition ensures that problems are quickly recognized and
Page 7 Reliability Review Vol. 27, December 2007
APPLY OBJECT ORIENTED
DESIGN AND ANALYSIS?by Norman Schneidewind, Ph.D.
research and application of object oriented (O-O) design and analysis to software reliability. The investigation and application discloses that the O-O method is worthy of addition to the tools included in the reliability engineering body of knowledge.
My research addressed the question: Can object-oriented methods be applied to mathematical software? According to Beall and Shepard [BEA94] the answer is “yes”. They say: “It has been recognized
oriented programming provides a means
maintenance of large-scale software systems. Since general purpose numerical analysis codes certainly qualify as large-scale software it makes sense to explore application of these methodologies to
to software reliability models.”
The development of computer science as a whole proceeded from an initial concern with programming alone, through increasing interest in design, and later to a concern with analysis methods. [GRA]. Until the 1980s, apart from a few fairly obscure AI applications, object orientation was largely associated with the development of graphical user interfaces (GUIs) and few other applications became widely known. In the 1980s Grady Booch published a paper on how to design for Ada and gave it the prophetic title: Object-Oriented Design. Booch was able to extend his ideas to a genuinely object-oriented design method by 1991 in his book with the same title, revised in 1993 [BOO94]
Proponents of O-O claim many advantages. Unfortunately, these claims
be accompanied by a discussion of disadvantages. An obvious one is that O-O is highly abstract and based on my experience in teaching this model, students
As claimed, the advantages of object-oriented analysis and design

Reliability Review, Vol. 27, December 2007 Page 8
O-O RELIABILITY (CONT)
in parentheses) [GRA]:
Required changes are localized and unexpected interactions with other program modules are unlikely; (how is this different from information hiding and modular design?)
Inheritance makes O-O systems more extensible, contributing to more rapid development; (inheritance, meaning that child classes inherit properties from parent classes).
Inheritance clarify the relationships among software objects
object-based design is suitable for distributed, parallel, or sequential implementation; (like any development model, the O-O approach helps you understand the problem)
objects correspond more closely to the entities in the conceptual worlds of the designer and user, leading to greater traceability; (agree, and this can be supported by effective software management requiring traceability among software products and the process steps that produce them)
shared data areas are encapsul-ated, reducing the possibility
other update anomalies (agree)
For the reader who is interested in learning more details about the O-O approach, see “Background in O-O” in the Appendix.
I conducted a careful and detailed analysis to see whether object oriented analysis, design, and language are applicable in general to mathematical models and, in particular, to software
Modeling Language) tool, I include several “UML–like” diagrams that were used to model a software reliability model. I did not adhere exactly to standard UML
diagrams expressed mathematical software characteristics better than the standard. While it is easy to see that the O-O approach is compatible with developing a web site, it was not clear how this approach applies to developing mathematical functions. In the case of a web site, there are activities (e.g., client access to a web server) so that an activity diagram would apply. However, in the case of equations, would activity diagrams and state charts apply? Would it make sense to consider an equation as an object or as a class? I validated the assertion of Beall and Shephard [BEA94] that O-O applies to this category of mathematical software by application of the method to my software. I used the O-O approach to model many facets of both the software reliability product (i.e., the software reliability model) and the thatproduces the product (e.g., collecting failure data in order to estimate model

Page 9 Reliability Review Vol. 27, December 2007
O-O RELIABILITY(CONT)parameters). Since some O-O diagrams emphasize activity, one may apply this feature to process scenarios.
I was also interested in whether the O-O representation of entities can be accurately mapped to the problem domain (e.g., do equations have “state and behavior”?) It is clear that they have functions, parameters, and variables. Actually, equations do have state and behavior. For example, an equation can be in a dormant state: embedded in C++ code or in the active state -- executed. In addition, an equation may exhibit behavior (e.g., prediction accuracy). I carried the mapping process all the way down to producing a C++ code fragment (in the Appendix). It appears that the closer one gets to code, the more applicable the O-O paradigm is to equations. There are some tools that can translate from UML to C++ (e.g., Rational Rose). A problem is that the mapping may not be completely compatible with the code generated by a given compiler.
According to [DOY05], using only the object-oriented representations in UML 1.2, he found it impossible to get started. Although the use case diagrams were good at showing what the system does, they provide no insight how it does it. People seemed to need a single view that explained approximately how the system worked in terms of a
(emphasis added). The ability to organize a system into comprehensible
chunks was also important for project management. The decomposition (using a functional model) provided a basis for creating a team structure and managing the project. Because functions are named according to their purpose, there is no need to learn a new vocabulary when trying to understand a new system to be developed. In object-oriented development, creating classes can be viewed as populating the model with the objects. Early in the development, they experienced the phenomena of the team being linguistically challenged as it struggled to adjust to the new vocabulary. It was initially unnatural to begin talking about unfamiliar objects as though they were a natural part of the problem. Although the team eventually
in the system design. Note that the authors used an older version of UML. However, a review of UML 2.0 [UML07] did not indicate an improvement in this regard.
Although prior research has compared modeling performance using different systems development methods, there has been little research examining the comprehensibility of models generated by those methods. [AGA99] The authors report the results of an empirical study comparing user comprehension of object-oriented (O-O) and process-oriented (P-O) models. The fundamental difference is that while O-O models tend to focus on structure, P-O models tend to emphasize behavior or processes. Proponents of the O-O modeling approach argue that it lends itself naturally to the way humans think. However, evidence from research in cognitive psychology and human factors suggests that human problem solving is
Reliability Review, Vol. 27, December 2007 Page 10
O-O RELIABILITY(CONT)innately procedural.
the authors investigated empirically whether O-O models are in fact easier to understand than P-O models [AGA99]. But, as suggested by the theory of cognitive fit, model comprehension may be influenced by task-specific characteristics. Therefore, the authors compared O-O and P-O models based on whether the comprehension activity involves: 1) only structural aspects, 2) only behavioral aspects, or 3) a combination of structural and behavioral aspects. They measured comprehension through subjects' responses to questions designed along these three dimensions. Two analyses were conducted, each with a different application and a different group of subjects. Each subject was
participated in one of the two analyses, answering several questions relating to his or her comprehension of an O-O or a P-O model of a business application. The comprehension questions ranged in complexity from relatively simple (addressing either structural or behavioral aspects) to more complex ones (addressing both structural and behavioral aspects). Results show that for most of the simple
observed insofar as model comprehension is concerned. For most of the complex questions, however, the P-O model was found to be easier to understand than the O-O model.
O-O techniques are worthwhile for organizing my thinking about objects and their interaction, but these techniques have shortcomings with respect to
design. Therefore, I developed UML diagrams for capturing the
relationships among mathematical objects and methods. These are called “Objects Hierarchy Diagram” (Figure 2), “Methods Hierarchy Diagram” (Figure 3), and “Structure Chart of Software Reliability Model” (Figure 4). These diagrams are keyed to traditional O-O diagrams, such as the Activity Diagram (Figure 1). In addition, because objects and classes at the design level do not necessarily have names identical to those at the code level, I feel it is important to make this translation. For example, according to [HOR97]: An object is a value that can be created, stored, and manipulated in a programming language. Furthermore, a class is a data type. Therefore, it is necessary, for example, to map from a mathematical equation at the design level to its stored value representation at the code level, and to map from a class named “parameters” at the design level to the data type at the code level.
Process
In my design approach, I use the steps below suggested by Graham and Wills [GRA], with the domain examples in parentheses:
identify objects and methods; (e.g., equations, parameters, and variables; estimate, predict)

Page 11 Reliability Review Vol. 27, December 2007
O-O RELIABILITY(CONT)establish the relationships between objects; (e.g., equations use failure data)o establish the interface(s) of each object and exception handling;(e.g., equation does not converge
no solution program exit)o implement and test the objects; ( e . g . , c o m p a r e predictions with actual values)
In this section, I show how O-O can be applied to mathematical software by using an integrated set of software development process diagrams. First, I indicate how key O-O attributes relate to the diagrams.
Attributes
Relationship between objects (e.g., interaction between equations and parameters). See Objects Hierarchy Chart, Figure 2.
The same operation (i.e., method) may act differently on different classes and objects. [RUM91] For example, a software reliability prediction method would predict differently for versus
objects. See Objects Hierarchy Chart, Figure 2.
Operations that may be performed on an object [BO-O94] (e.g., the object equations is executed by method ).See Methods Hierarchy Chart, Figure 3.
Real-world objects have two characteristics: state (e.g., data and variables initialized) and behavior (e.g., prediction accuracy). [BO-O94] See Structure Chart of Software Reliability Model, Figure 4.
In the object-oriented world, isan abstraction of the common properties from a set containing many objects [DOU99] In the real world, you often
all of the same kind. For example, there may be many reliability model equations in existence, but all are from the same model. Each equation was built from the same set of model concepts. In object-oriented terms, I say that the
equation is an instance of the class of objects called equation. See Structure Chart, Figure 4.
Diagrams
According to Hassan Gomaa [GOM], in the analysis modeling phase, static and dynamic models of the system are
structural relationships among problem domain classes. Object structuring criteria are used to determine the objects to be considered for the analysis model. A dynamic model is then developed in which the use cases from the requirements
that participate in each use case and how they interact with each other. I show how the use case interacts with the
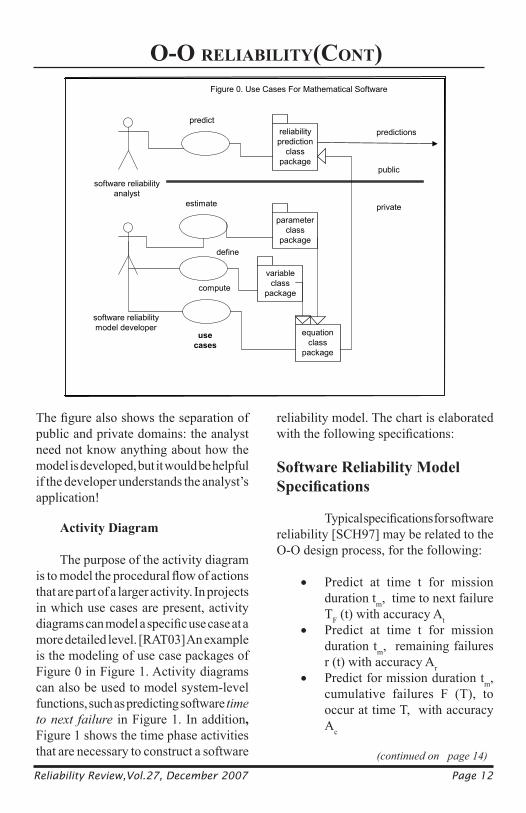
use cases in Figure 0.
O-O RELIABILITY(CONT)
Reliability Review,Vol.27, December 2007 Page 12
public and private domains: the analyst need not know anything about how the model is developed, but it would be helpful if the developer understands the analyst’s application!
The purpose of the activity diagram
that are part of a larger activity. In projects in which use cases are present, activity
more detailed level. [RAT03] An example is the modeling of use case packages of Figure 0 in Figure 1. Activity diagrams can also be used to model system-level functions, such as predicting software
in Figure 1. In additionFigure 1 shows the time phase activities that are necessary to construct a software
reliability model. The chart is elaborated
reliability [SCH97] may be related to the O-O design process, for the following:
Predict at time t for mission duration tm, time to next failure TF (t) with accuracy AtPredict at time t for mission duration tm, remaining failures r (t) with accuracy ArPredict for mission duration tm, cumulative failures F (T), to occur at time T, with accuracy Ac
Figure 0. Use Cases For Mathematical Software
software reliabilityanalyst
software reliabilitymodel developer
parameterclass
package
variableclass
package
equationclass
package
usecases
estimate
define
compute
private
public
predictreliabilityprediction
classpackage
predictions

Reliability Review,Vol. 27, December 2007 Page 14
O-O RELIABILITY(CONT)
collect failure data estimate model parameters select prediction model
time to next failure remaining failures cumulative failuress
make predictions 1
1
( ), ( ), ( )FT t r t F T
reliability predictions
a b
modelvalidated?
start
start
N
( ( ) ( ))( )
Definitions:
deploy softwareY
Figure 1. Software Reliability Activity Chart
( )FT tT i m e t o n e x t f a i l u r e ( s ) p r e d i c
t( )r t Remaining failures predicted at time t
Cumulative Number of Failures after time T F (T)a Failure rate at the beginning of interval sb Negative of derivative of failure rate divided by failure rate
s Starting interval for using observed failure data in parameter estimation
A (t) actual value of a software reliability quantityP (t) predicted value of a software reliability quantity
E prediction error limit
xk, Xs-1, Xs,t
xknumber of observed failures in interval
Xs-1 observed failure count in the range [1, 1]s
Xs,tobserved failure count in the range [ , ]s t
strategy patterns
in Figure 1 is implemented in Figure 2 in the form of the dependencies of objects and
provided an excellent roadmap for writing the C++ code shown in the Appendix.
The next step is to list the methods below, and to integrate the equation objects from Figure 2 with the methods that operate on them in Figure 3. The process culminates
in implementation of C++ code in the Appendix.
Collect software failure dataEstimate and specify software reliability model parametersPredict software reliability [SCH97]
Now I can move the logic of the software reliability model close to the coding stage, such as inputting and

Page 15 Reliability Review Vol. 27, December 2007
O-O RELIABILITY(CONT)
(continued on page 18)
outputting objects to and from the program, and initializing arrays. This I do in Figure 4. Then the C++ code can be developed for
Figure 2. Objects Hierarchy Chart
predictions
equations
variables
givenparameters
estimatedparameters
data
, , sa b
t
Ft T
TF(t) r (t) F (T)
,( ) [(log[ /( ( ))]) / ] ( 1)T t F X t sa a b b
Xs-1 Xs,t
Time to Next Failure (s)
( ) exp ( ( 1))r t t sa
bb
Remaining Failures
( 1)( ) ( / ) 1 T sF T e ba b+
1sX
Cumulative Failures
Definitions:( )r t Remaining failures predicted at time t
( )FT t Time to next failure(s) predicted at time ta Failure rate at the beginning of interval sb Negative of derivative of failure rate divided by failure rate s Starting interval for using observed failure data in parameter estimation
t Last interval of observed failure data
T Time of prediction
xk number of observed failures in interval observed failure count in the range [1, 1]s
1sX
,s tX observed failure count in the range [ , ]s t
C um ula tive N um b er o f F a ilu res a fte r tim e T F (T)
«requirement»r (t) , TF (t), and F (T): floating point and 6 charaters
alpha and beta: floating point and 6 charaterss, t, and T; floating point and 6 characters
xk, Xs-1, and Xs,t: floating point and 6 charaters
Objects
MethodsMethodsHierarchy
Chart
the time to next failure(s) predictions, in accordance with the quasi UML diagrams.

Reliability Excellence Begins with Relex®
Relex is the Name to Trust for Reliability Engineering ToolsSince 1986, Relex has been the software of choice for
reliability excellence. With thousands of users in wide-ranging
industries around the globe, Relex has earned the trust of
reliability professionals worldwide. From reliability analysis
software, to training, service and support, Relex Software is
the name to trust for all your reliability engineering needs.
Reliability Builds Trust
Relex Reliability StudioFault Tree/Event Tree
FMEA
FRACAS
Human Factors Risk Analysis
Life Cycle Cost
Maintainability
Markov
Optimization and Simulation
Reliability Block Diagram
Reliability Prediction
Weibull
excellence in reliability
Gaining and maintaining your customers’
trust is critical in today’s competitive,
global marketplace. That trust is built by
consistently providing reliable, quality
products that your customers depend upon.
That’s where Relex can help. Relex has
the tools you need to meet your reliability
objectives. From prediction analysis, to
complex system modeling, to FMEA and
FRACAS processes, Relex reliability software
provides a complete tool set for all your
reliability needs. Check out the tools trusted by reliability
professionals worldwide. Download our free
trial version or register for a free interactive
webinar at reliability.relex.com. Or call us
today at 724.836.8800 to get started.
reliability.relex.com
Reliability Review, Vol. 27, December 2007 Page 18
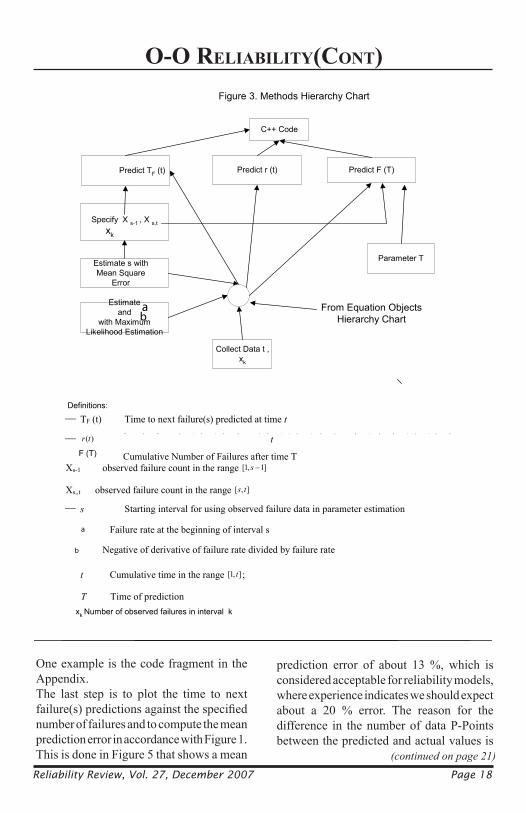
O-O RELIABILITY(CONT)Figure 3. Methods Hierarchy Chart
C++ Code
Predict TF (t)
Specify X s-1 , X s,t
Estimate s withMean Square
Error
Predict r (t)
Estimateand
with MaximumLikelihood Estimation
ab
Predict F (T)
Collect Data t ,xk
Parameter T
Definitions:
TF (t) Time to next failure(s) predicted at time t
( )r tR e m a i n i n g f a i l u r e s p r e d i c t e d
t
Cumulative Number of Failures after time T F (T)
Xs-1 observed failure count in the range [1, 1]s
Xs,,t observed failure count in the range [ , ]s t
s Starting interval for using observed failure data in parameter estimation
a Failure rate at the beginning of interval s
b Negative of derivative of failure rate divided by failure rate
t Cumulative time in the range [1, ]t ;
T Time of prediction
From Equation ObjectsHierarchy Chart
xk Number of observed failures in interval k
xk
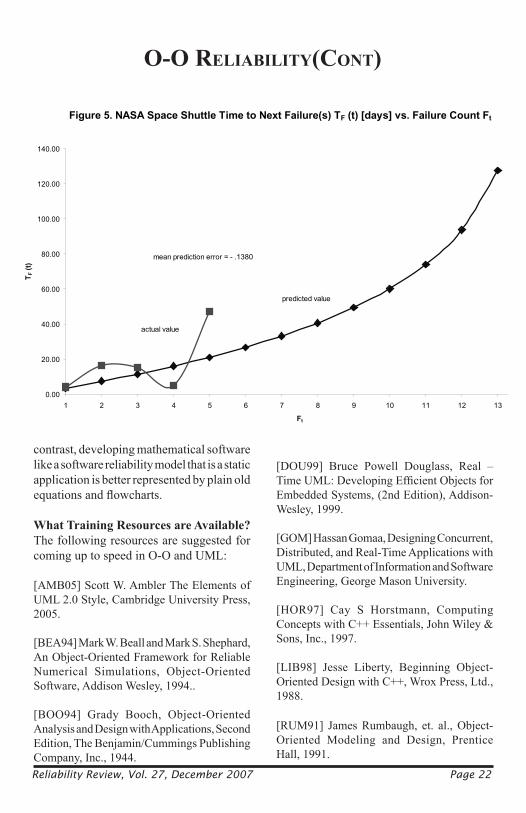
One example is the code fragment in the Appendix.The last step is to plot the time to next
number of failures and to compute the mean prediction error in accordance with Figure 1. This is done in Figure 5 that shows a mean
prediction error of about 13 %, which is considered acceptable for reliability models, where experience indicates we should expect about a 20 % error. The reason for the difference in the number of data P-Points between the predicted and actual values is
Page 19 Reliability Review Vol. 27,December 2007
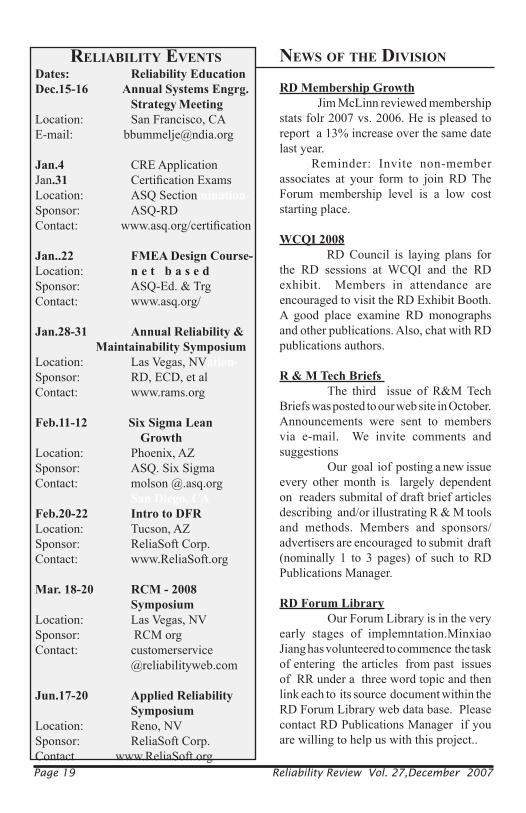
NEWS OF THE DIVISION
Jim McLinn reviewed membership stats folr 2007 vs. 2006. He is pleased to report a 13% increase over the same date last year.
Reminder: Invite non-member associates at your form to join RD The Forum membership level is a low cost starting place.
RD Council is laying plans for the RD sessions at WCQI and the RD exhibit. Members in attendance are encouraged to visit the RD Exhibit Booth. A good place examine RD monographs and other publications. Also, chat with RD publications authors.
The third issue of R&M Tech Briefs was posted to our web site in October. Announcements were sent to members via e-mail. We invite comments and suggestions
Our goal iof posting a new issue every other month is largely dependent on readers submital of draft brief articles describing and/or illustrating R & M tools and methods. Members and sponsors/ advertisers are encouraged to submit draft (nominally 1 to 3 pages) of such to RD Publications Manager.
Our Forum Library is in the very early stages of implemntation.Minxiao Jiang has volunteered to commence the task of entering the articles from past issues of RR under a three word topic and then link each to its source document within the RD Forum Library web data base. Please contact RD Publications Manager if you are willing to help us with this project..
Location: San Francisco, CAE-mail: [email protected]
CRE ApplicationJanLocation: ASQ Section -Sponsor: ASQ-RD
Location:Sponsor: ASQ-Ed. & Trg Contact: www.asq.org/
Location: Las Vegas, NV -Sponsor: RD, ECD, et alContact: www.rams.org
Location: Phoenix, AZSponsor: ASQ. Six SigmaContact: molson @.asq.org
Location: Tucson, AZSponsor: ReliaSoft Corp.Contact: www.ReliaSoft.org
Location: Las Vegas, NVSponsor: RCM orgContact: customerservice @reliabilityweb.com
Location: Reno, NVSponsor: ReliaSoft Corp.Contact www.ReliaSoft.org
RELIABILITY EVENTS
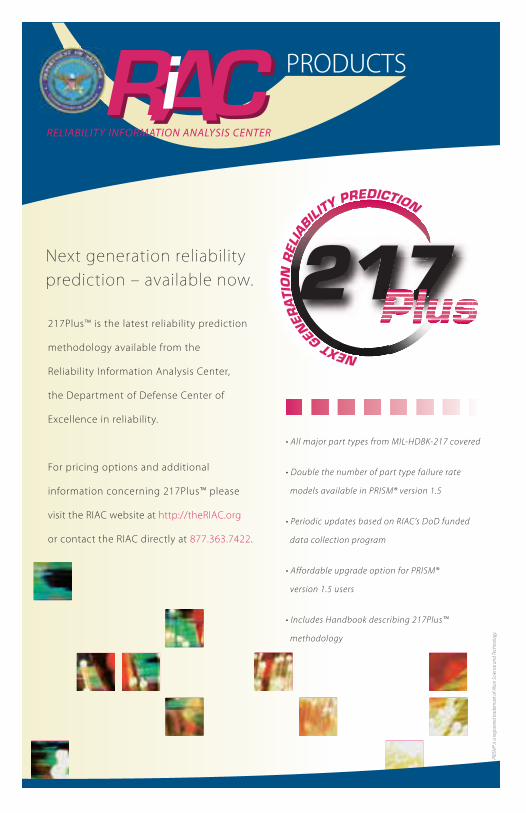
217Plus™ is the latest reliability prediction
methodology available from the
Reliability Information Analysis Center,
the Department of Defense Center of
Excellence in reliability.
For pricing options and additional
information concerning 217Plus™ please
visit the RIAC website at http://theRIAC.org
or contact the RIAC directly at 877.363.7422.
• All major part types from MIL-HDBK-217 covered
• Double the number of part type failure rate
models available in PRISM® version 1.5
• Periodic updates based on RIAC’s DoD funded
data collection program
• Affordable upgrade option for PRISM®
version 1.5 users
• Includes Handbook describing 217Plus™
methodology
NEXTG
ENERATIONRELIAB
ILITY
PREDICTION
PlusNext generation reliability prediction ‒ available now.
RACRACi PRODUCTS
RELIABILITY INFORMATION ANALYSIS CENTER
PRIS
M®
is a
reg
iste
red
tra
dem
ark
of A
lion
Sci
ence
an
d T
ech
no
log
y.

Page 21 Reliability Review Vol. 27, December 2007
O-O RELIABILITY(CONT)Figure 4. Structure Chart of Software Reliability Model
Initialize Arraysft, t
Estimate inSMERFS
,, , , s ts Xa bobjects
DeclareObjects,
Arrays, andDefine Files
,, , , , , ( )s t t Fs t X F T ta bobjects
Array: ft, t; Files: fp
Enter Objects
,, , , s ts Xa b
Enter Object Ft
,( )t s tF Xa
condition forsolution of TF (t)
Predict objectTF (t)
Y
Store TF (t) in Array tand Ft in Array ft
Write Arrays in Filefp
ft: 1 dimensiont: 1 dimension
TransferRead File fp and PlotTF (t) vs. Ft in Excel
Initialize Array Indicesand Output Count
stop
a failure rate at beginning of interval sDefinitions:
b negative of derivative of failure rate / failurerate
s starting interval for using observed failure data
Xs,t observed failure count in the range [s, t]Ft specified number of failures
TF (t) time to next failure predicted at time t
t last interval of observed data
Initialize Ft
IncrementArray Indicesand Output
Count
Transfer
start
SMERFS: SoftwareReliability Tool
NCompute
Prediction Errorin Excel
for the latter. In addition, it is important to explain that the predictions are made for a
this quantity is increased, the predicted time to this number of failures increases.
The following are suggestions for when
opposed to traditional methods. Consider using O_O and UML when your application
is dominated by a lot of activities and processes in the application. Web services are an excellent example of this type of application because there are interactions among service providers, web servers, and clients. Using O-O design and code produced from the design to model web server and client classes and objects would provide understandable representations of the real world. In addition, UML diagrams would have the capability of showing the interactions among the classes and objects. In
Reliability Review, Vol. 27, December 2007 Page 22
O-O RELIABILITY(CONT)
Figure 5. NASA Space Shuttle Time to Next Failure(s) TF (t) [days] vs. Failure Count Ft
0.00
20.00
40.00
60.00
80.00
100.00
120.00
140.00
1 2 3 4 5 6 7 8 9 10 11 12 13
Ft
T F (t
)
actual value
predicted value
mean prediction error = - .1380
contrast, developing mathematical software like a software reliability model that is a static application is better represented by plain old
The following resources are suggested for coming up to speed in O-O and UML:
[AMB05] Scott W. Ambler The Elements of UML 2.0 Style, Cambridge University Press, 2005.
[BEA94] Mark W. Beall and Mark S. Shephard, An Object-Oriented Framework for Reliable Numerical Simulations, Object-Oriented Software, Addison Wesley, 1994..
[BOO94] Grady Booch, Object-Oriented Analysis and Design with Applications, Second Edition, The Benjamin/Cummings Publishing Company, Inc., 1944.
[DOU99] Bruce Powell Douglass, Real –
Embedded Systems, (2nd Edition), Addison-Wesley, 1999.
[GOM] Hassan Gomaa, Designing Concurrent, Distributed, and Real-Time Applications with UML, Department of Information and Software Engineering, George Mason University.
[HOR97] Cay S Horstmann, Computing Concepts with C++ Essentials, John Wiley & Sons, Inc., 1997.
[LIB98] Jesse Liberty, Beginning Object-Oriented Design with C++, Wrox Press, Ltd., 1988.
[RUM91] James Rumbaugh, et. al., Object-Oriented Modeling and Design, Prentice Hall, 1991.

Page 23 Reliability Review Vol.27, December 2007
O-O RELIABILITY(CONT)[UML07] Unified Modeling Language: Superstructure, version 2.1.1, February 2007.
The following is a list of O-O and UML tools:
Eclipse: Open Source Tool with many code generators available for investigation, such as for C++.
Objecteering: Commercial UML tool, containing a Fortran code generator, designed to be more culturally acceptable
www.objecteering.com/
Lapack++ : is a version of Lapack adapted for C++, on linear algebrics. Provides an
As cited earlier, some authors believe models generated with O-O and UML lack comprehensibility [AGA99]. I disagree in part with because I found that UML diagrams provided a good view of the process of design involving the relationship, for example, between objects and methods However, it seems that the O-O paradigm may be too complex for mathematical software. For this software, there is probably no better model than the equation. On the positive side, I found that the UML diagrams provided a convenient way to integrate all of the details of the software reliability model design. But, I wonder whether another approach like structured design would not have provided at least equal capability.
APPENDIX
Software objects are conceptually similar to real-world objects: they consist of state and related behavior. An object
programming languages) and exposes its behavior through methods (functions in some programming languages). Methods operate on an object’s internal state and serve as the primary mechanism for object-to-object communication. Hiding internal state and requiring all interaction to be performed through an object’s methods is known as data encapsulation -- a fundamental principle of object-oriented programming.
Bundling code into individual software objects provides a number of advantages, including:
Modularity: The source code for an object can be written and maintained independently of the source code for other objects. Once created, an object can be easily passed around inside the system.
Information hiding: By interacting only with an object’s methods, the details of its internal implementation remain hidden from the outside world.
Code re-use: If an object already exists (perhaps written by another software developer), you can use that object in your program. This allows specialists to implement/test/debug
Reliability Review, Vol. 27, December 2007 Page 24
O-O RELIABILITY(CONT)can then trust to run in your own code.
Pluggability and debugging ease: If a particular object turns out to be problematic, you can simply remove it from your application and plug in a different object as its replacement. This is analogous
world. If a bolt breaks, you replace it, not the entire machine.
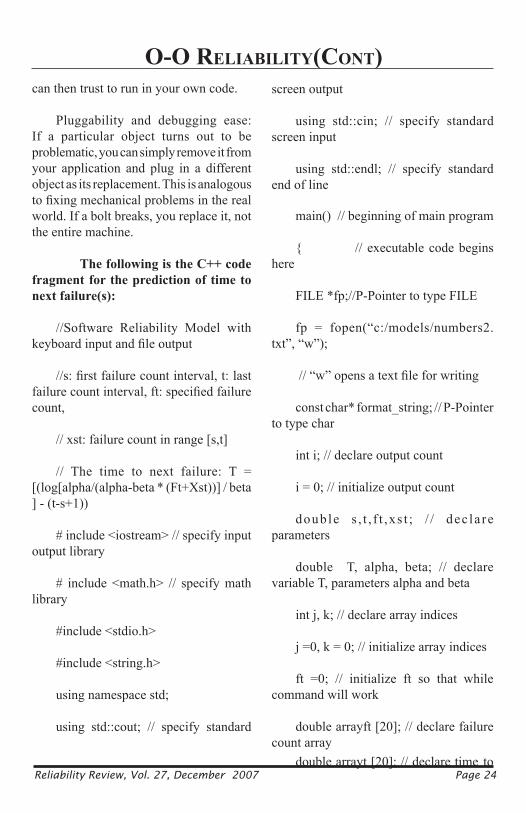
//Software Reliability Model with
count,
// xst: failure count in range [s,t]
// The time to next failure: T = [(log[alpha/(alpha-beta * (Ft+Xst))] / beta ] - (t-s+1))
# include <iostream> // specify input output library
# include <math.h> // specify math library
#include <stdio.h>
#include <string.h>
using namespace std;
using std::cout; // specify standard
screen output
using std::cin; // specify standard screen input
using std::endl; // specify standard end of line
main() // beginning of main program
{ // executable code begins here
FILE *fp;//P-Pointer to type FILE
fp = fopen(“c:/models/numbers2.txt”, “w”);
const char* format_string; // P-Pointer to type char
int i; // declare output count
i = 0; // initialize output count
double s , t , f t ,xs t ; / / dec la re parameters
double T, alpha, beta; // declare variable T, parameters alpha and beta
int j, k; // declare array indices
j =0, k = 0; // initialize array indices
ft =0; // initialize ft so that while command will work
double arrayft [20]; // declare failure count array
double arrayt [20]; // declare time to
Page 25 Reliability Review Vol. 27,December 2007
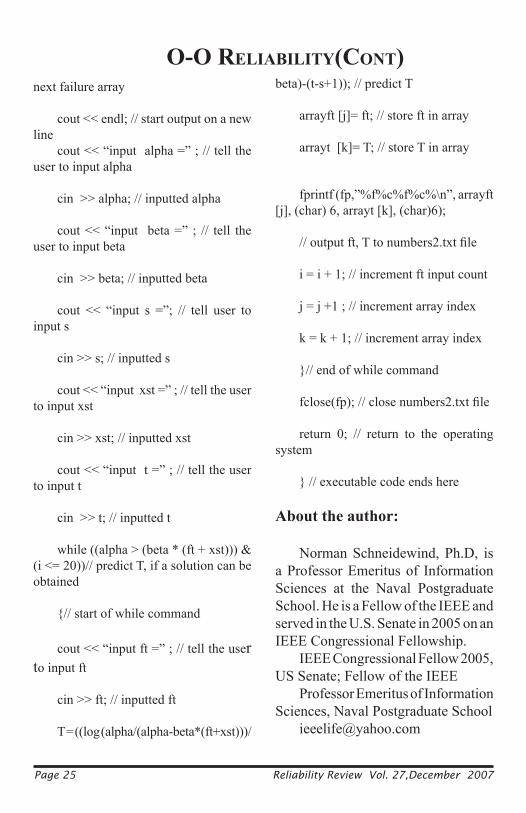
O-O RELIABILITY(CONT)next failure array
cout << endl; // start output on a new line
cout << “input alpha =” ; // tell the user to input alpha
cin >> alpha; // inputted alpha
cout << “input beta =” ; // tell the user to input beta
cin >> beta; // inputted beta
cout << “input s =”; // tell user to input s
cin >> s; // inputted s
cout << “input xst =” ; // tell the user to input xst
cin >> xst; // inputted xst
cout << “input t =” ; // tell the user to input t
cin >> t; // inputted t
while ((alpha > (beta * (ft + xst))) & (i <= 20))// predict T, if a solution can be obtained
{// start of while command
cout << “input ft =” ; // tell the userto input ft
cin >> ft; // inputted ft
T = ((log (alpha/(alpha-beta*(ft+xst)))/
beta)-(t-s+1)); // predict T
arrayft [j]= ft; // store ft in array
arrayt [k]= T; // store T in array
fprintf (fp,”%f%c%f%c%\n”, arrayft [j], (char) 6, arrayt [k], (char)6);
i = i + 1; // increment ft input count
j = j +1 ; // increment array index
k = k + 1; // increment array index
}// end of while command
return 0; // return to the operating system
} // executable code ends here
Norman Schneidewind, Ph.D, is a Professor Emeritus of Information Sciences at the Naval Postgraduate School. He is a Fellow of the IEEE and served in the U.S. Senate in 2005 on an IEEE Congressional Fellowship.
IEEE Congressional Fellow 2005, US Senate; Fellow of the IEEE
Professor Emeritus of Information Sciences, Naval Postgraduate School
Reliability Review,Vol. 27, December 2007 Page 26
CHAIR MESSAGE (CONT)corrected by companies or they don’t stay in business.
Walk out into the garage and look at the tools. There could be many battery driven screw drivers, wrenches and trimmers out there. Most are useful, lightweight and reliable. When was the last time you had a battery powered tool fail? There is enough competition here to keep the reliability high. Next, look at you car. You might have two, three, four or
functions. How do these perform versus expectations? Most newer cars are more reliable than older cars. They start and run better, because of reliable electronics. If there was a problem, we hear about it in the newspaper through a recall or warning. There is still enough competition that some car makers promote their reliability as a sales tool. Others emphasize styling, low price or even “zoom-zoom”. Again, competition and customer selection ensure that unreliable products disappear from the market. The same is true of companies that make the least reliable products. We see that happening every day. You can’t successfully market an unreliable product. There are magazines that regularly evaluate products and keep us advised on what they think is reliable. We remember the failures as spectacular.
computer on every desk and a stack of servers in a back room. All the computer hardware is very reliable. It has to be reliable for millions of dollars of corporate value ride on this system. Unreliable hardware is removed quickly because there is competition. The only problem at work is the all too frequent system
lock-up, system shut-down or mysterious system error caused by some well-known and faulty software. The software hasn’t noticeably improved over the years. We do hear about software problems regularly and patches come out several times a week. Failures make the news and reliable hardware is hardly mentioned. There may not be enough competition in the software market to drive reliability. When was the last time you were able to select your operating system? Who doesn’t want reliable software just like the hardware? The same is true of the software that runs all of our support devices. This might range from servers at work to the server farms the keep the world-wide web up and running. All of this is transparent to us most of the time because it seldom fails. We know when the web goes down and it can be costly. During this past summer one internet provided was off-line for almost 24 hours. We all heard about that and not about the other providers who work day after day.
Now here is a last area to ponder. The electrical power that runs most of our tools, our toys, our computers and even our alarm clocks comes to us 24/7. When was the last time you had a power outage at work or at home? Not the transient kind that last half a second and will merely upset a clock or computer, but rather, a real power outage that lasted more than a few minutes? You might have to think about that. Regular power is so reliable, that we take it for granted until it is gone. We count the up-time of electricity as 0.99999 or more. Five nines reliability is down 5 minutes a year. In most of the world, power outages can occur every
Page 27 Reliability Review Vol. 27, December 2007
CHAIR MESSAGE (CONT)
RAMS ProceedingsWe have a small supply of
proceedings from past Annual Reliability & Maintainability Symposiums on hand. RD members may purchased them at our greatly discounted price. $10.00 if delivery is to a USA address. $20.00 if delivery is to an address outside the USA.
day and last hours. In many countries this is the main impediment to economic progress. With out reliable power, no one wants to build a new factory, establish a call center, create a hospital or set up a design facility in that environment. The same is true of water. If you don’t have a plentiful supply of clean water, why build a factory, hospital or home there? We quickly know when we don’t have reliable utilities. Water reliability is more than 0.99999, we have it virtually all of the time for many years. Not having a safe water supply is so rare that every incident makes the national news.
Given the above, we have a basis for fully appreciating the world around us! Most products are reliable because the source producers face an informed and competitive marketplace. You can buy an item from supplier A or supplier B, so you look for the best value for yourself. Purchasers seek the most features for the lowest price. Reliability is one of the most important features of all products. We shop as wisely as the information allows. When there is little or no competition (choice), product or service reliability often suffers. This is evident in some countries that have national monopolies on their utilities. In these situations the utilities cost more and service is less reliable than where competition exists.
A vrey special case exists for products where it is essential that the product will not fail over the expected product life. We look for this level of reliability in some medical electronics (life support) just as we do in all bridges. A recent medical device has sustained 5 failures (all serious) out of a population
a very small failure rate, but still it may be too high for the market. A major bridge
and it is big news. This is only one failure out of a population of over 100,000 bridges in the US. Again, this calculates to a very low failure rate. We loudly hear about both situations, because the norm is not to expect either to fail . Now this is a wonderful reliability goal. Perhaps we can say the reliability goal in these situations is “NO FAILURES with 100% CONFIDENCE” over the product life in the use environment.
This might be our goal in every
as a quality statement when he said “the goal is zero defects”. In many areas we are slowly approaching that goal. Successes are quiet and failures are proclaimed. Be sure to surround yourself with quiet. Reliability Review articles provide tools for doing this..
Reliability Review, Vol. 27, December 2007 Page 28
RR BOOKSHELFBY H.W.WILLIAMS
Title: Lean MaintenancePrinciple Authors: Ricky Smith and Bruce HawkinsPublisher: Elsevier Butterworth-HeinemannCopyright: 2004 Elsevier Inc.ISBN: 0-7506-7779-1pp.287Elsevier website: www.bh.com
The authors of this text express their intent for it to be used as a stand alone teaching text for implementa-tion of Lean Enterprise principles to total productive maintenance... They view implementation of lean mainte-
the overall lean enterprise transfor-mation. Accordingly, they develop the perspective that a lean enterprise must have in place a lean mainte-nance operation (total productive maintenance) to effectively support lean manufacturing of product. In short, lean practices are waste elimi-nation and continuous improvement.
The presentation very effectively diseminates vital information neededto comprehend each of the following:
Historical background of the evo-lution of lean principles as indus-try has evolved the past 200 plus years.The important goals and objec-
enterprise purposes.Lean Maintenance as an impor-tant component of Lean Manu-facturing.Reliability Centered Maintenance as the key technical rationale and economic basis for attaining the most cost effective maintenance in support of the mission.A management plan for lean maintenance.Implementation strategy and tac-tics.Tools for Continuous Improve-ment to sustain long term execu-tion.An extensive appendix (over 100 pages) containing forms and doc-
Page 29 Reliability Review Vol. 27, December 2007
during this effort can contribute to the disciplined assessment of weaknesses.disclosed during the testing. Potential failure modes may then be addressed in the FMEA s as the new Demonstration Vehicles are delivered and monitored. It is such attention to detail and disciplined analysis of recorded results test that leads to real gains in reliability, durability and safety.
Fuel cell technology is more than halfway to such key milestones to be met by 2010 as: Power Density of 2500 Watts per stack; Stack Life Durability of 5000 hours; and Cost of $30.00 per kilowatt (net). Many cities in the USA and other countries are engaged in the buildout of hydrogen fueling stations. Buses continue to be added by transportation authorities in several cities and more are on the way. Auto manufacturers are into the fourth generation demonstration model fuel cell powered vehicles deployment to individuals and select municipalites on subsidized lease programs. Preferred sources of hydrogen fuel are: Electrolysis of Water using solar and wind power; Methane via biomass primarily from cattle manure and agricultural sources. However, at the present time most is obtained from hydrocarbon fuels such as natural gas or methanol.
EDITORIAL: FUEL CELLS (CONT)RR BOOKSHELF (CONT)
uments useful in the imple-mentation of the program at all levels.
The seven chapters that comprise the body of this text are concise. They contain a logical development and ex-position on the subject. In addition, all important elements are clearly ex-plained and illustrated.
The authors’ depth of knowledge and breadth of their practical experi-ence is particularly apparent in the chapters delineating the process for transformation from traditional To-tal Productive Maintenance to Lean Maintenance
Many practical tools are present-ed and illustrated. They cover process analysis, equipment reliability engi-neering, criticality assessment, failure analysis, problem solving and correc-tive action, and evaluating effective-ness, and optimization of the entire program. The articles by Ricky Smith found in Appendix C will be of inter-est to many readers.
I recommend this text as a valu-able reference and for the library of all R & M professionals, systems engi-neers and quality engineers.
Reliability Review,Vol. 27, December 2007 Page 30
RELIABILITY DIVISION MONOGRAPHS ARE DESCRIBED ON ADJACENT PAGES
WITHIN THIS ISSUE OF RELIABILTY REVIEW. THEY ARE CURRENTLY AVAILABLE
AND EACH LISTED ON THE ORDER FORM BELOW FOR YOUR CONVENIENCE.PLEASE INDICATE QUANTITY DESIRED OF EACH SELECTION,
TIMES PRICE EACH AND SUM COLUMN FOR SUB-TOTAL. ADD DELIVERY CAHRGES
AND COMPUTE AMOUNT TO BE REMITTED WITH YOUR ORDER:
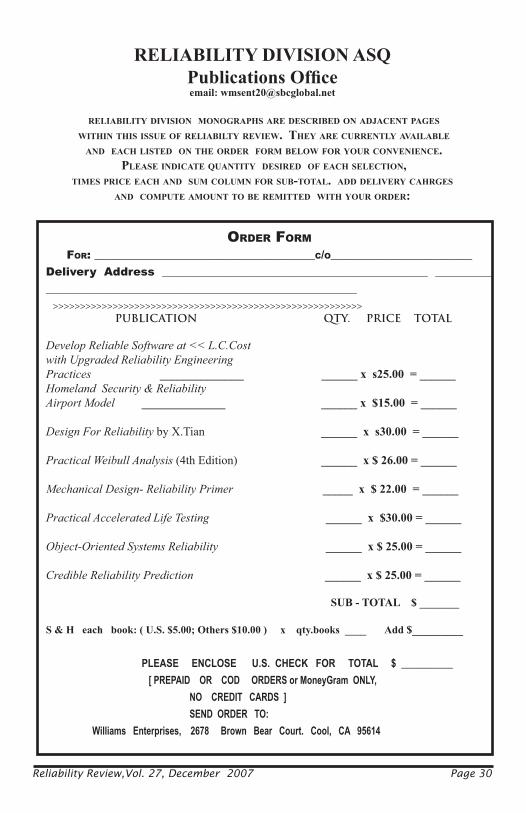
ORDER FORMFOR: _______________________________________C/O_________________________
Delivery Address _______________________________________________ _________________________________________________________________ >>>>>>>>>>>>>>>>>>>>>>>>>>>>>>>>>>>>>>>>>>>>>>>>>>>>>>>>>
PUBLICATION QTY. PRICE TOTAL
by X.Tian
(4th Edition)
__
______
PLEASE ENCLOSE U.S. CHECK FOR TOTAL $ __________ [ PREPAID OR COD ORDERS or MoneyGram ONLY,
NO CREDIT CARDS ] SEND ORDER TO: Williams Enterprises, 2678 Brown Bear Court. Cool, CA 95614
Page 31 Reliability Review Vol.27, December 2007
R & M Monographs
Mechanical Design - Reliability Primerby James A. McLinn, Fellow, ASQ
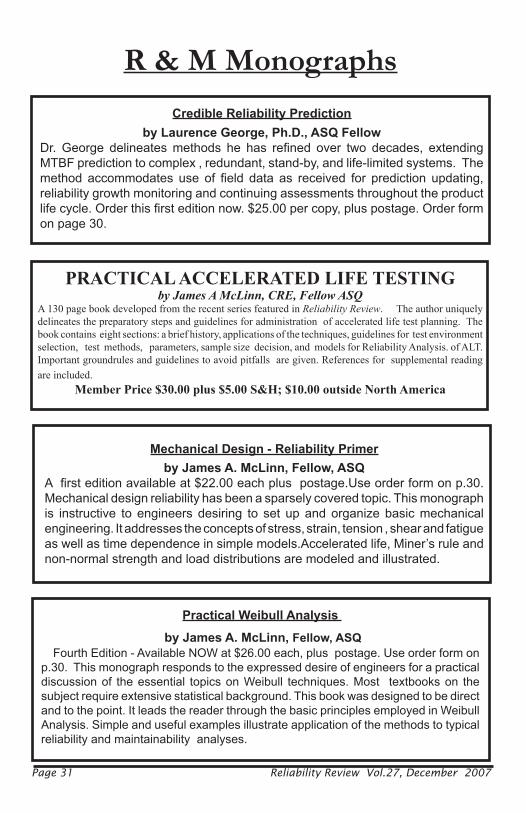
Mechanical design reliability has been a sparsely covered topic. This monograph is instructive to engineers desiring to set up and organize basic mechanical engineering. It addresses the concepts of stress, strain, tension , shear and fatigue as well as time dependence in simple models.Accelerated life, Miner’s rule and non-normal strength and load distributions are modeled and illustrated.
Practical Weibull Analysis
by James A. McLinn, Fellow, ASQ
p.30. This monograph responds to the expressed desire of engineers for a practical discussion of the essential topics on Weibull techniques. Most textbooks on the subject require extensive statistical background. This book was designed to be direct and to the point. It leads the reader through the basic principles employed in Weibull Analysis. Simple and useful examples illustrate application of the methods to typical reliability and maintainability analyses.
Credible Reliability Predictionby Laurence George, Ph.D., ASQ Fellow
MTBF prediction to complex , redundant, stand-by, and life-limited systems. The
reliability growth monitoring and continuing assessments throughout the product
on page 30.
by James A McLinn, CRE, Fellow ASQA 130 page book developed from the recent series featured in Reliability Review. The author uniquely delineates the preparatory steps and guidelines for administration of accelerated life test planning. The book contains eight sections: a brief history, applications of the techniques, guidelines for test environment selection, test methods, parameters, sample size decision, and models for Reliability Analysis. of ALT. Important groundrules and guidelines to avoid pitfalls are given. References for supplemental reading are included.

Reliability Review,Vol. 27,December 2007 Page 32
Dr.Schneidewind’s model presented in this monograph addresses the airport security
or management action to close the security loopholes. Model quantitative results are used to delineate the implications for changes in security policy at the nation’s airports. The work presents solutions which may be extended to other security settings.
This monograph is sponsored by the Reliability Division, ASQ. Purchase it directly from: Williams Enterprises. 2678 Brown Bear Ct., Cool, CA 95614.
by Norman F. Schneidewind, Ph.D. with related articles by Samuel J.Keene, Ph.D.
The contents of this publication are intended to present for software engineers, reliabilty engineers and software quality specialists, and managers practical tools and methods which the authors have perfected and applied in a broad range of enterprises. The topics covered include strategy and tactics for improvement of the software engineering process , software reliability models, development of trustworthy code, and reliability assessment throughout the product life cycle.
Available for purchase now: Price is $25.00.Williams Enterprises
2678 Brown Bear Court, Cool, CA 95614
R & M Monographs
A new monograph published July 2007. This book contains the entire series written over the past eighteen months by Dr. Tian plus much more. The Design for Reliability monograph describes the primary elements of a project implementing design rules, practices and methods to achieve high reliabilty goals. The additional chapters present relatevant material by Drs. Larry George, Sam Keene, plus Trevor Craney, and James McLinn. The contents offer a practical Benchmark resource for reliabilty and maintainability engineers. Member Price is $30.00
RELIABILITY DIVISIONAmerican Society for Quality
www.asq.org/reliability/The RELIABILITY DIVISION is a major professional specialty association within the framework of the American Society for Quality. Its members have a particular expertise and interest in reliaiblity and related disciplines. Division activities are concerned with reliability, maintainability, quality, safety, and effectiveness of products, processes, and services and with related topics such as product liability and risk management.
Any ASQmember may choose to become a division member. Annual dues for the Reliability Division is $9.00. Members receive the Reliability ReviewDivision activities provides excellent and unique opportunities for professional growth and service.
COUNCIL OFFICERS (2007-2008)
1REGIONAL COUNCILORS
H.M. Wadsworth, Ph.D.660 Valley Green Dr. N.E.
Atlanta, GA 30342(404) 255-8662
TBD
Tim YaworskiBusiness Analyst-6Sigma
Dominion ExplorationCalgary, Alberta T3J 4P8
(403) 650-0254Tim_.Yaworski@dom.
Hugh Broome3 Sweetwater Dr.
Johnson City, TN 37615(423) 439-7817
John A. Miller6202 Sonoma Drive
Huntington Beach, CA 92647(714) 842-4776
Hugh Broome3 Sweetwater Dr.
Johnson City, TN 37615(423) 439-7817
Sailesh Kapadia2553 Glenwood Dr.Wexford, PA 15090
(724) [email protected]
Fred Schenkelberg15466 Los Gatos,Blvd..Los Gatos, CA 95032
(408)[email protected]
Mike Malcos, MS58C.S. Draper Lab
555 Technology Sq.,Cambridge, MA 02139
(617) [email protected]
James Chris DeepakHalliburton
Houston, TX 77032(281) 871-7128
David Auda50 North Forest Rd.
Williamsville, NY 14221(716) 686-1548
Rajinder KapurQ. Mgr. Gehring Group
179 Pheasant RunTroy, MI 48098(248) 703-7148
Dawn OnalfoSBC Services Inc.
3080 Mills Dr.Brentwood, CA 94513
(925) 824-6988
Deepak Dave Kansas City, MO 64153
(816) [email protected]
Ken SchmidtOptim Associates Inc.
www.opticorp.com877-332-7475
ken.schmidt@optimcorp.
Brad NelsonNetco G.S.,Sre 250
13665 Dulles Tech.Dr.Herndon, VA 20171
(703) [email protected]
TreasurerDavid Auda
50 North Forest Rd.Williamsville, NY 14221
(716) [email protected]
L.M. (Woody) Rabon916 Leyland Drive
Florence, SC 2 9501(843) 662-9557
Deepak DaveHarleyy Davidson Mtr. Co.
Kansas City, MO 64153 (816) 270-8771
Glenn Gee2042 Parkside Dr.
Columbus, IN 47203(812) 841-6018
Fred SmithTyco Electronics Corp.
Dir. U.S. Engineering Assur.Harrisburg, PA 17105
(717) 810-3324fdsmith@tycoelectronics.
Chair
James McLinn10644 Ginseng Ln.
Hanover, MN 55341 (763) [email protected]
John Bowles,, Ph.D.Univ. of South Caarolina
(803) [email protected]
Postage P
aid at Auburn, C
A and
NO
N-P
RO
FIT
OR
G.
U.S
.PO
STA
GE
PA
IDA
UB
UR
N, C
A 95603
PE
RM
IT N
O.128
POSTM
ASTER
: Send Address C
hanges
(PS Form 3547) to:
Am
erican Society for Quality
P.O.B
ox 3005
MILW
AU
KE
E, W
I 53201-3005
PUB
LISH
ER
: WIL
LIA
MS E
NT
ER
PRISE
S
Reliability R
eviewT
HE
TE
CH
NIC
AL
FOR
UM
FOR
EN
GIN
EE
RS,
PRO
FESSIO
NA
LS
EN
SUR
ING
EX
CE
LL
EN
CE
IND
ESIG
N ,D
EV
EL
OPM
EN
TA
ND
PRO
DU
CT
ION
OF
SYST
EM
S ,C
OM
PON
EN
TS,
MA
TE
RIA
LS,
SOFT
WA
RE,
PRO
DU
CT
SA
ND
SER
VIC
ES
AC
HIE
VIN
GSIX
SIGM
ASY
STE
MS
TH
RO
UG
H
STR
AT
EG
ICD
EPL
OY
ME
NT
OF
RE
LIA
BIL
ITY,
AV
AIL
AB
ILIT
Y,D
EPE
ND
AB
ILIT
YM
AIN
TAIN
AB
ILIT
Y,
Postage P
aid at Auburn, C
A and
NO
N-P
RO
FIT
OR
G.
U.S
.PO
STA
GE
PA
IDA
UB
UR
N, C
A 95603
PE
RM
IT N
O.128
POSTM
ASTER
: Send Address C
hanges
(PS Form 3547) to:
Am
erican Society for Quality
P.O.B
ox 3005
MILW
AU
KE
E, W
I 53201-3005
PUB
LISH
ER
: WIL
LIA
MS E
NT
ER
PRISE
Sfor R
eliability Divisiom
, ASQ
Reliability R
eviewT
HE
TE
CH
NIC
AL
FOR
UM
FOR
EN
GIN
EE
RS,
PRO
FESSIO
NA
LS
EN
SUR
ING
EX
CE
LL
EN
CE
IND
ESIG
N ,D
EV
EL
OPM
EN
TA
ND
PRO
DU
CT
ION
OF
SYST
EM
S ,C
OM
PON
EN
TS,
MA
TE
RIA
LS,
SOFT
WA
RE,
PRO
DU
CT
SA
ND
SER
VIC
ES
AC
HIE
VIN
GSIX
SIGM
ASY
STE
MS
TH
RO
UG
H
STR
AT
EG
ICD
EPL
OY
ME
NT
OF
RE
LIA
BIL
ITY,
AV
AIL
AB
ILIT
Y,D
EPE
ND
AB
ILIT
YM
AIN
TAIN
AB
ILIT
Y,SY
STE
MS
EN
GIN
EE
RIN
G,R
ISKM
AN
AG
EM
EN
T,SY
STE
MS
SAFE
TY