Relative Contributions of Burst and Tonic Responses to …shermanlab.uchicago.edu/files/RP99.pdf ·...
13
JOURNALOFNEUROPHYSIOLOGY Vol. 68, No. 6, December 1992. Printed in U.S.A. Relative Contributions of Burst and Tonic Responses to the Receptive Field Properties of Lateral Geniculate Neurons in the Cat WILLIAM GUIDO, SHAO-MING LU, AND S. MURRAY SHERMAN Department of Neurobiology, State University of New York, Stony Brook, New York 11794-5230 SUMMARY AND CONCLUSIONS 1. In an anesthetized, paralyzed in vivo preparation, we re- corded extracellular responses of 6 1 geniculate neurons (2 W, 25 X, 33 Y, and 1 mixed) to drifting sine-wave gratings of various spatial frequency, temporal frequency, and contrast. Our goal was to study the differential contributions to these visual responses of bursting caused by voltage dependent, low-threshold (LT) Ca2’ spikes and of purely tonic responses unrelated to LT spikes. Cells responding with LT spikes are said to be in the burst firing mode and those responding in a purely tonic fashion to be in the relay or tonic firing mode. We separated the total visual response into LT burst and tonic components by use of the empirical criteria set forth in our intracellular study described in the previous paper (Lu et al. 1992). A response component was considered to be an LT burst if its action potentials displayed interspike intervals 54 ms and if the first spike in the burst episode occurred after a silent period of 2 100 ms (or 250 ms when the neuron responds to visual stimuli at temporal rates r8 Hz). All other activity is considered to be part of the tonic response. 2. In addition to LT bursts, we recognized another type of burst response, the high-threshold (HT) burst. These also have clusters of action potentials with interspike intervals 54 ms. However, HT bursts, unlike LT bursts, lack a preburst silent period. HT bursts are part of the tonic response component and merely reflect the gradual decrease in interspike intervals that occurs as the cell be- comes more depolarized and thus more responsive. Thus inter- spike interval is a necessary but insufficient criterion to identify LT bursts. 3. Visually evoked LT bursts were recorded among W, X, and Y cells. When evoked, LT bursts occurred in phase with drifting sine-wave grating stimuli at a rate never exceeding one per stimu- lus cycle. In response to individual cycles of the visual stimulus, LT bursts could comprise the total response, a tonic component could comprise the total response, or an LT burst and tonic com- ponent could be mixed. When a stimulus evoked a mixture of LT bursts and tonic response components, LT bursts were always the first response. 4. Of the 6 1 cells tested with grating stimuli, 47 exhibited LT bursts and 14 did not. Those that did exhibited varying amounts of burstiness. We occasionally recorded individual cells for a suffi- ciently lengthy period to observe them switch between the burst and tonic firing modes. We conclude that most cells have mem- brane potentials close to the level needed for LT spike deinactiva- tion and that small fluctuations in membrane voltage can switch them between these response modes. We also occasionally re- corded several cells simultaneously and noted that different cells could be in different modes. This implies that whatever afferent pathways control response modes need not act globally on all ge- niculate neurons. 5. Two indexes were used to express the variation of LT bursti- ness. For the first index, an LT burst ratio was determined for each cell by separating the total visual response into LT burst and tonic components and calculating the fundamental (Fl ) Fourier re- sponse amplitude for each. Once separated, we divided the Fl amplitude of the LT burst component by the sum of Fl ampli- tudes of the LT burst and tonic components. The other index was the percentage of stimulus cycles that elicit LT bursts. This percent- age was computed by inspecting the response to each stimulus cycle and determining the presence or absence of an LT burst. The indexes were highly correlated (r = 0.93)) and both showed that LT bursts represent a variable proportion of the total response from barely detectable for some cells to the vast majority of the response for others. The proportion of cells exhibiting LT bursts was slightly higher for Y cells (88%) than for X cells (64%). 6. Inspection of average response histograms indicated that the LT burst component added a substantial nonlinearity to the visual response. As a measure of nonlinearity, we used the second Fou- rier harmonic (F2) component of the response and computed an F2-to-F1 ratio. For every neuron tested, this ratio was larger for the LT burst than the tonic response component. Thus LT bursts seem to distort visual responses by making them less linear. 7. To test for the possibility that the amount of LT bursting may vary with stimulus strength, we generated response-versus- spatial frequency functions for 35 neurons and response-versus- contrast response functions for 15 neurons. The extent of LT bursting seen in cells did not vary significantly with spatial fre- quency or contrast; that is, the proportion of LT bursting in the total response was no more prevalent at one spatial frequency or contrast than another. Thus LT bursts do not appear to provide a selective nonlinear response amplification for weak or less salient stimuli. 8. To test for the possibility that LT bursting may vary with temporal frequency, we generated response-versus-temporal fre- quency functions (at optimal spatial frequency) for 17 neurons. We found a progressive increase in the LT burst ratio with increas- ing temporal frequency. 9. As noted, we found that LT bursts occurred earlier in the response cycle than did the tonic response components. We used the response-versus-temporal frequency functions of 10 cells to examine whether these temporal differences reflect phase and/or latency differences. The latencies of the two components were virtually identical, but the LT bursts were evoked by an earlier phase of the stimulus than was the tonic response component. We thus conclude that the temporal difference between the LT burst and tonic response components was due primarily to phase and not to latency. 10. We conclude that LT spikes contribute to the transfer of visual signals through the lateral geniculate nucleus to visual cor- tex. They do not represent an obligatory disconnection of thala- mic relay cells from their sensory inputs. Instead, they can provide a nonlinear amplification that permits hyperpolarized relay cells to signal cortex about the presence of a salient stimulus. 0022-3077/92 $2.00 Copyright 0 1992 The American Physiological Society 2199
Transcript of Relative Contributions of Burst and Tonic Responses to …shermanlab.uchicago.edu/files/RP99.pdf ·...
JOURNALOFNEUROPHYSIOLOGY Vol. 68, No. 6, December 1992. Printed in U.S.A.
Relative Contributions of Burst and Tonic Responses to the Receptive Field Properties of Lateral Geniculate Neurons in the Cat
WILLIAM GUIDO, SHAO-MING LU, AND S. MURRAY SHERMAN Department of Neurobiology, State University of New York, Stony Brook, New York 11794-5230
SUMMARY AND CONCLUSIONS
1. In an anesthetized, paralyzed in vivo preparation, we re- corded extracellular responses of 6 1 geniculate neurons (2 W, 25 X, 33 Y, and 1 mixed) to drifting sine-wave gratings of various spatial frequency, temporal frequency, and contrast. Our goal was to study the differential contributions to these visual responses of bursting caused by voltage dependent, low-threshold (LT) Ca2’ spikes and of purely tonic responses unrelated to LT spikes. Cells responding with LT spikes are said to be in the burst firing mode and those responding in a purely tonic fashion to be in the relay or tonic firing mode. We separated the total visual response into LT burst and tonic components by use of the empirical criteria set forth in our intracellular study described in the previous paper (Lu et al. 1992). A response component was considered to be an LT burst if its action potentials displayed interspike intervals 54 ms and if the first spike in the burst episode occurred after a silent period of 2 100 ms (or 250 ms when the neuron responds to visual stimuli at temporal rates r8 Hz). All other activity is considered to be part of the tonic response.
2. In addition to LT bursts, we recognized another type of burst response, the high-threshold (HT) burst. These also have clusters of action potentials with interspike intervals 54 ms. However, HT bursts, unlike LT bursts, lack a preburst silent period. HT bursts are part of the tonic response component and merely reflect the gradual decrease in interspike intervals that occurs as the cell be- comes more depolarized and thus more responsive. Thus inter- spike interval is a necessary but insufficient criterion to identify LT bursts.
3. Visually evoked LT bursts were recorded among W, X, and Y cells. When evoked, LT bursts occurred in phase with drifting sine-wave grating stimuli at a rate never exceeding one per stimu- lus cycle. In response to individual cycles of the visual stimulus, LT bursts could comprise the total response, a tonic component could comprise the total response, or an LT burst and tonic com- ponent could be mixed. When a stimulus evoked a mixture of LT bursts and tonic response components, LT bursts were always the first response.
4. Of the 6 1 cells tested with grating stimuli, 47 exhibited LT bursts and 14 did not. Those that did exhibited varying amounts of burstiness. We occasionally recorded individual cells for a suffi- ciently lengthy period to observe them switch between the burst and tonic firing modes. We conclude that most cells have mem- brane potentials close to the level needed for LT spike deinactiva- tion and that small fluctuations in membrane voltage can switch them between these response modes. We also occasionally re- corded several cells simultaneously and noted that different cells could be in different modes. This implies that whatever afferent pathways control response modes need not act globally on all ge- niculate neurons.
5. Two indexes were used to express the variation of LT bursti- ness. For the first index, an LT burst ratio was determined for each cell by separating the total visual response into LT burst and tonic
components and calculating the fundamental (Fl ) Fourier re- sponse amplitude for each. Once separated, we divided the Fl amplitude of the LT burst component by the sum of Fl ampli- tudes of the LT burst and tonic components. The other index was the percentage of stimulus cycles that elicit LT bursts. This percent- age was computed by inspecting the response to each stimulus cycle and determining the presence or absence of an LT burst. The indexes were highly correlated (r = 0.93)) and both showed that LT bursts represent a variable proportion of the total response from barely detectable for some cells to the vast majority of the response for others. The proportion of cells exhibiting LT bursts was slightly higher for Y cells (88%) than for X cells (64%).
6. Inspection of average response histograms indicated that the LT burst component added a substantial nonlinearity to the visual response. As a measure of nonlinearity, we used the second Fou- rier harmonic (F2) component of the response and computed an F2-to-F1 ratio. For every neuron tested, this ratio was larger for the LT burst than the tonic response component. Thus LT bursts seem to distort visual responses by making them less linear.
7. To test for the possibility that the amount of LT bursting may vary with stimulus strength, we generated response-versus- spatial frequency functions for 35 neurons and response-versus- contrast response functions for 15 neurons. The extent of LT bursting seen in cells did not vary significantly with spatial fre- quency or contrast; that is, the proportion of LT bursting in the total response was no more prevalent at one spatial frequency or contrast than another. Thus LT bursts do not appear to provide a selective nonlinear response amplification for weak or less salient stimuli.
8. To test for the possibility that LT bursting may vary with temporal frequency, we generated response-versus-temporal fre- quency functions (at optimal spatial frequency) for 17 neurons. We found a progressive increase in the LT burst ratio with increas- ing temporal frequency.
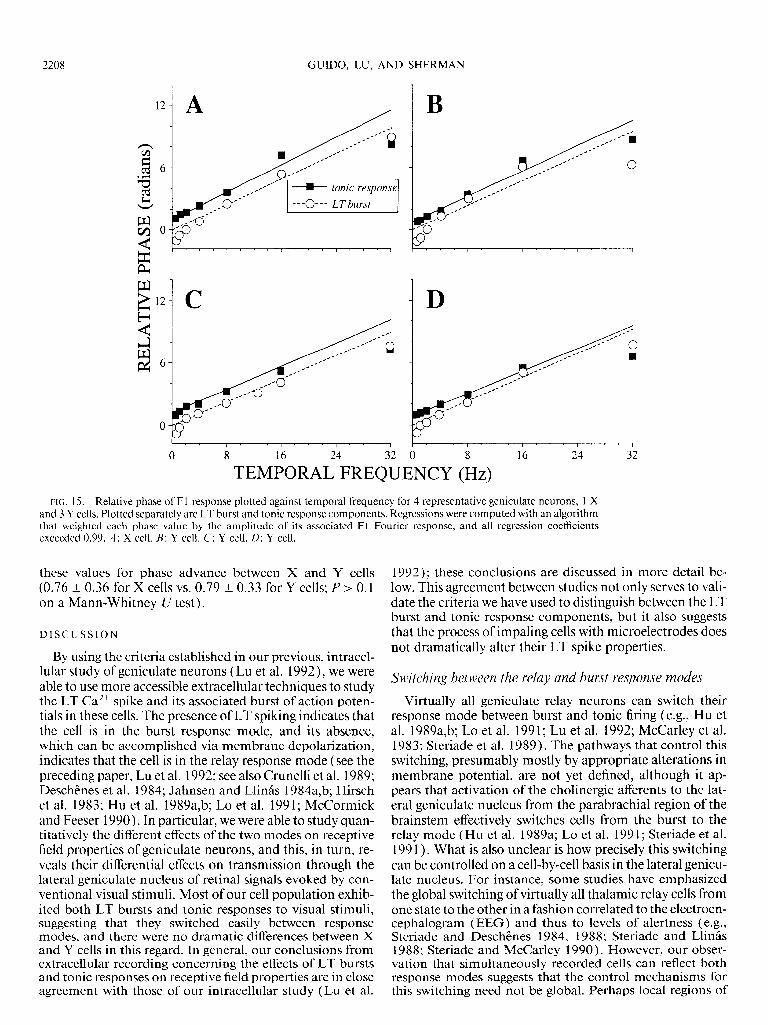
9. As noted, we found that LT bursts occurred earlier in the response cycle than did the tonic response components. We used the response-versus-temporal frequency functions of 10 cells to examine whether these temporal differences reflect phase and/or latency differences. The latencies of the two components were virtually identical, but the LT bursts were evoked by an earlier phase of the stimulus than was the tonic response component. We thus conclude that the temporal difference between the LT burst and tonic response components was due primarily to phase and not to latency.
10. We conclude that LT spikes contribute to the transfer of visual signals through the lateral geniculate nucleus to visual cor- tex. They do not represent an obligatory disconnection of thala- mic relay cells from their sensory inputs. Instead, they can provide a nonlinear amplification that permits hyperpolarized relay cells to signal cortex about the presence of a salient stimulus.
0022-3077/92 $2.00 Copyright 0 1992 The American Physiological Society 2199
2200 GUIDO, LU, AND SHERMAN
INTRODUCTION
Relay neurons of the lateral geniculate nucleus in the cat generate action potentials in one of two distinct modes: the tonic or relay mode, in which action potentials occur inde- pendently of one another; and the burst mode, in which two to seven action potentials cluster together as a high-fre- quency (250-400 Hz) discharge separated by a variable si- lent period (see the preceding paper, Lu et al. 1992; see also Crunelli et al. 1989; Hirsch et al. 1983; Hu et al. 1989a,b; Lo et al. 199 1; McCarley et al. 1983; McCormick and Feeser 1990; Steriade and Llinas 1988). Burst firing is due to a barrage of action potentials riding the crest of a large Ca2+ conductance activated at hyperpolarized membrane potentials (Crunelli et al. 1989; Deschenes et al. 1984; Jahnsen and Llinas 1984a,b). It is called a low-threshold (LT) spike or burst because its threshold for activation is lower than that of conventional action potentials. Tonic firing occurs when suprathreshold excitatory postsynaptic potentials (EPSPs) produce a train of action potentials.
Our goal has been to understand how the relay and burst response modes contribute to the receptive field properties of geniculate neurons. As a first step, we used in vivo intra- cellular recording techniques to monitor visual responses of geniculate cells (Lu et al. 1992). Intracellular recording of visual responses allowed us to verify the presence and volt- age dependency of LT spikes. This required that we con- duct lengthy, stable intracellular recordings so as to moni- tor visual responses at many different membrane poten- tials. Although we recorded intracellularly from numerous cells, we often found it technically difficult to maintain stable recording long enough to fully assess the voltage de- pendency of responses to various visual stimuli. Thus our intracellular results are based on a limited number of neu- rons. Nonetheless, we learned from an analysis of the tem- poral pattern of action potentials recorded during the gener- ation of LT spikes that we could readily distinguish LT bursts from tonic activity (Lu et al. 1992). Such a character- ization enables the use of extracellular recording techniques to study role of LT bursting. With extracellular recordings, we can readily achieve the lengthy recordings needed for a more quantitative analysis of the contribution of the LT burst and tonic response component to visual processing. In this paper, we report the results of such an experiment.
METHODS
We recorded extracellularly from neurons in the A- and C-lam- inae of the cat’s lateral geniculate nucleus. All methods for surgical preparation, electrophysiological recording, and receptive field analysis were identical to those reported in the previous paper (Lu et al. 1992; see also Bloomfield et al. 1987; Bloomfield and Sher- man 1988; Lo et al. 1991).
RESULTS
We recorded extracellular activity from 6 1 geniculate neurons. Of these, three were located in the C-laminae (2 W cells and 1 Y cell). The remainder were all located in the A-laminae. Among these, we identified 25 X cells, 32 Y cells, and 1 mixed cell. The mixed cell responded in an X-like manner on some tests and Y-like on others. We stud- ied the responses of all 6 1 cells to drifting sine-wave gratings
that varied in spatial frequency, temporal frequency, and contrast.
A main purpose of this study was to describe the contri- bution of LT bursts in response to visual stimuli. We were able to identify these bursts’ during extracellular recording by adopting the empirical criteria set forth in our intracellu- lar study described in the preceding paper (Lu et al. 1992). We shall briefly reiterate these criteria here. A response epi- sode is deemed to be an LT burst if its component spikes display interspike intervals r4 ms and if the first spike in the burst episode occurs after a silent period; this requisite silent period is > 100 ms except when the cell is responding to stimuli at temporal rates 28 Hz, at which time the requi- site silent period is 250 ms. All other response episodes are considered to be part of the tonic response component. We recognize a different type of burst, the “HT burst,” which is distinguished by interspike intervals 14 ms and a preceding silent period of 5 100 ms, or 250 ms in response to tem- poral frequencies r8 Hz. The HT burst is part of the tonic response component (Lu et al. 1992). As noted in the pre- ceding paper (Lu et al. 1992), the LT burst is due to a barrage of action potentials riding the crest of a large Ca2+ conductance activated from hyperpolarized membrane po- tentials, whereas the HT burst reflects the gradual decrease in interspike intervals as the cell becomes more depolarized and thus more responsive. The LT burst is said to be “low threshold” because it is elicited at relatively hyperpolarized membrane potentials, whereas the HT burst is “high thresh- old” because it requires more depolarization to be seen.
Examples of LT and HT bursts
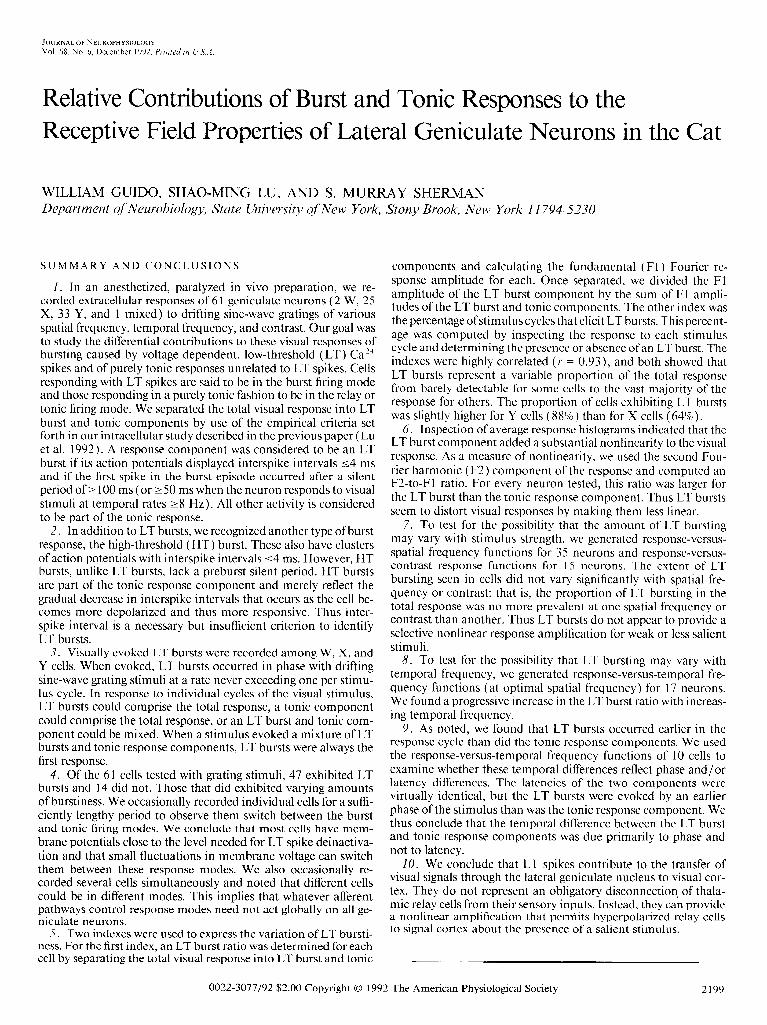
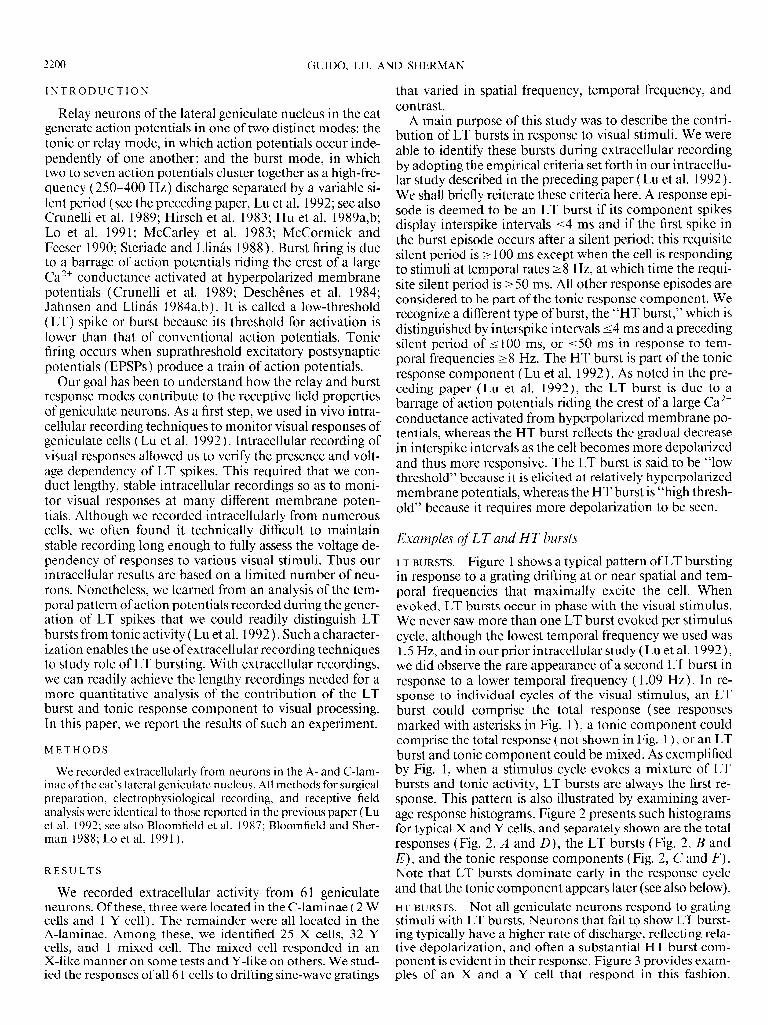
LT BURSTS. Figure 1 shows a typical pattern of LT bursting in response to a grating drifting at or near spatial and tem- poral frequencies that maximally excite the cell. When evoked, LT bursts occur in phase with the visual stimulus. We never saw more than one LT burst evoked per stimulus cycle, although the lowest temporal frequency we used was 1.5 Hz, and in our prior intracellular study (Lu et al. 1992), we did observe the rare appearance of a second LT burst in response to a lower temporal frequency ( 1.09 Hz). In re- sponse to individual cycles of the visual stimulus, an LT burst could comprise the total response (see responses marked with asterisks in Fig. 1 ), a tonic component could comprise the total response (not shown in Fig. 1 ), or an LT burst and tonic component could be mixed. As exemplified by Fig. 1, when a stimulus cycle evokes a mixture of LT bursts and tonic activity, LT bursts are always the first re- sponse. This pattern is also illustrated by examining aver- age response histograms. Figure 2 presents such histograms for typical X and Y cells, and separately shown are the total responses (Fig. 2, A and D), the LT bursts (Fig. 2, B and E), and the tonic response components (Fig. 2, C and F). Note that LT bursts dominate early in the response cycle and that the tonic component appears later (see also below). HT BURSTS. Not all geniculate neurons respond to grating stimuli with LT bursts. Neurons that fail to show LT burst- ing typically have a higher rate of discharge, reflecting rela- tive depolarization, and often a substantial HT burst com- ponent is evident in their response. Figure 3 provides exam- ples of an X and a Y cell that respond in this fashion.
LT BURST AND TONIC RESPONSES IN LGN CELLS 2201
A xCELL
B YCELL
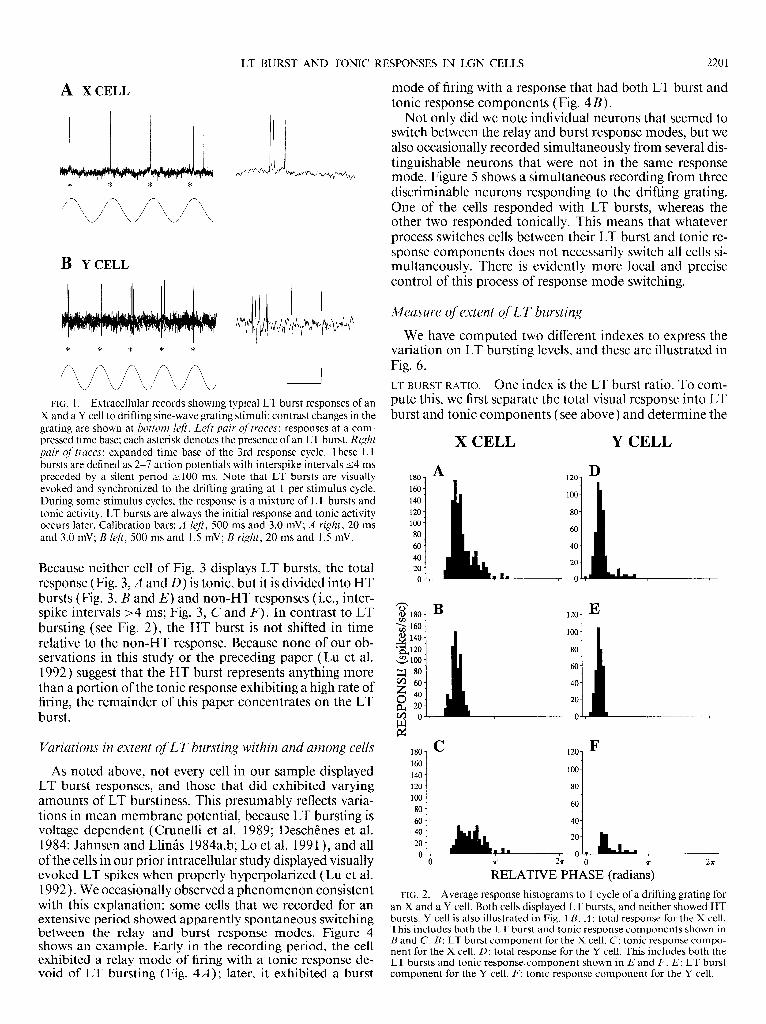
FIG. 1. Extracellular records showing typical LT burst responses of an X and a Y cell to drifting sine-wave grating stimuli; contrast changes in the grating are shown at bottom lefi. Left pair of traces: responses at a com- pressed time base; each asterisk denotes the presence of an LT burst. Right pair qf traces: expanded time base of the 3rd response cycle. These LT bursts are defined as 2-7 action potentials with interspike intervals 14 ms preceded by a silent period r 100 ms. Note that LT bursts are visually evoked and synchronized to the drifting grating at 1 per stimulus cycle. During some stimulus cycles, the response is a mixture of LT bursts and tonic activity. LT bursts are always the initial response and tonic activity occurs later. Calibration bars: A left, 500 ms and 3.0 mV; A right, 20 ms and 3.0 mV; B left, 500 ms and 1.5 mV; B right, 20 ms and 1.5 mV.
Because neither cell of Fig. 3 displays LT bursts, the total response (Fig. 3, A and D) is tonic, but it is divided into HT bursts (Fig. 3, B and E) and non-HT responses (i.e., inter- spike intervals >4 ms; Fig. 3, C and F). In contrast to LT bursting ( see Fig. 2), the HT burst is not shifted in time relative to the non-HT response. Because none of our ob- servations in this study or the preceding PaPer (Lu et al. 1992) suggest that the HT burst represents anything more than a portion of the tonic response exhibiting a high rate of firing, the remainder of this paper concentrates on the LT burst.
Variations in extent of LT bursting within and among cells
As noted above, not every cell in our sample displayed LT burst responses, and those that did exhibited varying amounts of LT burstiness. This presumably reflects varia- tions in mean membrane potential, because LT bursting is voltage dependent (Crunelli et al. 1989; Deschenes et al. 1984; Jahnsen and Llinas 1984a,b; Lo et al. 199 1 ), and all of the cells in our prior intracellular study displayed visually evoked LT spikes when properly hyperpolarized (Lu et al. 1992). We occasionally observed a phenomenon consistent with this explanation: some cells that we recorded for an extensive peri .od showed apparently spontaneous switching between the relay and burst response modes. Figure 4 shows an example. Early in the recording period, the cell exhibited a relay mode of firing with a tonic response de- void of LT bursting (Fig. 4A) ; later, it exhibited a burst
mode of firing with a response that had both LT burst and tonic response components (Fig. 4B).
Not only did we note individual neurons that seemed to switch between the relay and burst response modes, but we also occasionally recorded simultaneously from several dis- tinguishable neurons that were not in the same response mode. Figure 5 shows a simultaneous recording from three discriminable neurons responding to the drifting grating. One of the cells responded with LT bursts, whereas the other two responded tonically. This means that whatever process switches cells between their LT burst and tonic re- sponse components does not necessarily switch all cells si- multaneously. There is evidently more local and precise control of this process of response mode switching.
Measure of extent of LT bursting
We have computed two different indexes to express the variation on LT bursting levels, and these are illustrated in Fig. 6. LT BURST RATIO. One index is the LT burst ratio. To com- pute this, we first separate the total visual response into LT burst and tonic components (see above) and determine the
X CELL Y CELL
‘0‘ M 1807
2 160- $ 140- ‘320 - ZlOO-
czll 80: m z 60- :
2 ii-
180- c 120- F 160- 140-
100-
120 - 80- lOO- 80 - 60-
-,
FIG. 2. Average response histograms to 1 cycle of a drifting grating for an X and a Y cell. Both cells displayed LT bursts, and neither showed HT bursts. Y cell is also illustrated in Fig. 1 B. A : total response for the X cell. This includes both the LT burst and tonic response components shown in B and C. B: LT burst component for the X cell. C: tonic response compo- nent for the X cell. D: total response for the Y cell. This includes both the LT bursts and tonic responsecomponent shown in E and F. E: LT burst component for the Y cell. F: tonic response component for the Y cell.
2202 GUIDO, LU, AND SHERMAN
fundamental Fourier (Fl ) response amplitude for each. The LT burst ratio is then calculated by dividing the Fl amplitude of LT burst component by the sum of the Fl amplitudes of the LT burst and tonic components; the ratio thus can vary between 0 and 1. Because of the offset in phase between the LT burst and tonic response compo- nents (see Fig. 2 and see also below), the Fl amplitude of the total response is generally slightly less than the sum of Fl amplitudes of the LT burst and tonic response compo- nents.
Figure 6A shows the distribution of LT burst ratios for our sample of 6 1 cells and reflects the responses to optimal spatial and temporal frequencies of the drifting grating. Of the 6 1 cells tested, 47 (77%) exhibited LT bursts and 14 ( 23% ) did not. Among the former, LT burst responses repre- sented a variable proportion of the total response from barely detectable for some cells to the vast majority of the response for others.
On this measure of LT burst ratios, we found only slight differences between X and Y cells. For instance, although the proportion of cells exhibiting LT bursts was higher for Y cells than for X cells (29 of 33 for Y cells vs. 16 of 25 for X cells), this difference does not quite reach statistical signifi-
X CELL Y CELL A D
240 200
200 160
160 120
120 80
80
mo E 1c;n 1 .
&a I””
g 120
120 z 80
0 80
& 40 40
0 0
0 2n 0
~LATIVE PHASE (radians; 2%
FIG. 3. Average response histograms to 1 cycle of a drifting grating for an X and a Y cell. Both cells displayed HT bursts, and neither showed LT bursts. A : total response for the X cell. This includes both HT bursts and non-HT response components shown in B and C. B: HT burst component for the X cell. C: Non-HT response for the X cell. This is simply the response left after HT bursts are removed from the total response. D: total response for the Y cell. This includes both the HT burst and tonic response components shown in E and F. E: HT burst component for the Y cell. F: non-HT response for the Y cell.
LT burst
200 -
150 -
loo -
50 -
cl- v n 1 0 0.57r l.OT 1.5x 2.07r
RELATIVE PHASE (radians) FIG. 4. Example of geniculate cell displaying different response modes
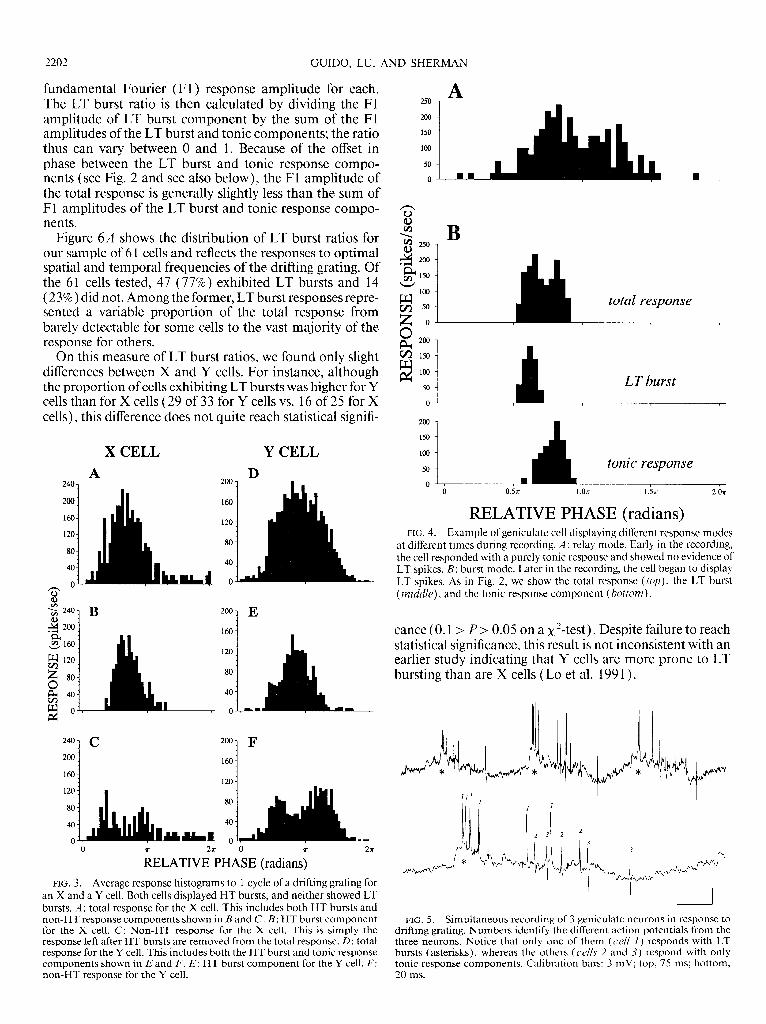
at different times during recording. A: relay mode. Early in the recording, the cell responded with a purely tonic response and showed no evidence of LT spikes. B: burst mode. Later in the recording, the cell began to display LT spikes. As in Fig. 2, we show the total response (top), the LT burst (middle), and the tonic response component (bottom).
cance (0.1 > P > 0.05 on a x2-test). Despite failure to reach statistical significance, this result is not inconsistent with an earlier study indicating that Y cells are more prone to LT bursting than are X cells (Lo et al. 199 1).
FIG. 5. Simultaneous recording of 3 geniculate neurons in response to drifting grating. Numbers identify the different action potentials from the three neurons. Notice that only one of them (cell I ) responds with LT bursts (asterisks), whereas the others (cells 2 and 3) respond with only tonic response components. Calibration bars: 3 mV; top, 75 ms; bottom, 20 ms.

LT BURST AND TONIC RESPONSES IN LGN CELLS 2203
0 0
LT BURST R&O 1 0 0 50% 100%
CYCLES WITH LT BURSTS
q 0 m 0
0 w=
n O
0 0 0
FIG. 6. Distribution of LT burstiness among our sample of 6 1 neurons. Results reflect responses to gratings drifted at near optimal spatial and temporal frequencies. A: distribution of burstiness expressed as an LT burst ratio ( see text for details). B: distribution of burstiness expressed as a percentage of stimulus cycles that elicit LT bursts. C: scatter plot showing the relationship between a neuron’s LT burst ratio and percentage of stimu- lus cycles with LT bursts.
LT BURSTS PER CYCLE. The other index of burstiness is a determination of the percentage of stimulus cycles that elicit an LT burst. We compute this by simply inspecting the response to each stimulus cycle and determining the presence or absence of an LT burst. Figure 6B illustrates this distribution, which is markedly similar to the distribu- tion of LT burst ratios of Fig. 6A. This similarity is further supported by Fig. 6C, which depicts for each cell showing LT bursts the relationship between its LT burst ratio and percentage of stimulus cycles evoking an LT burst. These variables are highly correlated ( for all cells, r = 0.93 and P < 0.00 1; for X cells, r = 0.89 and P < 0.00 1; for Y cells r = 0.94 and P < 0.00 1). Given this high correlation, we shall, for simplicity, use only the LT burst ratio in further analy- ses below.
Linearity of LT burst and tonic response components
Although it is difficult to see from the examples shown in Fig. 2, we noted that often the LT burst produced a promi- nent brief peak of responsiveness, whereas the profile of the tonic response component more faithfully matched the si- nusoidal shape of the stimulus. This would suggest that the LT burst results in a less linear response than does the tonic response component. Figure 7 documents this point for the 47 geniculate neurons showing LT burst responses; the data are taken from responses to gratings drifted at the optimal spatial and temporal frequencies. As before, we have sepa- rated the total visual response into LT burst and tonic com- ponents. To characterize the nonlinearity present in each
response component, we have computed an F2-to-F1 ratio similar to the nonlinearity index of Hochstein and Shapley ( 1976). This is simply the ratio of the amplitude of the F2 component of the response to that of the Fl component: the Fl amplitude represents the linear component, whereas the F2 amplitude represents a major nonlinear distortion present in the overall response. As shown in Fig. 7, every neuron shows a higher F2-to-F1 ratio for LT bursts than for tonic response components.
Spatial tuning oJ‘LT bursts
The results discussed above are based on the responses at optimal spatial and temporal frequencies. Because the LT burst is activated from hyperpolarized membrane poten- tials, it represents a sort of nonlinear amplification that en- ables a hyperpolarized cell to respond to visual stimuli. This, in turn, suggests the possibility that the extent of LT bursting relative to the tonic response component might vary with the strength of visual stimulation. One way of varying the strength of stimulation is to systematically vary spatial frequency, because geniculate neurons respond bet- ter to some frequencies than to others. Therefore we ob- tained spatial tuning functions in response to gratings drifted at an optimal temporal frequency for a subset of 35 neurons ( 11 X, 2 1 Y, 2 W, and 1 mixed). These measured the Fl amplitude as a function of spatial frequency, and the Fl amplitude was separately computed for the LT burst and tonic response components. Of the 35 cells tested, 30 showed LT bursting at one or more spatial frequencies. Ex- amples are shown in Fig. 8.
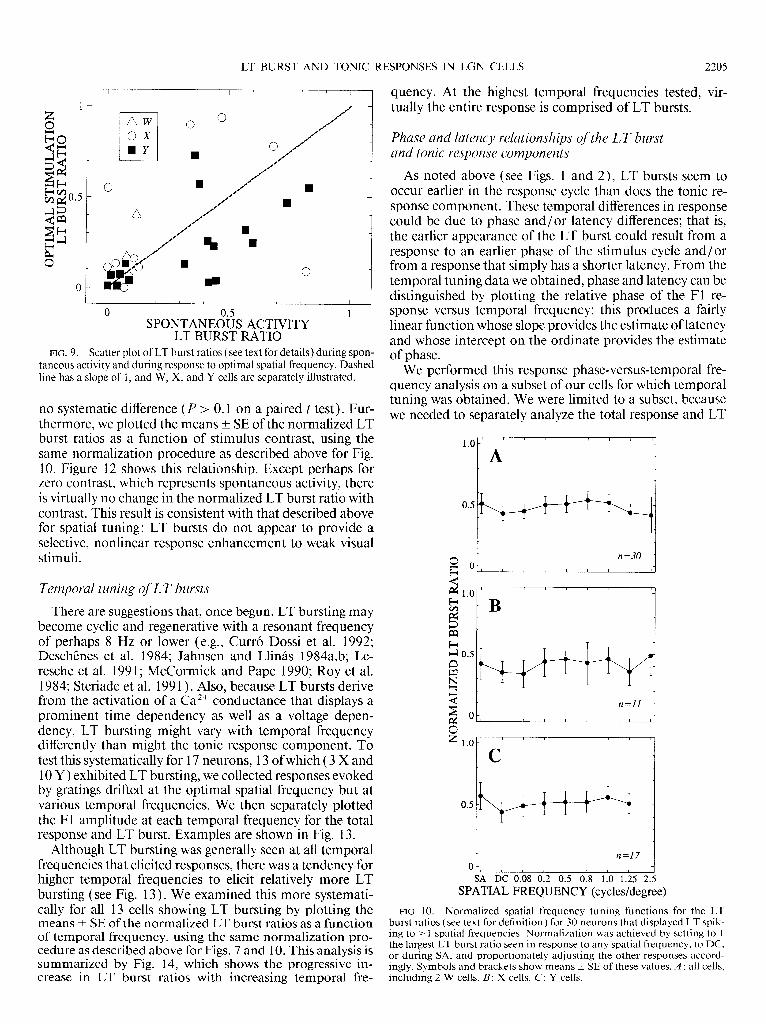
Figure 8 shows that, when present, LT bursts exhibit roughly the same spatial tuning as does the total response. This is more quantitatively considered in Figs. 9 and 10. For each cell displaying LT bursting, Fig. 9 shows the scat- ter plot of the LT burst ratio at spontaneous activity versus that at the optimal spatial frequency. Although there is a correlation between these variables (r = +0.48, P < 0.0 1 ), signifying that a cell strongly bursting during spontaneous activity tends to do so during visual stimulation, there was
AW L1 ox n Y
- /
I I I I I I I I I I _
0
F2/Fl RATIO FOR?ONIC RESPONSE ’ FIG. 7. Scatter plot showing F2-to-F1 ratios for LT burst and tonic
response components. Dashed line has a slope of 1, and all points are above this, which means that every neuron has a higher F2-to-F1 ratio for its LT bursts than for itstonic response components.
2204 GUIDO, LU, AND SHERMAN
20
10
0
- ;r
P
I I I I 1 I I I
DC 0 0.4 0.8 1.2
70
60
50
40
30
20
10
0
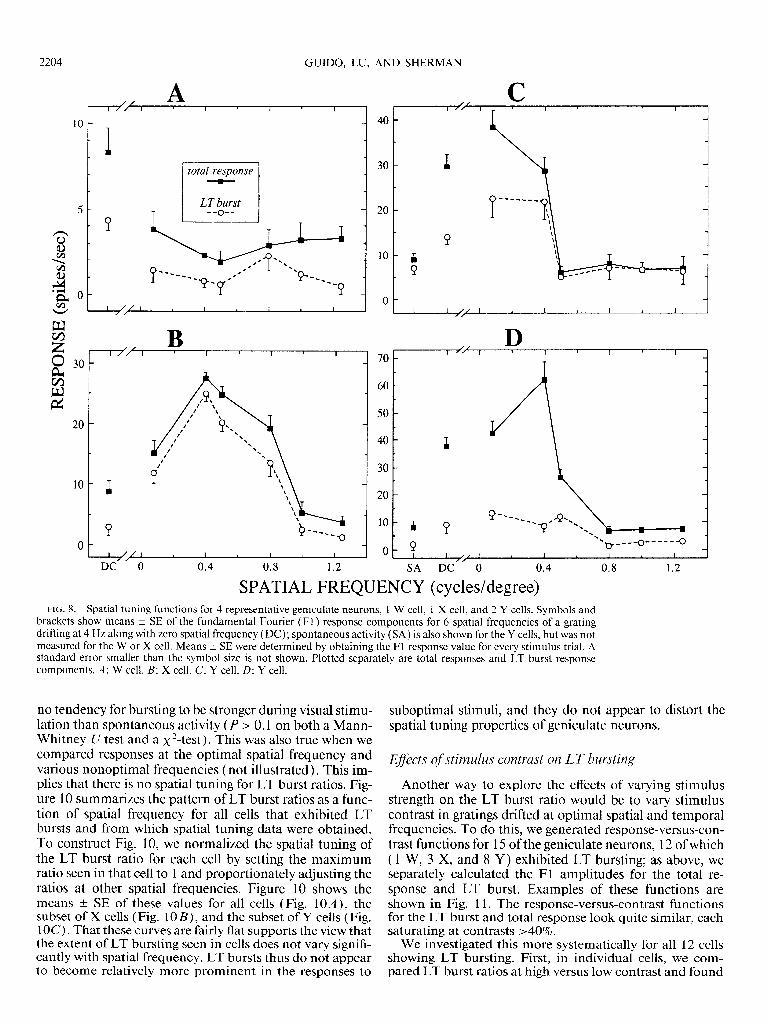
SPATIAL FREQUENCY (cycles/degree) FIG. 8. Spatial tuning functions for 4 representative geniculate neurons, 1 W cell, 1 X cell, and 2 Y cells. Symbols and
brackets show means + SE of the fundamental Fourier (Fl ) response components for 6 spatial frequencies of a grating drifting at 4 Hz along with zero spatial frequency (DC); spontaneous activity (SA) is also shown for the Y cells, but was not measured for the W or X cell. Means f SE were determined by obtaining the Fl response value for every stimulus trial. A standard error smaller than the symbol size is not shown. Plotted separately are total responses and LT burst response components. A: W cell. B: X cell. C: Y cell. D: Y cell.
compared responses at the optimal spatial frequency and
no tendency for bursting to be stronger during visual stimu-
various nonoptimal frequencies (not illustrated). This im- plies that there is no spatial tuning for LT burst ratios. Fig-
lation than spontaneous activity (P > 0.1 on both a Mann-
ure 10 summarizes the pattern of LT burst ratios as a func- tion of spatial frequency for all cells that exhibited LT
Whitney U test and a x2-test). This was also true when we
bursts and from which spatial tuning data were obtained. To construct Fig. 10, we normalized the spatial tuning of the LT burst ratio for each cell by setting the maximum ratio seen in that cell to 1 and proportionately adjusting the ratios at other spatial frequencies. Figure 10 shows the means t SE of these values for all cells (Fig. 1 OA ) , the subset of X cells (Fig. 1 OB) , and the subset of Y cells (Fig. 1OC). That these curves are fairly flat supports the view that the extent of LT bursting seen in cells does not vary signifi- cantly with spatial frequency. LT bursts thus do not appear to become relatively more prominent in the responses to
suboptimal stimuli, and they do not appear to distort the spatial tuning properties of geniculate neurons.
Eficts ofstimulus contrast on LT bursting
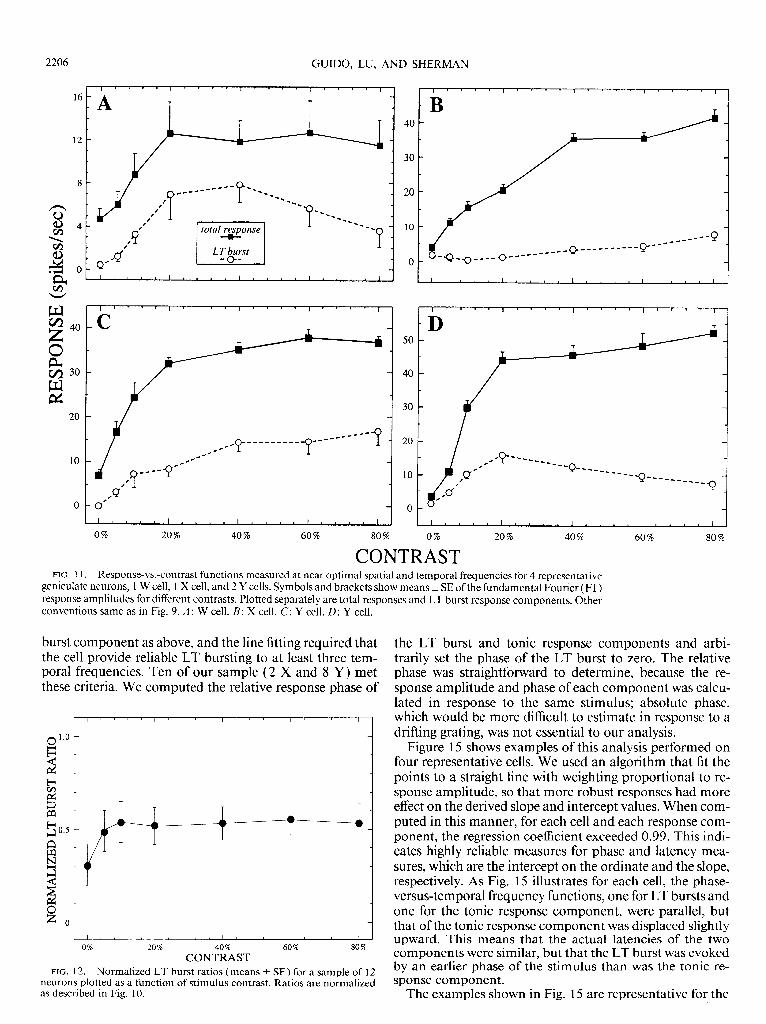
Another way to explore the effects of varying stimulus strength on the LT burst ratio would be to vary stimulus contrast in gratings drifted at optimal spatial and temporal frequencies. To do this, we generated response-versus-con- trast functions for 15 of the geniculate neurons, 12 of which ( 1 W, 3 X, and 8 Y) exhibited LT bursting; as above, we separately calculated the Fl amplitudes for the total re- sponse and LT burst. Examples of these functions are shown in Fig. 11. The response-versus-contrast functions for the LT burst and total response look quite similar, each saturating at contrasts >40%.
We investigated this more systematically for all 12 cells showing LT bursting. First, in individual cells, we com- pared LT burst ratios at high versus low contrast and found
LT BURST AND TONIC RESPONSES IN LGN CELLS 2205
0
I”” 1 ’ “1 1
0 Aw 0 O
I 1 H
0’ 0’ 0’ 0’
ox q Y
0 ,,““” 0’ 0’
0’ 0’ 0”
0 0’ 0” 0’
0’ q n 0’ 0’
0’ 0’ 0’ 0’
0”
0.‘~“” n
+ 43
- --9 e t 0 m
I , t I , 1 , , , , 1
0 0.5 1 SPONTANEOUS ACTIVITY
LT BURST RATIO FIG. 9. Scatter plot of LT burst ratios ( see text for details) during spon-
taneous activity and during response to optimal spatial frequency. Dashed line has a slope of 1, and W, X, and Y cells are separately illustrated.
no systematic difference (P > 0.1 on a paired t test). Fur- thermore, we plotted the means t SE of the normalized LT burst ratios as a function of stimulus contrast, using the same normalization procedure as described above for Fig. 10. Figure 12 shows this relationship. Except perhaps for zero contrast, which represents spontaneous activity, there is virtually no change in the normalized LT burst ratio with contrast. This result is consistent with that described above for spatial tuning: LT bursts do not appear to provide a selective, nonlinear response enhancement to weak visual stimuli.
Temporal tuning of LT bursts
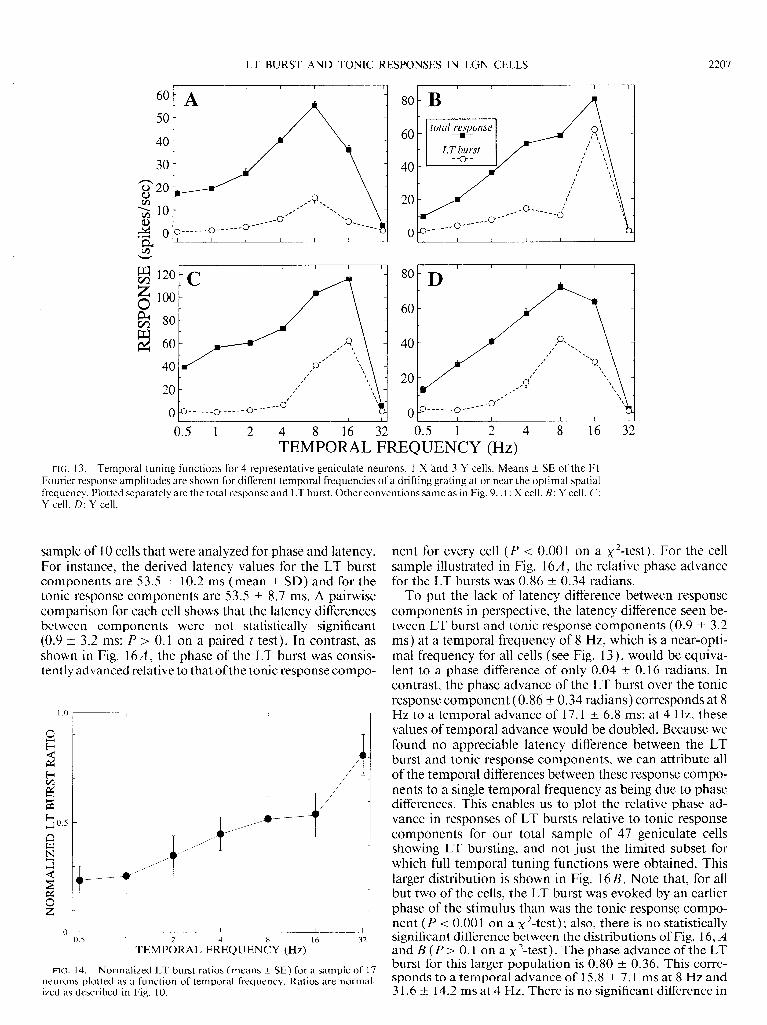
There are suggestions that, once begun, LT bursting may become cyclic and regenerative with a resonant frequency of perhaps 8 Hz or lower (e.g., Curro Dossi et al. 1992; Deschenes et al. 1984; Jahnsen and Llinas 1984a,b; Le- resche et al. 199 1; McCormick and Pape 1990; Roy et al. 1984; Steriade et al. 199 1). Also, because LT bursts derive from the activation of a Ca2+ conductance that displays a prominent time dependency as well as a voltage depen- dency, LT bursting might vary with temporal frequency differently than might the tonic response component. To test this systematically for 17 neurons, 13 of which ( 3 X and 10 Y) exhibited LT bursting, we collected responses evoked by gratings drifted at the optimal spatial frequency but at various temporal frequencies. We then separately plotted the Fl amplitude at each temporal frequency for the total response and LT burst. Examples are shown in Fig. 13.
Although LT bursting was generally seen at all temporal frequencies that elicited responses, there was a tendency for higher temporal frequencies to elicit relatively more LT bursting (see Fig. 13). We examined this more systemati- cally for all 13 cells showing LT bursting by plotting the means t SE of the normalized LT burst ratios as a function of temporal frequency, using the same normalization pro- cedure as described above for Figs. 7 and 10. This analysis is summarized by Fig. 14, which shows the progressive in- crease in LT burst ratios with increasing temporal fre-
quency. At the highest temporal frequencies tested, vir- tually the entire response is comprised of LT bursts.
Phase and latency relationships of the LT burst and tonic response components
As noted above (see Figs. 1 and 2) LT bursts seem to occur earlier in the response cycle than does the tonic re- sponse component. These temporal differences in response could be due to phase and/ or latency differences; that is, the earlier appearance of the LT burst could result from a response to an earlier phase of the stimulus cycle and/ or from a response that simply has a shorter latency. From the temporal tuning data we obtained, phase and latency can be distinguished by plotting the relative phase of the Fl re- sponse versus temporal frequency: this produces a fairly linear function whose slope provides the estimate of latency and whose intercept on the ordinate provides the estimate of phase.
We performed this response phase-versus-temporal fre- quency analysis on a subset of our cells for which temporal tuning was obtained. We were limited to a subset, because we needed to separately analyze the total response and LT
z 1.0
n=ll 1
II/, , , , , , /=J SA DC 0.08 0.2 0.5 0.8 1.0 1.25 2.5
SPATIAL FREQUENCY (cycles/degree) FIG. 10. Normalized spatial frequency tuning functions for the LT
burst ratios (see text for definition) for 30 neurons that displayed LT spik- ing to 2 1 spatial frequencies. Normalization was achieved by setting to 1 the largest LT burst ratio seen in response to any spatial frequency, to DC, or during SA, and proportionately adjusting the other responses accord- ingly. Symbols and brackets show means * SE of these values. A : all cells, including 2 W cells. B: X cells. C: Y ,cells.
2206 GUIDO, LU, AND SHERMAN
16
- 0’.
11 1 ..I,, I, I ) , , , I, * ( , 1
0% 20% 40% 60% 80%
50
40
30
20
10
0
0% 20% 40% 60% 80%
CONTRAST FIG. 1 1. Response-vs.-contrast functions measured at near optimal spatial and temporal frequencies for 4 representative
geniculate neurons, 1 W cell, 1 X cell, and 2 Y cells. Symbols and brackets show means -+ SE of the fundamental Fourier ( Fl ) response amplitudes for different contrasts. Plotted separately are total responses and LT burst response components. Other conventions same as in Fig. 9. A : W cell. B: X cell. C: Y cell. D: Y cell.
burst component as above, and the line fitting required that the cell provide reliable LT bursting to at least three tem- poral frequencies. Ten of our sample (2 X and 8 Y) met these criteria. We computed the relative response phase of
I ” ” I ’ ” ’ I ’ ’ ” I ’ “‘I
0 1.0
F:
2 ~
n - w a - 3 - L2 O-
FIG. 12. Normalized LT burst ratios (means or SE) for a sample of 12 neurons plotted as a function of stimulus contrast. Ratios are normalized as described in Fig. 10.
I I, I I I I , I I I, 11 ,I I I I I I
0% 20% 40% 60% 80%
CONTRAST
the LT burst and tonic response components and arbi- trarily set the phase of the LT burst to zero. The relative phase was straightforward to determine, because the re- sponse amplitude and phase of each component was calcu- lated in response to the same stimulus; absolute phase, which would be more difficult to estimate in response to a drifting grating, was not essential to our analysis.
Figure 15 shows examples of this analysis performed on four representative cells. We used an algorithm that fit the points to a straight line with weighting proportional to re- sponse amplitude, so that more robust responses had more effect on the derived slope and intercept values. When com- puted in this manner, for each cell and each response com- ponent, the regression coefficient exceeded 0.99. This indi- cates highly reliable measures for phase and latency mea- sures, which are the intercept on the ordinate and the slope, respectively. As Fig. 15 illustrates for each cell, the phase- versus-temporal frequency functions, one for LT bursts and one for the tonic response component, were parallel, but that of the tonic response component was displaced slightly upward. This means that the actual latencies of the two components were similar, but that the LT burst was evoked by an earlier phase of the stimulus than was the tonic re- sponse component.
The examples shown in Fig. 15 are representative for the
LT BURST AND TONIC RESPONSES IN LGN CELLS 2207
60
2 60
80
60
40
20
80
60
0.5 1 2 4 8 16 32 0.5 1 2 4 8 16 32 TEMPORAL FREQUENCY (Hz)
FIG. 13. Temporal tuning functions for 4 representative geniculate neurons, 1 X and 3 Y cells. Means -+ SE of the Fl Fourier response amplitudes are shown for different temporal frequencies of a drifting grating at or near the optimal spatial frequency. Plotted separately are the total response and LT burst. Other conventions same as in Fig. 9. A : X cell. B: Y cell. C: Y cell. D: Y cell.
sample of 10 cells that were analyzed for phase and latency. For instance, the derived latency values for the LT burst components are 53.5 t 10.2 ms (mean t SD) and for the tonic response components are 53.5 t 8.7 ms. A pair-wise comparison for each cell shows that the latency differences between components were not statistically significant (0.9 t 3.2 ms; P > 0.1 on a paired t test). In contrast, as shown in Fig. 16A, the phase of the LT burst was consis- tently advanced relative to that of the tonic response compo-
1.0 1 I I I I I I
0 T
O------J I I I I I
0.5 1
TEMP&AL FI&QUEN& (Hz) 16 32
FIG. 14. Normalized LT burst ratios (means rf: SE) for a sample of 17 neurons plotted as a function of temporal frequency. Ratios are normal- ized as described in Fig. 10.
nent for every cell (P < 0.00 1 on a x 2-test). For the cell sample illustrated in Fig. 16A, the relative phase advance for the LT bursts was 0.86 t 0.34 radians.
To put the lack of latency difference between response components in perspective, the latency difference seen be- tween LT burst and tonic response components (0.9 t 3.2 ms) at a temporal frequency of 8 Hz, which is a near-opti- mal frequency for all cells (see Fig. 13 ) , would be equiva- lent to a phase difference of only 0.04 t 0.16 radians. In contrast, the phase advance of the LT burst over the tonic response component (0.86 t 0.34 radians) corresponds at 8 Hz to a temporal advance of 17.1 t 6.8 ms; at 4 Hz, these values of temporal advance would be doubled. Because we found no appreciable latency difference between the LT burst and tonic response components, we can attribute all of the temporal differences between these response compo- nents to a single temporal frequency as being due to phase differences. This enables us to plot the relative phase ad- vance in responses of LT bursts relative to tonic response components for our total sample of 47 geniculate cells showing LT bursting, and not just the limited subset for which full temporal tuning functions were obtained. This larger distribution is shown in Fig. 16B. Note that, for all but two of the cells, the LT burst was evoked by an earlier phase of the stimulus than was the tonic response compo- nent (P < 0.00 1 on a x2-test); also, there is no statistically significant difference between the distributions of Fig. 16, A and B (P > 0.1 on a x2-test). The phase advance of the LT burst for this larger population is 0.80 t 0.36. This corre- sponds to a temporal advance of 15.8 t 7.1 ms at 8 Hz and 3 1.6 t 14.2 ms at 4 Hz. There is no significant difference in
2208 GUIDO, LU, AND SHERMAN
0
0 8 16 24 32 0 8 16 24 32
TEMPORAL FREQUENCY (Hz)
FIG. 1% Relative phase of Fl response plotted against temporal frequency for 4 representative geniculate neurons, 1 X and 3 Y cells. Plotted separately are LT burst and tonic response components. Regressions were computed with an algorithm that weighted each phase value by the amplitude of its associated Fl Fourier response, and all regression coefficients exceeded 0.99. A: X cell. B: Y cell. C: Y cell. D: Y cell.
these values for phase advance between X and Y cells (0.76 t 0.36 for X cells vs. 0.79 t 0.33 for Y cells; P > 0.1 on a Mann-Whitney U test).
DISCUSSION
By using the criteria established in our previous, intracel- lular study of geniculate neurons (Lu et al. 1992)) we were able to use more accessible extracellular techniques to study the LT Ca2+ spike and its associated burst of action poten- tials in these cells. The presence of LT spiking indicates that the cell is in the burst response mode, and its absence, which can be accomplished via membrane depolarization, indicates that the cell is in the relay response mode (see the preceding paper, Lu et al. 1992; see also Crunelli et al. 1989; Deschenes et al. 1984; Jahnsen and Llinas 1984a,b; Hirsch et al. 1983; Hu et al. 1989a,b; Lo et al. 199 1; McCormick and Feeser 1990). In particular, we were able to study quan- titatively the different effects of the two modes on receptive field properties of geniculate neurons, and this, in turn, re- veals their differential effects on transmission through the lateral geniculate nucleus of retinal signals evoked by con- ventional visual stimuli. Most of our cell population exhib- ited both LT bursts and tonic responses to visual stimuli, suggesting that they switched easily between response modes, and there were no dramatic differences between X and Y cells in this regard. In general, our conclusions from extracellular recording concerning the effects of LT bursts and tonic responses on receptive field properties are in close agreement with those of our intracellular study (Lu et al.
1992) ; these conclusions are discussed in more detail be- low. This agreement between studies not only serves to vali- date the criteria we have used to distinguish between the LT burst and tonic response components, but it also suggests that the process of impaling cells with microelectrodes does not dramatically alter their LT spike properties.
Switching between the relay and burst response modes
Virtually all geniculate relay neurons can switch their response mode between burst and tonic firing (e.g., Hu et al. 1989a,b; Lo et al. 199 1; Lu et al. 1992; McCarley et al. 1983; Steriade et al. 1989). The pathways that control this switching, presumably mostly by appropriate alterations in membrane potential, are not yet defined, although it ap- pears that activation of the cholinergic afferents to the lat- eral geniculate nucleus from the parabrachial region of the brainstem effectively switches cells from the burst to the relay mode (Hu et al. 1989a; Lo et al. 199 1; Steriade et al. 199 1). What is also unclear is how precisely this switching can be controlled on a cell-by-cell basis in the lateral genicu- late nucleus. For instance, some studies have emphasized the global switching of virtually all thalamic relay cells from one state to the other in a fashion correlated to the electroen- cephalogram (EEG) and thus to levels of alertness (e.g., Steriade and Deschenes 1984, 1988; Steriade and Llinas 1988; Steriade and McCarley 1990). However, our obser- vation that simultaneously recorded cells can reflect both response modes suggests that the control mechanisms for this switching need not be global. Perhaps local regions of
LT BURST AND TONIC RESPONSES IN LGN CELLS 2209
1B
I I r-- I I I I I I 1
-0.2 0 0.2 0.4 0.6 0.8 1.0 1.2 1.4 1.6 1.8
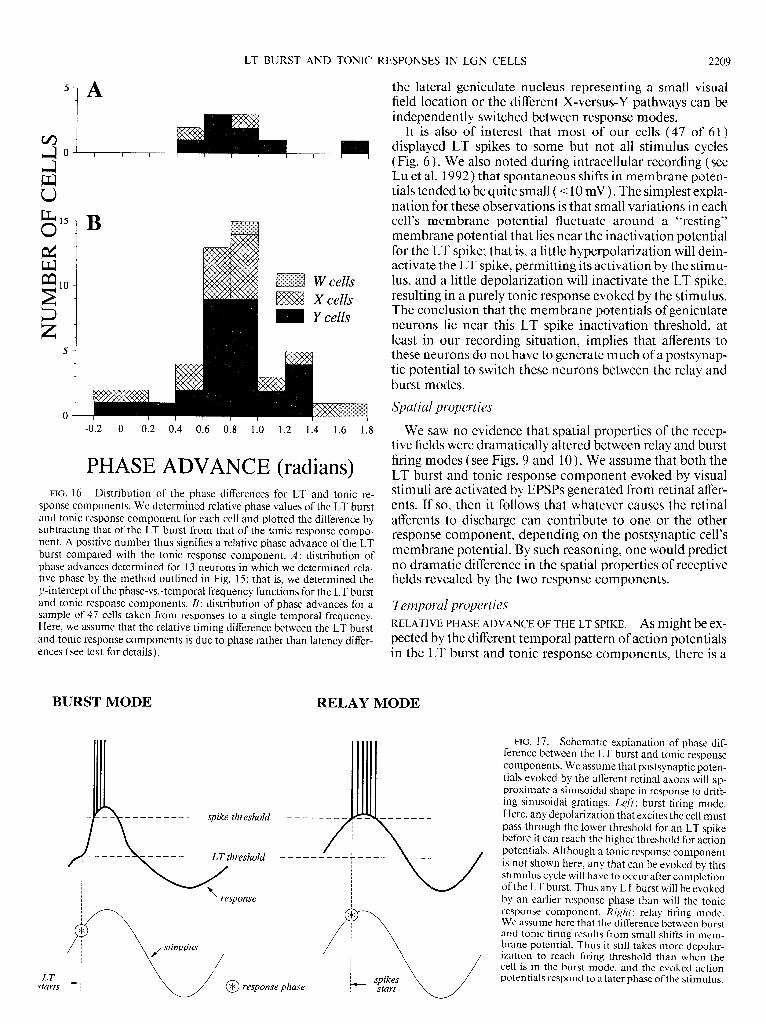
PHASE ADVANCE (radians) FIG. 16. Distribution of the phase differences for LT and tonic re-
sponse components. We determined relative phase values of the LT burst and tonic response component for each cell and plotted the difference by subtracting that of the LT burst from that of the tonic response compo- nent. A positive number thus signifies a relative phase advance of the LT burst compared with the tonic response component. A: distribution of phase advances determined for 13 neurons in which we determined rela- tive phase by the method outlined in Fig. 15; that is, we determined the y-intercept of the phase-vs.-temporal frequency functions for the LT burst and tonic response components. B: distribution of phase advances for a sample of 47 cells taken from responses to a single temporal frequency. Here, we assume that the relative timing difference between the LT burst and tonic response components is due to phase rather than latency differ- ences (see text for details).
BURST MODE RELAY MODE
the lateral geniculate nucleus representing a small visual field location or the different X-versus-Y pathways can be independently switched between response modes.
It is also of interest that most of our cells (47 of 6 1) displayed LT spikes to some but not all stimulus cycles (Fig. 6). We also noted during intracellular recording (see Lu et al. 1992) that spontaneous shifts in membrane poten- tials tended to be quite small ( 5 10 mV) . The simplest expla- nation for these observations is that small variations in each cell’s membrane potential fluctuate around a “resting” membrane potential that lies near the inactivation potential for the LT spike; that is, a little hyperpolarization will dein- activate the LT spike, permitting its activation by the stimu- lus, and a little depolarization will inactivate the LT spike, resulting in a purely tonic response evoked by the stimulus. The conclusion that the membrane potentials of geniculate neurons lie near this LT spike inactivation threshold, at least in our recording situation, implies that afferents to these neurons do not have to generate much of a postsynap- tic potential to switch these neurons between the relay and burst modes.
Spatial properties
We saw no evidence that spatial properties of the recep- tive fields were dramatically altered between relay and burst firing modes (see Figs. 9 and 10). We assume that both the LT burst and tonic response component evoked by visual stimuli are activated by EPSPs generated from retinal affer- ents. If so, then it follows that whatever causes the retinal afferents to discharge can contribute to one or the other response component, depending on the postsynaptic cell’s membrane potential. By such reasoning, one would predict no dramatic difference in the spatial properties of receptive fields revealed by the two response components.
Temporal properties RELATIVE PHASE ADVANCE OF THE LT SPIKE. As might be ex- pected by the different temporal pattern of action potentials in the LT burst and tonic response components, there is a
LT starts
’ response
response phase
FIG. 17. Schematic explanation of phase dif- ference between the LT burst and tonic response components. We assume that postsynaptic poten- tials evoked by the afferent retinal axons will ap- proximate a sinusoidal shape in response to drift- ing sinusoidal gratings. Left: burst firing mode. Here, any depolarization that excites the cell must pass through the lower threshold for an LT spike before it can reach the higher threshold for action potentials. Although a tonic response component is not shown here, any that can be evoked by this stimulus cycle will have to occur after completion of the LT burst. Thus any LT burst will be evoked by an earlier response phase than will the tonic response component. Right: relay f&Ring mode. We assume here that the difference between burst and tonic firing results from small shifts in mem- brane potential. Thus it still takes more depolar- ization to reach firing threshold than when the cell is in the burst mode, and the evoked action potentials respond to a later phase of the stimulus.
2210 GUIDO, LU, AND SHERMAN
temporal effect related to these response modes. The most obvious is the earlier response of the LT spike relative to the tonic response component (see Figs. 1 and 2 of the prior paper, Lu et al. 1992; see also Fig. 2 of this paper), which we have shown to be due to a relative phase advance rather than a shorter latency (Figs. 15 and 16). The explanation for this phase advance may be quite straightforward, as is schematically shown in Fig. 17. The drifting sine-wave grat- ing will evoke a sinusoidal modulation in firing of the reti- nal afferents to the geniculate cell, thereby producing an analogous sinusoidal modulation in the postsynaptic po- tentials. If the geniculate cell is hyperpolarized sufficiently to deinactivate the LT spike, then it follows that a depolar- ization must pass through the lower threshold needed to activate the LT spike before it can reach firing threshold for action potentials (Fig. 17, left). Thus any tonic response component to the same stimulus cycle must be activated at a later phase of the stimulus cycle. If the stimulus cycle evokes only a tonic response component (Fig. 17, right), this is likely due to a very slight depolarization of the mem- brane (see above). This, in turn, implies that the stimulus must still depolarize the cell considerably before reaching threshold for action potentials, and again this results in a tonic response from a relatively late phase of the stimulus.
Note that the explanation illustrated by Fig. 17 implies small shifts in the resting membrane potential. Larger shifts might invoke other voltage-dependent conductances that can have other effects on responsiveness and response tim- ing. For example, there is now evidence that cells of the lateral geniculate nucleus, like cells in many other brain regions, exhibit a voltage-dependent, transient K+ conduc- tance known as I, (Huguenard et al. 199 1; McCormick 199 1) . Like the LT spike, 1* can be activated by depolariza- tion from hyperpolarized membrane potentials and is inac- tivated by depolarization (Connor and Stevens 197 1; Hu- guenard et al. 199 1; McCormick 199 1; Storm 1988), but the absolute voltage dependencies of the LT spike and &, seem to be somewhat different. Unlike the LT spike, 1* leads to an outward conductance of K+, which tends to hyperpolarize the cell and offset or retard the depolariza- tion produced by the activation. This slows down the excit- atory response. Our preliminary data indicate that some- thing like 1* exists in geniculate cells recorded in vivo, be- cause when held at depolarized levels they often respond with much shorter latencies than when hyperpolarized (Lu et al. 199 1). Thus, whereas an LT burst should appear ear- lier than a tonic response component if the cell starts out relatively hyperpolarized, it is not necessarily the case that the tonic response of a more depolarized cell in the relay mode is relatively late. In other words, 1* may delay both the LT burst and tonic response components evoked from more hyperpolarized levels but have no role in the tonic response at more depolarized levels.
TEMPORAL TUNING. Previous studies have indicated that LT spiking in thalamic neurons resonates at particular tem- poral frequencies, such as 6- 10 Hz (Deschenes et al. 1984; Jahnsen and Llinas 1984a,b; Roy et al. 1984; Steriade et al. 199 1) or perhaps lower rates (Curro Dossi et al. 1992; Leresche et al. 199 1; McCormick and Pape 1990; Steriade et al. 199 1). However, it is clear from our results that LT spiking can follow rates of temporal stimulation well in ex-
cess of 6- 10 Hz (however, see McCormick and Feeser 1990). Furthermore, we found no evidence that LT spiking displays temporal tuning that is dramatically different from that of the tonic response component. There is thus no ten- dency for LT bursting to resonate at 6- 10 Hz or any other particular frequency.
A somewhat unexpected observation was the increase we saw in the LT burst ratio in response to higher temporal frequencies (Figs. 13 and 14). This may’simply follow from the observation noted above that the LT burst, if it occurs, is always the first response to a stimulus cycle, and any tonic response component must occur later in the cycle. As tem- poral frequency increases, the absolute amount of time in each stimulus cycle that the retinal afferents can depolarize the membrane above the threshold for action potential acti- vation diminishes, yet a fixed amount of time will always be first occupied by the LT spike. Thus, at higher temporal frequencies, there is less of an opportunity for tonic re- sponses to occur before the arrival of the next stimulus cy- cle. Eventually, tonic responses will be evoked only by those stimulus cycles that fail to evoke an LT spike, and the result is that the LT burst ratio increases with temporal frequency.
Variability in strength of LT spikes
There is some variability in the size of LT spikes (e.g., Deschenes et al. 1984; Jahnsen and Llinas 1984a,b), so that it is not as regular as is the action potential. Were this not the case, every LT spike, once activated, would have the same shape and would elicit consistent and unvarying bursts of action potentials. It should matter little whether the LT spike was activated by a strong depolarization or a weak one. This, in turn, would imply that a hyperpolarized cell in the burst mode, if it responded at all, would respond the same way to an optimal stimulus as to a nonoptimal one. This does not happen, as can clearly be seen from our spatial tuning and contrast sensitivity data, which show fairly constant LT burst ratios across optimal and nonopti- ma1 stimuli ( Figs. 6, 7, 11, and 12 ) . Because our data sug- gest that weaker stimuli (e.g., lower contrasts or nonopti- ma1 spatial frequencies) evoke constant LT burst ratios de- spite lower levels of overall responsiveness, it follows that these weaker stimuli must also produce smaller LT spikes.
SigniJicance of the LT spike for visual processing
Our data demonstrate that geniculate neurons in the burst mode can reliably and regularly respond to visual stimuli with LT spikes. It is thus not obligatory that the burst mode requires the thalamic cell to fire LT spikes rhythmically irrespective of their sensory input. This may be seen during in vitro recording (Jahnsen and Llinas 1984a,b; Leresche et al. 199 1; McCormick and Pape 1990) or in certain in vivo preparations that disconnect the thala- mus from many of its afferents (Curro Dossi et al. 1992; Deschenes et al. 1984; Hu et al. 1989a,b; Roy et al. 1984; Steriade et al. 1989, 199 1). Presumably, the more intact circuitry present in our recording situation nullifies any in- herent tendency for thalamic neurons to burst rhythmi- cally.
Although we did not see rhythmic LT bursting of genicu- late neurons in the presence of visual stimuli, we do not
LT BURST AND TONIC RESPONSES IN LGN CELLS 2211
mean to rule out its presence under different recording con- ditions and/ or behavioral states. Perhaps retinal inputs re- quire the coactivation of another afferent pathway to pre- vent such rhythmicity seen in other situations. For in- stance, previous studies suggest that the cholinergic parabrachial afferents can strongly deter LT spiking (Hu et al. 1989a; Lo et al. 199 1; Steriade et al. 199 1 ), and perhaps the presence and background activity of this pathway in our preparation preclude rhythmic LT spiking. When this path- way is cut off or quiescent (e.g., perhaps during certain phases of sleep), such rhythmic bursting ensues.
In any case, we conclude that LT spiking has a role in the transmission of visual signals to cortex (Crick 1984). The observation that the pattern of action potentials differs be- tween the relay and burst response modes may have further significance for sensory processing. Perhaps the visual cor- tex can recognize this difference between response modes. A bursty response with prominent silent periods before each burst could signal the presence of a visual stimulus being relayed by a hyperpolarized geniculate neuron. The burstiness would also signal response nonlinearity, imply- ing that spatiotemporal details of the stimulus are not being faithfully relayed. The cortex could use this information to alter inputs to the bursting relay cell in such a way as to depolarize the cell and convert it to the relay mode. This could be done directly via monosynaptic inputs from visual cortex to geniculate relay cells or indirectly via cortical in- nervation of inhibitory interneurons or neurons of the tha- lamic reticular nucleus and possibly even through less di- rect cortical influence on ascending influences such as those from the parabrachial region (see Sherman and Koch 1986, 1990). Not only does the LT spike nonlinearly amplify ret- inogeniculate transmission for a hyperpolarized relay cell, but also it occurs with minimal phase delay. These features suggest the possibility that the LT spike may act as a sort of “wake-up call” for the visual cortex.
We thank T. Schotland and R. Avila for excellent computer assistance. This work was supported by National Eye Institute Grant EY-03038 and
postdoctoral fellowship EY-06082. Address for reprint requests: S. M. Sherman, Dept. of Neurobiology,
State University of New York, Stony Brook, NY 119745320.
Received 27 April 1992; 30 July 1992.
REFERENCES
BLOOMFIELD, S. A., HAMOS, J. E., AND SHERMAN, S. M. Passive cable properties and morphological correlates of neurones in the lateral genicu- late nucleus of the cat. J. Physiol. Lund. 383: 653-692, 1987.
BLOOMFIELD, S. A. AND SHERMAN, S. M. Postsynaptic potentials recorded in neurons of the cat’s lateral geniculate nucleus following electrical stimulation of the optic chiasm. J. Neurophysiol. 60: 1924-1945, 1988.
CONNOR, J. A. AND STEVENS, C. F. Voltage clamp studies of atransient outward membrane current in gastropod neural somata. J. Physiol. Lund. 213: 21-30, 1971.
CRICK, F. Function of the thalamic reticular complex: the searchlight hy- pothesis. Proc. Natl. Acad. Sci. USA 8 1: 4586-4590, 1984.
CRUNELLI, V., LIGHTOWLER, S., AND POLLARD, C. E. A T-type Ca2+ current underlies low-threshold Ca2+ potentials in cells of the cat and rat lateral geniculate nucleus. J. Physiol. Lund. 4 13: 543-56 1, 1989.
CURRY DOSSI, R., NuT;JEz, A., AND STERIADE, M. Electrophysiology of a slow (0.5-4 Hz) intrinsic oscillation of cat thalamocortical neurones in vivo. J. Physiol. Lund. 447: 2 15-234, 1992.
DESCH~NES, M., PARADIS, M., ROY, J. P., AND STERIADE, M. Electrophvs-
iology of neurons of lateral thalamic nuclei in cat: resting properties and burst discharges. J. Neurophysiol. 5 1: 1196-12 19, 1984.
HIRSCH, J. C., FOURMENT, A., AND MARC, M. E. Sleep-related variations of membrane potential in the lateral geniculate body relay neurons of the cat. Brain Res. 259: 308-312, 1983.
HOCHSTEIN, S. AND SHAPLEY, R. M. Quantitative analysis of retinal gan- glion cell classifications. J. Physiol. Lund. 262: 237-264, 1976.
Hu, B., STERIADE, M., AND DESCH~NES, M. The effects of brainstem peri- brachial stimulation on neurons of the lateral geniculate nucleus. Neu- roscience 3 1: 13-24, 1989a.
Hu, B., STERIADE, M., AND DESCH~NES, M. The cellular mechanism of tha- lamic ponto-geniculo-occipital waves. Neuroscience 3 1: 25-35, 1989b.
HUGUENARD, J. R., COULTER, D. A., AND PRINCE, D. A. A fast transient potassium current in thalamic relay neurons: kinetics of activation and inactivation. J. Neurophysiol. 66: 1304- 13 15, 199 1.
JAHNSEN, H. AND LLINAS, R. Electrophysiological properties of guinea- pig thalamic neurones: an in vitro study. J. Physiol. Lund. 349: 205- 226, 1984a.
JAHNSEN, H. AND LLIN~S, R. Ionic basis for the electro responsiveness and oscillatory properties of guinea-pig thalamic neurones in vitro. J. Physiol. Lund. 349: 227-247, 1984b.
LERESCHE, N., LIGHTOWLER, S., SOLTESZ, I., JASSIK-GERSCHENFLED, D., AND CRUNELLI, V. Low frequency oscillatory activities intrinsic to rat and cat thalamocortical cells. J. Physiol. Lund. 44 1: 155- 174, 199 1.
LO, F.-S., Lu, S.-M., AND SHERMAN, S. M. Intracellular and extracellular in viva recording of different response modes for relay cells of the cat’s lateral geniculate nucleus. Exp. Brain Res. 83: 3 17-328, 199 1.
Lu, S.-M., GUIDO, W., AND SHERMAN, S. M. Effect of membrane voltage and parabrachial activation of lagged and nonlagged cells in the cat LGN. Sot. Neurosci. Abstr. 17: 7 10, 199 1.
Lu, S.-M., GUIDO, W., AND SHERMAN, S. M. Effects of membrane voltage on receptive field properties of lateral geniculate neurons in the cat: contributions of the low-threshold Ca2+ conductance. J. Neurophysiol. 68: 1285-1298, 1992.
MCCARLEY, R. W., BENOIT, O., AND BARRIONUEVO, G. Lateral geniculate nucleus unitary discharge in sleep and waking: state- and rate-specific aspects. J. Neurophysiol. 50: 798-8 18, 1983.
MCCORMICK, D. A. Functional properties of a slowly inactivating potas- sium current in guinea pig dorsal lateral geniculate relay neurons. J. Neurophysiol. 66: 1176-l 189, 199 1.
MCCORMICK, D. A. AND FEESER, H. R. Functional implications of burst firing and single spike activity in lateral geniculate relay neurons. Neuro- science 39: 103- 113, 1990.
MCCORMICK, D. A. AND PAPE, H.-C. Properties of a hyperpolarization-ac- tivated cation current and its role in rhythmic oscillation in thalamic relay neurones. J. Physiol. Lund. 43 1: 29 l-3 18, 1990.
ROY, J.P., CLERCQ, M., STERIADE, M., ANDDESCH~NES, M.Electrophysi- ology of neurons of lateral thalamic nuclei in cat: mechanisms of long- lasting hyperpolarizations. J. Neurophysiol. 5 1: 1220- 1235, 1984.
SHERMAN, S. M. AND KOCH, C. The control of retinogeniculate transmis- sion in the mammalian lateral geniculate nucleus. Exp. Brain Res. 63: l-20, 1986.
SHERMAN, S. M. AND KOCH, C. Thalamus. In: Synaptic Organization of the Brain (3rd ed.), edited by G. M. Shepherd. New York: Oxford Univ. Press, 1990, p. 246-278.
STERIADE, M., CURRY DOSSI, R., AND Nu~~Ez, A. Network modulation of a slow intrinsic oscillation of cat thalamocortical neurons implicated in sleep delta waves: cortically induced synchronization and brainstem cholinergic suppression. J. Neurosci. 11: 3200-32 17, 199 1.
STERIADE, M. AND DESCH~NES, M. The thalamus as a neuronal oscillator. Brain Res. Rev. 8: l-63, 1984.
STERIADE, M. AND DESCH~NES, M. Intrathalamic and brainstem thalamic networks involved in resting and alert states. In: Cellular Thalamic Mechanisms, edited by M. Bentivoglio and R. Spreafico. Amsterdam: Elsevier Science, 1988, p. 38-62.
STERIADE, M. AND LLIN~S, R. R. The functional states of the thalamus and the associated neuronal interplay. Physiol. Rev. 68: 649-742, 1988.
STERIADE, M. AND MCCARLEY, R. W. Brainstem Control of Wakefulness and Sleep. New York: Plenum, 1990.
STERIADE, M., PAR& D., BOUHASSIRA, D., DESCHI~NES, M., AND OAK- SON, G. Phasic activation of lateral geniculate and perigeniculate tha- lamic neurons during sleep with ponto-geniculo-occipital waves. J. Neurosci. 9: 22 15-2229, 1989.
STORM, J. F. Temporal integration by a slowly inactivating K current in hippocampal neurons. Nature Lund. 336: 379-38 1, 1988.