Reinhold Environmental Ltd. - Worldwide Pollution Control ...
30
Reinhold Environmental Ltd. 2008 NOx-Combustion Round Table & Expo Presentation February 4-5, 2008 in Richmond, VA
Transcript of Reinhold Environmental Ltd. - Worldwide Pollution Control ...

Reinhold Environmental Ltd.2008 NOx-Combustion Round Table & Expo Presentation
February 4-5, 2008 in Richmond, VA
Platzhalter Titelbild
Evonik Energy
– formerly Steag

Equipment optimization through e.g.:SCR inspection, root cause analysisPerfection of flow distribution Elimination of LPA intrusionNH3 system inspectionAIG inspection and tuning
Catalyst management including e.g.:Asset managementCatalyst baseline testingDeNOx potential & forecastingCatalyst regeneration
Evonik’s SCR Management System consists of the following components:

Visual SCR inspections have revealed:
Overheated seal air expansion joint
Severe LPA screen erosion AIG nozzle pluggage Guide vane damage to SCR outlet ductwork
Evonik‘s SCR management: ~2.5 million
hours of SCR operating
experience
Equipment OptimizationSCR Inspection, root cause analysis
Misalignment of damper louvers
SCR reactor inlet expansion joint rupture
Fly ash accumulation on catalyst layer and pluggage

Equipment Optimization
CFD modeling enhances flue gas flow data and can be a useful tool for evaluation of system performance.
CFD modeling may identify other flow issues such as pressure losses or ash maldistribution.
Duct internals such as baffle plates, flue gas guide, turning vanes, LPA screens, etc. can be modeled and analyzed for optimal design.
Perfection of flow distribution

Evonik‘s SCR management: ~2.5 million
hours of SCR operating
experience
Evonik‘s proven patented LPA screen design:Key features: • Pleated screen < 60°• Hinged and free swinging• Filtering screen separate
from structural support• Well proven since 1996
Design allows for full interchangability of various screen inlay materials including wire mesh, perforated plate & wedge wire
Separate filtering and structural support screens
Hinged, free swinging design
Equipment OptimizationElimination of LPA intrusion
Equipment OptimizationElimination of LPA intrusion

Typical Flat LPA Screen
Equipment OptimizationElimination of LPA intrusion

Evonik’s Pleated LPA Screen Design
Equipment OptimizationElimination of LPA intrusion

Equipment OptimizationElimination of LPA intrusion

Pressure Drop LPA Screen at 750 F
0.45
0.37
0.25
0.30
0.00
0.10
0.20
0.30
0.40
0.50
56 66 82 98Gas Velocity [ft/sec]
Pres
sure
Dro
p [in
ches
w.c
.]
Large open surface area and slow flue gas velocity through the LPA screen inlays ensure a low pressure drop across the LPA screens:
Equipment OptimizationElimination of LPA intrusion

Suitability of various screen inlay materials depending on the average flue gas velocity in the economizer outlet duct:
Note: The suitability of the various screen inlay materials for the respective velocity ranges is based on their installation in Evonik’s patented self-cleaning pleated and hinged LPA screen design only.
Coated wedge wire SS 304
Uncoated wedge wire Nitronic 32
Uncoated wedge wire SS 304
Uncoated wire mesh SS 304
908070605040Flue gas velocity in ft/sec
Equipment OptimizationElimination of LPA intrusion

•Periodic inspections of all ammonia system components associated with the off loading, storage, vaporization and supply of ammonia to the AIG.
• Inspection of ammonia tanks, vent/purge, LEL• Inspection of safety systems (sprinkler, fogging,
etc.)•Independent site audits, regulatory compliance
•Established maintenance plan
•Documentation review
Equipment OptimizationNH3 system inspection
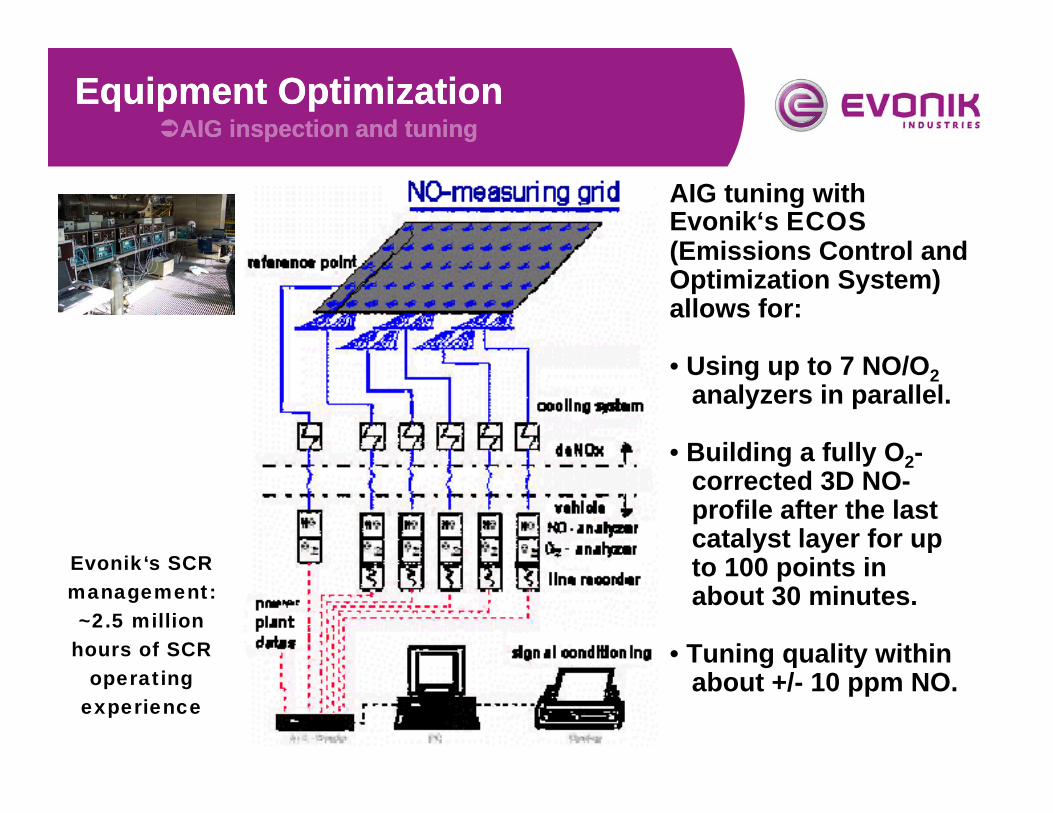
AIG tuning withEvonik‘s ECOS(Emissions Control and Optimization System) allows for:
• Using up to 7 NO/O2analyzers in parallel.
• Building a fully O2-corrected 3D NO-profile after the last catalyst layer for up to 100 points in about 30 minutes.
• Tuning quality within about +/- 10 ppm NO.
Evonik‘s SCR management: ~2.5 million
hours of SCR operating
experience
AIG inspection and tuningEquipment Optimization
AIG inspection and tuningEquipment Optimization

SCR performance monitoring before AIG tuning
Evonik‘s SCR management: ~2.5 million
hours of SCR operating
experience
AIG Tuning:
AIG inspection and tuningEquipment Optimization

Evonik‘s SCR management: ~2.5 million
hours of SCR operating
experience
AIG Tuning:SCR performance monitoring after AIG tuning
AIG inspection and tuningEquipment Optimization

Equipment optimization through e.g.:SCR inspection, root cause analysisPerfection of flow distribution Elimination of LPA intrusionNH3 system inspectionAIG inspection and tuning
Catalyst management including e.g.:Asset managementCatalyst baseline testingDeNOx potential & forecastingCatalyst regeneration
Evonik‘s SCR Management System consists of the following components:
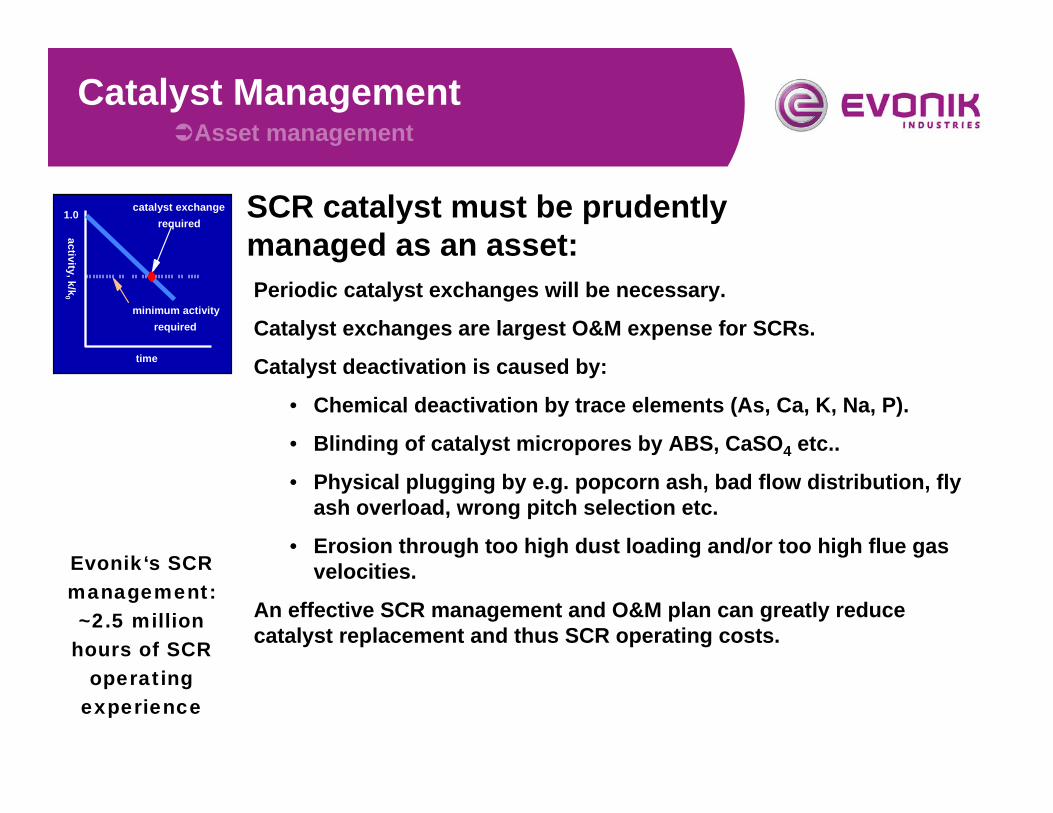
SCR catalyst must be prudently managed as an asset:Periodic catalyst exchanges will be necessary.
Catalyst exchanges are largest O&M expense for SCRs.
Catalyst deactivation is caused by:
• Chemical deactivation by trace elements (As, Ca, K, Na, P).
• Blinding of catalyst micropores by ABS, CaSO4 etc..
• Physical plugging by e.g. popcorn ash, bad flow distribution, fly ash overload, wrong pitch selection etc.
• Erosion through too high dust loading and/or too high flue gas velocities.
An effective SCR management and O&M plan can greatly reduce catalyst replacement and thus SCR operating costs.
time
activity, k/k0
minimum activity required
catalyst exchange required
1.0
Evonik‘s SCR management: ~2.5 million
hours of SCR operating
experience
Catalyst ManagementAsset management

O&M Costs• Catalyst Replacements
• Ammonia/Reagent
• Power (Differential ID Fan Power)
• Steam/Vaporization Medium
• General Maintenance (Sootblowers, Ammonia System, Dampers, Monitors)
• Ammonia Injection Tuning
• Diagnostic Testing
Catalyst ManagementAsset management

Evonik‘s SCR management: ~2.5 million
hours of SCR operating
experience
SCR Catalyst Management
Cycle
documentation ofdeactivation causestracking of catalystactivity and DeNOx
potential
development of catalyst management strategies (exchange
frequency, layer)
determination of main deactivation
causes (chemical and physical poisoning)
determinationof opportunities
and limitations for catalyst
refurbishment
independent catalyst activity
testing in a bench-scale reactor
measurement of catalyst pressure drop in a bench-
scale reactor
independent SO2/SO3 conversion
rate testing in a bench-scale reactor
visual reactorinspection and
sampling of catalystfrom each layer
Catalyst ManagementAsset management

Periodic Operational SCR Performance Monitoring:
NH3 concentrationin the fly ash
NOx distribution andNH3 measurements
Catalyst activity testing
Measurements:daily / weekly
Measurements:once or twice a year
Measurements:once a year
ppm
hours
100
hours
k
min
hours
NH3,g Upstreamlast layer
Downstreamlast layer
Operator Evonik Evonik
Evonik‘s SCR management: ~2.5 million
hours of SCR operating
experience
Catalyst ManagementCatalyst baseline testing

Plate-type catalyst sample test element preparation:• 12 plates per layer are cut into 24
catalyst strips of 146 mm in width while maintaining the full length.
• 24 strips are inserted in a sample holder with inner dimensions of 146 mm x 146 mm.
150 mm(6 inches)
150 mm(6 inches)
< 625 mm(< 24.6 inches)
Catalyst ManagementCatalyst baseline testing

Evonik was one of two SCR operators representing the users during developing the catalyst testing protocol VGB-R302He.
Evonik has always successful passed the VGB Round Robin tests tocertify our bench-scale reactor testing results.
Evonik is one of only three firms who provides truly independentcatalyst testing services and one of two that are certified.
Evonik‘s Catalyst Testing Lab:
Evonik‘s lab services:• Bench-scale reactor testing (K, KSO2/SO3, Δp)• Micro-scale reactor testing (e.g. coupons)• XRF analysis• XRD analysis• SEM analysis• Proximate and ultimate coal analysis• Ash fusion analysis
Evonik‘s SCR management: ~2.5 million
hours of SCR operating
experience
Catalyst ManagementCatalyst baseline testing

Catalyst Testing Data Interpretation:
0
0,1
0,2
0,3
0,4
0,5
0,6
0,7
0,8
0,9
1
0 5000 10000 15000 20000 25000 30000 35000 40000 45000 Betriebsstunden [h]
k/ko [-]
Lage 1 ; gerechnet Lage 1; gemessen
Lage 2 ; gerechnet Lage 2; gemessen
Lage 3 ; gerechnet Lage 3; gemessen
Katalysatoraktivität
Katalysatorpotential
0
1
2
3
4
5
6
7
8
9
0 5000 10000 15000 20000 25000 30000 35000 40000 45000 Betriebsstunden [h]
Φ [-]
0
0,5
1
1,5
2
2,5
3
3,5
4
4,5 NH3_Schlupf [mg/m³]
Phi_min
max. NH3_Schlupf = 1 mg/m³
0
0,1
0,2
0,3
0,4
0,5
0,6
0,7
0,8
0,9
1
0 20000 40000 60000 80000 100000 120000 140000
Betriebsstunden [h]
k/ko [-]
Lage 1; gerechnet Lage 1; gemessen
Lage 2; gerechnet Lage 2; gemessen
Lage 3; gerechnet Lage 4; gemessen
Lage 4; gerechnet Lage 3; gemessen
Katalysatoraktivität
Results and data from catalyst bench-scale testing results and chemical catalyst analysis need to be correctly interpreted and prepared for further use.
Evonik‘s SCR management: ~2.5 million
hours of SCR operating
experience
Catalyst ManagementCatalyst baseline testing
Catalyst ManagementCatalyst baseline testing

DeNOx potential tracking and forecasting:
• Determining theoretical required potential Ptheo.
• Calculating minimum needed and initially installed potentials Pminand Pinitial from catalyst baseline test data.
• Determining initial catalyst design margin.
• Determining residual DeNOx potential from actual catalyst activity.
• Accurately forecast SCR catalyst performance.
Evonik‘s SCR management: ~2.5 million
hours of SCR operating
experience
Catalyst ManagementDeNOx potential & forecasting

Typical Catalyst Exchange Plan:
Layer 1
Layer 3Layer 2
years0 2 4 6 8 10 12 14 16D
eNO
x potential P = K
/Av required minimum DeNOx
potential is typically 60 to 80% of initial DeNOx potential
2 layer
initial
charge
3rd catalyst
layer added
1st layer
exchanged
2nd layer
exchanged3rd layer
exchanged
Evonik‘s SCR management: ~2.5 million
hours of SCR operating
experience
Catalyst ManagementDeNOx potential & forecasting

Catalyst ManagementDeNOx potential & forecasting
Typical Catalyst Occupancy Plan:

SCR Catalyst Regeneration Nomenclature
● Cleaning = Removal of physical restrictions such as blinding layers and large particle ash –can be done on-site as well as off-site.
● Rejuvenation = Removal of catalyst poisons without the need for replenishing catalytically active compounds – can sometimes be done in-situ, but is most commonly done either on-site or off-site.
● Regeneration = Removal of catalyst poisons plus restoration of catalytic activity by addition of catalytically active ingredients – can typically not be done in-situ or on-site, but should be done off-site to ensure required close process control.
Evonik‘s Bergkamen Power Station
Evonik‘s Fenne Cogeneration Plant
Catalyst ManagementCatalyst regeneration

Evonik’s Catalyst Regeneration Process
•Evonik’s regeneration technology is based on effective:
•Removal of physical restrictions (fly ash, LPA, blinding layers, etc.).
• Removal of chemical catalyst poisons (As, P, Na, K, etc.).
• Prevention of unintended removal of components essential for maintaining the catalyst’s structural integrity and mechanical
strength (i.e. WO3).
• Full activity restoration through locally selective replenishment of the catalyst’s active components (V2O5, MoO3, WO3).
• Recalcination for best impregnation success and mechanical strength protection / restoration.
Evonik’s Catalyst Regeneration
Process
Catalyst ManagementCatalyst regeneration

Questions?
Questions?