Reimbursement of Drugs- Comparison of DOD, Medicaid & Medicare Part D Retail Reimbursement Prices
33
PRESCRIPTION DRUGS Comparison of DOD, Medicaid, and Medicare Part D Retail Reimbursement Prices Report to the Ranking Member, Committee on Homeland Security and Governmental Affairs, U.S. Senate June 2014 GAO-14-578 United States Government Accountability Office
-
Upload
dr-dev-kambhampati -
Category
Health & Medicine
-
view
152 -
download
2
Transcript of Reimbursement of Drugs- Comparison of DOD, Medicaid & Medicare Part D Retail Reimbursement Prices

PRESCRIPTION DRUGS
Comparison of DOD, Medicaid, and Medicare Part D Retail Reimbursement Prices
Report to the Ranking Member, Committee on Homeland Security and Governmental Affairs, U.S. Senate
June 2014
GAO-14-578
United States Government Accountability Office

United States Government Accountability Office
Highlights of GAO-14-578, a report to the Ranking Member, Committee on Homeland Security and Governmental Affairs, U.S. Senate
June 2014
PRESCRIPTION DRUGS Comparison of DOD, Medicaid, and Medicare Part D Retail Reimbursement Prices
Why GAO Did This Study In 2011, federal spending for prescription drugs by DOD, Medicaid, and Medicare Part D totaled $71.2 billion—representing about 85 percent of all federal prescription drug expenditures—for about 114.4 million beneficiaries. Each program reimbursed retail pharmacies for outpatient prescriptions filled at these pharmacies by their beneficiaries.
GAO was asked to compare prices paid for prescription drugs across federal programs. This report compares retail reimbursement prices paid by DOD, Medicaid, and Medicare Part D for a sample of prescription drugs and describes factors affecting these prices. Using agency data for the third quarter of 2010 (the most recent data available at the time of GAO’s analysis), GAO selected a sample of 50 high-utilization and 50 high-expenditure drugs; after accounting for overlap between the two groups, the final sample contained 78 drugs. GAO calculated average gross unit prices paid to pharmacies by each program by adding total program-paid and beneficiary-paid amounts and dividing by total utilization for each drug, the entire sample, and the subsets of brand-name and generic drugs. GAO calculated net unit prices paid by each program by subtracting all agency-reported beneficiary-paid amounts, rebates, refunds, and other price concessions from the gross unit prices. GAO also interviewed DOD, Medicaid, and Medicare Part D officials and reviewed literature describing factors affecting drug prices.
What GAO Found GAO found that Medicaid paid the lowest average net prices across a sample of 78 high-utilization and high-expenditure brand-name and generic drugs when compared to prices paid by the Department of Defense (DOD) and Medicare Part D. Specifically, Medicaid’s average net price for the entire sample was $0.62 per unit, while Medicare Part D paid an estimated 32 percent more ($0.82 per unit) and DOD paid 60 percent more ($0.99 per unit). Similarly, Medicaid paid the lowest net price for the subset of brand-name drugs in the sample, while DOD paid 34 percent more and Medicare Part D paid an estimated 69 percent more. Medicaid also paid the lowest net price for the subset of generic drugs, while Medicare Part D paid 4 percent more and DOD paid 50 percent more.
Comparison of Average Net Unit Prices for the Sample Drugs, Third Quarter of 2010
aGAO used only federally mandated rebates when calculating Medicaid net prices. If state supplemental rebates had been applied, actual net prices paid by Medicaid would have been lower than the prices shown in the figure. GAO found that the state supplemental rebates, in aggregate, were equivalent to 4 percent of Medicaid expenditures for all drugs in the target quarter. bThe Medicare Part D net prices are estimates because CMS allows Medicare Part D plan sponsors to use a variety of methods to allocate post-purchase price adjustments to the drug level and thus GAO could not definitively assign rebates to specific drugs.
GAO found that multiple factors affected the net prices paid by each program. Specifically, a key factor for the entire sample and the brand-name subset was the amount of any post-purchase price adjustments, which are the refunds, rebates, or price concessions received by each program from drug manufacturers after drugs have been dispensed to program beneficiaries. These price adjustments ranged from about 15 percent of the gross price for Medicare Part D to about 31 percent for DOD, and nearly 53 percent for Medicaid across the entire sample. The gross prices each program negotiated with pharmacies and the magnitude of beneficiary-paid amounts also contributed to differences in net prices paid by the three programs, but to a lesser degree.
GAO provided a copy of the draft report to DOD and the Department of Health and Human Services (HHS) for comment. DOD stated that it had no comments. HHS provided a technical comment, which was incorporated.
View GAO-14-578. For more information, contact John Dicken at (202) 512-7114 or [email protected].

Page i GAO-14-578 Comparison of Retail Reimbursement Prices
Letter 1
Background 5 Medicaid Paid Lower Net Prices Than DOD and Medicare Part D,
Largely Due to Differences in Post-Purchase Price Adjustments 9 Agency Comments 16
Appendix I Scope and Methodology 17
Appendix II GAO Contact and Staff Acknowledgments 28
Tables
Table 1: Percentage of Total Drug Utilization and Expenditures Included in the Retail Reimbursement Sample, Third Calendar Quarter of 2010 20
Table 2: Retail Reimbursement Drug Sample, Third Calendar Quarter of 2010 21
Figures
Figure 1: Comparison of Average Net Unit Prices for the Sample Drugs, Third Quarter of 2010 10
Figure 2: Comparison of Average Gross Unit Prices, Beneficiary-Paid Amounts, Post-Purchase Price Adjustments, and Average Net Unit Prices for the Sample Drugs, Third Calendar Quarter of 2010 12
Contents

Page ii GAO-14-578 Comparison of Retail Reimbursement Prices
Abbreviations AMP average manufacturer price CMS Centers for Medicare & Medicaid Services DIR direct and indirect remuneration DOD Department of Defense FCP federal ceiling price HCPCS Healthcare Common Procedure Coding System HCTZ hydrochlorothiazide HHS Department of Health and Human Services MAX Medicaid Analytic eXtract MSIS Medicaid Statistical Information System NDC national drug code PACE Program of All-Inclusive Care for the Elderly PDE Medicare Part D Prescription Drug Event PDTS Pharmacy Data Transaction Service POS point-of-sale URA unit rebate amount VA Department of Veterans Affairs
This is a work of the U.S. government and is not subject to copyright protection in the United States. The published product may be reproduced and distributed in its entirety without further permission from GAO. However, because this work may contain copyrighted images or other material, permission from the copyright holder may be necessary if you wish to reproduce this material separately.

Page 1 GAO-14-578 Comparison of Retail Reimbursement Prices
441 G St. N.W. Washington, DC 20548
June 30, 2014
The Honorable Tom Coburn, M.D. Ranking Member Committee on Homeland Security and Governmental Affairs United States Senate
Dear Dr. Coburn:
The Department of Defense (DOD), Medicaid, and Medicare Part D drug programs all incur substantial costs each year paying for prescription drugs for their beneficiaries.1 In 2011, federal spending for prescription drugs in these programs was a combined $71.2 billion—representing about 85 percent of all federal prescription drug expenditures—for approximately 114.4 million beneficiaries.2
1DOD provides prescription drug coverage to active duty and retired military personnel, their dependents, and others. Medicaid is the joint federal-state financed health care program for certain low income individuals. Medicare Part D is an optional outpatient prescription drug benefit offered by Medicare—the federally financed health insurance program for persons aged 65 and over, individuals under age 65 with certain disabilities, and individuals with end-stage renal disease.
2Total federal prescription drug expenditures for 2011 were obtained from the National Health Expenditures data for 2012 and include federal spending for DOD, Medicaid, Medicare, the Children’s Health Insurance Program, Indian Health Services, and Maternal/Child Health. See Centers for Medicare & Medicaid Services, Office of the Actuary, National Health Statistics Group, NHE Web Tables, accessed Apr. 2, 2014, http://www.cms.gov/Research-Statistics-Data-and-Systems/Statistics-Trends-and-Reports/NationalHealthExpendData/Downloads/NHE2012.zip. At the time we began our analysis, 2011 was the most recent year for which net expenditure data were available for Medicaid and Medicare Part D. DOD’s share of the total spending does not include spending for inpatient drugs in non-DOD facilities. Medicaid’s share of the total is the federal portion of Medicaid’s expenditures for prescription drugs net of rebates.

Page 2 GAO-14-578 Comparison of Retail Reimbursement Prices
DOD, Medicaid, and Medicare Part D each reimburse retail pharmacies for outpatient prescriptions that beneficiaries fill at these pharmacies.3
Given the significant level of federal spending on prescription drugs, you requested that we compare prices paid for these drugs across federal programs. In this report, we compare prices paid by DOD, Medicaid, and Medicare Part D for a sample of prescription drugs dispensed by retail pharmacies to program beneficiaries, and we describe factors contributing to differences in these prices. Our April 2013 report compares direct purchase prices paid by DOD and the Department of Veterans Affairs (VA) for a sample of prescription drugs dispensed to beneficiaries through the agencies’ own facilities and mail order pharmacies.
Prices for prescription drugs purchased in retail pharmacies generally include markups by one or more intermediaries (such as wholesalers and distributors) as well as storage, overhead, and dispensing costs.
4
To compare prices paid by DOD, Medicaid, and Medicare Part D for prescription drugs beneficiaries obtained at retail pharmacies, we selected a sample of drugs and then calculated gross and net unit prices paid by the programs we reviewed. To select the sample, we obtained prescription drug claims data from DOD and the Centers for Medicare & Medicaid Services (CMS) for the third calendar quarter of 2010.
5
3For purposes of this report, “retail pharmacies” are pharmacies that have store-based retail locations that dispense medications to the public, including chain and independent pharmacies; outpatient pharmacies operated by hospitals, supermarkets or mass merchants such as Wal-Mart; and mail order pharmacies used by Medicare Part D plans. DOD’s mail order pharmacy and military treatment facility pharmacies are excluded from this report because DOD buys drugs for those pharmacies directly from manufacturers. For more information about DOD’s direct purchase of prescription drugs, see GAO, Prescription Drugs: Comparison of DOD and VA Direct Purchase Prices,
We then
GAO-13-358 (Washington, D.C.: Apr. 19, 2013). 4GAO-13-358. In some cases, VA beneficiaries can obtain drugs on a fee-for-service basis through non-VA facilities. These make up a very small proportion of VA drug expenditures (less than 1 percent in fiscal year 2010). Therefore we did not include VA in this report comparing prices paid to retail pharmacies. 5We chose the third calendar quarter of 2010 as the target quarter for our analysis because more recent Medicaid data were not available at the time that we began our analysis.
CMS, an agency within the Department of Health and Human Services (HHS), oversees the Medicare and Medicaid programs at the federal level.

Page 3 GAO-14-578 Comparison of Retail Reimbursement Prices
selected drugs based on high utilization or high expenditures using DOD and Medicare Part D data.6
We then calculated the following program prices for the individual drugs in the sample, the entire sample, and each subset of brand-name drugs and generic drugs:
The sample we selected included the top 50 brand-name and top 50 generic drugs based on combined utilization ranks and combined expenditure ranks for DOD and Medicare Part D. After accounting for overlap between the high utilization and high expenditure drugs, the final sample contained 78 drugs—33 brand-name and 45 generic—and accounted for at least 25 percent of utilization and 25 percent of expenditures for both DOD and Medicare Part D retail prescriptions filled by beneficiaries in the third calendar quarter of 2010.
• gross unit prices paid to retail pharmacies (representing total program-paid plus beneficiary-paid amounts),7
• net unit prices (representing program-paid amounts minus offsetting rebates, refunds, and other price concessions, which we refer to in this report collectively as post-purchase price adjustments).
and
To determine gross unit prices we used DOD Pharmacy Data Transaction Service (PDTS) data on prescription drugs dispensed to DOD beneficiaries by non-DOD retail pharmacies, the Medicaid Analytic eXtract (MAX) prescription drug data file, and Medicare Part D
6Cleaned and validated Medicaid data for 2010 were not available at the time that we selected our sample. However, such data became available later and we were able to use these data to determine Medicaid gross and net unit prices. 7For DOD, program payments are made directly by DOD. For Medicaid, program payments are made by each state’s Medicaid program; the federal government subsequently provides matching funds to the states to cover a portion of these costs. For Medicare Part D, program payments include payments made by the plan sponsor and payments made by Medicare. Because the Medicaid data we used did not include beneficiary-paid amounts, we were only able to determine program-paid amounts for Medicaid. Therefore the Medicaid gross prices we report are somewhat lower than the actual gross prices would have been had beneficiary-paid amounts been included. However, beneficiary-paid amounts for Medicaid are generally nominal and it is likely that they would be smaller than the corresponding amounts for DOD and Medicare Part D.
Page 4 GAO-14-578 Comparison of Retail Reimbursement Prices
Prescription Drug Event (PDE) claims data.8 For all three programs, we excluded claims with third-party payments, physician-administered outpatient drugs, and items that are not traditionally considered drugs such as bandages and syringes.9 To determine post-purchase price adjustments for calculating net unit prices, we used PDTS data from DOD; unit rebate amount (URA) and CMS-64 data from Medicaid; and the 2010 Direct and Indirect Remuneration (DIR) Detailed Report from Medicare.10
To describe factors contributing to differences in net prices paid by the three programs, we examined differences between the gross and net unit prices paid by each program. We also interviewed DOD, Medicaid, and Medicare Part D officials and reviewed literature describing factors that affect drug prices. The results of our analyses are limited to the 78 high-utilization and high-expenditure drugs in our sample for the third calendar quarter of 2010 and are not necessarily applicable across all drugs or any other time periods.
We reviewed agency data for reasonableness and consistency, including screening for outlier prices and examining possible reasons for inconsistencies between the data sources. We also reviewed documentation and talked to agency officials about steps they take to ensure data reliability. We determined that the data were sufficiently reliable for our purposes. We conducted this performance audit from May
8PDTS is a centralized electronic database system that DOD uses to maintain prescription drug information from various points of service for its beneficiaries worldwide. Medicaid MAX files are derived from the Medicaid Statistical Information System (MSIS)—the reporting system where states provide Medicaid data on utilization and claims to CMS. We used the MAX Prescription Drug file. The Medicare Part D PDE data contain pharmacy claims for all prescription drugs dispensed to Medicare Part D beneficiaries. 9For Medicaid, we also excluded (1) Arizona and Delaware because claims for those states did not include third-party payments, (2) claims for beneficiaries who were also eligible for Medicare because retail prescription drugs for those beneficiaries are covered by Medicare Part D, and (3) claims paid under a capitated managed care plan or similar approaches. For Medicare Part D, we excluded claims from plans that restrict enrollment, such as employer plans, Program of All-Inclusive Care for the Elderly (PACE) plans, and demonstration plans. 10Manufacturers are statutorily required to provide rebates (on the basis of URA data) to state Medicaid agencies for covered drugs (see 42 U.S.C. § 1396r-8). States may also negotiate supplemental rebates directly with manufacturers for drugs dispensed to Medicaid recipients. These supplemental rebates are reported in Form CMS-64, a standardized quarterly expenditure report that states submit to CMS.

Page 5 GAO-14-578 Comparison of Retail Reimbursement Prices
2013 through June 2014 in accordance with generally accepted government auditing standards. Those standards require that we plan and perform the audit to obtain sufficient, appropriate evidence to provide a reasonable basis for our findings and conclusions based on our audit objectives. We believe that the evidence obtained provides a reasonable basis for our findings and conclusions based on our audit objectives.
See appendix I for additional details on our scope and methodology, including the list of drugs in our sample.
DOD, Medicaid, and Medicare Part D use different methods to pay for prescription drugs dispensed in retail pharmacies based on program design differences and statutory requirements. Specifically, DOD reimburses retail pharmacies directly for drugs dispensed to its beneficiaries, state Medicaid programs reimburse pharmacies and then receive federal matching funds for a portion of these expenditures, and Medicare Part D pays pharmacies indirectly through plan sponsors. Under the Medicare Part D program, beneficiaries may choose from competing prescription drug plans offered by plan sponsors (primarily private health insurers), and those plan sponsors are responsible for paying pharmacies. In addition, DOD and Medicaid are statutorily entitled to certain refunds or rebates from drug manufacturers for drugs dispensed to their beneficiaries, while Medicare Part D plan sponsors negotiate with manufacturers for rebates and other price concessions.
In fiscal year 2011, DOD provided prescription drug coverage to about 9.7 million beneficiaries through retail pharmacies, its military treatment facilities, and its mail order pharmacy.11
11Generally, eligible beneficiaries include active duty personnel and their dependents, medically eligible National Guard and Reserve service members and their dependents, and retirees and their dependents and survivors.
Active duty service members (including activated National Guard and Reserve members) are not charged for covered prescriptions. For all other beneficiaries, the beneficiary-paid amount (i.e., the amount they pay to the pharmacy when filling a prescription) varies based on the type of medication and where the prescription is filled.
Background
DOD

Page 6 GAO-14-578 Comparison of Retail Reimbursement Prices
For certain drugs dispensed to beneficiaries at retail pharmacies after January 28, 2008, DOD is statutorily entitled to pay the federal ceiling price (FCP), which also pertains to its directly-purchased drugs.12 In practice, DOD obtains these prices through post-purchase refunds paid by the manufacturers of certain drugs—primarily brand-name drugs.13 In fiscal year 2011, DOD’s prescription drug spending totaled about $7.48 billion, according to DOD officials, representing about 8.9 percent of federal spending for prescription drugs.14
In fiscal year 2011, Medicaid provided prescription drug coverage to about 71.5 million low income beneficiaries. Prescription drug coverage is an optional benefit under federal Medicaid law that all states and the District of Columbia provide. States establish and administer their own Medicaid programs within broad federal guidelines. Thus, Medicaid programs vary from state to state. Most states require a nominal beneficiary copayment for prescription drugs.
State Medicaid programs reimburse retail pharmacies for drugs dispensed to Medicaid beneficiaries and then report these payments to CMS. The federal government provides matching funds to state programs to cover a portion of these costs. Federal law requires manufacturers to pay rebates to state Medicaid agencies for drugs dispensed to Medicaid beneficiaries.15
12See 10 U.S.C. § 1074g(f) (added by National Defense Authorization Act for Fiscal Year 2008, Pub. L. No. 110-181, § 703(a), 122 Stat. 3, 188). This ensures that prescriptions for covered drugs dispensed to DOD beneficiaries on or after January 28, 2008, and paid for by DOD are subject to the pricing standards under 38 U.S.C. § 8126.
These statutorily mandated rebates are calculated based
13Drugs covered under this provision are innovator single-source and multiple-source drugs marketed under an original New Drug Application from the Food and Drug Administration, as well as biological products. 38 U.S.C. § 8126(h)(2). DOD officials told us that some transactions for covered drugs, such as claims for which DOD is the second payer, do not generate a refund. 14Spending is net of beneficiary copayments and post-purchase refunds and includes drugs dispensed at DOD inpatient and clinic facilities as well as all outpatient prescriptions filled through DOD’s military treatment facilities, its mail order pharmacy, and non-DOD retail pharmacies. Of the $7.48 billion, about $3.98 billion (53.2 percent) was for prescription drugs that beneficiaries obtained at non-DOD retail pharmacies (i.e., paid by DOD via retail reimbursement). 15See 42 U.S.C. § 1396r-8. States may also negotiate supplemental rebates with manufacturers for Medicaid drugs.
Medicaid

Page 7 GAO-14-578 Comparison of Retail Reimbursement Prices
on two prices manufacturers must report to CMS—the average manufacturer price (AMP) and the “best price.”16
• For brand-name drugs: the rebate equals the greater of 23.1 percent of the AMP or the difference between the AMP and the best price. If the AMP rises faster than inflation as measured by the change in the consumer price index, the manufacturer is required to provide an additional rebate to the state Medicaid program. The rebate is capped at 100 percent of AMP.
17
• For generic drugs: the rebate equals 13 percent of AMP. Best price is not a factor and there are no additional rebates or caps.
In addition, most state Medicaid programs negotiate additional rebates—known as state supplemental rebates—from drug manufacturers. In fiscal year 2011, total federal and state Medicaid net spending on prescription drugs was $13.7 billion.18
The federal share was $8.6 billion, accounting for about 10.3 percent of federal drug expenditures.
In 2011, about 33.2 million Medicare beneficiaries were enrolled in the Medicare Part D program.19
16The AMP is the average price paid to the manufacturer by or for retail community pharmacies including independent or chain pharmacies and excluding, among others, mail-order and nursing home pharmacies. The best price is the lowest price available from the manufacturer to any purchaser, with some exceptions (for example, direct government purchasers such as VA and DOD are excluded).
Medicare beneficiaries can obtain coverage for outpatient prescription drugs by choosing from multiple competing plans offered by plan sponsors—primarily private health insurers—that contract with CMS to offer the prescription drug benefit. The plan sponsors are responsible for reimbursing retail pharmacies for drugs dispensed to Medicare Part D beneficiaries. Drug plans may differ in the premiums charged to CMS and beneficiaries; beneficiary deductibles and
17For blood clotting factors and drugs approved exclusively for pediatric use, the calculation is identical to the brand-name drug calculation but uses 17.1 percent of AMP. The same additional rebate and cap apply. 18Total spending is the combined federal and state spending net of drug rebates that manufacturers paid to state Medicaid programs, which amounted to $16.1 billion. 19This represents about 68 percent of the 49 million individuals enrolled in Medicare in 2011.
Medicare Part D

Page 8 GAO-14-578 Comparison of Retail Reimbursement Prices
copayments (i.e., beneficiary-paid amounts); the drugs covered; pharmacies available to beneficiaries for filling prescriptions; and the drug prices, rebates, and other price concessions negotiated with manufacturers and pharmacies.
Although Medicare Part D plans can design their own formularies, CMS generally requires that each formulary include at least two drugs within each therapeutic class and has also designated six categories of clinical concern for which plans must cover all or substantially all of the drugs.20 As we previously reported, plan sponsors have indicated that these formulary requirements limit their ability to negotiate lower prices for some drugs.21 Medicare Part D beneficiaries fill prescriptions at retail or mail order pharmacies affiliated with their plans; these pharmacies then submit claims to the plan sponsors for reimbursement. Plan sponsors often negotiate point-of-sale and post-purchase rebates and other price concessions with manufacturers and pharmacies; these must be reported to CMS each year at the national drug code (NDC) level in the DIR reports.22
In 2011, federal spending on Medicare Part D totaled approximately $55.2 billion, accounting for about 65.9 percent of total federal drug expenditures.
20See 42 C.F.R. § 423.120(b)(2) (2013). A formulary is a list of medications, grouped by therapeutic class, that a health care system’s providers are encouraged to use when prescribing medications. A therapeutic class describes a group of drugs that are similar in chemical structure, pharmacological effect, or clinical use. Part D sponsor formularies must include all or substantially all drugs in the following six classes of clinical concern as identified by CMS: immunosuppressant (for prophylaxis of organ transplant rejection), antidepressant, antipsychotic, anticonvulsant, antiretroviral, and antineoplastic. Examples of other therapeutic classes include analgesics, blood glucose regulators, cardiovascular agents, dermatological agents, respiratory tract agents, and sedatives. 21See GAO, Medicare Part D: Spending, Beneficiary Cost-Sharing, and Cost-Containment Efforts for High-Cost Drugs Eligible for a Specialty Tier, GAO-10-242 (Washington, D.C.: Jan. 29, 2010), 21. 22NDCs are three-segment numbers that are the universal product identifiers for drugs. A drug can have multiple NDCs associated with it depending on the manufacturer, strength, dosage form, and package size.

Page 9 GAO-14-578 Comparison of Retail Reimbursement Prices
Medicaid paid a lower average net unit price—that is, the price after subtracting any beneficiary-paid amounts and post-purchase price adjustments—than DOD and Medicare Part D across the entire sample of 78 prescription drugs and the subsets of brand-name and generic drugs. Specifically, Medicaid’s average net price for the entire sample was $0.62 per unit, while Medicare Part D paid an estimated 32 percent more ($0.82 per unit) and DOD paid 60 percent more ($0.99 per unit).23
23The actual net prices paid by Medicaid would have been even lower than the prices we report if we had been able to apply the state supplemental rebates. However, because state Medicaid programs report the amount of any supplemental rebates in aggregate on a quarterly basis, it is impossible to precisely apply these supplemental rebates to the calculation of net prices at the NDC or drug level. Therefore, we chose to use only statutorily mandated (i.e., URA-based) rebates when calculating net prices. We found that Medicaid state supplemental rebates totaled about $201 million for the 34 states included in the 2010 MAX data we used for the third calendar quarter of 2010, or about 4.0 percent of total Medicaid expenditures for all drugs reimbursed by those states in that quarter.
(See fig. 1.) Similarly, Medicaid’s average net price for the subset of brand-name drugs in our sample was $1.57 per unit, the lowest among the three programs, while DOD paid 34 percent more ($2.11 per unit), and Medicare Part D paid an estimated 69 percent more ($2.65 per unit). Medicaid also paid the lowest net price for the subset of generic drugs in our sample ($0.28 per unit), while Medicare Part D paid 4 percent more ($0.29 per unit) and DOD paid 50 percent more ($0.42 per unit).
The Medicare Part D net prices we calculated are estimates that could vary depending on how plan sponsors choose to allocate DIR to the NDC level. That is, CMS requires plan sponsors that do not receive or record their DIR at the NDC level to use a reasonable allocation methodology to allocate their DIR to the NDC level for reporting purposes. For example, plan sponsors may allocate their DIR based on actual drug utilization, the plan’s total drug expenditures, the plan’s brand-name drug expenditures, the plan’s total drug expenditures for drugs in the preferred brand-name tier, or any other method approved by CMS. Different allocation choices by the plan sponsors would produce different calculated net prices for Medicare Part D.
Medicaid Paid Lower Net Prices Than DOD and Medicare Part D, Largely Due to Differences in Post-Purchase Price Adjustments

Page 10 GAO-14-578 Comparison of Retail Reimbursement Prices
Figure 1: Comparison of Average Net Unit Prices for the Sample Drugs, Third Quarter of 2010
Note: Our sample included 33 brand-name and 45 generic drugs that had high utilization or high expenditures for DOD and Medicare Part D in our target quarter. aWe used only federally mandated rebates when calculating Medicaid net prices. If we had been able to apply state supplemental rebates, actual net prices paid by Medicaid would have been lower than the prices shown in the figure. We found that the state supplemental rebates, in aggregate for the 34 states in our analysis, were equivalent to 4 percent of Medicaid expenditures for all drugs in the target quarter. bThe Medicare Part D net prices we report are estimates because CMS allows Medicare Part D plan sponsors to use a variety of methods to allocate post-purchase price adjustments to the NDC level.
When we examined the net prices that each program paid for the individual drugs in the sample after subtracting all reported beneficiary-paid amounts and post-purchase price adjustments, we found that Medicaid paid the lowest prices for 25 brand-name and 3 generic drugs, while DOD paid the lowest net price for 5 brand-name and 22 generic drugs, and Medicare Part D paid the lowest estimated net price for 3 brand-name and 20 generic drugs.

Page 11 GAO-14-578 Comparison of Retail Reimbursement Prices
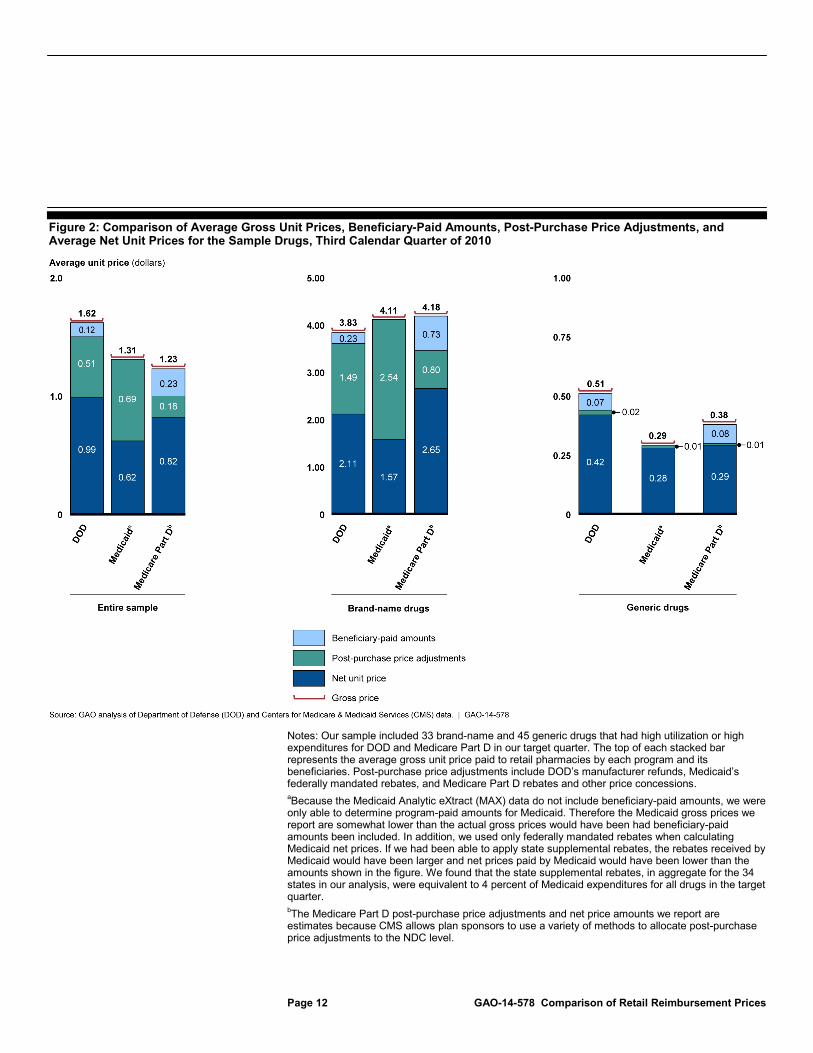
We found that multiple factors affected the net prices paid by each program, including the amount of post-purchase price adjustments each program received, the gross prices paid to pharmacies, the beneficiary-paid amounts, and market dynamics. Of these, a key factor for the entire sample and for the brand-name subset was the amount of manufacturer post-purchase price adjustments received. (See fig. 2.) On average across the entire sample, these price adjustments ranged from about 15 percent of the gross price for Medicare Part D to about 31 percent for DOD, and nearly 53 percent for Medicaid. For the brand-name subset of the sample, these rebates ranged from about 19 percent of the gross price for Medicare Part D to nearly 39 percent for DOD and 62 percent for Medicaid.
Page 12 GAO-14-578 Comparison of Retail Reimbursement Prices
Figure 2: Comparison of Average Gross Unit Prices, Beneficiary-Paid Amounts, Post-Purchase Price Adjustments, and Average Net Unit Prices for the Sample Drugs, Third Calendar Quarter of 2010
Notes: Our sample included 33 brand-name and 45 generic drugs that had high utilization or high expenditures for DOD and Medicare Part D in our target quarter. The top of each stacked bar represents the average gross unit price paid to retail pharmacies by each program and its beneficiaries. Post-purchase price adjustments include DOD’s manufacturer refunds, Medicaid’s federally mandated rebates, and Medicare Part D rebates and other price concessions. aBecause the Medicaid Analytic eXtract (MAX) data do not include beneficiary-paid amounts, we were only able to determine program-paid amounts for Medicaid. Therefore the Medicaid gross prices we report are somewhat lower than the actual gross prices would have been had beneficiary-paid amounts been included. In addition, we used only federally mandated rebates when calculating Medicaid net prices. If we had been able to apply state supplemental rebates, the rebates received by Medicaid would have been larger and net prices paid by Medicaid would have been lower than the amounts shown in the figure. We found that the state supplemental rebates, in aggregate for the 34 states in our analysis, were equivalent to 4 percent of Medicaid expenditures for all drugs in the target quarter. bThe Medicare Part D post-purchase price adjustments and net price amounts we report are estimates because CMS allows plan sponsors to use a variety of methods to allocate post-purchase price adjustments to the NDC level.

Page 13 GAO-14-578 Comparison of Retail Reimbursement Prices
The statutory framework allowing each program to obtain post-purchase price adjustments contributes to the wide range of percentages observed. Medicaid’s federally mandated rebates apply to virtually all drugs, while DOD’s refunds only apply to certain drugs (i.e., primarily brand-name drugs). Furthermore, we found that even when DOD received a refund for a given drug, DOD’s per-unit refund amount was less than Medicaid’s per-unit rebate for most of the drugs in our sample even though we applied only the federally mandated (i.e., URA-based) rebates for the calculation of Medicaid net prices. If we had been able to accurately apply the Medicaid state supplemental rebates, the per-unit Medicaid rebate amounts would be even larger (i.e., a greater percentage of the gross unit price) than we report. Finally, we found that Medicare Part D obtained the lowest per-unit price adjustments among the three programs. In contrast to the statutory authority allowing DOD and Medicaid to collect specific refunds and rebates, Medicare Part D plan sponsors rely on independent negotiations to obtain price concessions from drug manufacturers. As we have previously reported, plan sponsors have noted limitations on their ability to negotiate price concessions for some drugs due to formulary requirements set by CMS, lack of competitors for some drugs, or low utilization for some drugs that limit incentives for manufacturers to provide price concessions.24
The gross unit prices paid to retail pharmacies by each program and the magnitude of beneficiary-paid amounts also contributed to the differences in net prices, although to a lesser degree than post-purchase price adjustments. As shown in figure 2, each of the three programs paid the lowest gross unit price to pharmacies for one of the groups of sample drugs: Medicare Part D for the sample as a whole, DOD for the subset of brand-name drugs, and Medicaid for the subset of generic drugs. These different gross unit prices act as a “starting point” for determining net prices paid by the programs—a lower gross price negotiated between the program and the pharmacy makes it easier for the program to achieve a lower net unit price after accounting for beneficiary-paid amounts and post-purchase price adjustments.
Beneficiary-paid amounts also affected the net prices paid by each program; larger beneficiary payments contributed to lower net prices paid by the agency. The average beneficiary-paid amounts varied across the
24See GAO-10-242.

Page 14 GAO-14-578 Comparison of Retail Reimbursement Prices
three programs; for example, on average for all 78 drugs in our sample, beneficiaries paid nearly 19 percent—or $0.23—of Medicare Part D’s gross price per unit, while DOD beneficiaries paid about 7 percent—or $0.12—of DOD’s average gross price per unit.25
Market dynamics—such as manufacturer responses to offset discounts, the number of competitors for a given drug, and varying utilization of specific drugs by different programs—can also affect the net prices paid by these and other drug programs and thus the amount of savings the programs might be able to achieve. For example, the DOD, Medicaid, and Medicare Part D drug programs theoretically could have achieved savings had they been able to pay the lowest price for each of the drugs in our sample through having access to the post-purchase price adjustments available to the program with the lowest net price for each drug. However, market dynamics, such as manufacturer responses, likely would offset at least some of the savings. Previous reports by GAO and the Congressional Budget Office have noted that making rebates or other discounts available to federal programs could provide savings for the newly eligible programs but could result in higher prices for other programs—including those already eligible for the discounts—as drug manufacturers respond by raising their prices to offset the change.
Beneficiary-paid amounts also varied depending on the category of drugs examined. For the subset of brand-name drugs in our sample, beneficiary-paid amounts ranged from 6 percent of the gross price for DOD to 17 percent for Medicare Part D, while for the subset of generic drugs these amounts ranged from 14 percent of the gross price for DOD to 21 percent for Medicare Part D.
26
The magnitude of these potential offsetting price increases could depend on a number of factors. For example, if a large federal program with many beneficiaries became eligible for the discounts, manufacturers might
25While we only had data on beneficiary-paid amounts for two of the programs (i.e., DOD and Medicare Part D), beneficiary-paid amounts for Medicaid are generally nominal and it is likely that they would be smaller than corresponding amounts for DOD and Medicare Part D. 26See Congressional Budget Office, The Effect of the March Health Legislation on Prescription Drug Prices (Washington, D.C.: Nov. 4, 2010); GAO, Prescription Drugs: Expanding Access to Federal Prices Could Cause Other Price Changes, GAO/HEHS-00-118 (Washington, D.C.: Aug. 7, 2000); and GAO, Federal Drug Prices: Effects of Opening the Pharmaceutical Schedule Are Uncertain, GAO/T-HEHS-97-171 (Washington, D.C.: July 10, 1997).
Page 15 GAO-14-578 Comparison of Retail Reimbursement Prices
choose to raise prices by a greater amount than they would if a smaller program with fewer beneficiaries became eligible. Manufacturers might choose to raise prices more for drugs with fewer competitors than for drugs with many competitors. Furthermore, because federal prices are generally based on prices paid by nonfederal purchasers such as private health insurers, manufacturers would have to raise prices to those purchasers in order to raise the federal prices. The magnitude of these potential effects would vary by drug and would depend on a number of factors, including the relationship between the specific federal price extended to newly eligible programs and the price paid by nonfederal purchasers.
Other factors that may affect the magnitude of savings, if any, which could be achieved by DOD, Medicaid, and Medicare Part D include differences between the programs with regard to:
• programs’ formulary practices—for example, in exchange for price concessions, a program may offer a reduced copayment or preferred placement of a manufacturer’s drug in the formulary to encourage beneficiaries to choose that drug rather than a similar alternative. In addition, programs may differ in their ability to exclude certain drugs from their formularies, which can limit their ability to negotiate; for example, DOD officials told us that they must cover all drugs within a class.
• number of beneficiaries enrolled—that is, a program or plan with more beneficiaries can generally negotiate lower gross prices with pharmacies and more rebates from manufacturers through offering greater anticipated utilization of drugs than a program with fewer beneficiaries.
• utilization practices based on differences in beneficiary populations—for example, Medicare Part D’s predominantly elderly population is likely to use a different mix of drugs than a program such as Medicaid, which serves a younger population, and these utilization differences can affect each program’s ability to obtain discounts on certain drugs based on volume.
• copayment structure—for example, one program may achieve lower net prices on certain drugs by charging beneficiaries a higher copayment for the drug.
• type of pharmacy—for example, the Medicare Part D net prices we are reporting include data from prescriptions filled at mail order pharmacies used by the plans, which typically charge the plans less overhead than retail store-based pharmacies, while DOD prices are

Page 16 GAO-14-578 Comparison of Retail Reimbursement Prices
limited to prescriptions filled at store-based pharmacies; if the mail order prescriptions were excluded, the average Medicare Part D prices would likely be higher than those we report.27
We provided a copy of the draft report to DOD and the Department of Health and Human Services (HHS) for comment. DOD stated that it had no comments. HHS provided a technical comment, which was incorporated.
We will send copies of this report to relevant congressional committees and other interested members. The report also will be available at no charge on the GAO Web site at http://www.gao.gov.
If you or your staff have any questions regarding this report, please contact me at (202) 512-7114 or [email protected]. Contact points for our Offices of Congressional Relations and Public Affairs may be found on the last page of this report. GAO staff members who made key contributions to this report are listed in appendix II.
Sincerely yours,
John E. Dicken Director, Health Care
27Drugs dispensed through DOD’s mail order pharmacy are paid through direct purchase by DOD rather than through retail reimbursement. For further details on DOD’s prices for direct purchase drugs, see GAO-13-358.
Agency Comments

Appendix I: Scope and Methodology
Page 17 GAO-14-578 Comparison of Retail Reimbursement Prices
In this appendix we describe our data sources, the selection of the drug sample, and calculations of gross and net unit prices paid by the Department of Defense (DOD), Medicaid, and Medicare Part D for prescription drugs dispensed to their beneficiaries at retail pharmacies.
We obtained prescription drug claims data from DOD and the Centers for Medicare & Medicaid Services (CMS) for the third calendar quarter of 2010.1 Specifically, we obtained Pharmacy Data Transaction Service (PDTS) data from DOD covering prescription drugs dispensed to its beneficiaries by non-DOD retail pharmacies and we obtained Medicaid Analytic eXtract (MAX) data and Medicare Part D Prescription Drug Event (PDE) claims data from CMS.2 For each data source, we excluded claims with third-party payments; we also excluded physician-administered outpatient prescription drugs and items that are not traditionally considered drugs such as bandages, syringes, needles, diabetes test strips, and saline.3
1We chose the third calendar quarter of 2010 as the target quarter for our analysis because more recent Medicaid data were not available at the time that we began our analysis.
For Medicaid, we excluded Arizona and Delaware because claims from those states did not include third-party payment data. We included only fee-for-service Medicaid claims because claims paid under a capitated managed care plan or similar methods would not
CMS, an agency within the Department of Health and Human Services, oversees the Medicare and Medicaid programs at the federal level. 2PDTS is a centralized electronic database system that DOD uses to maintain prescription drug information from various points of service for its beneficiaries worldwide. Medicaid MAX files are derived from the Medicaid Statistical Information System (MSIS)—the reporting system where states provide Medicaid data on utilization and claims to CMS. We used the MAX Prescription Drug file. Because MAX data reflect final adjustments and corrections, they were the most accurate Medicaid data available for our analysis. The 2010 MAX data available at the time of our analysis contained data for 36 states; missing states were the District of Columbia, Idaho, Kansas, Maine, Massachusetts, Mississippi, Missouri, Nebraska, Nevada, New Jersey, North Dakota, Ohio, Texas, Utah, and Wisconsin. The Medicare Part D PDE data contain pharmacy claims for all prescription drugs dispensed to Medicare Part D beneficiaries. 3Because Medicare Part B primarily covers physician-administered outpatient drugs, we used Part B data to identify and exclude these drugs from our sample. However, Medicare Part B uses Healthcare Common Procedure Coding System (HCPCS) codes to identify drugs while DOD and Medicare Part D use national drug codes (NDC). Therefore, we used the July 2010 NDC-HCPCS Crosswalk Files for Medicare Part B to identify physician-administered drugs in the DOD and Part D data so we could exclude them.
Appendix I: Scope and Methodology
Data Sources
Appendix I: Scope and Methodology
Page 18 GAO-14-578 Comparison of Retail Reimbursement Prices
provide an accurate picture of drug prices actually paid.4 We also excluded Medicaid claims for beneficiaries who were also eligible for Medicare because retail prescription drugs for those beneficiaries are covered by Medicare Part D. We excluded Medicare Part D claims from plans that restrict enrollment, such as employer plans, Program of All-Inclusive Care for the Elderly (PACE) plans, and demonstration plans. We used Red Book data from Truven Health Analytics to determine the brand-name or generic status of each drug.5
We reviewed agency data for reasonableness and consistency, including screening for outlier prices and examining possible reasons for inconsistencies between the data sources. We also reviewed documentation and talked to agency officials about steps they take to ensure data reliability. We determined that the data were sufficiently reliable for our purposes.
We determined utilization using units of each (for drugs measured in discrete units such as tablets, capsules, vials, or kits), milliliters (for drugs measured in liquid volume), and grams (for drugs measured by weight). When calculating expenditures, we used the sum of the programs’ payments for each drug plus any reported beneficiary-paid amounts (e.g., deductibles and copayments). Cleaned and validated Medicaid data for 2010 were not available at the time that we selected our sample. Therefore, we used only DOD and Medicare Part D data to select our sample. However, such data became available later and we were able to use these data to determine Medicaid gross and net unit prices. To select the highest utilization and highest expenditure drugs for the sample, we aggregated the utilization and expenditure data at the drug level (i.e., drug name, strength, and dosage form) separately for DOD and Medicare Part D. For example, all national drug codes (NDC)
4Under a capitated managed care plan, providers receive a fixed rate per enrollee for all services covered under the plan. Therefore drug claims paid under such a plan would not provide an accurate picture of drug prices. 5Red Book is a drug pricing compendium with information about prices and other characteristics of drug products, published by Truven Health Analytics.
A brand-name drug is a drug marketed under a proprietary, trademark-protected name. After any patent and market exclusivity for the brand-name drug expires, other drug companies may develop a generic equivalent—a similar drug that has the same active ingredient, strength, dosage form, route of administration, and intended use.
Selection of the Drug Sample

Appendix I: Scope and Methodology
Page 19 GAO-14-578 Comparison of Retail Reimbursement Prices
corresponding to 10 mg tablets of Lipitor reimbursed by DOD on behalf of its beneficiaries were aggregated and the associated utilization and expenditures were summed and compared to other brand-name drugs, while NDCs corresponding to 10 mg tablets of atorvastatin (the generic equivalent of Lipitor) reimbursed by DOD were aggregated separately and compared to other generic drugs.6
Because we encountered difficulty in identifying and removing outliers from the Medicare Part D PDE data due to issues with the reliability of the “Quantity Dispensed” field, we narrowed the drugs considered for inclusion in the sample by first using DOD utilization and expenditure data to rank the top 150 brand-name and top 150 generic drugs in each category (high utilization and high expenditure). We were then able to clean the data by identifying and removing outliers from the much smaller subset of PDE claims corresponding to these drugs. We ranked the brand-name and generic drugs based on utilization and expenditures for Medicare Part D. We then combined the DOD and Medicare Part D rankings to determine the top brand-name and generic drugs that were reimbursed by both agencies.
The drug sample was selected to include the top 50 brand-name and top 50 generic drugs; 25 of the brand-name drugs and 25 of the generic drugs were selected on the basis of the combined DOD and Medicare Part D utilization ranks, and the other 25 brand-name and 25 generic drugs were selected on the basis of the combined DOD and Medicare Part D expenditure ranks. After accounting for drugs that were in both the high-expenditure group and the high-utilization group, the final sample contained 33 brand-name drugs and 45 generic drugs and accounted for at least 25 percent of utilization and 25 percent of expenditures for both DOD and Medicare Part D retail prescriptions filled by beneficiaries in the
6NDCs are three-segment numbers that are the universal product identifiers for drugs for human use. The Food and Drug Administration assigns the first segment of the NDC, which identifies the labeler (i.e., the firm that manufactures, repackages, or distributes a drug). The labeler assigns the second and third segments. The second segment identifies a specific strength, dosage form, and formulation (e.g., 20 mg capsules) and the third segment identifies package size and type (e.g., 100 capsules in a bottle). A drug can have multiple NDCs associated with it. For example, a drug made by one manufacturer, in one strength or dosage form, but in three package sizes, would have three NDCs where the first and second segments are identical and the third segment differs for each package size.

Appendix I: Scope and Methodology
Page 20 GAO-14-578 Comparison of Retail Reimbursement Prices
third calendar quarter of 2010 (see table 1). (See table 2 for a list of the drugs in the sample.)
Table 1: Percentage of Total Drug Utilization and Expenditures Included in the Retail Reimbursement Sample, Third Calendar Quarter of 2010
Program
Percentage of total drug utilization
included in the sample
Percentage of total drug expenditures
included in the sample Department of Defense (DOD) 26 percent 32 percent Medicare Part D 25 percent 27 percent
Source: GAO analysis of DOD and Medicare Part D data. | GAO-14-578
Note: Cleaned and validated Medicaid data for 2010 were not available at the time that we selected our sample. Therefore, we used only DOD and Medicare Part D data to select our sample. However, such data became available later and we were able to use these data to determine Medicaid gross and net unit prices.

Appendix I: Scope and Methodology
Page 21 GAO-14-578 Comparison of Retail Reimbursement Prices
Table 2: Retail Reimbursement Drug Sample, Third Calendar Quarter of 2010
Drug utilization rankinga Drug expenditure ranking
Drug name, strength, and dosage form DOD rank
Medicare Part D rank
Rank after combining DOD and
Medicare Part D utilization ranks
DOD rank
Medicare Part D rank
Rank after combining DOD and
Medicare Part D expenditure ranks
33 Brand-name drugs Actos (30 mg tablet) 27 12 17 Actos (45 mg tablet) 43 19 23 Advair Diskus 250 50 (0.25 mg/ actuation-0.05 mg/actuation, disk) 7 3 4 8 5 6 Aricept (10 mg tablet) 21 9 12 4 3 3 Carafate (1 gm/10 ml suspension) 5 8 5 Celebrex (200 mg capsule) 8 23 13 6 22 13 Copaxone (20 mg/1 ml kit) 15 10 11 Crestor (10 mg tablet) 18 20 18 16 17 15 Cymbalta (60 mg capsule, delayed release) 15 22 16 9 14 10 Generlac (10 gm/15 ml solution) 14 6 10 Januvia (100 mg tablet) 17 24 19 Klor Con 10 (10 meq tablet, extended release) 32 16 20 Klor Con M20 (20 meq tablet, extended release) 36 19 22 Lantus (100 units/1ml solution) 34 6 18 Lantus Solostar (100 units/1 ml solution) 36 29 25 Lexapro (10 mg tablet) 13 24 16 19 33 20 Lexapro (20 mg tablet) 23 28 21 Lidoderm (5% patch, extended release) 28 32 23 14 13 12 Lipitor (10 mg tablet) 12 12 11 13 15 13 Lipitor (20 mg tablet) 9 10 9 5 8 6 Lipitor (40 mg tablet) 17 17 15 10 11 9 Lovaza (1 gm capsule, liquid filled) 4 14 8 Namenda (10 mg tablet) 10 4 6 12 7 8 Nexium (40 mg capsule, delayed release) 1 2 1 1 2 1 Oxycontin (80 mg tablet, extended release) 42 16 22 Plavix (75 mg tablet) 3 1 2 2 1 1

Appendix I: Scope and Methodology
Page 22 GAO-14-578 Comparison of Retail Reimbursement Prices
Drug utilization rankinga Drug expenditure ranking
Drug name, strength, and dosage form DOD rank
Medicare Part D rank
Rank after combining DOD and
Medicare Part D utilization ranks
DOD rank
Medicare Part D rank
Rank after combining DOD and
Medicare Part D expenditure ranks
Singulair (10 mg tablet) 6 11 7 3 9 5 Spiriva (18 mcg capsule) 20 13 14 7 4 4 Tracleer (125 mg tablet) 22 31 21 Tricor (145 mg tablet) 31 29 23 35 28 24 Voltaren Gel (1% gel/jelly) 2 7 3 Welchol (625 mg tablet) 22 40 25 Zetia (10 mg tablet) 19 21 19 18 18 16
45 Generic drugsb Alendronate sodium (70 mg tablet) 49 15 25 Amlodipine besylate (5 mg tablet) 18 11 13 15 12 8 Amlodipine besylate (10 mg tablet) 34 15 23 25 14 17 Amlodipine besylate benazepril HCL (5 mg-20 mg capsule) 41 23 25 APAP hydrocodone bitartrate (325 mg-10 mg tablet) 12 20 14 24 34 22 APAP hydrocodone bitartrate (500 mg-5 mg tablet) 2 9 5 APAP hydrocodone bitartrate (500 mg-10 mg tablet) 26 26 25 APAP oxycodone (325 mg-5 mg tablet) 16 32 22 APAP oxycodone (325 mg-10 mg tablet) 22 39 23 APAP propoxyphene napsylate (650 mg-100 mg tablet) 10 24 15 Atenolol (50 mg tablet) 28 19 21 Chlorhexidine gluconate (0.12% liquid) 1 21 11 Fentanyl (100 mcg/1 hr patch, extended release) 26 11 16 Fexofenadine HCL (180 mg tablet) 14 16 13 Finasteride (5 mg tablet) 52 10 24 Fluticasone propionate (0.05 mg/actuation, spray) 2 6 3 Furosemide (20 mg tablet) 24 16 19 Furosemide (40 mg tablet) 14 6 9 Gabapentin (300 mg capsule) 6 7 6

Appendix I: Scope and Methodology
Page 23 GAO-14-578 Comparison of Retail Reimbursement Prices
Drug utilization rankinga Drug expenditure ranking
Drug name, strength, and dosage form DOD rank
Medicare Part D rank
Rank after combining DOD and
Medicare Part D utilization ranks
DOD rank
Medicare Part D rank
Rank after combining DOD and
Medicare Part D expenditure ranks
Hydrochlorothiazide (HCTZ) (25 mg tablet) 11 10 10 Lactulose (10 gm/15 ml solution) 7 2 4 Lansoprazole (30 mg capsule, delayed release) 11 17 10 Lisinopril (10 mg tablet) 17 17 15 Lisinopril (20 mg tablet) 15 13 12 Losartan potassium (50 mg tablet) 19 20 17 Losartan potassium (100 mg tablet) 18 9 8 Losartan potassium/HCTZ (100 mg-25 mg tablet) 28 29 21 Metformin HCL (500 mg tablet) 5 3 2 Metformin HCL (1000 mg tablet) 32 18 24 Metoprolol succinate (25 mg tablet, extended release) 23 13 15 Metoprolol succinate (50 mg tablet, extended release) 12 7 6 Metoprolol succinate (100 mg tablet, extended release) 20 8 10 Metoprolol tartrate (25 mg tablet) 21 14 17 Metoprolol tartrate (50 mg tablet) 25 12 18 Omeprazole (20 mg capsule, delayed release) 4 1 1 16 1 5 Pantoprazole sodium (40 mg tablet, enteric coated) 1 3 1 Simvastatin (20 mg tablet) 8 8 8 5 5 4 Simvastatin (40 mg tablet) 9 4 6 4 2 2 Simvastatin (80 mg tablet) 32 32 25 Tamsulosin HCL(0.4 mg capsule) 17 4 7 Tramadol HCL(50 mg tablet) 3 5 2 Valacyclovir HCL (1 gm tablet) 3 52 20 Venlafaxine HCL (75 mg capsule, extended release) 6 24 13 Venlafaxine HCL (150 mg capsule, extended release) 9 19 10 Zolpidem tartrate (10 mg tablet) 13 29 20 10 40 19
Source: GAO analysis of DOD and Medicare Part D data. | GAO-14-578

Appendix I: Scope and Methodology
Page 24 GAO-14-578 Comparison of Retail Reimbursement Prices
Notes: We excluded physician-administered outpatient drugs, over-the-counter drugs, and certain items such as bandages, syringes, needles, diabetes test strips, and saline. We determined drug utilization and expenditures by aggregating data for all national drug codes (NDC) corresponding to the same drug name, strength, and dosage form. Cleaned and validated Medicaid data for 2010 were not available at the time that we selected our sample. Therefore, we used only DOD and Medicare Part D data to select our sample. However, such data became available later and we were able to use these data to determine Medicaid gross and net unit prices. aWe determined utilization using units of each (for drugs measured in discrete units such as tablets, capsules, vials, or kits), milliliters (for drugs measured in liquid volume), and grams (for drugs measured by weight). The use of these standards may cause certain drugs (e.g., liquids) to have a higher utilization rank than they would if a different method had been used. bThree generic drugs tied for the rank of 25 after combining DOD and Medicare Part D expenditure ranks. Therefore, we present data in the “Drug expenditure ranking” columns for 27 generic drugs.
After selecting the sample, we calculated gross unit prices paid to pharmacies by DOD, Medicaid, Medicare Part D, and their beneficiaries for all individual drugs.7
We calculated gross unit prices by first adding the program-paid and beneficiary-paid amounts for each drug, then dividing these expenditures by total utilization. For Medicaid, we were unable to include beneficiary-paid amounts because CMS does not collect these data. Therefore the Medicaid gross prices we report are somewhat lower than the actual gross prices would have been had beneficiary-paid amounts been included. However, beneficiary-paid amounts for Medicaid are generally nominal and it is likely that they would be smaller than corresponding amounts for DOD and Medicare Part D. We also calculated gross unit prices for the entire sample, the subset of brand-name drugs, and the subset of generic drugs by dividing the total expenditures for all relevant drugs by the total utilization for those drugs.
All three programs (DOD, Medicaid, and Medicare Part D) obtain refunds, rebates, or other price concessions from drug manufacturers for at least some drugs dispensed to their beneficiaries by retail pharmacies. In order to more accurately calculate reimbursement prices paid to pharmacies by each program, we accounted for these post-purchase price adjustments by calculating program-paid net unit prices. To calculate these prices for DOD, we obtained post-purchase refund data from DOD for prescription
7For DOD, program payments are made directly by DOD. For Medicaid, program payments are made by each state’s Medicaid program; the federal government subsequently provides matching funds to the states to cover a portion of these costs. For Medicare Part D, program payments include payments made by the plan sponsor and payments made by Medicare. Because the Medicaid MAX data do not include beneficiary-paid amounts, we were only able to determine program-paid amounts for Medicaid.
Calculation of Gross Unit Prices
Calculation of Program-Paid Net Unit Prices

Appendix I: Scope and Methodology
Page 25 GAO-14-578 Comparison of Retail Reimbursement Prices
drugs dispensed to its beneficiaries at non-DOD retail pharmacies.8
To calculate program-paid net unit prices for Medicaid, we obtained from CMS the Medicaid statutory rebate data (the unit rebate amount, or URA) and Form CMS-64 data on aggregate Medicaid state supplemental rebates for our target quarter.
These refunds were subtracted from the NDC-level gross unit prices to determine net unit prices paid by DOD for each NDC. We then aggregated these net NDC-level prices as appropriate to determine average net unit prices for each individual drug in our sample, for the entire sample, for the subset of brand-name drugs, and for the subset of generic drugs.
9 Medicaid URA data were obtained at the NDC level. However, because state Medicaid programs report the amount of any supplemental rebates in aggregate on a quarterly basis, it is impossible to precisely apply these supplemental rebates to the calculation of net prices at the NDC or drug level. Therefore, we estimated Medicaid’s net prices using only the statutorily mandated rebates.10
8For certain drugs dispensed to beneficiaries under its retail pharmacy program, DOD is entitled to pay the federal ceiling price (FCP) which also pertains to its directly-purchased drugs. See 10 U.S.C. § 1074g(f) (added by National Defense Authorization Act for Fiscal Year 2008, Pub. L. No. 110-181, § 703(a), 122 Stat. 3, 188). This ensures that prescriptions for covered drugs dispensed to DOD beneficiaries on or after January 28, 2008, and paid for by DOD are subject to the pricing standards under 38 U.S.C. § 8126 (h)(2). Drugs covered under this provision are innovator single source and multiple source drugs marketed under an original New Drug Application from the Food and Drug Administration as well as biological products. In practice, DOD obtains these prices through post-purchase refunds paid by drug manufacturers. The refund amounts are calculated as the difference between the non-federal average manufacturer price (non-FAMP) and the FCP. DOD officials told us that some transactions for covered drugs, such as claims for which DOD is the second payer, do not generate a refund.
To do this, we subtracted the NDC-level URA from the gross unit price for each NDC to calculate a net unit price, then aggregated the results for the appropriate NDCs to determine average net unit prices for
9Manufacturers are required to provide rebates (which are calculated on the basis of URA data) to state Medicaid agencies for covered drugs. See 42 U.S.C. § 1396r-8. States may also negotiate supplemental rebates directly with manufacturers for drugs dispensed to Medicaid recipients. These supplemental rebates are reported in Form CMS-64, a standardized quarterly expenditure report that states submit to CMS documenting payments and rebates or offsets in various medical categories, including prescription drugs, to obtain federal matching funds to which states are entitled. 10Medicaid state supplemental rebates, in aggregate across all drugs for the 34 states in our analysis, totaled nearly $201 million in the third calendar quarter of 2010, or about 4.0 percent of total Medicaid expenditures in that quarter.

Appendix I: Scope and Methodology
Page 26 GAO-14-578 Comparison of Retail Reimbursement Prices
each individual drug in our sample, for the entire sample, for the subset of brand-name drugs, and for the subset of generic drugs.
For Medicare Part D, plan sponsors may negotiate rebates and other price concessions from manufacturers for drugs dispensed to their beneficiaries. Beginning in 2010, the annual total of all such price concessions at the NDC level must be reported to CMS on the annual Medicare Part D Direct and Indirect Remuneration (DIR) Detailed Report.11 However, because plan sponsors have several options for allocating DIR to the NDC level, calculation of the net drug price using the NDC-level DIR data provides only an estimate of the net prices paid by plan sponsors.12 We also evaluated the impact of point-of-sale (POS) rebates as reported in the PDE data to our calculation of net prices for Medicare Part D and determined that POS rebates were insignificant in comparison to DIR amounts; we therefore ignored POS rebates in our calculation of net prices.13
To estimate program-paid net prices for Medicare Part D, we obtained the 2010 DIR Detailed Report from CMS. To calculate the total DIR for each
11The annual Medicare Part D DIR Detailed Report includes discounts, chargebacks or rebates, cash discounts, free goods contingent on a purchase agreement, up-front payments, coupons, goods in kind, free or reduced price services, grants, and other price concessions or similar benefits from any source, including manufacturers, pharmacies, enrollees, or any other person, that decrease costs incurred by the Part D plan sponsor for the drug. 12Plan sponsors might not receive or record their DIR at the NDC level; however, CMS requires that plan sponsors in this situation use a reasonable allocation methodology to allocate DIR to the NDC level for DIR reporting purposes. For example, plan sponsors may allocate DIR based on actual drug utilization, the plan’s total drug expenditures, the plan’s brand-name drug expenditures, the plan’s total drug expenditures for drugs in the preferred brand-name tier, or any other method approved by CMS. Therefore, the Medicare Part D net prices we calculated are estimates that could vary if plan sponsors made different allocation choices from the options approved by CMS. 13POS rebates have already been subtracted in determining gross drug prices as reported in the PDE data. However, these POS rebates are also included in the DIR totals reported in the DIR Detailed Report. Therefore, if the total DIR amount is subtracted from the gross drug price in order to calculate the net price, POS rebates will be subtracted twice. However, in reviewing available POS data, we concluded that these POS rebates were insignificant and could be ignored for purposes of our analysis. Specifically, we found that only two Part D plans (out of 3,982 plans included in our analysis) reported POS rebates to CMS in the PDE data for 2010. In total, these two plans reported about $639,000 in POS rebates in 2010; this represents less than 0.01 percent of the $8.7 billion in DIR reported for that year.
Appendix I: Scope and Methodology
Page 27 GAO-14-578 Comparison of Retail Reimbursement Prices
NDC, we added the “rebate” and “all_other_dir” variables. Because the DIR report includes annual—rather than quarterly—data on price concessions, we estimated the proportion of Medicare Part D price concessions applicable to our sample by determining the proportion of 2010 expenditures that occurred in the third calendar quarter for each NDC in our sample. We multiplied this result by the total amount of price concessions reported in the 2010 DIR Detailed Report for a given NDC to estimate the proportion of each NDC’s DIR (in dollars) to apply to our analysis. We divided this result by the NDC-level utilization and subtracted the resulting per-unit price concession amount from the Medicare Part D gross unit price for that NDC. We then aggregated the results for the appropriate NDCs to determine average net unit prices for the entire sample, the subset of brand-name drugs, and the subset of generic drugs.
We interviewed DOD and CMS officials and reviewed literature describing factors that affect drug prices. The results of our analyses are limited to the 78 high-utilization and high-expenditure drugs in our sample for the third calendar quarter of 2010 and are not necessarily applicable across all drugs or any other time periods.

Appendix II: GAO Contact and Staff Acknowledgments
Page 28 GAO-14-578 Comparison of Retail Reimbursement Prices
John E. Dicken, (202) 512-7114 or [email protected]
In addition to the contact named above, key contributors to this report were Robert Copeland, Assistant Director; Zhi Boon; Karen Howard; Laurie Pachter; and Carmen Rivera-Lowitt.
Appendix II: GAO Contact and Staff Acknowledgments
GAO Contact
Staff Acknowledgments
(291122)

The Government Accountability Office, the audit, evaluation, and investigative arm of Congress, exists to support Congress in meeting its constitutional responsibilities and to help improve the performance and accountability of the federal government for the American people. GAO examines the use of public funds; evaluates federal programs and policies; and provides analyses, recommendations, and other assistance to help Congress make informed oversight, policy, and funding decisions. GAO’s commitment to good government is reflected in its core values of accountability, integrity, and reliability.
The fastest and easiest way to obtain copies of GAO documents at no cost is through GAO’s website (http://www.gao.gov). Each weekday afternoon, GAO posts on its website newly released reports, testimony, and correspondence. To have GAO e-mail you a list of newly posted products, go to http://www.gao.gov and select “E-mail Updates.”
The price of each GAO publication reflects GAO’s actual cost of production and distribution and depends on the number of pages in the publication and whether the publication is printed in color or black and white. Pricing and ordering information is posted on GAO’s website, http://www.gao.gov/ordering.htm.
Place orders by calling (202) 512-6000, toll free (866) 801-7077, or TDD (202) 512-2537.
Orders may be paid for using American Express, Discover Card, MasterCard, Visa, check, or money order. Call for additional information.
Connect with GAO on Facebook, Flickr, Twitter, and YouTube. Subscribe to our RSS Feeds or E-mail Updates. Listen to our Podcasts. Visit GAO on the web at www.gao.gov.
Contact:
Website: http://www.gao.gov/fraudnet/fraudnet.htm E-mail: [email protected] Automated answering system: (800) 424-5454 or (202) 512-7470
Katherine Siggerud, Managing Director, [email protected], (202) 512-4400, U.S. Government Accountability Office, 441 G Street NW, Room 7125, Washington, DC 20548
Chuck Young, Managing Director, [email protected], (202) 512-4800 U.S. Government Accountability Office, 441 G Street NW, Room 7149 Washington, DC 20548
GAO’s Mission
Obtaining Copies of GAO Reports and Testimony
Order by Phone
Connect with GAO
To Report Fraud, Waste, and Abuse in Federal Programs
Congressional Relations
Public Affairs
Please Print on Recycled Paper.