Regulation of glucose tolerance · 2012-07-18 · This increase improves glucose uptake by the...
35
Regulation of glucose tolerance Interaction with states of insulin resistance
Transcript of Regulation of glucose tolerance · 2012-07-18 · This increase improves glucose uptake by the...

Regulation of glucose tolerance
Interaction with states of insulin resistance
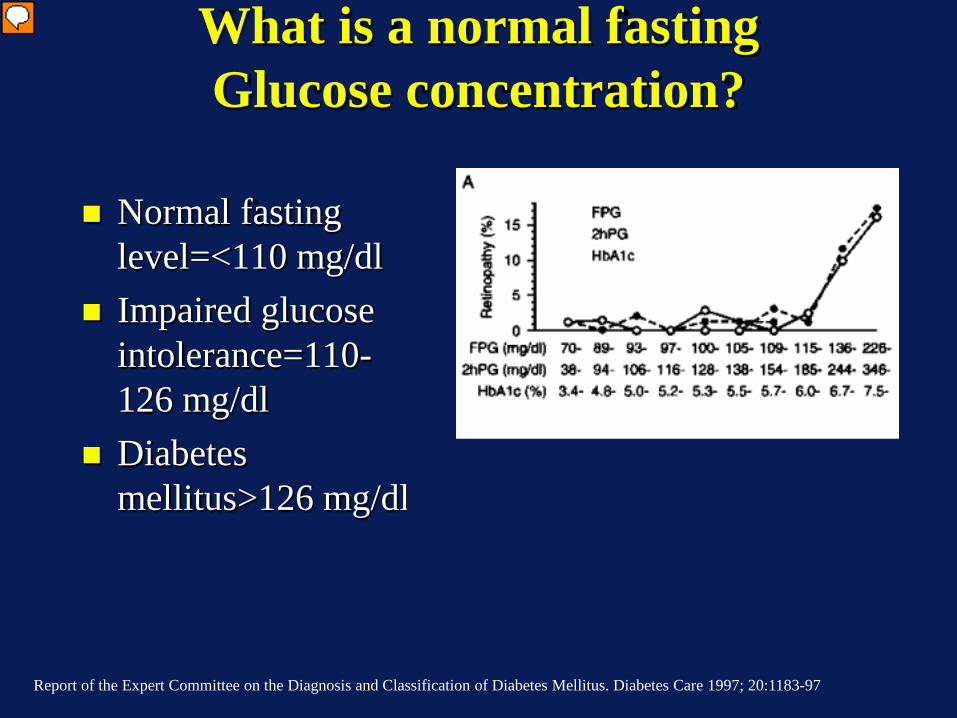
What is a normal fasting Glucose concentration?
Normal fasting
level=<110 mg/dl Impaired glucose
intolerance=110-126 mg/dl
Diabetes mellitus>126 mg/dl
Report of the Expert Committee on the Diagnosis and Classification of Diabetes Mellitus. Diabetes Care 1997; 20:1183-97
Presenter
Presentation Notes
ADA added HbA1c of 6.5% as a cutoff as well.

Steady State
In=Out
Out=Clearance x Concentration
Glucose

Relationship between Mass and Concentration
VolumeInjected MassC =ononcentrati

ICF= 28 Liters ECF =16 Liters
ISF =3/4 ECF 12 Liters
Plasma=1/4 ECF 4 liters
Capillary wall
70 kg lean male
Distribution of Total Body Water

Where is glucose?

If arterial glucose=100 mg/dl and insulin is at a basal concentration, what is the
glucose concentration in a muscle cell?
1. 100 mg/dl 2. Slightly less than 100 mg/dl~98 mg/dl 3. Very low ~2 mg/dl 4. Greater than 100 mg/dl
:10
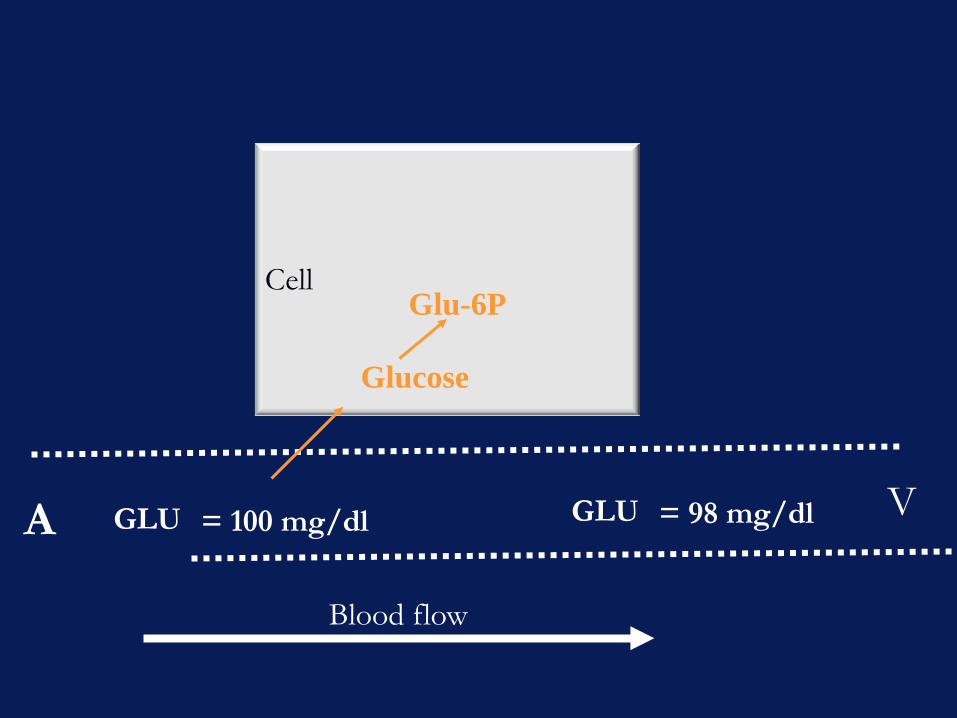
A V
Blood flow
Cell
GLU = 100 mg/dl GLU = 98 mg/dl
Glu-6P
Glucose

If arterial glucose=100 mg/dl ,what is the interstitial glucose concentration outside a
muscle cell in the presence of basal insulin?
100 mg/d
l
Slightly
less
than 98 mg/d
l
Very low ~2 m
g/dl
Greater t
han 100 m
g/dl
0% 0%0%0%
1. 100 mg/dl 2. Slightly less than 98 mg/dl 3. Very low ~2 mg/dl 4. Greater than 100 mg/dl
:10

Glucose mass (70 kg individual)
Total body water (TBW)=60% Body Weight 42 L TBW (=0.60 *70 kg) Extracellular fluid volume (ECF)=1/3 TBW 14 L ECF {~volume of distribution of glucose} Glucose 100 mg/dl=1 mg/ml=1 g/L 14 grams glucose in ECF 9 g/hr flux rate= rate of liver glucose production

Ingest 75 grams glucose
75 grams in 300 ml water (~2 cokes) By 180 minutes the glucose levels
return to normal Removed 5.3 times the mass of
glucose in the body in 180 min

Time (min)0 60 120 180
Glu
cose
(mg/
dl)
0
100
200
300
Non-DiabeticDiabetic

mg/dl Normal Glucose
Tolerance
Impaired glucose
tolerance
Diabetes mellitus
Fasting glucose
<110 100-125
>126
2-hour post oral glucose load
<140 140-199 >200
Glucose given after an overnight fast in subjects receiving at least 150–200 g of carbohydrate daily for 3 days before the test.
The Diabetes Expert Committee Criteria for
Evaluating the Standard Oral Glucose Tolerance Test
Report of the Expert Committee on the Diagnosis and Classification of Diabetes Mellitus. Diabetes Care 1997; 20:1183-97

50 g glucose load
If you did nothing glucose level exceed 300 mg/dl

Liver 9 g/hr Glucose=90 mg/dl
CNS
Brain 6 g/hr
Muscle Fat
3 g/hr
Insulin + +
Glucagon Insulin
Overnight fasted state
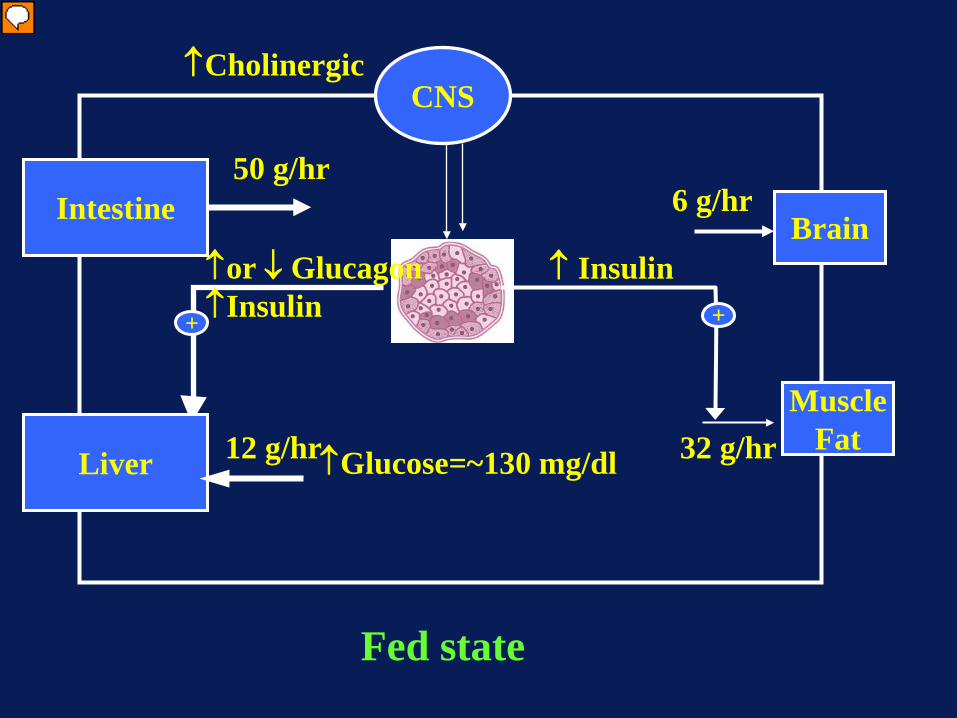
Liver 12 g/hr ↑Glucose=~130 mg/dl
CNS
Brain 6 g/hr
Muscle Fat 32 g/hr
↑ Insulin + +
↑or ↓ Glucagon ↑Insulin
Fed state
Intestine 50 g/hr
↑Cholinergic
Presenter
Presentation Notes
In the fed state you secrete extra insulin by the pancreas. The increase in insulin secretion facilities glucose uptake by insulin responsive tissues ( muscle and fat). It also in combination with hyperglycemia and the “portal signal” rapidly suppresses liver glucose production and switches the liver to a net consumer of glucose. The majority of the liver and muscle glucose uptake is stored as glycogen. Note brain glucose uptake is not altered ir is generally considered to not be responsive to insulin. ( note: there are some specific areas in the brain that do respond to insulin) The portal signal is a poorly understood neural reflex that augment liver glucose uptake when glucose is given via the oral route. ( see reviews by Alan Cherrington)

Liver 7 g/hr
↓Glucose=~70 mg/dl
CNS
Brain ~5 g/hr
Muscle Fat 2 g/hr
↓ Insulin + +
↑Glucagon ↓Insulin
Prolonged fasted state
Ketones
Presenter
Presentation Notes
In a prolonged fast you deplete liver glycogen stores. Insulin levels are low and glucagon levels rise to prevent hypoglycemia. The fall in insulin restrain muscle and fat glucsoe uptake. The fall in insulin also allows lipolysis ( the hydrolysis of triglycerides in fat to occur which releases fatty acids which can be used by muscle. Note that muscle loves to oxidize fat and glucose is only a minor energy source except when insulin is very high and muscle glucose uptake is very high. The fatty acids can also be converted by the liver to ketones this is facilitated by the low insulin and high glucagon levels.

Liver 46 g/hr
Glucose=~90 mg/dl
CNS
Brain 6 g/hr
Muscle Fat
40 g/hr
↓Insulin + +
↑Glucagon ↓Insulin
“Fight or Flight” state
Adrenergic
Increased Muscle Energy
Demand
Presenter
Presentation Notes
Exercise increases energy demand of muscle. This increase improves glucose uptake by the exercising muscle and the ability of insulin to increse glucsoe uptake. Thus the absolute levels of insulin can decrease yet muscle glucose uptake can increase. This increase in glucose usage must be met by a rise in glucose production or glucose concentration will fall. This increase is mediated by the fall in insulin and the rise in glucagon.
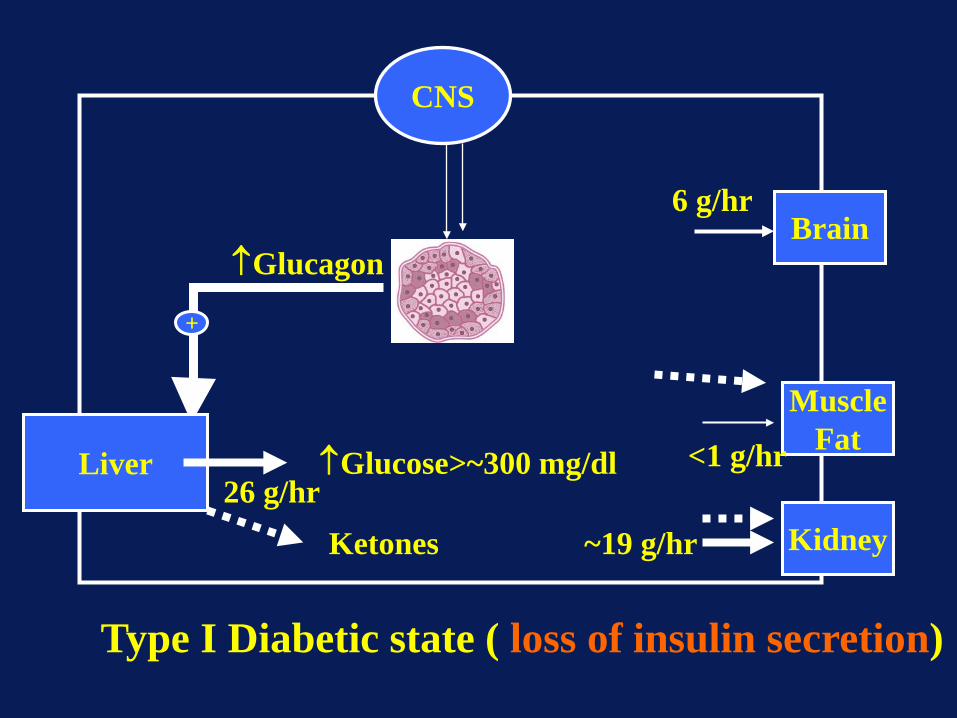
Liver 26 g/hr
↑Glucose>~300 mg/dl
CNS
Brain 6 g/hr
Muscle Fat <1 g/hr
+
↑Glucagon
Type I Diabetic state ( loss of insulin secretion)
Kidney ~19 g/hr Ketones

Tight control improves glycemic response to a meal

Dunning, B. E. et al. Endocr Rev 2007;28:253-283
Defects in both alpha and beta cell function are present in diabetes (T2DM)

Types of Resistance to Insulin Action
Log Hormone Concentration-11 -10 -9 -8
Biological Response
0
20
40
60
80
100
Decreased Responsiveness
Decreased Sensitivity and Decreased Responsiveness
Decreased Sensitivity
Normal
Modified from Figure 1, C. Ronald Kahn, Metabolism, 27:1893-1902, 1978.

Steady State
In=Out
Out=Clearance x Concentration
Glucose
If whole body glucose uptake is increased by 4-fold by meal levels of insulin, will glucose-
dependent glucose uptake increase?
Yes No
0%0%
:10
1. Yes 2. No
Glucose Concentration(mg/dl)
50 100 150 200
Glucose Uptake(mg/kg/min)
2
4
6
8
10
12
50 100 150 2000
2
4
6
8
10
12
Glucose Uptake(mg/kg/min)
Glucose Concentration(mg/dl)
4x insulin
basal insulin
4x insulin
basal insulin
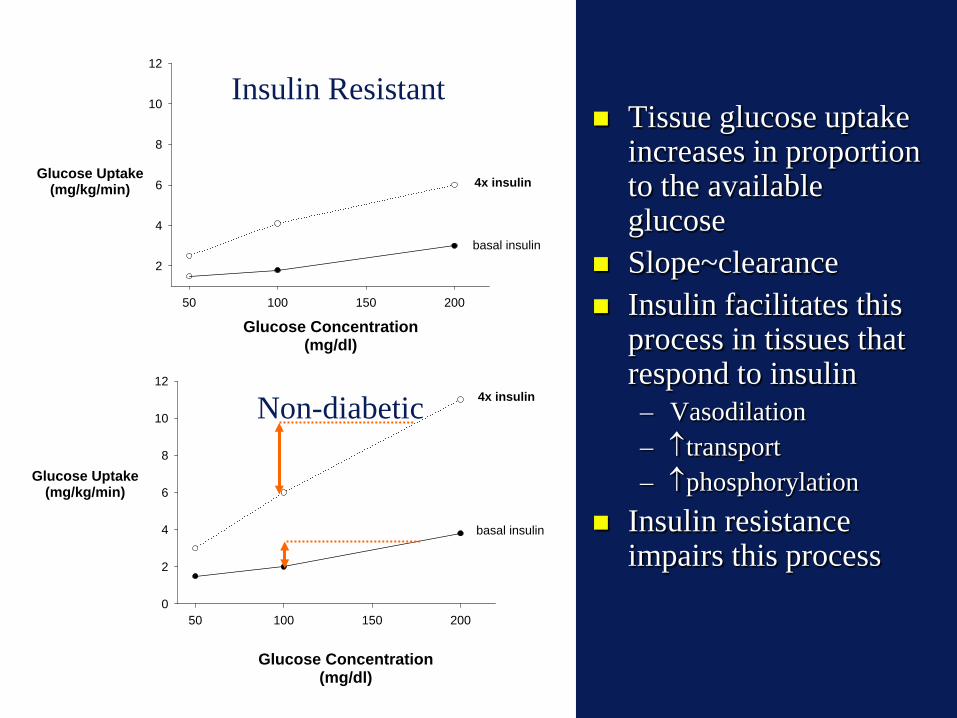
Tissue glucose uptake increases in proportion to the available glucose
Slope~clearance Insulin facilitates this
process in tissues that respond to insulin – Vasodilation – ↑transport – ↑phosphorylation
Insulin resistance impairs this process
Insulin Resistant
Non-diabetic

In the presence of hyperglycemia (~160 mg/dl) both insulin stimulated splanchnic and muscle glucose uptake are
impaired
Diabetes 53:2042-2050, 2004
Presenter
Presentation Notes
Somatostatin with replacement of insulin and glucagon with fixed hyperglycemia of ~160 mg/dl

Splanchnic metabolism during hyperglycemia
Persistent glucose production
Failure to take up glucose with additional insulin
Diabetic Non-Diabetic
Presenter
Presentation Notes
NSGB (A), SGU (B), and SGP (C) observed in the diabetic ([black small square]) and nondiabetic ([white square]) subjects during the low- and high-dose insulin infusions. Negative splanchnic balance represents net production, and positive balance represents net uptake. *P < 0.05 between groups, i.e., diabetic vs. nondiabetic subjects; [tau]P < 0.05 within groups, i.e., high- vs. Low-dose insulin infusion.

(0.8 mmol/min; 8.6 g/h)
Infusing glucose at a rate equal to endogenous glucose production suppresses glucose production
Presenter
Presentation Notes
Arterial glucose and insulin concentrations and splanchnic glucose output in the basal state and during intravenous glucose administration (0.8 mmol/min;144 mg/min; 2 mg/kg/min) in healthy subjects. Felig P,Wahren J. 1971. Influence of endogenous insulin secretion on splanchnic glucose and metabolism in man. J. Clin. Invest. 50:1702–11 Main point infusing glucose at the rate of endogenous glucose production suppresses liver glucose production

Individuals with type II diabetes make glucose despite high
glucose levels
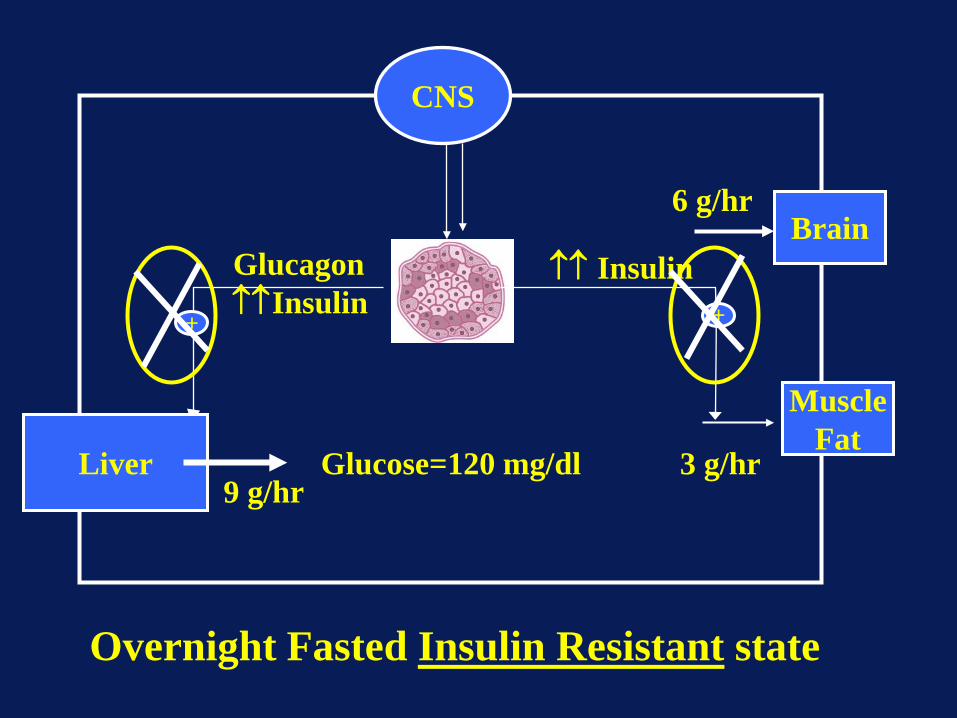
Liver 9 g/hr
Glucose=120 mg/dl
CNS
Brain 6 g/hr
Muscle Fat
3 g/hr
↑↑ Insulin + +
Glucagon ↑↑Insulin
Overnight Fasted Insulin Resistant state

The most common cause of insulin resistance is obesity
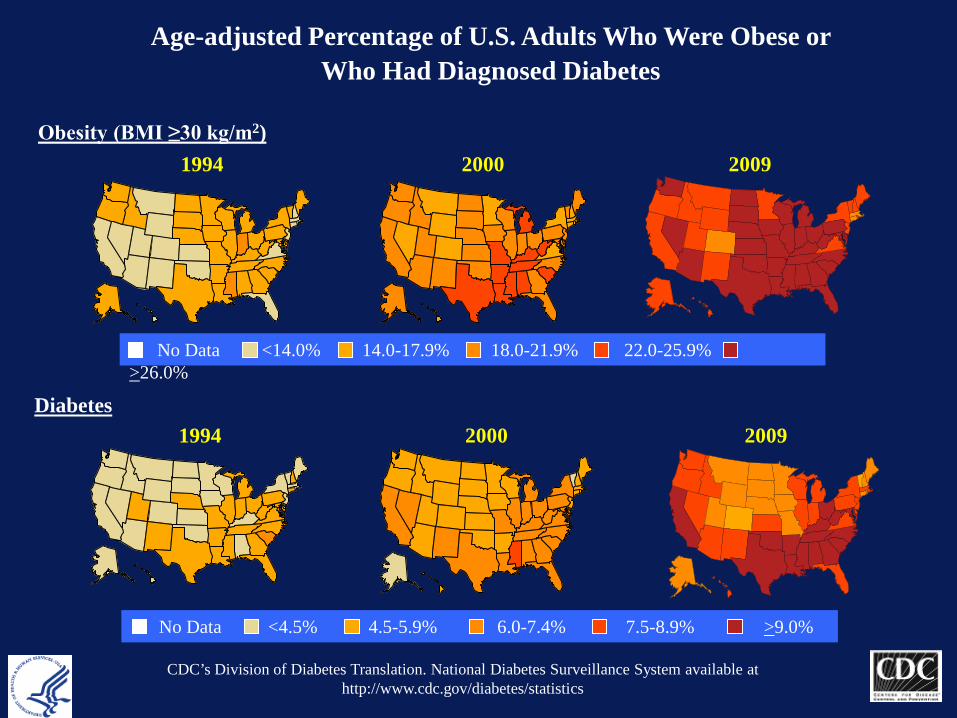
Age-adjusted Percentage of U.S. Adults Who Were Obese or Who Had Diagnosed Diabetes
Obesity (BMI ≥30 kg/m2)
Diabetes
1994
1994
2000
2000
No Data <14.0% 14.0-17.9% 18.0-21.9% 22.0-25.9% >26.0%
No Data <4.5% 4.5-5.9% 6.0-7.4% 7.5-8.9% >9.0%
CDC’s Division of Diabetes Translation. National Diabetes Surveillance System available at http://www.cdc.gov/diabetes/statistics
2009
2009

0
5
10
15
20
25
0
1
2
3
4
5
6
7
8
1958 61 64 67 70 73 76 79 82 85 88 91 94 97 00 03 06 09
Num
ber w
ith D
iabe
tes
(Mill
ions
)
Perc
enta
ge w
ith D
iabe
tes
Year
Percentage with Diabetes
Number with Diabetes
Number and Percentage of U.S. Population with Diagnosed Diabetes, 1958-2009
CDC’s Division of Diabetes Translation. National Diabetes Surveillance System available at http://www.cdc.gov/diabetes/statistics
Presenter
Presentation Notes
Methodology Number and percent of the U.S. population with diagnosed diabetes were obtained from the National Health Interview Survey (NHIS, available at http://www.cdc.gov/nchs/nhis.htm) of the National Center for Health Statistics (NCHS), Centers for Disease Control and Prevention (CDC) for years. Conducted continuously since 1957, the NHIS is a health survey of the civilian, noninstitutionalized population of the United States. The survey provides information on the health of the United States population, including information on the prevalence and incidence of disease, the extent of disability, and the utilization of health care services. The multistage probability design of the survey has been described elsewhere (1,2). Estimates for years 1958-1979 were obtained from published data (3) and estimates from 1980 forward were derived directly from the NHIS survey data. References 1. Massey JT, Moore TF, Parsons VL, Tadros W. Design and estimation for the National Health Interview Survey, 1985-1994. Hyattsville, MD: National Center for Health Statistics. Vital and Health Statistics 1989;2(110). 2. Botman SL, Moore TF, Moriarity CL, Parsons VL. Design and estimation for the National Health Interview Survey, 1995–2004. National Center for Health Statistics. Vital and Health Statistics 2000;2(130). 3. Harris MI: Prevalence of noninsulin-dependent diabetes and impaired glucose tolerance. Chapter VI in Diabetes in America, Harris MI, Hamman RF, eds. NIH publ. no. 85-1468, 1985.

Compensation for insulin resistance
Increase insulin secretion Mild to severe hyperglycemia
(Diabetes Type II; NIDDM) because of inadequate pancreas compensation
Glucose production by liver and uptake by peripheral tissues can be normal or increased

The end


![Modulation of myo-[3H]inositol uptake by glucose and sorbitol in ...](https://static.fdocuments.in/doc/165x107/586a9e901a28abf52b8bff27/modulation-of-myo-3hinositol-uptake-by-glucose-and-sorbitol-in-.jpg)