
Regulation and Non-Compliance: Magnitudes and Patterns for ...
25
W Charl Corn RE Ma Ur Work les H. Dyson ell Universit EGULA agnitud rmilla C king P n School of A ty, Ithaca, N ATION des an Chatte Pape Applied Eco New York 14 N AND nd Patt erjee a er onomics and 853-7801 U D NON terns fo nd Rav d Managemen USA N-COM or Indi vi Kan WP Janu nt MPLIA ia’s Fa nbur P 2014-0 uary 201 ANCE: actorie 05 14 es Act
Transcript of Regulation and Non-Compliance: Magnitudes and Patterns for ...

W CharlCorn
REMa
Ur
Workles H. Dysonell Universit
EGULAagnitud
rmilla C
king Pn School of Aty, Ithaca, N
ATIONdes an
Chatte
PapeApplied Eco
New York 14
N ANDnd Patt
erjee a
er onomics and 853-7801 U
D NONterns fo
nd Rav
d ManagemenUSA
N-COMor Indi
vi Kan
WPJanu
nt
MPLIAia’s Fa
nbur
P 2014-0uary 201
ANCE:actorie
05 14
es Act
It is the Policy of Cornell University actively to support equality of
educational and employment opportunity. No person shall be denied
admission to any educational program or activity or be denied
employment on the basis of any legally prohibited discrimination
involving, but not limited to, such factors as race, color, creed, religion,
national or ethnic origin, sex, age or handicap. The University is
committed to the maintenance of affirmative action programs which will
assure the continuation of such equality of opportunity.

3
Regulation and Non-Compliance: Magnitudes and Patterns for India’s Factories Act
Urmila Chatterjee The World Bank
and
Ravi Kanbur Cornell University
Version: December 9, 2013* Abstract1
Non–compliance with regulations by enterprises is said to be rife in developing countries. Yet there is limited systematic evidence of the magnitude of non-compliance at the enterprise level. Making innovative use of two complementary data sources, we are able to quantify non-compliance for India’s Factories Act without the question of illegality ever being raised directly with enterprises. We find that more than twice as many firms are not complying as are complying. Further, we find the number of non-compliant firms is much larger than the number of firms adjusting out of the regulation. Thus non-compliance with the Factories is a key feature of the “missing middle” in India. We explore the main trends and patterns of non-compliance and highlight a number of key issues for further analytical and policy research.
* The views expressed here are those of the authors and not of any institution they may be associated with. 1 We thank the seminar participants at CDS-Trivandrum, the Reserve Bank of India and the World Bank, New Delhi, for their comments and feedback.

4
1. Introduction
The regulatory burden on enterprise is a central topic in policy and popular discourse. Even the use of the word “burden” clearly conveys the tenor the discussion. It is often argued that enterprises are “overburdened” with regulation, and that these regulations impose costs which hinder enterprise productivity and growth. The policy prescription of this line of argument seems clear—to deregulate heavily. And yet the regulations were presumably introduced for a purpose. Economic theory suggests a number of contexts in which regulation can be beneficial to the economy and society as a whole. This line of argument, then, would be cautious about deregulation.
India is no exception to the global debate on regulation. It is common place to
find the argument that enterprise registration, labor laws and a multitude of other regulations are stifling enterprise and holding back the efficiency and growth of firms and with it the progress of the economy. A central piece of legislation is India’s Factories Act of 1948, which requires manufacturing enterprises of a certain size to register and thence comply with other regulations. This also defines the “organized” sector in India. The Factories Act is often suggested as one of the reasons for India’s “missing middle” in terms of enterprise size, since the requirement to register starts at 10 workers (20 workers if not using electricity). It is thought to hold back expansion of promising enterprises, inducing them to stay “beneath the radar screen” of the regulation. Yet for supporters of this Act it is an important component of providing protection of workers’ health and safety in the workplace, as well as the bulwark for protection of other worker rights.
It is striking is how little account is taken of non-compliance in these two major
strands of argument. Those in favor of regulation argue on the basis of assumed compliance. Those against must also be arguing on the basis of compliance, because presumably non-compliance makes the regulatory burden less. At the extreme, if there is no enforcement and no compliance at all, then it is as though the regulation did not exist. However, if there is partial enforcement then there may be costs of evading the regulation and its enforcement. What should be clear is that without an account of non-compliance, the discourse on regulation is severely incomplete. How much non-compliance is there? Who complies and who does not? How has the extent and pattern of non-compliance changed over time? Without answers to these questions the regulation debate takes place in an unreal theoretical setting which may not match reality on the ground.
The evidence for non-compliance at the enterprise level, in India and globally, is
mainly anecdotal. Stories based on individual experience abound. There is limited systematic evidence of the extent, nature and causes of non-compliance. One reason is that it is obviously difficult to ascertain non-compliance, in other words illegality, through a direct survey instrument, which is also needed to get information on possible correlates of non-compliance. However, there are some instances where non-compliance can be identified through indirect means. For example, in the case of minimum wage regulation, labor force surveys or household surveys routinely collect information on wages of the interviewed workers, as well as information on the nature of their employment. By matching the location/sector/occupation of each worker with official

5
gazetted minimum wages, it can be ascertained whether or not a minimum wage violation is taking place, without ever approaching the enterprise in which the individual works.2 But for this very reason these worker based approaches do not have the detailed enterprise level information needed for further firm based analysis of non-compliance.
However, for the Factories Act (1948) in India, there is also an indirect method
for determining non-compliance which does not broach illegality directly. Rather, the National Sample Survey Organisation (NSSO) surveys the universe of enterprises which are not registered under this Act and, inter-alia, asks about number of workers and electricity usage, which together define the criterion for required registration under the Act. Using this data source, therefore, non-compliance can quantified. These quinquennial NSSO surveys have of course been used in the past for a number of purposes, but not in any systematic way to explore magnitudes and patterns of non-compliance.3 In this paper we provide recent estimates for non-compliance and explore some of its patterns. We find non-compliance to be significant. Indeed, as many firms are not complying as are complying. Further, we find the number of non-compliant firms is much larger than the number of firms adjusting out of the regulation. We explore the main trends and patterns of non-compliance and highlight issues for analytical and policy research.
The plan of the paper is as follows. Section 2 reviews the theory of responses to regulation including non-compliance, and provides the frame for our investigation. Section 3 describes the Indian institutional setting and our data set, and presents the main trends on compliers, evaders, avoiders and outsiders to India’s Factories Act. Section 4 focuses on non-compliance and explores some key patterns of non-compliance in India. Section 5 concludes with a discussion of policy implications and highlights areas for further analytical and policy research. 2. Theory: Regulation, Compliance and Types of Informality
There is a large literature on the economic theory of (non) compliance with laws and regulation. The empirical literature is more scant, particularly in developing countries, because of the data issues mentioned in the introduction. At one level the theoretical framework is straightforward. Following Becker (1968) the problem for an individual is posed as the balance between the benefits of breaking the law and the costs of doing so. The costs depend on the probability of getting caught, and on the penalty imposed if caught. Tax evasion was among the earliest issues explored in this framework, starting with the work of Allingham and Sandmo (1972); a recent review is provided by Slemrod (2007). In the same spirit, the initial investigation of compliance with minimum wage legislation by Ashenfelter and Smith (1979) has led to a significant theoretical and empirical literature (for recent examples, see Basu, Chau and Kanbur, 2010, and Ronconi, 2010).
2 For an application of this method to South Africa see Bhorat, Kanbur and Mayet (2012), and for an application to Chile see Kanbur, Ronconi and Wedenoja (2013). 3 For example, Bedi and Banerjee (2007) and Nagraj (2002).
6
Within the broad framework outlined in the literature above, we can pose as follows the specific decision for an enterprise on whether or not to register under India’s Factory Act of 1948. Let output Y be a function of labor, L, and an entrepreneurial ability or productivity parameter, A. If the production function is F(L, A) and the wage is w then profit, π, in a world without regulation is given by
π = F(L, A) – wL
The firm is assumed to choose employment to maximize profit. There is then a “natural” size distribution of firms by employment size, given by L(A). Standard assumptions ensure that L is increasing in A—more productive firms are larger. Suppose now that a regulation is brought in which requires registration if employment exceeds L^. Suppose further than registration imposes a fixed cost of T. Then with perfect enforcement profits are π = F(L, A) – wL if L ≤ L^
F(L, A) – wL – T if L > L^ With this framework, we can characterize the patterns of response by firms with different productivity A.
Let A^ be the value of A at which a firm would employ L^ in the unregulated
economy. It can then be shown that under certain conditions there exists a value of A, such that A1>A^, with the following properties:
For A greater than A1, the firm registers. For A between A1 and A^ the firm puts itself outside the regulation by
employing L^ workers. For A less than or equal to A^ the firm would employ less than L^ workers
even without the regulation, and so is outside the remit of the regulation. Of course for firms with A less than A^ the regulation does not bite and the pre-regulation size distribution is unchanged. For A greater than A^ employment size is unaffected in this specification because the costs of registration are in the form of fixed costs. The dramatic impact is on firms with intermediate levels of productivity, who reduce employment and output to come out of the regulation net.4 This is, indeed, the “missing middle” which has been much discussed, particularly in the Indian context.5 Now consider the situation where there is at is at least some enforcement of the regulation. This can be modeled, and is usually modeled, with risk neutral enterprises that face an expected cost if they violate the regulation. This is the product of the probability, p, of getting caught and the penalty, C, if caught. If p and C both depend on L, the firm’s profit function, , has several components:
4 For a similar argument in the context of taxation thresholds, see Chatterjee and Wingender (2012) 5 Mazumdar and Sarkar (2008)

7
= F(L, A) – wL if L ≤ L^ F(L, A) – wL –T if L > L^ and registration F(L, A) – wL - p(L)C(L) if L > L^ , and no registration
The firm now has two decisions to make simultaneously, whether to register and how many workers to employ. The answer clearly depends on the specification of p(L) and C(L) relative to T. For example, if the probability of getting caught is close to one or the penalty is very high then there is no violation of the regulation. If p and C do not depend on L, then to register or not is essentially a comparison of two fixed cost terms T and pC, and all firms either register or do not. However, if p(L) and C(L) are increasing in L, for example, if detection is easier with larger firms or if the penalty for non-registration is higher for larger firms, then it can be shown that there are intermediate ranges of p, T and C where under certain conditions there exist values of A, A1 > A2 >A^ with the following properties6:
For A greater than A1, the firm registers. For A between A1 and A2, there is non-compliance--firm is required to
register but does not and is thus illegal. For A between A2 and A^ the firm puts itself outside the regulation by
employing L^ workers. For A less than or equal to A^ the firm would employ less than L^ workers
even without the regulation, and so is outside the remit of the regulation. The intuition behind these ranges is straightforward. Clearly for A less than or
equal to A^, in other words for those firms which would employ less than L^ workers in a world without regulation, the regulation does not bite and the size distribution is unaffected as before. For A above A^ a fixed cost of T is paid if registered, and a cost of p(L)C(L) if not registered. Whatever the relative values of these two, for A slightly above A^ both of these are large enough to make it worthwhile to move out of regulation altogether by employing L^ workers. As A^ rises so does the return from employing more workers. As the productivity threshold of A2 is crossed it is worthwhile to hire more than L^ workers, whether with registration or not. However, p(L) and C(L) are still small enough relative to T to make it worthwhile to violate the regulation. As productivity and, thus, firm scale continues to rise beyond the next threshold A1, p(L) and C(L) now become so large that they dominate the saving of the registration cost T by not registering. Hence firms above A2 will always register.
Suppose, for example, that L^ is 10 workers. Then the theory suggests that
enterprises can be classified into four categories:
A. Enterprises which fall into the ambit of the law and comply. For example, a 20 worker enterprise which registers. These are the “compliers”, who constitute the organized or formal sector.
6 There are many papers with variants of these results for different specifications. A recent example is de Paula and Scheinkman (2007). See also Kanbur and Keen (2013) in the context of tax avoidance and evasion. This strand of the literature grows out of the original work of Lucas (1978).
8
B. Enterprises which fall into the ambit of the law but do not comply. For example,
a 15 worker enterprise which does not comply. These enterprises are operating illegally relative to the law in question. They are the “evaders.”
C. Enterprises which are not in the ambit of the law but only because they have adjusted out of the scope of the law. For example, a 9 worker enterprise, which would have been a 12 worker enterprise without the regulation. These are the “avoiders.”
D. Enterprises which are not in the ambit of the law because even their pre-regulation activity would not have been covered by the law. For example, a 2 worker enterprise. We might call these the “naturally informal.” Another label for them would be the “outsiders.” The argument above gives a new twist to the “missing middle” thesis. It says that
there are two phenomena to look for in the middle of the “natural” size distribution. The first is a movement out of the middle to avoid registration costs. The second, however, is non-compliance to evade registration costs. Alongside the “missing” middle is then the “present” but non-compliant middle.
With this conceptual backdrop, we now move to examine the extent and nature of
non-compliance with India’s Factories Act (1948).
3. Compliers, Evaders, Avoiders and Outsiders
The Factories Act (1948) states that all enterprises in manufacturing who use electricity and have 10 workers or more, and all enterprises with 20 workers or more who do not use electricity, are required to register. Registered enterprises are referred to as the organized (“formal”) sector. Information about registered enterprises is gathered through the Annual Survey of Industries (ASI). Every five years the National Sample Survey Organisation (NSSO) conducts a survey of enterprises that are not registered under the Factories Act, in other words, of the “unorganized” sector. The survey collects a large amount of information on these enterprises, including the number of workers and electricity usage. It is possible, therefore, to analyze the extent and nature of non-compliance with the Factories Act using this information. Although the “shorthand” characterization of the organized sector is often in terms of “10 workers or more”, as noted above the actual Act also has a differentiation between enterprises who do and who do not use electricity—for those who do not, the threshold is 20 workers or more. However, we argue in Appendix A that the electricity use criterion, important though it may have been in 1948, is increasingly irrelevant. In what follows we will define formality using just the “10 workers or more” criterion.
Given the two data sources, we can quantify the size of categories A, B, C and D. Category A firms are those that have registered under the Factory Act, which are to be

9
found in the ASI data.7 Category B firms are those in the NSSO survey who have 10 workers or more. These firms should have registered but have not done so. Category C presents a particular difficulty because it is based on a counterfactual—how exactly do enterprises adjust out of the regulation? However, we can argue as follows based on the theory of the previous section. If an enterprise would have had 10 workers or more without the regulation but now wishes to adjust out and come in “just below the radar”, then it would adjust down to just below 10— in other words, 9 workers. Thus the observed number of firms in the NSSO survey in the 9 worker category will give us an overestimate of Category C, since some of the 9 worker firms in the NSSO could be “naturally” of size 9 and will not have adjusted out of the regulation. There is then a corresponding underestimate of Category D. With these definitions, we now move to an examination of the levels and trends in the different categories of firms.
Table 1 presents the magnitudes and characteristics of groupings A, B, C and D
for using the 2009-10 ASI and the 2010-11 NSSO surveys8. It is seen that the formal sector (A) accounts for 0.8% of all firms9 and 24.8% of all manufacturing employment. The informal sector thus accounts for 75.2% of employment in this data. As between different types of informality, the evaders, (B), account for 91.5% and the avoiders (C) account for at most 0.4% of enterprises. The vast majority of enterprises, 97.3% are in category D—the “outsiders.” Further, the figure in Table 1 is an underestimate of this category since not all of those currently classified in category C are necessarily “avoiders.” The outsiders account for 64.1% of all employment, again an underestimate. Thus, the Factories Act directly affects firms that employ at most 35.9% of workers (categories A, B and C). Of the informal sector employment as a whole (B, C and D), the evaders account for 13.0% of workers, the avoiders account for at most 1.7%, and the outsiders account for the balance of 85.2%.
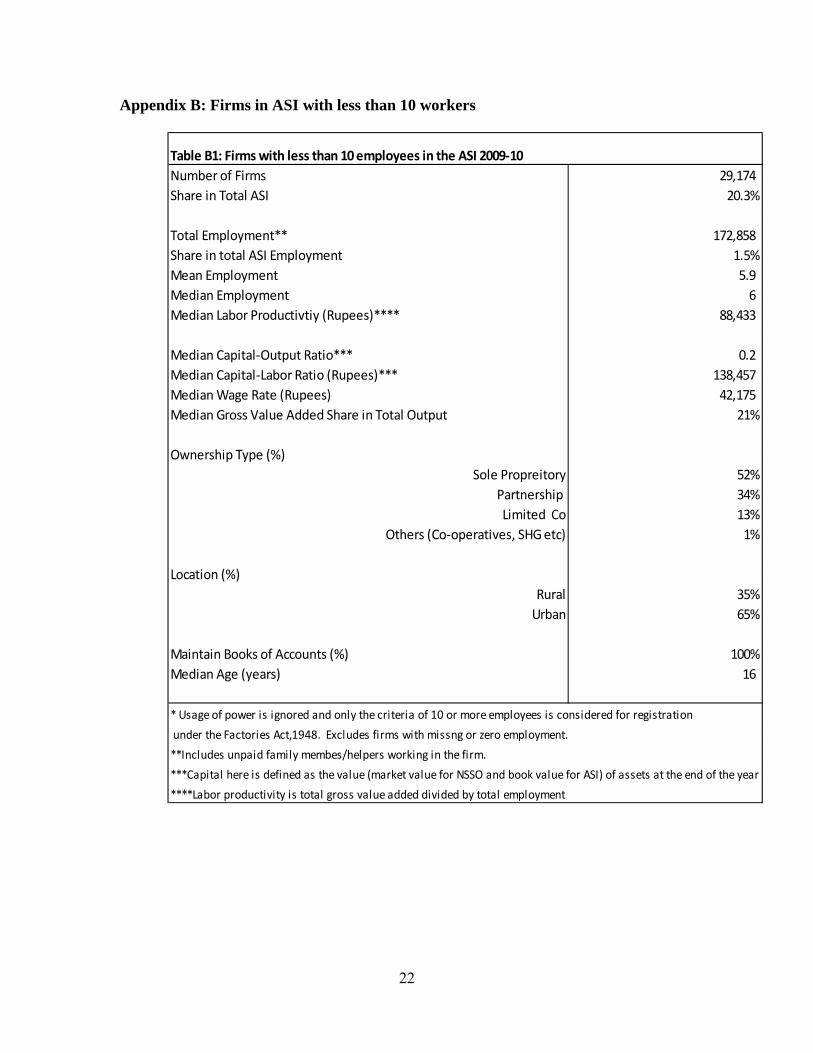
7 Interestingly, and perhaps somewhat surprisingly, there are a significant number of firms in the ASI who have less than 10 workers—these firms do not need to be registered but are nevertheless registered. This phenomenon has been noted before, for example by Bedi and Banerjee (2007). One explanation for this might be that they were once registered but have not bothered to or managed to deregister, or are still erroneously being carried on the register. Characteristics of these firms are set out in Appendix B. 8 We use enterprise data from the ASI 2009-10 and the NSSO 2010-11 surveys. The survey period for the ASI was from October 2010 to April 2011 and for the NSSO from July 2010 to June 30 2011. 9 A factory unit is defined as firm here.

10
From the 2010-11 NSSO survey, 256,993 firms had 10 workers or more but were
not registered. This compares with 143,452 firms registered under the Act, as shown by the ASI for 2009-10. Thus more firms appear to be non-compliant than compliant with the law. Non-compliant firms formed a staggering 64.2% of compliant and non-compliant enterprises. However, non-compliant enterprises are much smaller—a mean size of 17.7 workers compared to 79.9 workers for compliant enterprises. The total number of workers employed by these non-compliant enterprises was 4,543,668. This compares with 11,500,000 workers employed by all registered firms as shown in the ASI. In other words, unregistered enterprises accounted for 28.3% of the labor force of compliant and non-compliant enterprises.
How does non-compliance compare to the magnitude of adjustment out of the
regulation? In 2010-11 the number of enterprises in the 9 workers category was 67,249, with total employment of 605,245. Thus, even if we attribute all of these enterprises to the adjusted out category, their number is less than the number of non-compliant firms, and total employment in them is less than a third of that in non-compliant firms. But these are of course overestimates of adjustment out of regulation since it includes firms who are naturally of size 9. It would seem, therefore, that non-compliance with regulation dominates adjustment out of regulation by a large margin.
A B C D
ASI Firms
NSSO Firms with
10 or employees
NSSO Firms with
9 employees NSSO Rest
Number of Firms 143,452 256,993 67,249 16,900,000
Share of Firms 0.8% 1.5% 0.4% 97.3%
Total Employment** 11,500,000 4,543,668 605,245 29,700,000
Share of Employment 24.8% 9.8% 1.3% 64.1%
Mean Employment 79.9 17.7 9.0 1.8
Median Employment 21 13 9 1
Median Labor Productivtiy (Rupees)**** 135,626 59,820 74,000 23,400
* Usage of power is ignored and only the criteria of 10 or more employees is considered for registration under the Factories Act,1948.
Excludes firms with missng or zero employment.
**Includes unpaid family membes/helpers working in the firm.
***Capital here is defined as the value (market value for NSSO and book value for ASI) of assets at the end of the year
****Labor productivity is total gross value added divided by total employment
Firm Categories
Firm Characteristics
Table 1: Compliers, Evaders, Avoiders and Outsiders under the Factories Act, 1948, in 2009‐10*

11
Some idea of the trends is given by comparing the 2010-11 NSSO survey and
2009-10 ASI with the 2005-06 NSSO survey and ASI in (Table 2). Share of formal firms went from 0.7% of all firms to 0.8% over this five year period, and their employment share increased from 19.5% to 24.8%. Thus, the employment share of total informality (B, C and D) declined correspondingly. The employment share of non-compliant firms (B) went from 8.9% to 9.8%, a clear upward trend. The share of employment of the avoiders (C) does not seem to have changed at all, while the share of the outsiders (D) went down from 70.3% to 64.1%. In 2005-06 the number of non-compliant enterprises was 248,265 compared with 124,710 compliant enterprises, a share of 66.7%, compared to a share of 64.2% in 2010-11. The corresponding share of the workforce was 31.5% in 2005-06, compared to 28.3% in 2010-11. There is thus only a very slight downward trend in this ratio of non-compliance to compliance, but it remains very high.10
Focusing on 2009-10 (the patterns are similar for 2005-06) it is seen that the
average size of enterprise falls from A through D—from 79.9 to 17.7 to 9 to 1.8. However, the standard deviation of employment is high, especially with the larger sized firms. The median in such cases becomes a better average for comparison. The trend of falling average employment from A to D holds true even for the median. The average labor productivity, measured as gross value added divided by total persons employed, of firms in category A is more than twice that of the firms in category B and C and nearly six times that of the firms in D.
10 Referring to a much earlier period, Nagraj (2002) finds that “In 1980, 53 percent of factories employing 10 or more workers did not register themselves under the Act. This proportion increased to 58 per cent in 1990”.
A B C D
ASI Firms
NSSO Firms with
10 or employees
NSSO Firms with 9
employees NSSO Rest
Number of Firms 124,710 248,265 62,980 16,700,000
Share of Firms 0.7% 1.4% 0.4% 97.5%
Total Employment** 8,809,946 4,042,081 566,821 31,800,000
Share of Employment 19.5% 8.9% 1.3% 70.3%
Mean Employment 70.6 16.2 9.0 1.9
Median Employment 20 12 9 2
Median Labor Productivtiy (Rupees)*** 81,884 32,748 37,744 9,432
* Usage of power is ignored and only the criteria of 10 or more employees is considered for registration under the Factories Act,1948.
Excludes firms with missng or zero employment.
**Includes unpaid family membes/helpers working in the firm.
***Labor productivity is total gross value added divided by total employment
Table 2: Compliers, Evaders, Avoiders and Outsiders under the Factories Act, 1948, in 2005‐06*
Firm Categories
Firm Characteristics

12
4. Compliance versus Non-Compliance
The previous section showed the significant amount of non-compliance with India’s Factories Act. Further, it showed that non-compliance is a phenomenon that is much larger than the phenomenon of adjusting out of regulation. In this section we will focus specifically on compliance versus non-compliance. For this exercise our universe is all firms with 10 workers or more, either in the ASI data set or in the NSSO data set.11 Those in the ASI data asset are compliant, and those in the NSSO data set are non-compliant.
11 Recall that in the ASI there are a significant number of enterprises who have less than 10 workers, although these are very small and do not account for a large share of employment among ASI firms (only 1.5%, see Appendix B). These enterprises are excluded from the analysis of this section.
Compliant Non‐Compliant
Number of Firms 114,278 256,993
Share of Firms 30.8% 69.2%
Total Employment** 11,300,000 4,543,668
Share of Employment 71.3% 28.7%
Mean Employment 98.8 17.7
Median Employment 30 13
Median Labor Productivtiy (Rupees)**** 151,754 59,820
Median Capital‐Output Ratio*** 0.2 0.5
Median Capital‐Labor Ratio (Rupees)*** 166,727 68,947
Median Wage Rate (Rupees) 61,247 39,460
Median Gross Value Added Share in Total Output 20.0% 59.2%
Ownership Type (%)
Sole Propreitory 24% 86%
Partnership 32% 12%
Limited Co 41% 0%
Others (Co‐operatives, SHG etc) 3% 2%
Location (%)
Rural 39% 43%
Urban 61% 57%
Maintain Books of Accounts (%) 100% 50%
Median Age (years) 12 6
* Usage of power is ignored and only criteria of 10 or more employees is considered for registration under the Factories Act,1948.
**Includes unpaid family membes/helpers working in the firm
***Capital here is defined as the value (market value for NSSO and book value for ASI) of assets at the end of the year
****Labor productivity is total gross value added divided by total employment
Table 3: Compliance under the Factories Act, 1948, in 2009‐10*

univelocatifirmsHowecompthe twand li
17.7 comppositithe smof motwo c
showthat tUttarreasoshowregistFurni
Table 3 prerse of enterpion, 57% of s—the phenoever, complypared to 6 yewo types of fimited comp
Complian
for non-compliant firms aive associatimallest size ore than 500categories.
We turn n
ws the complihere are larg
rakhand but von for these sws that there i
tering close iture and We
resents the bprises. Fromnon-comply
omenon thusying firms arears. Finallyfirms, with spanies and pa
nt firms are mmpliant firmsand 28.7% foion between category of
0 workers, w
now to patteriant firms asge variationsvery weak pstate patternsis a clear indto full compearing Appar
basic data onm this univerying firms ars seems rougre significan
y, there are sisole proprietartnerships d
much larger,. The sharesor non-compsize and com10-19 workeith increase
rns of compls a fraction os, with good erformance s could be thdustrial pattepliance, goinrel.
13
n compliant arse, only 30.re urban, comghly equally ntly older, wiignificant diorships domdominating a
with mean es of emploympliant firms. mpliance. Cers, to close in complian
liance acrossof firms requperformancein states like
he nature of iern in complng to complia
and non-com8% are comp
mpared to 61spread acrosith a medianifferences in
minating amoamong the c
employmentment are thu Figure 1 sh
Compliance rto 100% for
nce as size in
s states and auired to regise in states like Delhi and Windustrial coliance, with pance rates of
mpliant firmsmpliant. In ter
1% of the coss the rural-u
n age of 12 y ownership t
ong the non-compliers.
t of 98.2 comus reversed—hows that therates go fromr the largest ncreases in b
across indusster, by stateke ChandigaWest Benga
omposition. pharmaceutif around 20%
s from this rms of
omplying urban divide
years type across compliers,
mpared to —71.3% for ere is a m 15.1% for size categoretween these
stry. Figure . It is seen arh and al. One
Figure 3 icals % in Textiles
e.
ry e
2
s,

14
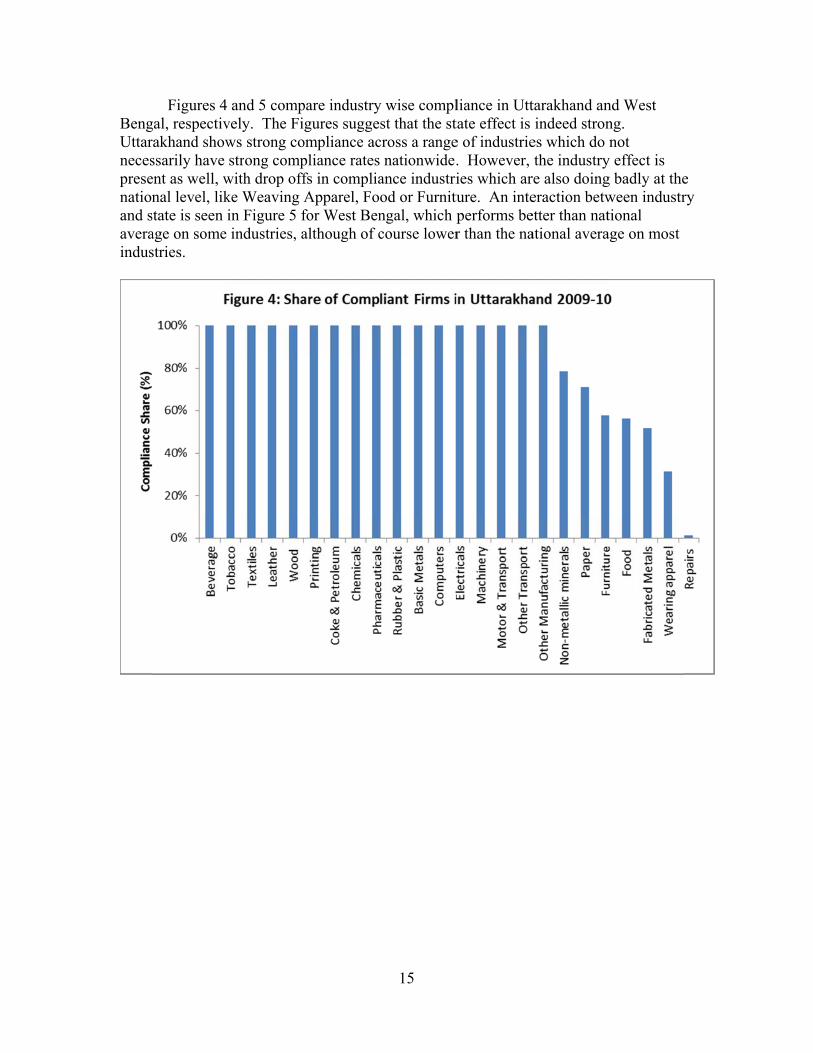
BengUttarnecespresenationand saveraindus
Figures 4 gal, respectivrakhand showssarily have ent as well, wnal level, lik
state is seen iage on some stries.
and 5 compvely. The Fiws strong costrong comp
with drop offke Weaving Ain Figure 5 findustries, a
pare industrygures sugge
ompliance acpliance rates fs in compliaApparel, Foofor West Benalthough of c
15
y wise complst that the st
cross a rangenationwide.
ance industriod or Furnitungal, which pcourse lower
liance in Utttate effect ise of industrie. However, ies which arture. An inteperforms ber than the na
tarakhand anindeed stron
es which do the industry
re also doingeraction betwetter than natational avera
nd West ng. not
y effect is g badly at theween industrtional age on most
e ry

of codiffercaughliterapatterinspebe adenforindusresouRoncAfric
factoroutpuin Figprodushift
These patmpliance whring levels oht and the co
ature uses resrs of non-com
ectors, and otddressed in arcement outcstry may be aurces will havconi (2010) fca. This is an
Not only
r of more thaut-capital ratgures 6 and 7uctivity. Theof the densit
tterns of nonhich vary acrf enforceme
osts of appresources devompliance. Inther budgeta
attributing cacomes, sincea function ofve to be instfor Latin Amn interesting
are complianan 2.5. Theytio. The asso7. There is ae kernel denty for non-co
n-complianceross state an
ent. The theoehension are oted to enforn the Indian
ary items, byausality to ane the allocatiof the non-comtrumented ap
merica, and ing and importa
nt firms largy also have aociation betwa strong posi
nsity of laborompliant firm
16
e will be reland industry, bory suggestskey determi
rcement as ancase this wo
y state. Furthn associationon of enforcmpliance ratppropriately n Bhorat, Kaant item on t
ger, they hava correspondween labor pitive correlar productivitms.
ated to a rangbut they raiss that the proinants of nonn explanatorould need daher, there is n between encement resoute to begin win the econo
anbur and Mthe research
ve higher labdingly higheproductivity ation betweenty of complia
ge of costs ase the importobability of gn-compliancry variable inata on Factoran endogene
nforcement rurces to a stawith. Thus eometrics, as
Mayet (2012)agenda.
or productiver capital-laband complian compliancant firms is a
and benefits tant issue of getting ce. The n explainingries Act eity issue to resources anate or an enforcement is done in
) for South
vity, by a bor ratio and ance is showce and a rightward
f
g
d
wn

compa polireducsmallhave abilitfirmscomp
The assocpliance, is coicy perspectces size and ler firms ar ea sufficient
ty, “A” in thes similar on apliance and o
ciation betweonsistent withive, howeveproductvity,elikely to nonumber of ce theory of Sability some others into n
een productih the predict
er, the interes, allowing foot comply. Ccredible variaSection 2, an
of which caon-complian
17
ivity and comtions of the tsting questioor the selectiCorrecting foables that ca
nd a data set an be arguednce.
mpliance, antheory develon is whetherion effect thaor this selectan capture exthat allows
d to be select
nd also betweloped in Secr non-complat less prodution effect rexogenous ensufficient mted randomly
een size andction 2. Fromliance per se
uctive and equires us to
ntrepreneuriamatching of
y into
d m e
o al
18
Unfortunately, this does not seem to be a plausible exercise for the Factories Act. The two complementary data sets which allow us to quantify the magnitude of compliance versus non-compliance are collected for different purposes and under different protocols. This is useful in identifying non-compliance, because the issue of illegality is not broached in the NSSO survey. However, the two data sets do not have a sufficient number of varaibles in common which can be plausibly identified with exogenous entrepreneurial ability, and which when applied lead to a credible matching process12.
5. Conclusion
This paper has explored the magnitude and patterns in non-compliance with India’s Factories Act, a key piece of legislation which is the anchor for the distinction between the “organized” and the “unorganized” sectors. It begins by arguing that responses to regulation fall into four categories—compliers, evaders, avoiders and outsiders. Using two complementary data sources the paper provides recent estimates and trends for the number of enterprises each of these categories. The central conclusion is that non-compliance is significant. The number of non-compliant firms (Evaders) exceeds the number of compliant firms, and it exceeds an upper bound estimate of the number of firms who have adjusted out of the regulation (Avoiders). However, the category of firms that are not affected by the regulation at all, (Outsiders), far exceeds all other categories put together.
Our paper is also a contribution to the “missing middle” literature. The Factories
Act is one of the candidate explanations for the lack of medium size enterprises in the size distribution of manufacturing firms in India. Our analysis presents a specific estimate of the contribution of the Factories Act to this phenomenon. Furthermore, it distinguishes between and quantifies two aspects of the missing middle—enterprises who adjust out of the regulation and enterprises who evade the regulation. Clearly, the analysis needs to be quite different for these two types of the “missing middle.”
The extent of non-compliance raises the question of enforcement. We have
shown considerable variation in non-compliance across industries and across states. The impact of enforcement resources on compliance is thus an interesting research question. It is also an important question since such widespread non-compliance can undermine trust and belief in the legal and regulatory system. How can one make sense of non-enforcement of a regulation by a government which has itself passed that regulation? Of course enforcement costs are a possible explanation as are the preferences of the government, as suggested by the theory in Basu, Chau and Kanbur (2010). Responses to the Factories Act present an opportunity to test these theories of optimal enforcement, and this is an interesting area for further research.
12 We have been more successful with this exercise for the Employees Provident Fund Act, 1952, because compliance and non-compliance can be identified in the same data set. These results are described in Chatterjee and Kanbur (2013).
19
However, if the regulation itself is thought to be inappropriate, then perhaps no enforcement is the best answer. This takes us into the current debates on regulation and its impact on informality and productivity. The policy discourse on regulation has been tied up with views on the magnitude and nature of informality, and its consequences for growth and efficiency. Thus, for example, The Economist (September 9, 2010), in a survey of Latin America, argues as follows: “Thanks largely to baroque regulation, half the labor force toils in the informal economy, unable to reap the productivity gains that come from technology and greater scale.” This statement contains theory (regulation is the cause of informality), an estimate of the magnitude (half the labor force). However, it attributes the whole of informality to regulation, whereas the theory of Section 2 says that it is the evaders and the avoiders who are responding out of the regulation. The outsiders were not affected by it in the first place. As Chen and Doane (2008) argue in their review of South Asia:
“….labor market rigidities alone cannot explain the extent of informal employment...”.
For India’s Factories Act this paper shows that the outsiders account for 97.3% of
firms and at least 64.1% of employment. The evaders and the avoiders between them account at most for 1.9% of firms and 11.1% of employment. The focus on (de)regulation as a route to employment and productivity growth therefore has to be balanced with a focus on improving the productivity of those enterprises which would not be affected greatly, or at all, by the regulation in question. Of course the issue of the impact of regulation on productivity of those enterprises affected by it is still an important policy question. Unfortunately, it does not seem to be possible using the existing data to credibly quantify this effect for India’s Factories Act. The reason is that the data sources for those who register under the Factories Act and those who do not are different. The difference in data sources and protocols gives us confidence that we are getting accurate information from those who are not registered—for example, the issue of illegality is not broached for those who are not in compliance with the Factories Act. But the two data sources do not have a sufficient number of common variables to capture exogenous variation in productivity or entrepreneurial ability, and the problem of selection into non-compliance or into avoidance cannot be addressed credibly. The issue of selection could be handled for other regulations and matching data sources—Chatterjee and Kanbur (2013) show what can be done for India’s Employees Provident Funds Act, 1952. But such analysis depends on the fortuitous confluence of regulation and data sources, and even then may not be fully credible because the data itself has been collected under particular administrative protocols. What this suggests is the importance of developing a data set devoted to the task of addressing the impact of regulation on firm size and productivity. Given the significance of the current debates on regulation, such investment in information would clearly be worthwhile.

20
Appendix A: On the Electricity Usage Criterion The Factories Act requires registration for enterprises with a) 10 or more workers with power b) 20 or more workers. So, for establishments with power, the 10 workers or more criteria applies, while for establishments without power, 20 or more workers is the threshold. The electricity usage criterion was likely relevant seven decades ago when the Act was passed, but what is the situation today?
Let us start by considering the 2010-11 round of NSSO enterprise survey. After
excluding firms that report missing employment numbers, we find that there are an estimated 3,239 firms that report 0 electricity expenses in the NSSO 2010-11 survey. The maximum employment reported by these firms was 4 and the median was 1. With this information, the electricity usage criterion is irrelevant. The “10 workers or more” criterion for identifying compliance is sufficient. However, electricity usage information is missing for about 5.1 million firms. Out of which, nearly 99.4% have employment size of less than 10. The remaining 29,864 firms, account for 11.6% of the firms with 10 or more employees in the NSSO. Of course, if electricity usage was positive for these enterprises then there would be no difference when compared to using just the “10 workers or more” criterion for identifying informality and ignoring electricity usage—we would be back to Table 1 of the main text of the paper.
A difference would arise if some of the enterprises in the 10-19 worker range did
not use electricity. Table A1 presents the number of firms and workers in categories A, B, C and D when missing electricity is set equal to 0. Let us now compare this with Table 1. It is seen that even with the extreme assumption embodied in Table A1, for category B the discrepancy in the number of firms is 22,469 and the discrepancy in the number of workers is 290,996. That is, by ignoring electricity usage we may be over estimating the number of firms in category B (Evaders) and their total employment by at most by 8.7% and 6.4% respectively. Similarly for category C (Avoiders) we may be overestimating the number of firms and total employment by 8.4% and 7.2% respectively. The discrepancies are quite small. Further, the average characteristics of the different categories are not very different from each other.
Although not presented here, the discrepancies for 2005-6 are 12.5% (firms) and
9.5% (workers), and the average characteristics do not different very much either. For 2000-01 there are no missing values but the discrepancies between the two criteria lead to a discrepancy in the numbers for category I of 15.5% (firms) and 12.0% (workers).
We would argue, therefore, the electricity use criterion, important though it may
have been in 1948, is increasingly irrelevant. Ignoring it is unlikely to affect our analysis of compliance greatly.

21
A B C D
ASI Firms
NSSO Firms with 10 or
more employees using
power and 20 or more not
using power
NSSO Firms with 9
employees using power
and 19 employees not
using power NSSO Rest
Number of Firms 143,452 234,524 61,575 16,900,000
Share of Firms 0.8% 1.4% 0.4% 97.5%
Total Employment* 11,500,000 4,252,672 561,756 30,100,000
Share of Employment 24.8% 9.2% 1.2% 64.9%
Mean Employment 79.9 18.1 9 1.8
Median Employment 21 13 9 1
Median Labor Productivtiy (Rupees)** 135,626 63,915 76,400 23,400
*Includes unpaid family membes/helpers working in the firm
**Labor productivity is total gross value added divided by total employment
Firm Characteristics
Table A1: Compliers, Evaders, Avoiders and Outsiders under the Factories Act, 1948, in 2009‐10, where missing electricity expenditure is
assumed to be zero.
Firm Categories
22
Appendix B: Firms in ASI with less than 10 workers
Number of Firms 29,174
Share in Total ASI 20.3%
Total Employment** 172,858
Share in total ASI Employment 1.5%
Mean Employment 5.9
Median Employment 6
Median Labor Productivtiy (Rupees)**** 88,433
Median Capital‐Output Ratio*** 0.2
Median Capital‐Labor Ratio (Rupees)*** 138,457
Median Wage Rate (Rupees) 42,175
Median Gross Value Added Share in Total Output 21%
Ownership Type (%)
Sole Propreitory 52%
Partnership 34%
Limited Co 13%
Others (Co‐operatives, SHG etc) 1%
Location (%)
Rural 35%
Urban 65%
Maintain Books of Accounts (%) 100%
Median Age (years) 16
* Usage of power is ignored and only the criteria of 10 or more employees is considered for registration
under the Factories Act,1948. Excludes firms with missng or zero employment.
**Includes unpaid family membes/helpers working in the firm.
***Capital here is defined as the value (market value for NSSO and book value for ASI) of assets at the end of the year
****Labor productivity is total gross value added divided by total employment
Table B1: Firms with less than 10 employees in the ASI 2009‐10

23
References Allingham, Maurice, and Agnar Sandmo. 1972. “Income Tax Evasion: A Theoretical Analysis.” Journal of Public Economics, November, 1(3–4): pp. 323–38. Ashtenfelter, O and Smith, R. 1979. "Compliance with the minimum wage law," Journal of Political Economy, April 1979, 2, pp. 333-350. Basu, A. Chau, N. and Kanbur, R. 2010. "Turning a Blind Eye: Costly Enforcement, Credible Commitment, and Minimum Wage Laws," The Economic Journal. Vol. 120, Issue 543, pp. 244--269. Becker, Gary S. 1968. “Crime and Punishment: An Economic Approach.” Journal of Political Economy, March–April, 76(2), pp. 169–217. Bedi, Jatinder S. and Purnendu K. Banerjee. 2007. “Discrepancies and Validation of Indian Manufacturing Data.” Economic and Political Weekly, pp. 883-891. Bhorat, Haroon, Kanbur, Ravi and Mayet, Natasha. 2012. “Minimum Wage Violation in South Africa,” International Labour Review, Vol. 151, No. 3, pp. 277. Chatterjee, Urmila and Phillpe Wingender. 2012. “Tax Threshold and Bunching: Evidence from Indian Firms.” Processed. Chatterjee, Urmila and Kanbur, Ravi. 2013. “Non-compliance and Productivity: Evidence from India’s Employees Provident Fund Act.” Processed. De Paula, Aureo, and Jose J. Scheinkman. 2007. “The Informal Sector,” NBER Working Paper 13486. http://www.nber.org/papers/w13486.pdf Kanbur, Ravi, Lucas Ronconi and Leigh Wedenoja. 2013. "Labor Law Violations in Chile", http://kanbur.dyson.cornell.edu/papers/Kanbur-Ronconi-Wedenoja-Labor%20Law%20Violations%20in%20Chile%207Feb2013.pdf , forthcoming in International Labour Review. Kanbur, Ravi and Michael Keen. 2013. “Partitions of Tax Compliance,” in process. Lucas, R., 1978, “On the Size Distribution of Business Firms”, Bell Journal of Economics, 9, pp. 508-523. Mazumdar, Dipak and Sandeep Sarkar. 2008. “The Employment Problem in India and the Phenomenon of the Missing Middle,” http://webapp.mcis.utoronto.ca/ai/pdfdoc/DualismAndEconomicGrowthInIndia.pdf Nagraj, R. 2002. “How to Improve India’s Industrial Statistics.” Economic and Political Weekly, Vol .37, No. 10, pp. 966-970.
24
Ronconi, Lucas. 2010. “Enforcement and Compliance with Labor Regulations”, in Industrial and Labor Relations Review, Vol. 64, No. 4, pp. 719-736. Slemrod, Joel. 1972. “Cheating Ourselves: The Economics of Tax-Evasion.” Journal of Economic Perspectives, Volume 21, No 1, pp 25-48.