Regulated water and sewerage services - icrc.act.gov.au€¦ · Web view6 – Compliance with the...
141
Final report Standing offer prices for the supply of electricity to small customers from 1
Transcript of Regulated water and sewerage services - icrc.act.gov.au€¦ · Web view6 – Compliance with the...
Final report
Standing offer prices for the supply of electricity
to small customers from 1 July 2017
Report 6 of 2017, June 2017
The Independent Competition and Regulatory Commission is a Territory Authority established under the Independent Competition and Regulatory Commission
Act 1997 (the ICRC Act). The Commission is constituted under the ICRC Act by one or more standing commissioners and any associated commissioners
appointed for particular purposes. Commissioners are statutory appointments. Joe Dimasi is the current Senior Commissioner who constitutes the Commission and takes direct responsibility for delivery of the outcomes of the Commission.
The Commission has responsibilities for a broad range of regulatory and utility administrative matters. The Commission has responsibility under the ICRC Act
for regulating and advising government about pricing and other matters for monopoly, near-monopoly and ministerially declared regulated industries, and
providing advice on competitive neutrality complaints and government-regulated activities. The Commission also has responsibility for arbitrating
infrastructure access disputes under the ICRC Act. In discharging its objectives and functions, the Commission provides independent robust analysis and advice.
The Commission’s objectives are set out in section 7 and 19L of the ICRC Act and section 3 of the Utilities Act 2000.
Correspondence or other inquiries may be directed to the Commission at the following addresses:
Independent Competition and Regulatory CommissionPO Box 161
Civic Square ACT 2608
Level 8221 London CircuitCanberra ACT 2601
The Commission may be contacted at the above addresses, by telephone on (02) 6205 0799, or by fax on (02) 6207 5887. The Commission’s website is at
www.icrc.act.gov.au and its email address is [email protected].
Final report: Standing offer prices for the supply of electricity to small customers from 1 July 2017 i
ForewordThe Independent Competition and Regulatory Commission (the Commission) undertook an investigation into retail electricity prices for the three year period commencing 1 July 2017. The Commission released an issues paper on 24 October 2016 as the first step, followed by a draft report and proposed price direction on 28 March 2017. The publication of this final report and price direction completes the Commission’s investigation.
This report finalises the Commission’s regulatory approach and pricing methodology for determining regulated retail prices for the period 1 July 2017 to 30 June 2020 and the final decision on the price adjustment for 2017–18.
The Commission estimates that the maximum average percentage change in ActewAGL Retail’s basket of regulated tariffs in 2017–18 will be an increase of 18.95 per cent. The Commission notes this is a significant increase in the price of electricity, and that it will inflict a significant burden on the ACT community. The single biggest driver of this increase is the wholesale electricity purchase cost, driven by rapidly increasing forward prices.
The Commission’s model estimates three main cost categories: retail costs, network costs and wholesale electricity costs. The latter two components of total cost make up around 86.30 per cent of the total electricity bill. These are substantially set outside of either ActewAGL Retail’s commercial control or the Commission’s regulatory control.
Retail costs are charged by ActewAGL Retail. Of total retail costs, retail operating cost component and retail margin are under the Commission’s direct regulatory control. Total retail costs make up around 13.70 per cent of the total electricity bill. The Commission has taken a number of measures to ensure increases in retail costs are controlled and limited as is necessary for the efficient delivery of retail electricity services. The impact of these measures is that retail operating costs and the retail margin contribute less than one percentage point of the total price increase of 18.95 per cent.
The Commission notes that ActewAGL Retail is proposing a number of measures to assist vulnerable and disadvantaged consumers. But price increases of this magnitude are inevitably challenging for consumers. Ultimately, the challenge for those responsible for the governance of the National Electricity Market is to address the source of the uncertainty that is leading to these outcomes.
Joe Dimasi
Senior Commissioner
7 June 2017
Final report: Standing offer prices for the supply of electricity to small customers from 1 July 2017 iii
ContentsForeword
Executive summary
1 Introduction1.1 Background to the investigation 11.2 ICRC Act: legislative requirements 11.3 Scope of the terms of reference 51.4 Structure of the report 5
2 Commission’s regulatory approach and pricing model2.1 Introduction 72.2 Regulatory approach 72.3 Summary of final decision on the regulatory approach 122.4 Pricing model and price adjustment 132.5 Calculation of the change in the consumer price index 362.6 Summary of final decisions on the pricing model 36
3 Analysis of efficient costs for 2017183.1 Introduction 393.2 Wholesale electricity cost 393.3 Large-scale Renewable Energy Target and Small-scale Renewable Energy
Scheme costs 453.4 Energy losses 483.5 Energy contracting costs 483.6 National Electricity Market fees 483.7 Retail operating costs 483.8 Energy Efficiency Improvement Scheme costs 493.9 Network cost allowance 503.10 Retail margin 523.11 Final decision on cost elements 533.12 Impact on customers 56
4 Annual recalibration and pass-through arrangements4.1 Annual recalibration method 594.2 Pass-through arrangement details 60
iv Final report: Standing offer prices for the supply of electricity to small customers from 1 July 2017
5 Model and methodology review5.1 Cost benchmarking 635.2 Energy purchase cost model 645.3 FiT, LRET and SRES Costs: 645.4 Energy contracting costs and NEM fees 655.5 Retail operating costs 655.6 Retail margin 65
6 Compliance with the terms of reference and the ICRC Act6.1 Compliance with the terms of reference 676.2 Compliance with the ICRC Act 68
Appendix 1 Terms of reference
Appendix 2 SubmissionsA2.1 Submissions on the issues paper 73A2.2 Submissions on the draft report 76
Appendix 3 The Commission’s hedging cost model
Appendix 4 Derivation of the hedging cost
Appendix 5 The LRES, ancillary and hedging costsA5.1 Description of the ACT’s LRES 87A5.2 Implications of the LRES 88A5.3 Transmission constraints and wholesale pool price divergence 89A5.4 Secondary effects of the FiT Scheme 90
Appendix 6 Comparison of residential electricity prices across Australian jurisdictionsA6.1 Recent reports comparing retail electricity prices 93A6.2 Comparison of recent residential electricity prices across jurisdictions
96
Abbreviations and acronyms
References
Final report: Standing offer prices for the supply of electricity to small customers from 1 July 2017 v
List of tables
Table ES.1 Final decision on 2017–18 cost components
Table 2.1 Commission’s final decision on the form of regulation
Table 2.3 Final decisions on the components of theelectricity cost-index model
Table 3.1 Quarterly forward wholesale electricity prices, 2016–17 and 2017–18 (dollars per MWh)
Table 3.2 Quarterly average load shape, 2016–17 and 2017–18
Table 3.3 Quarterly load shape, 2003–04 through 2016–17
Table 3.4 Quarterly load ratio, 2003–04 to 2017–18
Table 3.5 Quarterly load weights, 2003–04 to 2017–18
Table 3.6 Annual uplift factor, 2009–10 through 2017–18
Table 3.7 Energy purchase cost, 2016–17
Table 3.8 Energy purchase cost, 2017–18
Table 3.9 LRET and SRES data, 2017 and 2018
Table 3.10 LRET and SRES allowance, 2016–17 and 2017–18 (dollars per MWh)
Table 3.11 ActewAGL Retail EEIS abatement costs and targets 2017–18
Table 3.12 Forecast EEIS costs, 2017–18, $ per MWh
Table 3.13 ActewAGL Distribution network revenue components, 2015–16 and 2017–18
Table 3.14 Jurisdictional scheme cost components, 2015–16 and 2017–18
Table 3.15 ActewAGL Distribution estimated FiT costs, 2017–18
Table 3.16 Final decision on cost elements, 2017–18
Table 3.17 Estimated annual bill changes for residential customers, 2016–17 and 2017–18
6 Final report: Standing offer prices for the supply of electricity to small customers from 1 July 2017
Table 3.18 Estimated annual bill changes for non-residential customers, 2016–17 and 2017–18
Table 4.1 Proposed annual recalibration of cost components
Table 6.1 Compliance with the terms of reference
Table 6.2 Compliance with section 7 of the ICRC Act
Table 6.3 Compliance with section 19(L) of the ICRC Act
Table 6.4 Compliance with section 20(2) of the ICRC Act
Table A6.1 Retail electricity offers, September 2016 96
Table A6.2 Comparison of retail electricity (single rate) price, as at 22 February 2017 97
List of figures
Figure ES.1 Cost components in dollars per MWh as a share of total cost 2017–18
Figure ES.2 Components of the change in regulated retail electricity prices 201617 to 201718
Figure ES.3 ASX futures market data for wholesale electricity 1 July 2015 to 31 May 2017
Figure ES.4 LGC spot prices, July 2013 to May 2017
Figure 2.1 The Commission’s pricing model
Figure 3.1 ASX futures market data for wholesale electricity 1 July 2015 to 31 May 2017
Figure 3.2 LGC spot prices, July 2013 to May 2017
Figure 3.3 STC spot prices, July 2013 to May 2017
Figure 3.4 Components of the change in regulated retail electricity prices 2016–17 to 2017–18, by cost component
Figure 3.5 Changes in the components of regulated retail electricity prices 2016–17 to 2017–18
Final report: Standing offer prices for the supply of electricity to small customers from 1 July 2017 7
Figure 3.6 Components of the change in regulated retail electricity prices 2016–17 to 2017–18
Figure 3.5 Cost components in dollars per MWh as a share of total cost 2017–18
Figure A6.1 Estimated annual small customer electricity bills based on standing offers, 2016
Figure A6.2 Residential standing offer electricity bills based on annual consumption of 8,250 kWh
Figure A6.3 Breakdown of household electricity bills in select distribution zones, average of big three market offers on 2 August 2016
List of boxes
Box 1.1 Section 7: ICRC Objectives
Box 1.2 Section 20(2): ICRC Functions
Box 1.3 Overarching objective
Box 1.4 Scope of the terms of reference
Box A3.1 Current energy purchase cost model summary
8 Final report: Standing offer prices for the supply of electricity to small customers from 1 July 2017
Executive summaryIntroduction
On 22 June 2016, the Treasurer signed terms of reference for a price direction for the supply of electricity by ActewAGL Retail (AAR) to customers on its regulated retail tariffs for the period 1 July 2017 to 30 June 2020. The Independent Competition and Regulatory Commission (‘The Commission’, or ICRC) released an issues paper on 24 October 2016 as the first step in the consultation process to determine retail electricity prices from 1 July 2017. The release of the draft report on 28 March 2017 was the second step. The publication of the final report and price direction is the final step in the Commission’s consultation process for this investigation.
This report sets out the Commission’s final decision on the proposed regulatory approach and methodology, components of the pricing model to calculate the final decision on the price adjustment for 2017–18 and the price direction.
Pricing methodology and cost components
The Commission’s proposed pricing model determines the maximum average percentage change that AAR can apply to its suite of tariffs on an annual basis. It does so by estimating three main cost categories:
The first category is the estimated costs that would be incurred by an efficient incumbent retailer in the same position as AAR. These include; retail costs, which comprise retail operating costs, Energy Efficiency Improvement Scheme (EEIS) compliance costs and retail margin. These costs make up 13.70 per cent of the total costs for 2017–18, which the retailer needs to recover.
The second category is network costs, which include transmission, distribution and the Australian Capital Territory (ACT) Government’s renewable energy scheme costs. These costs are regulated by the Australian Energy Regulator (AER) and are passed through to the retailer and in turn to consumers. They make up 41.49 per cent of the total costs for 2017–18.
The third category of costs is wholesale electricity costs, which comprise energy purchase costs, Large-scale Renewable Energy Target (LRET) and Small-scale Renewable Energy Scheme (SRES) costs, energy losses, energy contracting costs and National Electricity Market (NEM) fees. These costs comprise 44.81 per cent of ActewAGL Retail’s total costs for 2017–18.
Wholesale energy purchase costs in the wholesale cost category represent the costs incurred by the incumbent retailer in purchasing electricity from the wholesale electricity market. The Commission’s energy purchase cost model consists of a forward price to represent the cost of purchasing electricity and an uplift factor that is applied to the forward price to reflect the retailer’s hedging cost. The LRET and SRES costs represent the costs of complying with national environmental obligations imposed by the Australian Government. Energy losses component accounts for the costs associated with energy lost in transmission and distribution. Energy contracting costs represent the cost of managing an electricity trading desk. The NEM is managed
Final report: Standing offer prices for the supply of electricity to small customers from 1 July 2017 ix
Error: Reference source not found – Error: Reference source not foundError: Reference source not found – Error: Reference source not found
by the Australian Energy Market Operator (AEMO), which is funded though NEM fees.
The network costs are the sum of transmission and distribution charges paid by the retailer to transport electricity from generators to customer, and the costs associated with the ACT’s renewable energy schemes. Retail operating costs are the efficient costs incurred by the retailer in providing retail services to customers. The EEIS costs represent the costs of complying with the ACT Government’s energy efficiency scheme.
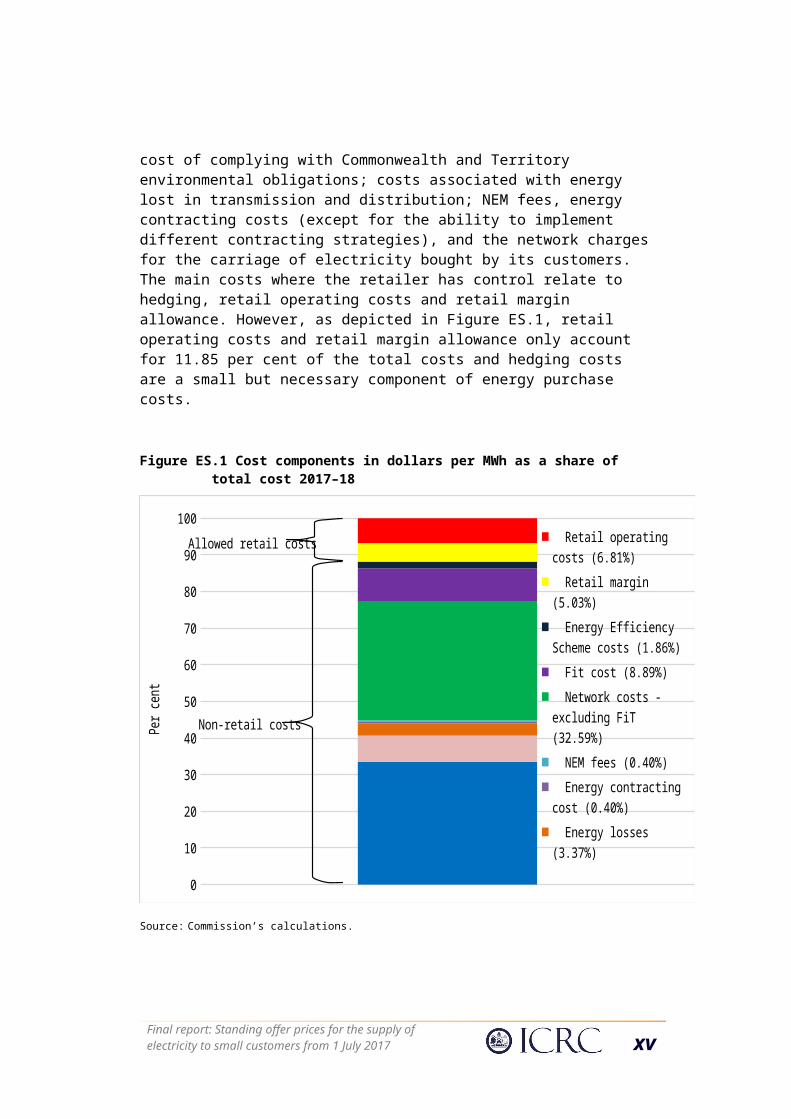
Figure ES.1 shows the proportion of each cost component in total costs for 2017–18. An analysis of these cost components shows that almost 88 per cent of the total costs are determined outside the control of the retailer, of which 86.30 per cent of costs comprise the wholesale energy purchase cost and network costs.
The costs that the retailer cannot control and that are not regulated by the Commission include the cost of purchasing electricity from the NEM (except for the ability to implement different hedging strategies); the cost of complying with Commonwealth and Territory environmental obligations; costs associated with energy lost in transmission and distribution; NEM fees, energy contracting costs (except for the ability to implement different contracting strategies), and the network charges for the carriage of electricity bought by its customers. The main costs where the retailer has control relate to hedging, retail operating costs and retail margin allowance. However, as depicted in Figure ES.1, retail operating costs and retail margin allowance only account for 11.85 per cent of the total costs and hedging costs are a small but necessary component of energy purchase costs.
x Final report: Standing offer prices for the supply of electricity to small customers from 1 July 2017
Figure ES.1 Cost components in dollars per MWh as a share of total cost 2017–18
0
10
20
30
40
50
60
70
80
90
100
Retail operating costs (6.81%)
Retail margin (5.03%)
Energy Efficiency Scheme costs (1.86%)
Fit cost (8.89%)
Network costs - excluding FiT (32.59%)
NEM fees (0.40%)
Energy contracting cost (0.40%)
Energy losses (3.37%)
LRET and SRES costs (7.13%)
Wholesale energy purchase cost (33.51%)
Per c
ent
Allowed retail costs
Non-retail costs
Source: Commission’s calculations.Note: For ease of comparison with other components of the model, the Commission has calculated implied Feed-in tariff (FiT) costs based on the assumption that FiT costs as a percentage of total jurisdictional costs do not vary with customer type, regulated and non-regulated, using data as reported in ActewAGL Distribution (2017).
Final decision on 2017–18 cost components
The Commission’s final decision estimates that the average nominal increase in AAR’s basket of regulated tariffs for 2017–18 will be 18.95 per cent. This is equivalent to a real increase in the regulated retail price of about a 17.21 per cent.
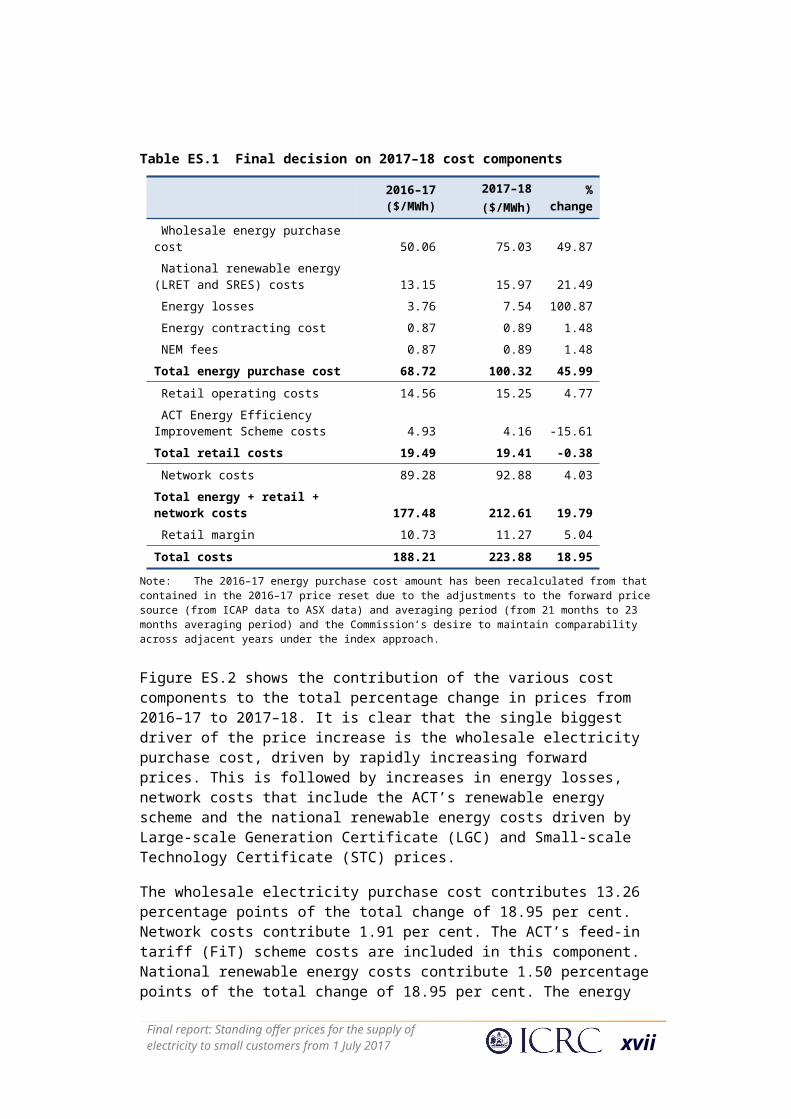
Table ES.1 sets out the percentage in the cost components used to determine the maximum allowed change in the regulated retail electricity price for 2017–18. The break down in costs described in Figure ES.1 is not fully replicated in Table ES.1, for example FiT scheme costs, due to the lack of comparable data for 2016–17.
Final report: Standing offer prices for the supply of electricity to small customers from 1 July 2017 xi
Error: Reference source not found – Error: Reference source not foundError: Reference source not found – Error: Reference source not found
Table ES.1 Final decision on 2017–18 cost components
2016–17 ($/MWh)
2017–18 ($/MWh) % change
Wholesale energy purchase cost 50.06 75.03 49.87 National renewable energy (LRET and SRES) costs 13.15 15.97 21.49 Energy losses 3.76 7.54 100.87
Energy contracting cost 0.87 0.89 1.48 NEM fees 0.87 0.89 1.48
Total energy purchase cost 68.72 100.32 45.99 Retail operating costs 14.56 15.25 4.77
ACT Energy Efficiency Improvement Scheme costs 4.93 4.16 -15.61
Total retail costs 19.49 19.41 -0.38 Network costs 89.28 92.88 4.03
Total energy + retail + network costs 177.48 212.61 19.79 Retail margin 10.73 11.27 5.04
Total costs 188.21 223.88 18.95
Note: The 2016–17 energy purchase cost amount has been recalculated from that contained in the 2016–17 price reset due to the adjustments to the forward price source (from ICAP data to ASX data) and averaging period (from 21 months to 23 months averaging period) and the Commission’s desire to maintain comparability across adjacent years under the index approach.
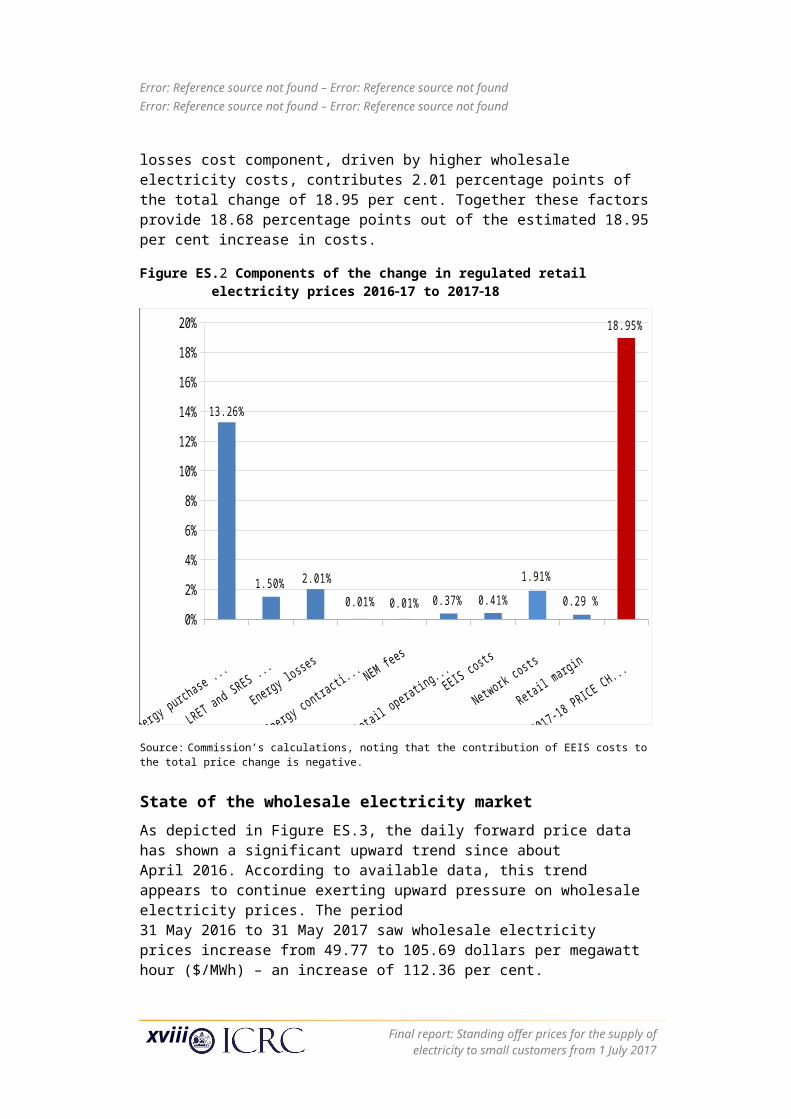
Figure ES.2 shows the contribution of the various cost components to the total percentage change in prices from 2016–17 to 2017–18. It is clear that the single biggest driver of the price increase is the wholesale electricity purchase cost, driven by rapidly increasing forward prices. This is followed by increases in energy losses, network costs that include the ACT’s renewable energy scheme and the national renewable energy costs driven by Large-scale Generation Certificate (LGC) and Small-scale Technology Certificate (STC) prices.
The wholesale electricity purchase cost contributes 13.26 percentage points of the total change of 18.95 per cent. Network costs contribute 1.91 per cent. The ACT’s feed-in tariff (FiT) scheme costs are included in this component. National renewable energy costs contribute 1.50 percentage points of the total change of 18.95 per cent. The energy losses cost component, driven by higher wholesale electricity costs, contributes 2.01 percentage points of the total change of 18.95 per cent. Together these factors provide 18.68 percentage points out of the estimated 18.95 per cent increase in costs.
xii Final report: Standing offer prices for the supply of electricity to small customers from 1 July 2017
Figure ES.2 Components of the change in regulated retail electricity prices 201617 to 201718
Energy purchase cost
LRET and SRES costs
Energy losses
Energy contracting cost NEM fees
Retail operating costs EEIS costs
Network costs
Retail margin
2017-18 PRICE CHANGE
0%
2%
4%
6%
8%
10%
12%
14%
16%
18%
20%
13.26%
1.50% 2.01%
0.01% 0.01% 0.37% 0.41%
1.91%
0.29 %
18.95%
Source: Commission’s calculations, noting that the contribution of EEIS costs to the total price change is negative.
State of the wholesale electricity market
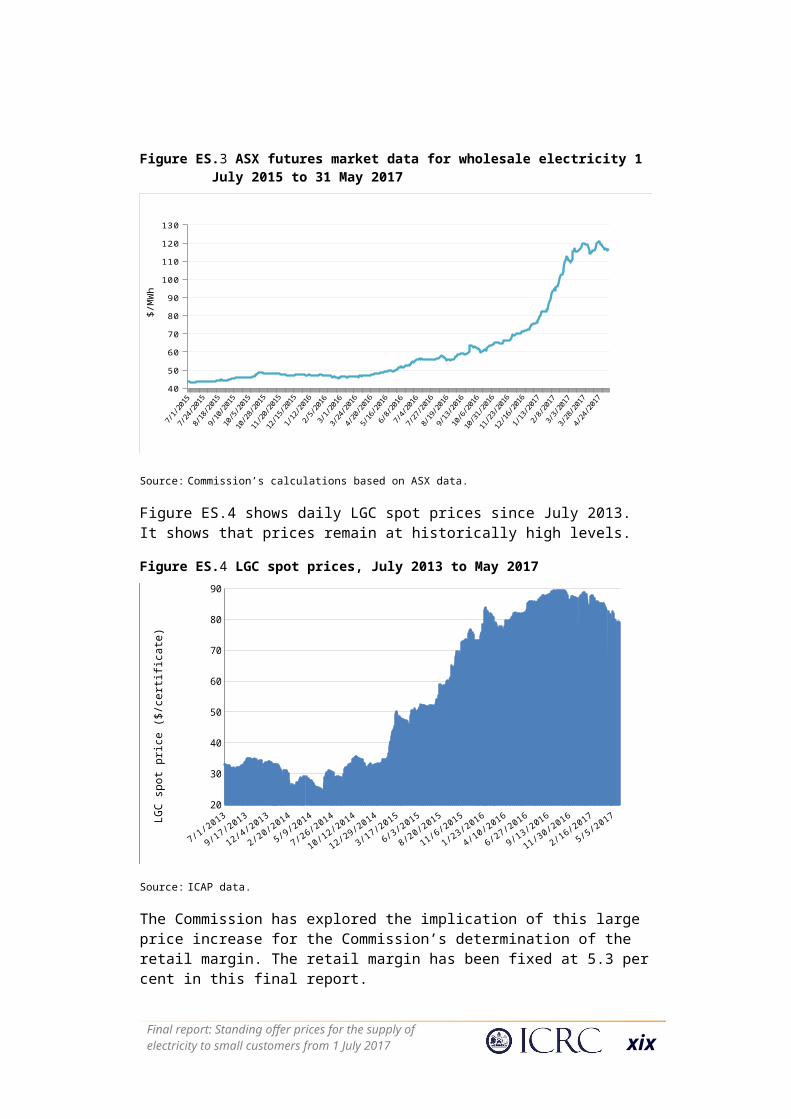
As depicted in Figure ES.3, the daily forward price data has shown a significant upward trend since about April 2016. According to available data, this trend appears to continue exerting upward pressure on wholesale electricity prices. The period 31 May 2016 to 31 May 2017 saw wholesale electricity prices increase from 49.77 to 105.69 dollars per megawatt hour ($/MWh) – an increase of 112.36 per cent.
Final report: Standing offer prices for the supply of electricity to small customers from 1 July 2017 xiii
Error: Reference source not found – Error: Reference source not foundError: Reference source not found – Error: Reference source not found
Figure ES.3 ASX futures market data for wholesale electricity 1 July 2015 to 31 May 201701
-Jul-1
518
-Jul-1
504
-Aug
-15
21-A
ug-15
07-Se
p-15
24-Se
p-15
11-O
ct-1
528
-Oct-
1514
-Nov-1
501
-Dec
-15
18-D
ec-1
504
-Jan-1
621
-Jan-1
607
-Feb-
1624
-Feb-
1612
-Mar-
1629
-Mar-
1615
-Apr
-16
02-M
ay-1
619
-May
-16
05-Ju
n-16
22-Ju
n-16
09-Ju
l-16
26-Ju
l-16
12-A
ug-1
629
-Aug-1
615
-Sep-
1602
-Oct-
1619
-Oct-
1605
-Nov-1
622
-Nov-1
609
-Dec
-16
26-D
ec-1
612
-Jan-1
729
-Jan-1
715
-Feb-
1704
-Mar-
1721
-Mar-
1707
-Apr
-17
24-A
pr-17
40
50
60
70
80
90
100
110
120
130
$/M
Wh
Source: Commission’s calculations based on ASX data.
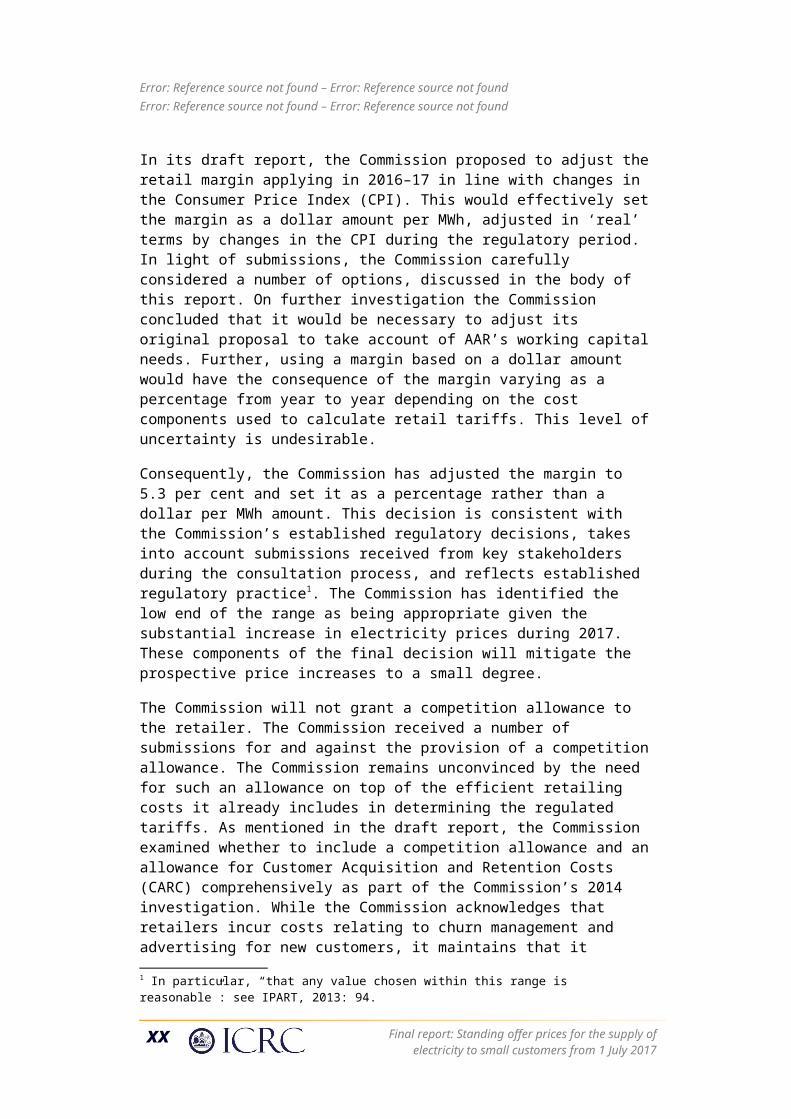
Figure ES.4 shows daily LGC spot prices since July 2013. It shows that prices remain at historically high levels.
Figure ES.4 LGC spot prices, July 2013 to May 2017
01-Jul-1
3
01-Sep-13
01-Nov-13
01-Jan-14
01-Mar-1
4
01-May-14
01-Jul-1
4
01-Sep-14
01-Nov-14
01-Jan-15
01-Mar-1
5
01-May-15
01-Jul-1
5
01-Sep-15
01-Nov-15
01-Jan-16
01-Mar-1
6
01-May-16
01-Jul-1
6
01-Sep-16
01-Nov-16
01-Jan-17
01-Mar-1
7
01-May-17
20
30
40
50
60
70
80
90
LGC
spot
pric
e ($
/cer
tifica
te)
Source: ICAP data.
The Commission has explored the implication of this large price increase for the Commission’s determination of the retail margin. The retail margin has been fixed at 5.3 per cent in this final report.
In its draft report, the Commission proposed to adjust the retail margin applying in 2016–17 in line with changes in the Consumer Price Index (CPI). This would effectively set the margin as a dollar amount per MWh, adjusted in ‘real’ terms by
xiv Final report: Standing offer prices for the supply of electricity to small customers from 1 July 2017
changes in the CPI during the regulatory period. In light of submissions, the Commission carefully considered a number of options, discussed in the body of this report. On further investigation the Commission concluded that it would be necessary to adjust its original proposal to take account of AAR’s working capital needs. Further, using a margin based on a dollar amount would have the consequence of the margin varying as a percentage from year to year depending on the cost components used to calculate retail tariffs. This level of uncertainty is undesirable.
Consequently, the Commission has adjusted the margin to 5.3 per cent and set it as a percentage rather than a dollar per MWh amount. This decision is consistent with the Commission’s established regulatory decisions, takes into account submissions received from key stakeholders during the consultation process, and reflects established regulatory practice1. The Commission has identified the low end of the range as being appropriate given the substantial increase in electricity prices during 2017. These components of the final decision will mitigate the prospective price increases to a small degree.
The Commission will not grant a competition allowance to the retailer. The Commission received a number of submissions for and against the provision of a competition allowance. The Commission remains unconvinced by the need for such an allowance on top of the efficient retailing costs it already includes in determining the regulated tariffs. As mentioned in the draft report, the Commission examined whether to include a competition allowance and an allowance for Customer Acquisition and Retention Costs (CARC) comprehensively as part of the Commission’s 2014 investigation. While the Commission acknowledges that retailers incur costs relating to churn management and advertising for new customers, it maintains that it remains appropriate not to include a separate allowance in the calculations of its cost-index model for the next regulatory period.
It should also be noted that there is only a small component of the increase due to network costs as these have been updated according to the enforceable undertaking agreed between the AER and ActewAGL Distribution. To the extent that network costs have increased this is in part the result of the growth of payments under the ACT Government’s feed-in tariffs. In respect of use of network costs, there will be implications flowing from the Federal Court decision on the AER’s appeal against the Competition Tribunal’s decision to set aside 2015 distribution determinations for the New South Wales (NSW) and ACT distribution and network service providers. Analysis of the Federal Court’s decision is beyond the scope of this report as the full impacts of the decision are unknown as of June 2017. This decision is likely to result in higher network charges and this in turn will flow into regulated retail prices during the next regulatory period from 1 July 2017.
Impact on customers
The annual impact on typical bills due to the estimated price increases ranges from $194 for a small residential customer to $471 for a large residential customer. For the 1 In particular, “that any value chosen within this range is reasonable”: see IPART, 2013: 94.
Final report: Standing offer prices for the supply of electricity to small customers from 1 July 2017 xv
Error: Reference source not found – Error: Reference source not foundError: Reference source not found – Error: Reference source not found
average residential household consuming about 8,000 kWh per year, this would translate to an increase of $333 in their annual bill. In the case of non-residential customers, the impact ranges from $522 for a small non-residential customer to $1,844 for a large non-residential customer. Impact on an average non-residential customer would be an increase of $1,183 in their annual bill.
While it is of little comfort given the significant increase in retail electricity prices, recent reports comparing retail electricity prices across Australian jurisdictions suggest that ACT customers pay considerably less for their electricity than consumers in other jurisdictions. The AER’s State of the Energy Market Report 2017 found that estimated annual electricity bills for customers on standing offers in the ACT were the lowest in Australia in 20162. Supporting the same view, a report prepared by Get Up! Group found that the total annual bill in the ACT is the lowest of all NEM Jurisdictions. A recent report by Grattan Institute also noted the significant increase in electricity prices in Sydney, Melbourne, Brisbane and Adelaide over the past decade.
2 AER, 2017:131.
xvi Final report: Standing offer prices for the supply of electricity to small customers from 1 July 2017
1 Introduction
1.1 Background to the investigation
The Independent Competition and Regulatory Commission (‘The Commission’, or ICRC) is a statutory body set up to regulate prices, access to infrastructure services and other matters in relation to regulated industries. The Commission is responsible for setting regulated retail prices for the supply of electricity to small customers on ActewAGL Retail’s (AAR) regulated tariffs.
The Commission undertakes price investigations in accordance with sections 15, 16 and 17 under Part 3 of the Independent Competition and Regulatory Commission Act 1997 (the ICRC Act), and issues price directions under Part 4 of the ICRC Act. The current price direction requires the Commission to determine the maximum prices that AAR can charge for its regulated retail tariffs from 1 July 2014 to 30 June 2017.
On 22 June 2016, the Treasurer signed terms of reference under the ICRC Act for a price direction for the supply of electricity by AAR to customers on its regulated retail tariffs for the period 1 July 2017 to 30 June 2020.3
The Commission released an issues paper on 24 October 2016 as the first step in the consultation process to determine retail electricity prices from 1 July 2017. The release of the draft report on 28 March 2017 was the second step. The Commission received six submissions on the draft report, which are available on the Commission’s website.4 A summary of the submissions is provided in Appendix 2. The Commission has considered key issues raised in the submissions in the relevant chapters of the final report.
The publication of the final report and price direction is the final step in the Commission’s consultation process for this investigation.
1.2 ICRC Act: legislative requirements
1.2.1 Introduction
In carrying out its functions under the ICRC Act, the Commission has the following objectives set out in section 7 (Box 1.1).
3 See Appendix 1 for a full copy of the terms of reference.
4 www.icrc.act.gov.au. Final report: Standing offer prices for the supply of electricity to small customers from 1 July 2017 1
Executive summary
Box 1.1 Section 7: ICRC Objectives
(a) to promote effective competition in the interests of consumers;
(b) to facilitate an appropriate balance between efficiency and environmental and social considerations;
(c) to ensure non-discriminatory access to monopoly and near-monopoly infrastructure.5
When making a price direction, in addition to the terms of reference, the Commission is also required to have regard to the provisions set out in section 20(2) (Box 1.2).
Box 1.2 Section 20(2): ICRC Functions
(a) the protection of consumers from abuses of monopoly power in terms of prices, pricing policies (including policies relating to the level or structure of prices for services) and standard of regulated services; and
(b) standards of quality, reliability and safety of the regulated services; and
(c) the need for greater efficiency in the provision of regulated services to reduce costs to consumers and taxpayers; and
(d) an appropriate rate of return on any investment in the regulated industry; and
(e) the cost of providing the regulated services; and
(f) the principles of ecologically sustainable development mentioned in subsection (5);
(g) the social impacts of the decision; and
(h) considerations of demand management and least cost planning; and
(i) the borrowing, capital and cash flow requirements of people providing regulated services and the need to renew or increase relevant assets in the regulated industry; and
(j) the effect on general price inflation over the medium term; and
(k) any arrangements that a person providing regulated services has entered into for the exercise of its functions by some other person.6
5 ACT Government, 1997: 8.6 ACT Government, 1997: 26-27.
2 Final report: Standing offer prices for the supply of electricity to small customers from 1 July 2017
1.2.2 Recent amendments
A number of recent amendments to the ICRC Act, effective from 1 July 2016, are relevant to this investigation.
1. The ICRC Act now includes an overarching efficiency objective specific to the making of a price direction as set out in section 19L Part 4 (Box 1.3):
Box 1.3 Overarching objective
to promote the efficient investment in, and efficient operation and use of regulated services for the long term interests of consumers in relation to the price, quality, safety, reliability and security of the service.
2. Section 17(4)(a) requires the Commission, within 1 month after receiving the industry reference, to give each relevant person for the investigation written notice of the information it requires from the person in relation to the investigation, and the date, decided after consultation with the person, when the person must give the Commission the information.
In accordance with this new requirement, on 21 July 2016, the Commission sent AAR an information request requiring the provision of the following:
(a) estimated Energy Efficiency Improvement Scheme (EEIS) costs for 201718 by 23 January 2017, and updated EEIS costs by 8 May 2017;
(b) the network cost allowance for the regulated load for 201718, following the approval of ActewAGL Distribution’s network charges by the Australian Energy Regulator; and
(c) regulated tariff customer numbers and electricity usage for the year to 31 March 2017 by 8 May 2017.
3. Section 18(5)(b) has also been amended to require the Commission, in the draft (as well as in the final) report, to produce a statement outlining the extent to which it has had regard to the key matters listed in section 20(2).
Final report: Standing offer prices for the supply of electricity to small customers from 1 July 2017 3
Executive summary
1.3 Scope of the terms of reference
The terms of reference require the Commission to consider the following matters in this investigation (Box 1.4).
Box 1.4 Scope of the terms of reference
1. The Commission must consider:
(a) The direct impact on electricity costs of government policies and pass through of costs and savings to regulated prices including, but not restricted to:
the ACT retailer obligations under EEIS;
the Commonwealth Government’s LRET and SRES; and
any other schemes implemented to address climate change relevant to electricity pricing.
(b) The efficient and prudent cost of managing risk in the cost of purchasing electricity for the period of the price direction.
2. The Commission must identify and report on the efficient costs of complying with the Energy Efficiency (Cost of Living) improvement Act 2012 for the period that the determination is being made.
3. The Commission must identify and report on the cost allowance of the ACT Feed-in Tariffs (small and large scale) for the period that the determination is being made.
4. The Commission must release its final report within the period of 1 January 2017 to 7 June 2017, to provide sufficient time to allow ActewAGL Retail to make any necessary changes to its billing system and to provide information on the new tariff to customers for implementation from 1 July 2017.
1.4 Structure of the report
The remainder of this report is structured as follows:
Chapter 2
Chapter 3 provides an estimate of the efficient costs of supplying electricity to customers on the regulated tariff in 201718.
Chapter 4 describes the procedure for setting the regulated retail price in 201819 and 201920 through the annual recalibration process, and sets out the details of the proposed pass-through arrangements.
4 Final report: Standing offer prices for the supply of electricity to small customers from 1 July 2017
Chapter 5 summarises the key components of the Commission’s pricing methodology and cost index model that the Commission intends to review during the 2017–20 regulatory period.
Chapter 6 summarises the Commission’s compliance with the terms of reference and the ICRC Act.
Appendix 1 reproduces the terms of reference.
Appendix 2 contains a summary of submissions to the issues paper and draft report.
Appendix 3 explains the Commission’s energy purchase cost model.
Appendix 4 presents a detailed derivation of the Commission’s hedging cost model.
Appendix 5 provides a discussion of some of the implications flowing from the ACT’s large renewable energy scheme as well as a comment on electricity price hedging and ancillary service costs.
Appendix 6 provides a summary comparison of residential electricity prices for a number of Australian jurisdictions.
Final report: Standing offer prices for the supply of electricity to small customers from 1 July 2017 5
2 Commission’s regulatory approach and pricing model
price control mechanism
The price control mechanism sets out how and when a price change can be applied to AAR’s regulated retail electricity tariffs. The cost-index model is used to determine the maximum allowable price change across the basket of regulated tariffs from one year to the next. The pass-through arrangements provide for the treatment of unexpected events, beyond the control of AAR, that occur after the price direction has been made.
This chapter also considers relevant issues raised in the six submissions the Commission has received on the issues paper, and the six submissions received on the draft report. The submissions received on the issues paper were from AAR, AGL Energy Limited (AGL), Origin Energy Limited (Origin), the Australian Energy Council, the Australian Capital Territory (ACT) Minister for Climate Change and Sustainability (the Minister) and the ACT Civil and Administrative Tribunal (ACAT). Submissions received on the draft report were from the ACT Energy Consumers Policy Consortium (ECPC), AAR, AGL, Origin, the Wildlife Carers Group and from one individual customer.
2.2 Regulatory approach
The key elements of the Commission’s regulatory approach are described below.
2.2.1 Length of the regulatory period
As specified in the terms of reference, the price direction will be for the three-year period of 1 July 2017 to 30 June 2020.
Submissions
AAR, in its submission to the draft report, expressed its support for the current weighted average price cap methodology.
Origin, in its submission to the issues paper, supports the length of the regulatory period of three years, and the weighted average price cap methodology ahead of setting actual tariffs or capping revenues.
The ACAT, in its submission to the issues paper, expressed its support for the current weighted average price cap methodology.8
8 ACAT, 2017:2.Final report: Standing offer prices for the supply of electricity to small customers from 1 July 2017 7
2 – Commission’s regulatory approach and pricing mode
Commission’s consideration and final decision
While it is not the only form of price regulation, the weighted average price cap approach has been used by state and territory regulators in the past, including the Commission. Its chief benefit is that it allows the regulator to focus on determining the percentage change (if any) in a basket of retail tariffs rather than approving individual tariffs. Approving individual tariffs is far more informational intensive for both the regulator and the regulated business. The average weight price cap also gives the regulated retailer some flexibility as to the tariffs it offers, thus providing the opportunity for it to react to market conditions and consumer preferences.
In its issues paper and the draft report the Commission indicated its preference to maintain its current approach. In response, no information has been presented to the Commission that suggests an alternative form of regulation is more appropriate. Consequently, given the methodology the Commission uses a weighted average price cap approach remains an appropriate form of price control in the ACT for customers on regulated retail tariffs.
The Commission’s final decision is to continue to use a weighted average price cap approach to control regulated prices for the regulatory period commencing 1 July 2017.
As specified in the terms of reference, t
Submissions
AAR broadly supported the Commission’s proposed annual recalibration approach.
The ACAT, in its submission to the issues paper, supports annual recalibrations updating the parameters of the retail costs index, but not affecting the determined methodology.9
Commission’s consideration and final decision
The Commission’s final decision is that regulated prices should be adjusted consistent with the Commission’s current practice of annually adjusting the benchmark cost of supplying electricity to customers for changes in wholesale electricity, network (including the ACT’s renewable energy scheme) and retail costs. The Commission will calculate the individual cost components of its cost-index model for the price recalibrations for each year that will determine the maximum average allowed percentage change.
9 ACAT, 2017:2.
8 Final report: Standing offer prices for the supply of electricity to small customers from 1 July 2017
2.2.4 Cost pass-through arrangements
Pass-through arrangements refer to the pass through of approved costs associated with specified regulatory and tax changes and other costs beyond the control of the regulated entity. The Commission currently allows for pass-through arrangements for a range of regulatory change and tax change events.10 Pass-through reviews for these regulatory and tax change events are undertaken as part of the annual recalibration process and require a number of considerations to ensure the costs for pass through are relevant and efficient.
Submissions
The only issue that arose was whether recent changes to the national electricity market rules to facilitate competition in the provision of metering services should be included in the scope of the pass-through arrangements. The Commission’s draft decision was not to amend the current pass-through provisions to include costs associated with the Power of Choice reforms. The Commission noted that review of the rule change documentation suggests that the deployment of new smart meters and the billing of the costs for their installation is a matter to be agreed between retailers and their customers and that customers are given the scope to opt out from the installation of a new meter but with some exceptions. The exceptions are that small customers are not able to opt out of receiving an advanced meter in maintenance replacement, fault and new connection scenarios or where the customer has a replacement meter and advises their retailer that a customer at the premises requires life support equipment.
In its submission to the draft report, AAR noted that it would incur legitimate costs in order to comply with new regulatory changes from the Power of Choice (POC) package of rule changes and associated procedural changes and that these costs do not include the replacement or purchase of smart meter devices as suggested in the Commission’s draft report.11 The Commission confirms that the direct costs of replacement or purchase of smart meter devices are to be recovered separately from customers through contractual arrangements as is currently the case. But AAR contends that a series of important costs relate to various supporting and indirect tasks, including designing and building information and management systems, and supporting services for integration into the system requirements of Australian Energy Market Operator (AEMO) in order to support the operation of smart meters.12 AAR considers that the cost pass through provisions should be amended to allow recovery of these costs that arise as a result of the Power of Choice regulatory requirements and that the Price Direction should be adjusted to allow a pass-through event to be included in the first year of the regulatory period.13
Supporting the same argument, AGL stated in its submission to the draft report that:
10 The details of the current pass-through provisions are contained in ICRC, 2014b: 39-43.11 ActewAGL Retail, 2017: 12-13.12 ActewAGL Retail, 2017:12. 13 ActewAGL Retail, 2017:13.
Final report: Standing offer prices for the supply of electricity to small customers from 1 July 2017 9
2 – Commission’s regulatory approach and pricing mode
[The costs associated with POC reforms] should be allowed for as an addition to the retail operating costs14.
In contrast, in the ACT ECPC’s submission to the draft report:
[The ECPC] supports the Commission’s decision not to amend the current pass-through provisions to include costs associated with Power of Choice reforms…There need to be a careful monitoring of how the costs of reforms are passed on, and whether there is opportunistic behaviour, which sees retail costs increase, but no subsequent fall in distribution costs following transfer of responsibility. 15
The ACAT, in its submission to the issues paper, generally supports the Commission’s approach in relation to appropriate cost pass-through arrangements.16
The key issue is the extent to which there are unavoidable set-up type costs that arise as a result of the Power of Choice regulatory requirements which can be shown to be attributed to serving the regulated customer base. A further issue is how and over what period the costs should be recovered.
Commission’s consideration and final decision
The Australian Energy Market Commission’s (AEMC) final rule change of 26 November 2015 is designed to facilitate competition in the provision of certain metering services. Review of the rule change documentation suggests that the deployment of new smart meters and the billing of the costs for their installation is a matter to be agreed between retailers and their customers.
Under the current arrangements, when meters are replaced the costs are recovered separately from customers through contractual arrangements and these costs are not regulated by the Commission. The Commission confirms that this is expected to continue when new meters are deployed. In addition, it is recognised that the AEMC rule change will facilitate competition in the installation of meters. This interpretation is consistent with outcomes in a competitive market and means that the costs of installing and supporting smart meters should not be automatically included in standard regulated tariffs without a formal policy direction from Government.
There is no government policy currently that directs a mass roll out of smart meters across the ACT, or that supports the development of systems and associated costs necessary for supporting a mass roll out of smart meters. The Commission understands that AAR does not intend to undertake a mass roll out of smart meters. The Commission will not approve the recovery of costs required to support a mass roll out in the absence of a relevant government policy direction.
Concerning the issue of necessary set-up costs incurred in complying with AEMO requirements, the Commission will consider these for inclusion in pass-through costs
14 AGL, 2017: 2.15 ECPC, 2017:3.16 ACAT 2017:2.
10 Final report: Standing offer prices for the supply of electricity to small customers from 1 July 2017
subject to the following principles that it intends to apply, in addition to its standard approaches, in evaluating these costs and their recovery:
AAR will need to demonstrate that:
1. the costs for which it is seeking approval for recovery in the retail regulated electricity tariff are the minimum, efficient costs necessary to support the installation of new smart meters and replacement meters on a case-by-case as needed basis, and not for a market-wide installation of new meters;
2. the costs in question are related to supplying smart meter services to customers who are on regulated tariffs and consequently facing regulated prices;
3. the costs in question do not relate to providing non-regulated services associated with the installation and operation of smart meters;
4. the costs in question are both prudent and efficient; and
5. the recovery period over which AAR seeks to recover the costs should be reasonable.
Once the Commission has reviewed any AAR submission against foregoing principles it will determine the quantum of costs for recovery, the period for recovery, the customer base for recovery and the adjustment to the standard regulated retail electricity tariff.
The Commission confirms that AAR can make an application for a price set related to the Power of Choice reforms in the first year of the next regulatory period.
2.3 Summary of final decision on the regulatory approach
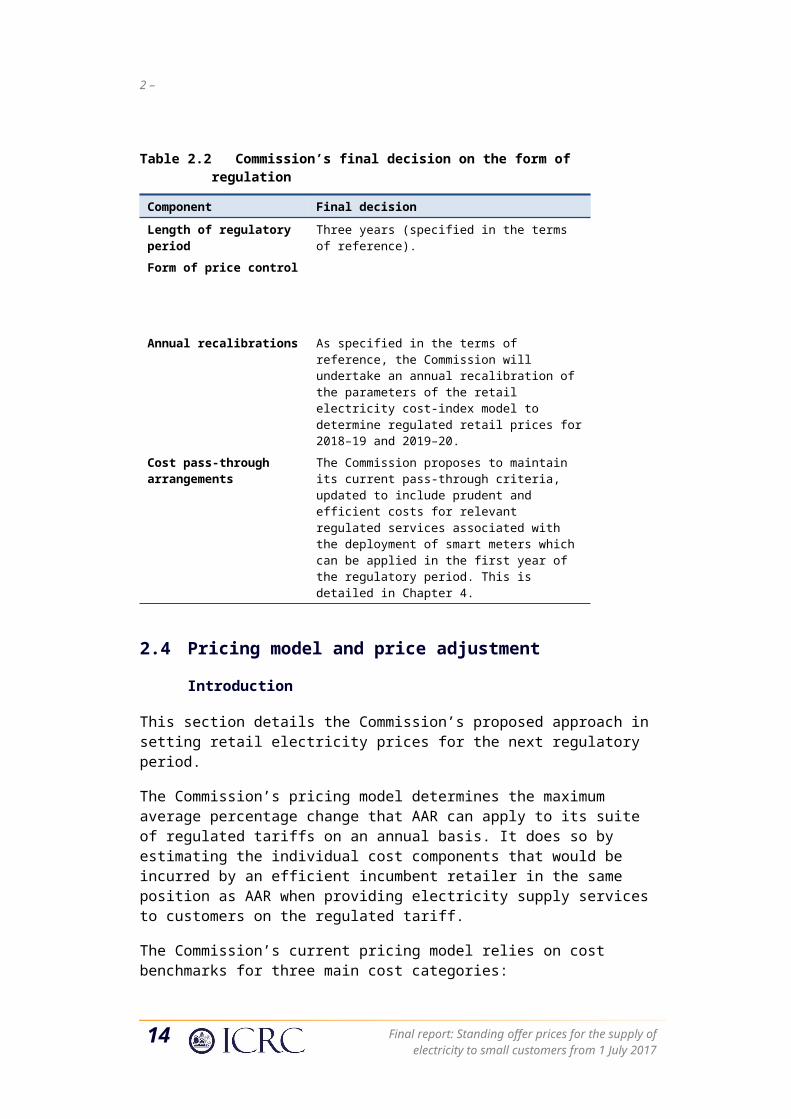
The Commission’s final decision on the form of regulation for the next regulatory period are summarised in Table 2.2.
Final report: Standing offer prices for the supply of electricity to small customers from 1 July 2017 11
2 – Commission’s regulatory approach and pricing mode
Table 2.2 Commission’s final decision on the form of regulation
Component Final decisionLength of regulatory period Three years (specified in the terms of reference).
Form of price control
Annual recalibrations As specified in the terms of reference, the Commission will undertake an annual recalibration of the parameters of the retail electricity cost-index model to determine regulated retail prices for 2018–19 and 2019–20.
Cost pass-through arrangements
The Commission proposes to maintain its current pass-through criteria, updated to include prudent and efficient costs for relevant regulated services associated with the deployment of smart meters which can be applied in the first year of the regulatory period. This is detailed in Chapter 4.
2.4 Pricing model and price adjustment
Introduction
This section details the Commission’s proposed approach in setting retail electricity prices for the next regulatory period.
The Commission’s pricing model determines the maximum average percentage change that AAR can apply to its suite of regulated tariffs on an annual basis. It does so by estimating the individual cost components that would be incurred by an efficient incumbent retailer in the same position as AAR when providing electricity supply services to customers on the regulated tariff.
The Commission’s current pricing model relies on cost benchmarks for three main cost categories:
wholesale electricity costs, which comprise energy purchase costs, (Large-scale Renewable Energy Target) LRET and Small-scale Renewable Energy Scheme (SRES) costs, energy losses, energy contracting costs and National Electricity Market (NEM) fees;
network costs, which include transmission and distribution costs and the ACT’s renewable energy feed-in tariff schemes; and
retail costs, which comprise retail operating costs, Energy Efficiency Improvement Scheme (EEIS) compliance costs and retail margin.
Once these three cost categories are estimated, they are added together to produce total costs to be recovered in dollars per megawatt hour ($ per MWh). This cost is then used in conjunction with the total costs calculated for the previous year to produce a maximum allowable percentage change that AAR can apply under the weighted
12 Final report: Standing offer prices for the supply of electricity to small customers from 1 July 2017
average price cap to its regulated retail tariffs for the first year of the next regulatory period.17, 18
The Commission’s pricing model is illustrated in Figure 2.5.
17 The sum of the proposed new tariffs on ActewAGL Retail’s regulated tariffs (i.e; ActewAGL Retail’s electricity plans for residential and small business customers) weighted over electricity prices for different price plans and customer groups with the weights based on revenues in the previous period (a Laspeyres price index) should be less than or equal to the maximum allowable percentage change determined by the Commission. The details of the formula can be found in ICRC, 2014b: 8.18 Chapter 4 sets out the method by which prices will be set for the subsequent years of the regulatory period.
Final report: Standing offer prices for the supply of electricity to small customers from 1 July 2017 13
2 – Commission’s regulatory approach and pricing mode
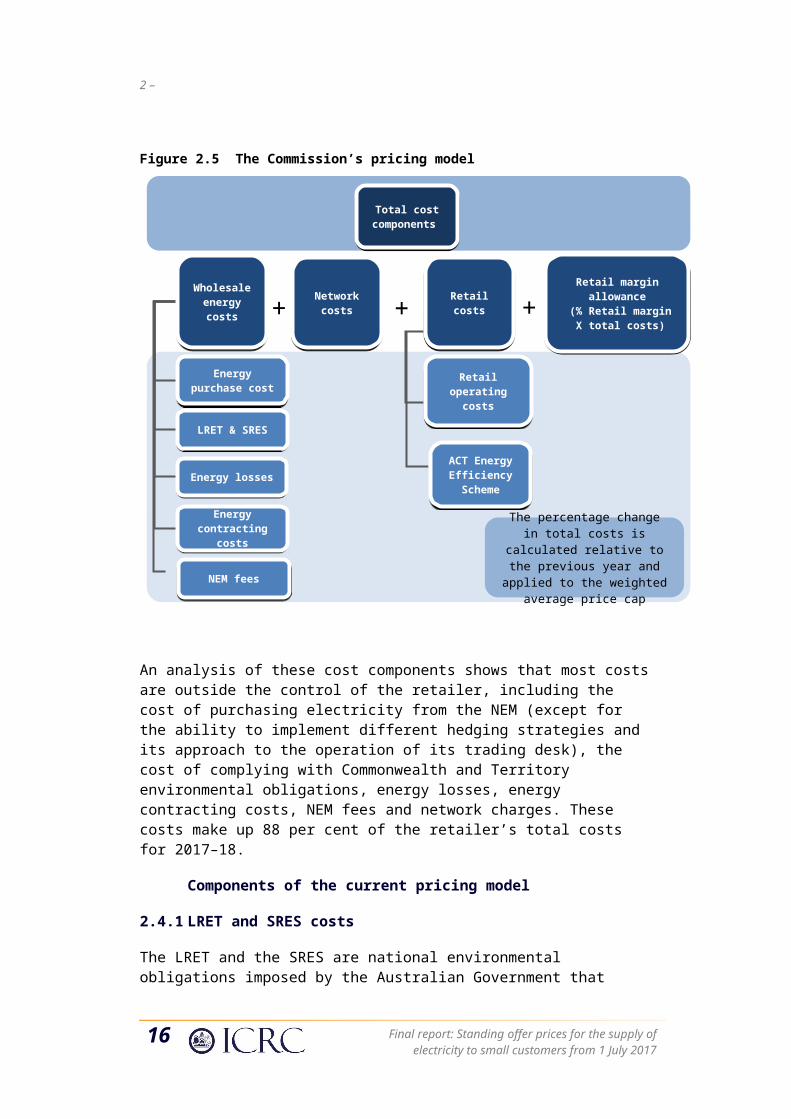
Figure 2.5 The Commission’s pricing model
An analysis of these cost components shows that most costs are outside the control of the retailer, including the cost of purchasing electricity from the NEM (except for the ability to implement different hedging strategies and its approach to the operation of its trading desk), the cost of complying with Commonwealth and Territory environmental obligations, energy losses, energy contracting costs, NEM fees and network charges. These costs make up 88 per cent of the retailer’s total costs for 2017–18.
Components of the current pricing model
2.4.1 LRET and SRES costs
The LRET and the SRES are national environmental obligations imposed by the Australian Government that create financial incentives for investment in renewable energy sources. These obligations are separate to the ACT Government’s renewable energy target. The schemes require electricity retailers to purchase and surrender Large-scale Generation Certificates (LGC) and Small-scale Technology Certificate (STC) to the Clean Energy Regulator in percentages set by regulation each year.19
19More information on the LRET and the SRES schemes can be found on the Clean Energy Regulator’s website: http://www.cleanenergyregulator.gov.au/About/Accountability-and-reporting/administrative-reports/The-Renewable-Energy-Target-2012-Administrative-Report/The-Renewable-Energy-Target-
14 Final report: Standing offer prices for the supply of electricity to small customers from 1 July 2017
+++Retail margin allowance (% Retail margin X total
costs)
ACT Energy Efficiency Scheme
Retail operating costs
NEM fees
Energy contracting costs
Energy losses
LRET & SRES
Energy purchase cost
Retail costsNetwork costs
Wholesale energy costs
Total cost components
The percentage change in total costs is calculated relative to the previous year and applied to the
weighted average price cap
In the draft report, the Commission proposed to maintain the current market-based approach to determining the LRET and SRES costs. The Commission’s methodology for estimating the cost of meeting these national obligations is summarised below.20
The Commission applies a market-based approach for determining efficient LRET and SRES costs. The model determines LGCs and STCs prices based on publicly available spot price data averaged over an 11-month period. The Commission, based on its previous work, also applies a 10 per cent per year holding cost added to the spot price to compensate the retailer for the costs it incurs in holding the certificates up to their surrender or alternatively the start of the next financial year. The Commission’s approach provides for a cost adjustment each financial year to account for the difference between the estimated Renewable Power Percentage (RPP) at the time of the price determination and the actual RPP that is subsequently published by the Clean Energy Regulator. The Commission also applies a five per cent mark-up to the cost of LGCs to meet the LRET requirement to account for administrative operating costs associated with managing compliance with this scheme.
The Commission has adopted the same approach to estimating SRES costs as it has for LRET costs. The LRET and SRES costs are added together to form the LRET and SRES component of the wholesale cost category of the electricity cost index model.
Submissions
AAR supported the Commission’s market-based approach for determining efficient costs for LRET and SRES schemes. 21
Final decision
Given the potential for change in the economic and policy environment to occur in the 2017–2020 regulatory period, the Commission intends to re-evaluate the allowance of certificate holding costs, and LGC administrative operating costs for the incumbent retailer. This re-evaluation will occur during the 2017–2020 regulatory period as part of an overall ‘Model and Methodology Review’ – see Chapter 5. To provide regulatory certainty, any findings from the model and methodology review will not influence this price direction but if adopted will be implemented in the regulatory period after 30 June 2020.
2.4.2 Energy purchase cost
Energy purchase costs are the costs incurred in purchasing electricity from the wholesale electricity market. As prices in the wholesale electricity market may be volatile, retailers hedge their cost exposure by forward purchasing electricity in the contract market, or by taking positions in the futures market. Hedging enables a set explained.
20Full details of the Commission’s approach can be found in the 2017 draft report, 2014 draft and final reports on Standing offer prices for the supply of electricity to small customers :ICRC, 2017a: 23-27; ICRC, 2014a: 56-65; ICRC, 2014b: 20-21.21 ActewAGL Retail 2017:4.
Final report: Standing offer prices for the supply of electricity to small customers from 1 July 2017 15
2 – Commission’s regulatory approach and pricing mode
price to be paid for the purchase of wholesale electricity, but incurs a premium above average spot prices in compensation for the reduction in risk.
The energy purchase cost component of the regulated retail price is a complex and significant part of the Commission’s retail electricity pricing model. The cost of paying for energy supplied through the wholesale energy market currently accounts for 33.51 per cent of the total cost of providing retail electricity services to customers who pay the regulated retail tariff in the ACT.
Energy purchase cost model and hedging strategy22
The Commission’s energy purchase cost model (explained in detail in Appendix 3)23 determines a benchmark cost of energy based on observed market outcomes and a conservative hedging strategy.
The energy purchase model comprises six components: the forward price, the load shape, the load ratio, the forward price margin, the quarterly load weights and the cost of carbon (which is currently zero).
The forward price represents the cost of pre-purchasing electricity to be delivered at a later date.
The load shape reflects the extent to which the level of the load and the spot price move together and is measured by the ratio of the load-weighted spot price to the time-weighted spot price. The spot price is normally positively related to the load, as higher load typically requires higher cost sources of energy to be generated.
The load ratio, also often described as the load profile, is measured by the ratio of peak load to average load. The load ratio component can be interpreted as allowing for an extreme effect on price.
The forward price margin captures the observation that forward prices generally exceed average spot prices.
Quarterly load weights are required to calculate the annual average energy purchase cost. The load weight for each quarter is equal to the historical average load in that quarter divided by the sum of the historical average for all four quarters.
The cost of carbon has varied in line with Government policy, and is retained at zero in the model for time-consistency.
22 For more information on the development and use of the model, see ICRC, 2017a: 13-23; ICRC, 2014a: 34-56 and ICRC, 2014b: 11-16. ICRC, 2010: full technical paper with details of the development of the Commission’s hedging strategy.23 Appendix 4 presents a mathematical derivation of the model.
16 Final report: Standing offer prices for the supply of electricity to small customers from 1 July 2017
The load shape, the load ratio and the forward price margin are used to calculate the uplift factor that is applied to the forward price to reflect the retailer’s hedging cost.
The Commission’s current hedging strategy assumes that the incumbent retailer purchases enough forward contracts to reduce to a negligible level the possibility of having insufficient forward cover to meet demand in any trading interval. The strategy also assumes that excess forward contracts can be sold on the spot market. The net cost of hedging in the model is the difference between the cost of forward contracts and the revenue from the sale of contracts that are in surplus.
The cost in dollars per megawatt hour ($/MWh) of the hedging strategy can be expressed as:24
Cost of hedging∈$ per MWh=FP× [ LS × (1−M )+LR × M ]
That is, the cost of hedging in dollars per MWh is equal to the forward price multiplied by an uplift factor (the term in the square brackets). The uplift factor is a weighted average of the load shape and the load ratio, where the weight on the load shape is equal to 1 minus the forward premium (1-M) and the weight on the load ratio is equal to the forward premium (M), set at five per cent.
In the draft report the Commission raised the issue of the potential impact on the Commission’s hedging model of the ACT’s large scale renewable energy scheme (LRES) and in particular the extent to which the LRES might reduce price volatility for a generator, a retailer and consumers.25
The LRES requires AAR to pay a feed-in tariff (FiT) to an eligible renewable energy generation business on a monthly basis for the ‘eligible electricity’ generated. The payments made by ActewAGL Distribution are based on a ‘contract for difference’ basis. This means ActewAGL Distribution pays the generator, for each delivered MWh, the difference between the generator’s FiT price and the spot price of that MWh in the wholesale market in the wholesale market pool where the energy is generated. This occurs for each 30 minute trading interval and is aggregated and paid monthly in arrears.
If, over the course of a month, the wholesale spot price is below the feed-in tariff price, ActewAGL Distribution will pay the generator a top-up amount. If the wholesale market spot price is higher than the FiT amount, ActewAGL Distribution will be paid the difference. The costs or savings related to the ‘contract-for-difference’ payments are passed on to all ACT electricity consumers through their retail suppliers. It is clear that the LRES eliminates price volatility for a generator that is part of the scheme and the Commission sought views on the impact on retailers and customers.
24 Appendix 3 provides a mathematical derivation of this expression. 25 http://www.environment.act.gov.au/energy/cleaner-energy/how-do-the-acts-renewable-energy-reverse-auctions-work.
Final report: Standing offer prices for the supply of electricity to small customers from 1 July 2017 17
2 – Commission’s regulatory approach and pricing mode
Submissions
In AAR’s submission to the issues paper, it argued that as the Commission’s model is based on a swap only hedge, it underestimates the efficient costs incurred by retailers and is too simplistic as:
Prudent and efficient retailers layer a combination of base swaps, peak swaps and caps to hedge a load. Retailers us these more complex structures to manage forward price risks. In practice retailers don’t use a simple swap only hedge approach.26
Furthermore, in AAR’s submission to the draft report, it noted that:
The hedging strategy of an efficient retailer will not change due to the increase in use of contract for difference payments associated with the ACT Government’s LRES…Volatility in the spot market is not reduced by the generation type being renewable instead of gas or coal generation.27
In contrast, the ACT ECPC’s submission to the draft report, supported the Commission’s intention to further examine the impact on the pricing model of the ACT Government’s LRES.
In AGL’s submission to the draft report, it noted that the Commission’s wholesale energy cost methodology relies on approximately two years of Australian Stock Exchange (ASX) futures prices which has provided stability in the past, but in the current environment results in a significant lag and regulated prices are unlikely to reflect current market prices.
Commission’s consideration and final decision
To provide regulatory certainty, any findings from the model and methodology review will not influence this price direction but if adopted will be implemented in the regulatory period after 30 June 2020.
Model and Methodology Review’(see Chapter 5)
Error: Reference source not found reports the annual load shape and ratio and resulting uplift factor over the period 200910 to 201718.28 It shows that 201213, reflecting a reduction in hedging costs on average. The Commission believes that the uplift factor will vary over time with actual market conditions and any changes in retailer’s hedging costs are broadly captured by the changes in the uplift factor.
As noted earlier, the Commission considers its approach to hedging in its energy purchase cost model is conservative. The combination of load shape and load ratio create an uplift factor that in the Commission’s opinion compensates an efficient
26 ActewAGL Retail 2016: 8.27ActewAGL: Retail 2017:5.28 See ICRC, 2014a: 44-49 and ICRC, 2016: 12-14 for the Commission’s uplift factor equation and the related discussion on the subject.
18 Final report: Standing offer prices for the supply of electricity to small customers from 1 July 2017
retailer for the costs associated with hedging the energy purchases needed to underpin its regulated tariffs. It appears to satisfy both the long run risk objective while allowing for a low short run cash flow worst case outcome. It may also satisfy both long run and short run objectives, but given 201617 observed price market volatility this appearance should be held to empiric account.
The current hedging model is not the only way the Commission could calculate the cost of hedging. As AAR notes, retailers use a combination of base swaps, peak swaps and caps. These costs may be more or less than the Commission’s benchmark approach allows. The Commission therefore intends to re-evaluate the hedging strategy during the 20172020 regulatory period as part of an overall ‘Model and Methodology Review’ – see Chapter 5. To provide regulatory certainty, any findings from the model and methodology review will not influence this price direction but if adopted will be implemented in the regulatory period after 30 June 2020.
Forward price
The forward price in the Commission’s model represents the cost of purchasing electricity. The Commission accesses two sources of forward prices: The ASX market data and over-the-counter (OTC) contract data from ICAP.29
In the draft report, the Commission expressed it preference for exchange-traded ASX market data averaging over a 23-month period instead of OTC contract data.
Submissions
AAR in its submission to the draft report supported the Commission’s proposed change of returning to using the exchange traded ASX forward price data averaging over a 23-month period.
Nevertheless, AGL, in its submission, argued that:
Whist this methodology has provided stability in the past, in the current environment of rapidly rising wholesale costs, this results in a significant lag, and regulated prices are unlikely to reflect current market prices. 30
Commission’s consideration and final decision
The Commission’s methodology is based on forward contract prices as reported by the ASX. This approach has generally worked well, in that the 23 month period used to calculate the wholesale energy cost component smooths out the occasional volatile month while tracking the medium term price path of wholesale energy prices. The rapid increase in wholesale prices over the past 12 months coupled with the degree of uncertainty over generation investment and plant closures has raised the level of price uncertainty in the market.
29 In an over-the-counter contract, two parties, such as a generator and a retailer, bilaterally agree to trade a future volume of electricity at a given price.30 AGL 2017:1.
Final report: Standing offer prices for the supply of electricity to small customers from 1 July 2017 19
2 – Commission’s regulatory approach and pricing mode
The Commission therefore notes the comments of AGL and the question of whether the Commission’s energy purchase cost methodology is pertinent in this changing national electricity environment. This is a matter that will be considered during the Commission’s review of its methodology mentioned earlier. Nevertheless, for the forthcoming regulatory period, the Commission is of the view that its approach to energy purchase costs remains appropriate.
In this context, the Commission’s general preference is to use the exchange-traded ASX market data instead of OTC contract data due to the lack of transparency inherent in the OTC market. In addition, evidence shows that both data series move together with ASX data being reflective of OTC contract prices.
The Commission’s current view is that a 23-month period is a relatively long period containing a large number of observations to reliably reflect an actual purchasing window of a prudent retailer. It smooths out the effects of any sharp increases or decreases in forward prices occurred during a financial year.
The carryover effects associated with the recent sharp increases in wholesale electricity prices will be captured in subsequent annual calibrations in 2018 and 2019 as the rolling 23 month period used in energy purchase cost model will see these higher energy costs progressively rolled in.
The Commission’s final position is to return to the ASX forward price data averaging over a 23-month period.
Removal of cost of carbon component
The Commission’s current pricing model incorporates an adjustment to the wholesale energy purchase cost to account for the cost of carbon. In the draft report, the Commission proposed to continue the current approach of setting the carbon cost equal to zero.
Submissions
In the ACAT’s submission to the issues paper, it supported the Commission approach of setting the carbon cost component equal to zero.
AAR’s and the ACT ECPC’s submissions to the draft report supported the Commission approach of setting the carbon cost component equal to zero.
Commission’s consideration and final decision
There are two possible approaches that the Commission could follow for 201720. First, the Commission could continue the current approach of setting the carbon cost equal to zero. Second, the carbon cost component could be removed from the pricing model. The former approach is straightforward while the latter requires the Commission’s electricity pricing model to be rebuilt. As the outcome in either case would be the same, t
20 Final report: Standing offer prices for the supply of electricity to small customers from 1 July 2017
Overarching energy purchase cost model conclusion
Apart from reverting to the ASX data over a 23-month averaging period and setting the carbon cost equal to zero, the Commission will maintain its current model for this coming regulatory period 2017–2020 as previously described in this section.
Given the potential for change in the economic and policy environment during the 2017–2020 regulatory period, the Commission intends to re-evaluate its approach to energy purchase costs including the inclusion of an adjustment to the wholesale energy purchase cost to account for the cost of carbon. This re-evaluation will occur during the 2017–2020 regulatory period as part of an overall ‘Model and Methodology Review’ – see Chapter 5. To provide regulatory certainty, any findings from the model and methodology review will not influence this price direction but if adopted will be implemented in the regulatory period after 30 June 2020.
2.4.3 Energy losses
Some electricity is lost in transporting from generators to customers via transmission and distribution networks. Retailers purchase additional electricity to allow for these losses. The loss factors are calculated by the AEMO, and are used by all regulators to determine the energy loss allowances where regulated tariffs apply. The AEMO reports marginal and distribution loss factors for the forthcoming financial year.31 The Commission calculates an adjustment factor combining the marginal and distribution loss factors applicable to the ACT.
In the draft report, the Commission proposed to maintain the current approach to determining the energy losses component.
Submissions
In AAR’s submission to the issues paper, it supported the Commission’s methodology for calculating energy losses for the transportation of electricity through transmission and distribution networks based on AEMO published data.
Furthermore, in AAR’s submission to the draft report, it again supported the Commission’s methodology for calculating the energy losses component based on AEMO data with marginal loss factor to be updated to reflect the new virtual transmission node for the ACT.
Final decision
2.4.4 Energy contracting costs
Energy contracting costs represent the costs incurred by the incumbent retailer in managing an electricity-trading desk. The Commission estimated the energy
31 This data is available from the AEMO website: http://www.aemo.com.au/Electricity/National-Electricity-Market-NEM/Security-and-reliability/Loss-factor-and-regional-boundaries.
Final report: Standing offer prices for the supply of electricity to small customers from 1 July 2017 21
2 – Commission’s regulatory approach and pricing mode
contracting costs of the incumbent retailer in 2003, and has adjusted this component each year by the change in the Consumer Price Index (CPI) since then.
Submissions
AAR considers the CPI adjustment applied by the Commission to energy contracting costs to be appropriate.
Final decision
Given the potential for change in the economic and policy environment to have occurred since 2003, the Commission intends to re-evaluate the estimation of energy contracting costs of the incumbent retailer. This re-evaluation will occur during the 2017–2020 regulatory period as part of an overall ‘Model and Methodology Review’ – see Chapter 5. To provide regulatory certainty, any findings from the model and methodology review will not influence this price direction but if adopted will be implemented in the regulatory period after 30 June 2020.
2.4.5 NEM fees
The NEM is managed by the AEMO, which is funded through user fees that are paid by customers. The Commission estimated the NEM fees of the incumbent retailer in 2003, and has adjusted this component to reflect the annual change in the CPI since then.
Submissions
AAR supported the current approach in its submission to the issues paper and draft report.
Final decision
as part of an overall ‘Model and Methodology Review’ – see Chapter 5 – mentioned earlier. To provide regulatory certainty, any findings from the model and methodology review will not influence this price direction but if adopted will be implemented in the regulatory period after 30 June 2020.
2.4.6 Retail operating costs
Retail operating costs are the efficient costs incurred by the retailer in providing retail services to its customers. In 2003, the Commission estimated the retail operating costs allowance based on the cost estimates provided by AAR and benchmark observations of other regulatory decisions.
As part of the 2014 review, two changes were made to the way in which retail operating costs are calculated. The first was to increase the per MWh allowance for 2014–15 to match NSW’s Independent Pricing and Regulatory Tribunal (IPART) benchmark. The second involved an ongoing adjustment in the per customer allowance each year by the change in the consumer price index.
22 Final report: Standing offer prices for the supply of electricity to small customers from 1 July 2017
The Commission’s current pricing model does not incorporate a headroom (competition) allowance.
In the draft report, the Commission proposed to maintain the current approach.
Submissions
The Commission received a number of submissions on the issues paper on various aspects of the retail operating cost allowance.
A number of submissions argued that the retail operating cost allowance determined by the Commission is too low. AAR expressed its concern that:
The Commission’s current approach to determining retail prices results in prices below the efficient level that would allow full commercial cost recovery for an efficient mass-market new entrant. 32
Supporting the same argument, Origin stated that:
The competition in the ACT is not as effective as other jurisdictions and customers are not appropriately engaged in the energy market due to the risk that electricity tariffs will not reflect a retailer’s actual cost of supply.33
In AGL’s view:
The lower retailer participation in the ACT electricity market compared with other jurisdictions in the NEM and subsequent high market share of ActewAGL Retail are very strong indicators that the regulated price cap has been set too low for other retailers to compete. 34
The Australian Energy Council (AEC) proposed that the standing offer prices should be set at a level that reflects the true costs of operating in the market to allow retailers to compete.35
These submissions also argued for inclusion of customer acquisition and retention costs in the retail operating cost component. AAR Retail believes that the Commission needs to revisit its decision to exclude customer acquisition and retention costs from total retail costs.
AGL in its submission claimed that the Commission has misconstrued the purposes of both Customer Acquisition and Retention Costs (CARC) and headroom allowances. As they note:
They are not linked to start-up costs but are a fundamental component of a competitive retail electricity market.36
32 ActewAGL Retail, 2016: 5.33 Origin, 2016: 1. 34 AGL, 2016: 2.35 AEC, 2016: 1.
Final report: Standing offer prices for the supply of electricity to small customers from 1 July 2017 23
2 – Commission’s regulatory approach and pricing mode
Origin Energy disagreed with the Commission’s proposal to exclude customer acquisition and retention costs from its calculation of retail costs.
The AEC raised concerns about not incorporating any allowance to reflect customer acquisition and retention costs in the retail operating cost allowance of the Commission’s pricing model.
Although a number of submissions argued in favour of an allowance for CARC, the ACT Minister for Climate Change and Sustainability stated in his submission that he did:
…not consider that the inclusion of a competition allowance would be in the best interests of ACT electricity consumers. Competitive markets are not characterised by the inclusion of such allowances.37
The ACAT opposed to any form of a headroom allowance, stating that:
It will simply result in a large retail price increase and then ‘competition’ among a few entrants who offer discount prices down to where the regulated tariff would have been in the first place. In the meantime, the vast bulk of inactive customers will simply pay more.
The Commission received a number of submissions on the draft report on various aspects of the retail operating cost allowance.
A number of submissions to the draft report argued that the retail operating cost allowance determined by the Commission is too low. AAR expressed its concern that:
The ICRC has set the lowest retail operating cost per customer in Australia. Generally, the expectation would be for the ACT to receive a comparatively higher per customer retail operating cost allowance to recover fixed costs over the ACT’s relatively small scale customer base.38
In its submission, AAR also disagreed with the Commission’s statement in the draft report that:
The Commission via its allowed retail operating cost structure is currently allowing retailers to recover relevant costs relating to customer acquisition and retention.39
Supporting the same argument, AGL disagreed with the statement that the Commission, via its retail operating cost structure, recognises relevant costs relating to customer acquisition and retention. AGL further stated that:
Retail operating costs are mostly fixed and retailers with larger customer bases are able to achieve efficiencies of scale to average these costs down. The ICRC has not made
36 AGL, 2016: 3.37 Rattenbury, 2016: 2.38 ActewAGL Retail, 2017: 10.39 ICRC, 2017b: 2.
24 Final report: Standing offer prices for the supply of electricity to small customers from 1 July 2017
any allowance for the difference in the relative size of ActewAGL on retail operating costs.40
If the ICRC chooses to omit CARC and any competition allowance then it should re-examine whether the benchmarks for retail operating costs and retail margin are appropriate. Without these elements, it is highly likely that the ICRC retail operating cost and retail margin allowances are significantly understated.41
In Origin’s view:
CARC costs should be included to reflect the everyday costs incurred by a retailer in supplying electricity customers in the ACT.42
Origin argued that competition in the ACT is not as effective as in other jurisdictions due to the risk of electricity prices not being reflective of retailer’s actual cost of supply, and therefore, a competition allowance should be included to further encourage competition in the ACT’s retail electricity market.
Nevertheless, the ECPC in the ACT strongly supported the Commission’s decision to not allow a headroom allowance.
Commission’s consideration and final decision
As mentioned in the draft report, the Commission examined whether to include a competition allowance and an allowance for CARC comprehensively as part of the Commission’s 2014 investigation, and maintained that the introduction of such an allowance in the ACT was not warranted because:
…there is a strong possibility that any benefits it may produce will be long delayed and therefore of little present value.43
While the Commission acknowledges that retailers incur costs relating to churn management and advertising for new customers, it maintains that it remains appropriate not to include a separate allowance in the calculations of its cost-index model for the next regulatory period.
In the Commission’s view, inclusion of an additional CARC allowance will set regulated prices higher than the current price, and the arguments in favour of higher prices to facilitate competition in the ACT, fundamentally contradict the efficient pricing outcomes in competitive markets. The Commission believes that an increase in prices resulting from a CARC allowance or a competition allowance could only be justified if prices will reduce to efficient levels over time and longer-term benefits from competition would more than offset the cost burden faced by small customers from
40 AGL, 2017: 2.41 AGL, 2017: 3.42 Origin Energy, 2017: 2.43 See ICRC, 2014a: 97-142 for discussion on the Commission’s reasons for not introducing a competition allowance including an allowance for CARC.
Final report: Standing offer prices for the supply of electricity to small customers from 1 July 2017 25
2 – Commission’s regulatory approach and pricing mode
including a competition allowance. The Commission considers there is little evidence to indicate that a competition allowance would realise net benefits.
The Commission reiterates that in determining the efficient benchmark costs of retail operations in 2003, it estimated the retail operating cost allowance based on benchmark observations of other regulatory decisions and the cost estimates provided by AAR, which comprised the costs of retail activities such as customer care and call centre operations, billing and charging, sales and marketing collection and defaults, administration costs and retail competition activities such as churn management and advertising for new customers.44 As part of the 2014 review, the 2003 allowance was further increased to match the IPART benchmark. The 2014 revisions also included an ongoing adjustment in the per customer allowance each year by the change in the CPI. Despite that the Commission has not incorporated a separate CARC allowance as part of its retail operating costs, the Commission, via its allowed retail operating cost-structure, has recognised some costs relating to retail competition activities such as churn management.
Given these observations, the Commission proposes to continue its practice of not including such an allowance in the calculations of its cost-index model for the next regulatory period.
However, noting the comments from submissions and given the potential for change in the economic and policy environment to have occurred since the 2003 ICRC benchmark and the 2014 IPART benchmark, the Commission intends to re-evaluate the calculation of the incumbent retailer’s retail operating costs. This re-evaluation will occur during the 2017–2020 regulatory period as part of an overall ‘Model and Methodology Review’ – see Chapter 5. To provide regulatory certainty, any findings from the model and methodology review will not influence this price direction but if adopted will be implemented in the regulatory period after 30 June 2020.
2.4.7 EEIS costs
The ACT Government’s EEIS scheme places a mandatory obligation on all active retailers in the ACT to promote energy efficiency measures in households and small businesses. The EEIS Scheme, which was initially legislated to finish on 31 December 2015, has been extended for the period 2016 to 2020.
In the draft report, the Commission proposed to continue applying its current approach to determining the EEIS cost allowance for the next regulatory period, using the cost estimates provided by AAR, subject to a forward-looking prudence and efficiency assessment. Since the Commission’s methodology relies on forecast and estimated costs in advance of the actual cost being incurred, provision is made for an ex-post adjustment.
44 ICRC, 2003: 13.
26 Final report: Standing offer prices for the supply of electricity to small customers from 1 July 2017
Prudence and efficiency assessment
As part of its 2014 price determination, the Commission assessed the prudence and efficiency of AAR’s EEIS costs, and found that AAR’s forecast costs for 2014–15 were prudent and efficient. In the draft report, the Commission proposed to apply a similar forward-looking assessment of the prudence and efficiency of AAR’s forecast expenditure on the EEIS scheme.45
AARAARthe Commission proposed to undertake a two-part efficiency assessment. First is an assessment of the robustness of the process and practices that AAR utilised in delivering the activities. Second is establishing a cost ceiling above which costs will be deemed inefficient.
Submissions
In AAR’s submission to the issues paper, they stated that the EEIS costs can be assessed for prudence in terms of the abatement mechanisms chosen by AAR to satisfy the scheme’s legislative requirements. In terms of productive efficiency in delivering the selected activities, AAR employs an open tender process to deliver an efficient cost outcome.
The EEIS includes a Priority Household Target (PHT) to ensure fair and equitable access for low-income households. AAR pointed out that its Energy Saving House Call programme was designed in line with the EEIS objectives to target and benefit low-income households.
In AAR’s view, required future EEIS activities will focus more on encouraging energy efficient appliance replacements. AAR submitted that transitioning to appliance-based activities will affect adoption levels by low-income households. This implies that, unless the target for priority household participation is reduced or removed, the incentives to encourage participation of low-income households will need to increase. This will increase the total cost of delivering AAR’s EEIS obligations. AAR raised its concerns that it is facing the risk of not reaching abatement targets for priority households that will result in a significant cost increase through the imposition of shortfall penalty rates of $300 per tonne. In AAR’s view, these factors are not factored into the Commission’s cost estimation for delivering the EEIS obligations.
In his submission to the issues paper, the ACT Minister for Climate Change and Sustainability suggested that the Commission’s methodology should include further scrutiny of the abatement costs to ensure the scheme is being delivered at least cost to ACT electricity consumers:
It is critical that energy efficiency activities delivered under the scheme are cost effective. This will ensure that scheme costs passed through to customers are minimised…The Commission’s methodology should include further scrutiny of abatement activity costs delivered via competitive tender processes, including those
45 See, for more information, ICRC, 2014a: 151-154.
Final report: Standing offer prices for the supply of electricity to small customers from 1 July 2017 27
2 – Commission’s regulatory approach and pricing mode
undertaken by ActewAGL Retail and by tier two retailers who may voluntarily choose to participate in the scheme.46
The ACT Minister for Climate Change and Sustainability further suggested that the EEIS cost allowance determined by the Commission’s methodology should be assessed with reference to benchmark costs in other jurisdictions.
In its submission to the draft report, AAR supported the Commission’s approach to pass through the costs of complying with the EEIS scheme.47
The ACT ECPC noted in their submission to the draft report, that even though the Commission will be using updated cost estimates with additional information provided by AAR to assess its compliance costs, it was still unclear whether this will flow through to customers via additional price increases.
Commission’s consideration and final decision
AAR is legally obliged to implement the EEIS scheme. The Commission concluded that the associated expenditure was prudent because the activities were selected from the list of activities available to AAR to implement, as specified and accepted by the EEIS administrator.
AAR provided the Commission with more information on its decision making process. The Commission reviewed the information provided by AAR, and concluded that AAR undertook a robust expenditure decision- making process to meet its EEIS compliance requirements. Approximately 50 per cent of the AAR’s EEIE compliance costs were related to a competitive tender, and the Commission was satisfied that AAR followed a competitive tender process. Other activities involved simple rebates, which the Commission found reasonable.
The process followed by AAR also included the submission of an annual compliance plan for the EEIS Administrator’s approval. The EEIS Administrators’ approval of AAR’s 2017 compliance plan also indicated that it followed a robust decision making process, supporting the Commission’s assessment of the productive efficiency of delivering EEIS activities.
The Commission also notes that the proposed costs are below the cost ceiling of $10.32 per MWh, which is calculated using the tier penalty rate for non-compliance ($300 per T CO2-e) emissions intensity factor (0.4) and energy saving target (8.6 per cent).
The Commission will also maintain its current pass-through provisions for the costs associated with the EEIS scheme as there are a range of matters that are outside of AAR’s control that have cost implications. The details of the proposed provisions are provided in Chapter 4.
46 Rattenbury, 2016: 2.47 ActewAGL Retail, 2017: 11.
28 Final report: Standing offer prices for the supply of electricity to small customers from 1 July 2017

2.4.8 Network costs
Network costs are determined by the AER. The Commission passes through the AER’s final determination to the standard customer contract retail load.
The AER network pricing arrangements for 201617 did not follow the normal annual pricing approval process due to the then pending Federal Court decision on the AER’s appeal against the Competition Tribunal’s decision to set aside 2015 distribution determinations for the New South Wales and ACT Distribution and network service providers.
A new process was agreed in May 2017 between the AER and ActewAGL Distribution, formalised through an enforceable undertaking, which involves network charges. As a result of the outcome of the Federal Court decision, the AER will be required to review its decision regarding the allowed revenues for ActewAGL Distribution. This is likely to result in an increase in distributional use of system charges which will be allowed as a cost pass through.
Feed-in tariff costs
The terms of reference for the current price investigation require the Commission to identify and report on the FiT costs. FiT costs are not directly incurred by the AAR but are passed on to its customers through the network cost allowance.
The ACT FiT scheme supports the development of small-scale and large scale renewable energy for the Territory. Small and medium scale FiT scheme is operated under the Electricity Feed-in (Renewable Energy Premium ) Act 2008 allowing payments to households and businesses generating renewable electricity with a capacity below 200kW. The Electricity Feed-in (Large Scale Renewable Energy Generation) Act 2011 allows the ACT Government to grant FiT entitlements for large scale renewable energy generation with a capacity above 200kW. In 2016, the ACT Government legislated a 100 per cent renewable energy target to be achieved by 2020.48
The ACT’s LRES requires ActewAGL Distribution to pay a feed-in-tariff to an eligible renewable energy generation business on a monthly basis for the ‘eligible electricity’ generated. The payments made by ActewAGL Distribution are based on a ‘contract for difference’ basis. This means ActewAGL Distribution pays the generator, for each delivered MWh, the difference between the generator’s feed-in-tariff price and the spot price of that MWh in the wholesale market in the relevant wholesale market pool. This occurs for each 30 minute trading interval and is aggregated and paid monthly in arrears. If, over the course of a month, the wholesale spot price is below the feed-in tariff price, ActewAGL Distribution will pay the generator a top up amount. If the wholesale market spot price is higher than the feed-in-tariff amount, ActewAGL
48 http://www.environment.act.gov.au/energy/cleaner-energy/renewable-energy-target,-legislation-and-reporting.
Final report: Standing offer prices for the supply of electricity to small customers from 1 July 2017 29
2 – Commission’s regulatory approach and pricing mode
Distribution will be paid the difference, and the costs or savings are passed on to all ACT electricity consumers through their retail suppliers.
Feed-in-tariff costs for large and small scale generation are identified as an ActewAGL Distribution’s obligation, and are determined as part of the AER’s network price determination.
Submissions
No substantive issues were raised with the Commission’s approach to recovering network charges in response to either the issues paper or the draft report. In their submissions, AAR and Origin Energy supported the Commission’s approach of passing through the network costs approved by the AER.
Final decision
2.4.9 Retail margin
The retail margin is a profit margin to provide a return to the investment made by the incumbent retailer in providing retail electricity services.
201617
Submissions
In AAR’s and Origin’s submissions to the issues paper, both supported the current retail margin of 6.04 per cent.
AAR, in its submission to the draft report, disagreed with the Commission’s proposed approach:
The ICRC’s new approach to calculate the retail margin, which uses the CPI to index the dollar per MWh value of last year’s retail margin, is flawed because the costs that the margin recovers are not driven by CPI.
In AAR’s view, the proposed approach would not appropriately compensate for the risks. Based on independent advice from economic consultants HoustonKemp, AAR argued that retail margin recovers costs that are not recovered elsewhere in the pricing model and that do not move in line with the CPI. These costs include the working capital requirements of the retailer, the amortisation of intangible assets, the depreciation of tangible assets and return on assets.49
AAR further claimed that the Commission’s proposed approach is not consistent with the approach for setting the retail margin that the AEMC recommended in its best practice methodology.
Supporting the AAR view, AGL stated that:
49 ActewAGL Retail, 2017: 6-7.
30 Final report: Standing offer prices for the supply of electricity to small customers from 1 July 2017
It will result in a reduction in the retail margin in percentage terms in a market currently facing significant cost pressures and will ensure retail competition is limited in the ACT.50
In Origin’s view,
[The proposed approach] will not adequately compensate a retailer for supplying small customers in the ACT. The actual movement in the regulated retailer’s cost base is significantly greater than CPI.51
Although a number of submissions argued against the proposed approach, the ECPC in the ACT strongly supported the Commission’s proposal for limiting the growth in the retail margin by the change in the CPI.
Final decision
The current As part of the Commission’s 2014 price investigation, the retail margin was increased from 5.4 per cent to 6.04 per cent drawing on research undertaken by the IPART in NSW.52 This
201617
to allow for the recovery of prudent and efficient retail costs that would not otherwise be captured in the Commission’s calculation of the cost of retail supply, and could be broken down into three cost components: the cost of holding working capital, a cost associated with intangible assets (being largely customer acquisition and retention), and costs associated with tangible retail assets (being billing and related systems).
The Incenta report concludes that costs associated with working capital were likely to have outpaced CPI, but that CPI would be a reasonable proxy for intangible and tangible asset costs. The Incenta report further found the Commission’s proposed CPI indexation to be broadly consistent with jurisdictional precedent and the AEMC Best Practice Guidelines. The Incenta report further noted that the allowance for working capital forms only a small component of the retail margin – less than 15 per cent.
Given the potential for further change in the economic environment to occur during the 2017–2020 regulatory period, the Commission intends to re-evaluate the calculation of the incumbent retailer’s retail margin. This re-evaluation will occur during the 2017–2020 regulatory period as part of an overall ‘Model and Methodology Review’ – see Chapter 5. To provide regulatory certainty, any findings from the model and methodology review will not influence this price direction but if adopted will be implemented in the regulatory period after 30 June 2020.
∆ CPI t=CPI June(t−2)+CPI Sept (t−1)+CPIDec ( t−1)+CPI March(t−1)
CPI June(t−3)+CPI Sept (t−2)+CPIDec ( t−2)+CPI March(t−2)
−1
50 AGL, 2017: 2.51 Origin Energy, 2017: 3.52 IPART, 2013: 94.
Final report: Standing offer prices for the supply of electricity to small customers from 1 July 2017 31

2 – Commission’s regulatory approach and pricing mode
2.6 Summary of final decisions on the pricing model
Table 2.3 provides a summary of the Commission’s final decisions on the components of the electricity cost-index model to be applied for the regulatory period commencing 1 July 2017.
Table 2.3 Final decisions on the components of the electricity cost-index model
Component Final DecisionWholesale energy costs Energy purchase cost Maintain the current energy purchase cost model with the
ASX forward price data averaging over 23-month period.
Energy losses Energy contracting costs Maintain the current approach of adjusting energy
contracting costs by the annual change in the CPI. NEM fees Maintain the current approach of adjusting NEM fees by the
annual change in the CPI. Retail costs Retail operating costs Continue the current approach of adjusting retail operating
costs by the annual change in the CPI, and convert this to a per MWh allowance based on customer numbers and energy usage at each annual price recalibration exercise. The Commission will continue its practice of not including a separate CARC allowance.
ACT Energy Efficiency Improvement Scheme costs
Maintain the current methodology for estimation and prudence and efficiency assessment.
Network costs Maintain the current approach of passing through the network costs determined by the AER.
Retail margin
32 Final report: Standing offer prices for the supply of electricity to small customers from 1 July 2017
3 Analysis of efficient costs for 201718
3.1 Introduction
This chapter sets out the Commission’s determination of the efficient costs of supplying electricity to customers on standard retail contracts in 201718, the first year of the next regulatory period. It uses the Commission’s retail electricity cost index model described in Chapter 2.
Chapter 4 sets out the method by which prices will be set for the subsequent years of the regulatory period.
3.2 Wholesale electricity cost
As explained in Chapter 2, the Commission estimates the wholesale electricity cost by developing and costing a benchmark hedging strategy. This costing requires estimates of the forward price of energy in the wholesale electricity market, and a risk premium associated with the cost of hedging.
3.2.1 Forward price
The forward price of wholesale electricity is calculated using the ASX futures market price data. The forward price for 201718 has been calculated over a 23 month averaging period from 1 July 2015 to 31 May 2017.
Table 3.4 shows the forward prices for each calendar year quarter for the 2016–17 and 2017–18 financial years. The 2017–18 forward prices show an increase of 50 per cent over the 2016–17 financial year.
Table 3.4 Quarterly forward wholesale electricity prices, 2016–17 and 2017–18 (dollars per MWh)
Year Q3 Q4 Q1 Q2
2016–17 42.16 42.16 42.16 42.16
2017–18 63.13 63.13 63.13 63.13
Source: Commission’s calculations based on the ASX data.Note: The 2016–17 quarterly forward prices have been recalculated from that contained in the 2016–17 price reset using ASX data averaged over a 23-months period. The respective forward prices in the 2016–17 price reset were calculated using ICAP data averaged over a 21-month period.
As depicted in Figure 3.6, the daily forward price data has shown a significant upward trend from mid-2016.
Final report: Standing offer prices for the supply of electricity to small customers from 1 July 2017 33
2 – Commission’s regulatory approach and pricing mode
Figure 3.6 ASX futures market data for wholesale electricity 1 July 2015 to 31 May 2017 01
-Jul-1
518
-Jul-1
504
-Aug
-15
21-A
ug-15
07-Se
p-15
24-Se
p-15
11-O
ct-1
528
-Oct-
1514
-Nov-1
501
-Dec
-15
18-D
ec-1
504
-Jan-1
621
-Jan-1
607
-Feb-
1624
-Feb-
1612
-Mar-
1629
-Mar-
1615
-Apr
-16
02-M
ay-1
619
-May
-16
05-Ju
n-16
22-Ju
n-16
09-Ju
l-16
26-Ju
l-16
12-A
ug-1
629
-Aug-1
615
-Sep-
1602
-Oct-
1619
-Oct-
1605
-Nov-1
622
-Nov-1
609
-Dec
-16
26-D
ec-1
612
-Jan-1
729
-Jan-1
715
-Feb-
1704
-Mar-
1721
-Mar-
1707
-Apr
-17
24-A
pr-17
40
50
60
70
80
90
100
110
120
130
$/M
Wh
Source: Commission’s calculations based on the ASX data.
3.2.2 Uplift factor
A key element of the Commission’s current hedging strategy is the uplift factor, which is applied to the forward price. The uplift factor comprises the load shape, the load ratio and the forward price margin. The forward price margin, M, set at five per cent, captures the observation that forward prices generally exceed average spot prices. The uplift factor is calculated as follows:
Uplift factor=[(1−M ) ×load shape+M ×load ratio]
Load shape
The load shape captures the relationship between the spot price and electricity load. There is normally a positive relationship between the spot price and the load and this price effect has a first order effect in raising the cost of hedging. The weight on the load shape of 1-M reflects the general effect of load on prices.
The load shape is calculated using NSW spot prices and the net system load profile for ActewAGL Distribution, both reported by the AEMO.
The quarterly average load shape for 2016–17 and 2017–18 is shown in Table 3.5 and underlying quarterly load shape data from 2003–04 through 2016–17 are presented in Table 3.6.
34 Final report: Standing offer prices for the supply of electricity to small customers from 1 July 2017
Table 3.5 Quarterly average load shape, 2016–17 and 2017–18
Year Q3 Q4 Q1 Q2
2016–17 (average 2003–04 through 2015–16) 1.105 1.089 1.197 1.105
2017–18 (average 2003–04 through 2016–17) 1.106 1.085 1.189 1.109
Source: Commission’s calculations using data from the AEMO load profiles and the AEMO aggregated price and demand data files.
Table 3.6 Quarterly load shape, 2003–04 through 2016–17
Year Q3 Q4 Q1 Q2
2003–04 1.251 1.043 1.192 1.104
2004–05 1.148 1.164 1.207 1.082
2005–06 1.114 1.149 1.360 1.145
2006–07 1.161 1.080 1.207 1.387
2007–08 1.134 1.075 1.105 1.100
2008–09 1.123 1.096 1.294 1.119
2009–10 1.086 1.254 1.254 1.109
2010–11 1.067 1.024 1.561 1.036
2011–12 1.047 1.032 1.035 1.043
2012–13 1.065 1.040 1.032 1.048
201314 1.044 1.070 1.054 1.033
2014–15 1.050 1.039 1.065 1.052
2015-16 1.077 1.090 1.096 1.157
2016-17 1.113 1.034
Source: Commission’s calculations using data from the AEMO load profiles and the AEMO aggregated price and demand data files.
Load ratio
The load ratio component can be interpreted as allowing for an extreme effect and its impact will depend on the choice of the load ratio for the calculation. The weight of the forward price margin on the load ratio reflects the financial impact of requiring forward contracts to cover a price spike based on historic high loads relative to the average load.
The load ratio for each quarter is calculated as the maximum of the observed ratio of the quarterly maximum load to the quarterly average load using AEMO data. To complete the calculation of the load ratio, the Commission adds 0.1 to the observed maximum to allow for the possibility of a higher peak. The load ratios for 2016–17 and 2017–18 and the underlying load data are shown in Table 3.7
Final report: Standing offer prices for the supply of electricity to small customers from 1 July 2017 35
2 – Commission’s regulatory approach and pricing mode
Table 3.7 Quarterly load ratio, 2003–04 to 2017–18
Year Q3 Q4 Q1 Q2
200304 1.786 2.156 1.702 2.013
200405 1.828 1.905 1.724 2.108
200506 1.808 1.960 1.888 2.063
200607 1.768 1.801 1.885 2.148
200708 1.927 1.708 1.891 1.863
200809 1.746 1.821 2.250 2.061
200910 1.764 2.172 2.236 2.196
201011 1.754 1.975 2.440 2.115
201112 1.868 2.137 2.039 2.001
201213 1.815 2.489 2.469 2.261
201314 2.030 2.193 2.621 2.322
201415 1.939 2.757 2.236 2.153
201516 1.996 2.505 2.625 2.452
201617 1.965 2.568
Maximum through Q4 2015–16 2.030 2.757 2.621 2.322
Maximum through Q4 2016–17 2.030 2.757 2.625 2.452
Load ratio 2016–17 2.130 2.857 2.721 2.422
Load ratio 2017–18 2.130 2.857 2.725 2.552
Source: Commission’s calculations using data from the AEMO load profiles.
Load weights
Quarterly load weights are required to calculate the annual average energy purchase cost. The load weight for each quarter is equal to the historical average load in that quarter divided by the sum of the historical average load for all four quarters. The historical average load for a quarter is the simple average of the loads for that quarter for the period 2003–04 through 2016–17. The load used is the net system load profile for ActewAGL Distribution as reported by the AEMO. The quarterly load weights for 2016–17 and 2017–18 are shown in Table 3.8.
36 Final report: Standing offer prices for the supply of electricity to small customers from 1 July 2017
Table 3.8 Quarterly load weights, 2003–04 to 2017–18
Year Q3 Q4 Q1 Q2
200304 109.621 71.384 64.911 93.947
200405 108.849 68.535 65.910 90.063
200506 110.759 70.952 70.791 104.097
200607 109.656 70.494 70.773 95.027
200708 110.995 68.837 68.338 94.735
200809 114.401 67.694 70.945 96.657
200910 109.033 73.936 68.545 94.249
201011 111.748 66.593 63.059 94.546
201112 102.113 62.356 59.446 94.205
201213 101.811 59.272 58.250 85.369
201314 95.348 59.536 60.486 84.287
201415 96.815 53.697 52.247 85.559
201516 100.400 53.046 58.531 81.687
201617 103.304 61.256
Average through Q4 2015-16 106.273 65.102 64.475 92.728
Average through Q4 2016-17 106.061 64.828 64.018 91.879
Load weights 2016–17 0.323 0.198 0.196 0.282
Load weights 2017–18 0.325 0.198 0.196 0.281
Source: Commission’s calculations using data from the AEMO load profiles.
Uplift factor over time
Table 3.9 shows the annual load shape and ratio and resulting uplift factor over the period 200910 to 201718. The uplift factor has been falling since 201213, reflecting a reduction in the Commission’s estimates of hedging costs on average.
Final report: Standing offer prices for the supply of electricity to small customers from 1 July 2017 37
2 – Commission’s regulatory approach and pricing mode
Table 3.9 Annual uplift factor, 2009–10 through 2017–18
Year Load shape Load ratio Uplift factor
200910 1.158 2.128 1.207
201011 1.160 2.203 1.212
201112 1.153 2.215 1.207
201213 1.153 2.253 1.208
201314 1.141 2.316 1.200
201415 1.132 2.374 1.194
201516 1.125 2.474 1.192
201617 1.120 2.473 1.188
201718 1.119 2.510 1.188
Source: Commission’s calculations.
3.2.3 Energy purchase cost for 2016–17 and 2017–18
Table 3.10 shows the energy purchase cost calculated for 2016–17 in the Commission’s previous determination.
Table 3.10 Energy purchase cost, 2016–17
Component Q3 Q4 Q1 Q2
Forward price ($/MWh) (A) 42.16 42.16 42.16 42.16
Load shape (B) 1.11 1.09 1.20 1.10
Load ratio (C) 2.13 2.86 2.72 2.42
Forward price margin (D) 0.05 0.05 0.05 0.05
Uplift factor (E = (1 – D) × B + D × C) 1.16 1.18 1.27 1.17
Energy purchase cost ($/MWh) (A × E) 48.75 49.64 53.68 49.35
Annualised load-weighted EPC 50.06
Source: ICRC, 2016: 17.Note: The 2016–17 energy purchase cost amount has been recalculated from that contained in the 2016–17 price reset due to the adjustments to the forward price source (from ICAP data to the ASX data) and averaging period (from 21 months to 23 months averaging period) and the Commission’s desire to maintain comparability across adjacent years under the index approach.
Table 3.11 shows the calculated energy purchase cost for 2017–18. The quarterly load weights from Table 3.8 are multiplied by the quarterly energy purchase cost in Table 3.11 and summed to give the 2017–18 annual energy purchase cost of $75.03 per MWh, $24.97 per MWh, or 49.9 per cent, higher than the energy purchase cost for the previous year.
38 Final report: Standing offer prices for the supply of electricity to small customers from 1 July 2017
Table 3.11 Energy purchase cost, 2017–18
Component Q3 Q4 Q1 Q2
Forward price ($/MWh) (A) 63.13 63.13 63.13 63.13
Load shape (B) 1.11 1.09 1.19 1.11
Load ratio (C) 2.13 2.86 2.72 2.55
Forward price margin (D) 0.05 0.05 0.05 0.05
Uplift factor (E = (1 – D) × B + D × C) 1.16 1.17 1.27 1.18
Energy purchase cost ($/MWh) (A × E) 73.04 74.10 79.94 74.56
Annualised load-weighted EPC 75.03
Source: Commission’s calculations.
3.3 Large-scale Renewable Energy Target and Small-scale Renewable Energy Scheme costs
The costs of complying with the national LRET and SRES requirements using spot market data for LGCs and STCs are calculated in this section. Key data inputs into the cost calculations are provided in Table 3.12.
Table 3.12 LRET and SRES data, 2017 and 2018
2017 2018
Renewable power percentage 14.22% 15.64%
Average LGC spot price ($/certificate) 70.34 85.99
Small-scale technology percentage 7.01% 8.06%
Average STC spot price ($/certificate) 39.91 39.95
Half-yearly load weights 0.528 0.472
Sources: Clean Energy Regulator (2016); ICAP price data; and ActewAGL Retail half-yearly load weight data.
LRET
The average price of LGCs for calendar year 2017 is $70.34. The price of LGCs for calendar year 2018 is $85.99 and increases to $94.59 when adjusted by 10 per cent for the opportunity cost of holding certificates. The RPP for 2017 is 14.22 per cent, and is estimated at 15.64 per cent for 2017.53,54 Using the Commission’s approach, this produces a LRET allowance of $13.43 per MWh for 2017–18.
Figure 3.7 shows daily LGC spot prices since July 2013. It shows that prices remain at historically high levels.
53 http://www.cleanenergyregulator.gov.au/RET/About-the-Renewable-Energy-Target/The-certificate-market/The-renewable-power-percentage. Recall that the RPP is an annual target to achieve the national LRET target by 2020. It represents the proportion of a retailer’s total MWh of electricity purchased for which it is required to surrender LGCs. See section 2.9.1.54The non-binding RPP was estimated using the default formula set out in section 39(2)(b) of the Renewable Energy (Electricity) Act 2000 (Commonwealth).
Final report: Standing offer prices for the supply of electricity to small customers from 1 July 2017 39
2 – Commission’s regulatory approach and pricing mode
Figure 3.7 LGC spot prices, July 2013 to May 2017
01-Jul-13
01-Sep-13
01-Nov-13
01-Jan-14
01-Mar-1
4
01-May-14
01-Jul-14
01-Sep-14
01-Nov-14
01-Jan-15
01-Mar-1
5
01-May-15
01-Jul-15
01-Sep-15
01-Nov-15
01-Jan-16
01-Mar-1
6
01-May-1
6
01-Jul-16
01-Sep-16
01-Nov-16
01-Jan-17
01-Mar-1
7
01-May-17
20
30
40
50
60
70
80
90
LGC
spot
pric
e ($
/cer
tifica
te)
Source: ICAP data.
SRES
The average price of STCs for calendar year 2017 is $39.91. The average price for 2018 is $39.95 and increases to $43.95 when adjusted for the holding cost. The small-scale technology percentage for 2017 is 7.01 per cent, and is estimated at 8.06 per cent for 2017.55 Using the Commission’s approach, this produces a SRES allowance for 2017–18 of $3.46 per MWh.
As shown in Figure 3.8, the STC spot price has remained high since about April 2015 exerting significant influence on electricity prices.
55 http://www.cleanenergyregulator.gov.au/RET/About-the-Renewable-Energy-Target/The-certificate-market/The-small-scale-technology-percentage.
40 Final report: Standing offer prices for the supply of electricity to small customers from 1 July 2017
Figure 3.8 STC spot prices, July 2013 to May 2017
01-Jul-1
3
01-Oct-
13
01-Jan-14
01-Apr-14
01-Jul-1
4
01-Oct-
14
01-Jan-15
01-Apr-15
01-Jul-1
5
01-Oct-
15
01-Jan-16
01-Apr-16
01-Jul-1
6
01-Oct-
16
01-Jan-17
01-Apr-17
35
36
37
38
39
40
41
STC
spot
pric
e ($
/cer
tifica
te)
Source: ICAP data.
Cost adjustment
The Commission’s approach allows for a cost adjustment resulting from any difference between the actual 2017 small-scale technology percentage and renewable power percentage and the estimated numbers used in the 2016–17 decision.56 The Commission has calculated an adjustment of -$0.92 per MWh for 2016–17 for these costs to be included in the LRET and SRES cost allowance for 2017–18 draft decision.
Total allowance
The draft LRET and SRES allowances for 2016–17 and 2017–18 are summarised in Table 3.13. The allowance for 201718 of $15.97 per MWh is $2.82 per MWh or 21.5 per cent more than the allowance for the previous year.
56 Recall that the small-scale technology percentage represents the proportion of a retailer’s total MWh of electricity purchased for which it is required to surrender STCs. See section 2.9.1.
Final report: Standing offer prices for the supply of electricity to small customers from 1 July 2017 41
2 – Commission’s regulatory approach and pricing mode
Table 3.13 LRET and SRES allowance, 2016–17 and 2017–18 (dollars per MWh)
2016–17 2017–18
LRET 8.80 13.43
SRES 4.25 3.46
Cost adjustment from previous year 0.10 -0.92
Total cost 13.15 15.97
Source: Commission’s calculations.
3.4 Energy losses
The energy loss factors are calculated by the AEMO. They are used by all regulators to determine the energy loss allowances where regulated tariffs apply. The marginal loss factor and distribution loss factor, as reported by AEMO for the ACT in 2017–18 are 1.0396 and 1.0482, respectively. The Commission’s methodology generates an energy loss cost component of $7.54 per MWh for 2017–18.
3.5 Energy contracting costs
The energy contracting cost allowance is adjusted by the annual change in the consumer price index. The Commission has calculated an allowance of $0.89 per MWh for energy trading and management costs for 2017–18. This is based on an adjustment of the 2016–17 cost allowance of $0.87 per MWh for a change of 1.48 per cent in the consumer price index.
3.6 National Electricity Market fees
The cost allowance for NEM fees is adjusted by the annual change in the consumer price index. The Commission has calculated an allowance of $0.89 per MWh for NEM fees for 2017–18. This is based on an adjustment of the 2016–17 cost allowance of $0.87 per MWh for a change of 1.48 per cent in the consumer price index.
3.7 Retail operating costs
The retail operating cost allowance for 201718 is calculated by adjusting the 201617 per customer allowance of $119.31 by the change in the consumer price index of 1.48 per cent. This adjustment takes the per customer allowance to $121.07 for 201718.
This value is then converted into an allowance per MWh for retail operating costs using customer numbers and energy usage information as provided by AAR for the year to 31 March 2017. This converts to an allowance of $15.25 for 2017–18.
42 Final report: Standing offer prices for the supply of electricity to small customers from 1 July 2017
3.8 Energy Efficiency Improvement Scheme costs
AAR provided the Commission with updated information on its EEIS compliance costs and processes on 8 May 2017. Table 3.14 shows AAR’s forecast abatement costs for the EEIS. AAR expects to spend approximately $9.3 million in 2017–18 to abate about80,288t Co2-e at an average cost of $116 per t CO2-e.
Table 3.14 ActewAGL Retail EEIS abatement costs and targets 2017–18
Jul 2016–Jun 2017
Jul 2017–June 2018
Compliance costs ($) 11,608,157 9,328,469
Energy Savings Obligation (t CO2) 77,683 80,288
Abatement cost ($ per t CO2-e) 149.43 116.19
Source: ActewAGL Retail data.
In its submission, AAR proposed a positive adjustment for the difference between the Commission’s original forecast and the revised expected cost. As shown in , the Commission has estimated AAR’s forecast abatement cost for the 2017–18 regulatory year. The forecast cost of $4.16 per MWh accounts for an adjustment of $0.16 for 2016–17.
Table 3.15 Forecast EEIS costs, 2017–18, $ per MWh
Year Cost allowance per tonne
Emissions factor
Energy savings target
Cost per MWh
Half-yearly load weights
Jul–Dec 2017 116.19 0.4 8.6% $4.00 52.8%
Jan–Jun 2018 116.19 0.4 8.6% $4.00 47.2%
Adjustment 2016–17 0.16
2017–18 EEIS cost ($ per MWh) $4.16
Source: Commission’s calculations using ActewAGL Retail data.
3.8.1 Prudence and efficiency
As discussed in Chapter 2 in detail, the Commission determined that the decision to spend money was necessary as AAR is legally obliged to implement the scheme. As for efficiency, the Commission concluded that it was satisfied that AAR had undertaken a robust expenditure decision making process to meet its EEIS compliance requirements and that its proposed costs were below the cost ceiling determined by the Commission based on the scheme’s penalty rate for non-compliance.
3.8.2 Final decision
Having reviewed AAR’s proposed expenditure, activities and expenditure processes, the Commission’s final decision is to determine an allowance of $4.16 per MWh for 2017–18.
Final report: Standing offer prices for the supply of electricity to small customers from 1 July 2017 43
2 – Commission’s regulatory approach and pricing mode
3.9 Network cost allowance
3.9.1 Network costs
The Commission passes through the network charges determined by the AER and applied by AAR to the standard customer contract retail load.
As previously mentioned in Section 2.4.8, the AER network pricing arrangements for 201718 did not follow the normal annual pricing approval process due to a recent Federal Court decision. A new process was agreed in May 2017 between the AER and ActewAGL Distribution, formalised through an enforceable undertaking, which involves network charges. The AER published ActewAGL Distribution’s enforceable undertaking and the revised pricing proposal for 2017–18 on 17 May 2017.
AAR subsequently provided the Commission with its 2017–18 network cost allowance proposal for the regulated ACT customer load on 19 May 2017 followed by a revised version on 23 May 2017. Table 3.16 shows ActewAGL Distribution Distribution’s total network revenue for 2017–18. The Commission is unable to report on ActewAGL Distribution’s revenue components for 2016–17 as the AER network pricing arrangements for 2016–17 did not require ActewAGL Distribution to submit its usual annual pricing proposal, which separately identifies those cost components. Hence, the table below shows ActewAGL Distribution’s revenue for 2015–16 for comparison purposes.
Table 3.16 ActewAGL Distribution network revenue components, 2015–16 and 2017–18
Components 2015–16 ($) 2017–18 ($)
Distribution use of system 128,577,66
8 132,574,00
0
Transmission use of system 62,746,556 31,639,395
ACT Government schemes 28,411,89
4 69,750,600
Total 219,736,11
8 233,963,99
5 Sources: ActewAGL Distribution (2015); ActewAGL Distribution (2017).
Based on ActewAGL Distribution’s approved network charges, AAR proposed a network cost allowance of $92.88 per MWh to apply to regulated retail tariffs in 2017–18. The Commission examined this proposal and determined an amount of $92.88 per MWh as the network cost allowance for 2017–18. The 2017–18 cost allowance is 4.03 per cent higher than the 2016–17 cost allowance.
The Commission notes that the final cost implications of the relevant Federal Court decision are unknown as of June 2017, but are likely to impact future cost estimates.
44 Final report: Standing offer prices for the supply of electricity to small customers from 1 July 2017
3.9.2 Feed-in tariff compliance costs
The Commission reviewed ActewAGL Distribution’s enforceable undertaking and pricing proposal to the AER to identify and report on the FiT cost allowance as required by the terms of reference. FiT costs are not directly incurred by AAR but are passed on to its ACT customers through the network cost allowance.
The current enforceable undertaking has separately identified jurisdictional scheme costs for 2017–18. ACT jurisdictional scheme comprises the small-scale FiT, the large-scale FiT, the utilities network facilitation tax, and the energy industry levy. As shown in Table 3.17, the estimated jurisdictional scheme costs for 2017–18 is $69.75 million, which accounts for 29.8 per cent of total network revenue. ActewAGL Distribution has estimated total FiT costs of $56.78 million for 2017–18 with $17.67 million for the small and medium-scale scheme and $ 39.11 million for the large-scale scheme. The total FiT costs account for 24.27 per cent of total network revenue for 2017–18. They contribute 8.89 per cent of the total costs for 2017–18, as can be seen in Table 3.15.
Table 3.17 Jurisdictional scheme cost components, 2015–16 and 2017–18
Components 2015–16 ($’000)(Actual)
2017–18 ($’000)(Forecast)
FiT small, medium and large scale 20,395 56,783 Energy industry levy 1,058 1,195 UNFT 6,478 7,326 Over(under) recovery for the financial year 708 4,446Total 28,639 69,751
Source: ActewAGL Distribution (2017).
For ease of comparison with other components of the cost index model, the FiT costs are presented on a per MWh basis in Table 3.18. This requires multiplying the network cost allowance by the proportion of total network costs that can be attributed to FiT costs. On this basis, using the final network cost allowance of $92.88, the Commission has calculated an implied FiT cost allowance of $22.54 per MWh for 2017–18. On average for ACT customers, this translates to $180.34 per year, of which the large-scale FiT contributes $124.22.
Final report: Standing offer prices for the supply of electricity to small customers from 1 July 2017 45
2 – Commission’s regulatory approach and pricing mode
Table 3.18 ActewAGL Distribution estimated FiT costs, 2017–18
Fit costs 2017–18 costs ($’000)
% of total network revenue $/MWh
Feed-in tariff, small and medium-scale 17,668 7.55 7.01
Feed-in tariff, large-scale 39,115 16.72 15.53
Total 56,783 24.27 22.54
Sources: ActewAGL Distribution (2017) and the Commission’s calculations.
Figure 3.9 demonstrates the contribution of renewable policy costs to the total cost variation, separated by jurisdictional origin.
Figure 3.9 Components of the change in regulated retail electricity prices 2016–17 to 2017–18, by cost component
0%
10%
20%
30%
40%
50%
60%
70%
80%
90%
100%
Cost of electricity and related services (82.12%)
ACT Government renewable energy schemes (10.75%)
Commonwealth Government's renewable energy costs (7.13%)
Source: Commission’s calculations.
3.10 Retail margin
As discussed in detail in Chapter 2, the Commission’s final decision is to set the 201718 Applying this margin to all of the cost categories of the retail electricity cost index model generates a retail margin allowance of $11.27 per MWh for 2017–18.
The Commission’s model estimates three main cost categories: retail costs, network costs and wholesale electricity costs. The latter two components of total cost make up
46 Final report: Standing offer prices for the supply of electricity to small customers from 1 July 2017
around 86.30 per cent of the total electricity bill. These are substantially set outside of either AAR’s commercial control or the Commission’s regulatory control.
Retail costs, except for EEIS costs, are charged by AAR and are under the Commission’s direct regulatory control. These make up around 13.70 per cent of the total electricity bill, including EEIS costs. The Commission has taken a number of measures to ensure increases in retail costs are controlled, limited and only as necessary.
The comparative contribution of the three main cost categories are demonstrated below in Figure 3.10.
Figure 3.10 Changes in the components of regulated retail electricity prices 2016–17 to 2017–18
0%
10%
20%
30%
40%
50%
60%
70%
80%
90%
100%
Wholesale electricity costs (44.81%)
Network costs (41.49%)
Retail costs (13.70%)
Source: Commission’s calculations.
3.11 Final decision on cost elements
Table 3.19 sets out the Commission’s final decision on the cost components used to determine the maximum allowed change in the regulated retail electricity price for 2017–18, using the methodology set out in Chapter 2. The Commission’s final decision provides for an average nominal increase of 18.95 per cent in AAR’s basket of regulated tariffs. This is equivalent to a real (adjusted for inflation) increase in the regulated retail price of about a 17.21 per cent.
Final report: Standing offer prices for the supply of electricity to small customers from 1 July 2017 47
2 – Commission’s regulatory approach and pricing mode
Table 3.19 Final decision on cost elements, 2017–18
2016–17 ($/MWh)
2017–18 ($/MWh) % change
Wholesale energy purchase cost 50.06 75.03 49.87 National renewable energy (LRET and SRES) costs 13.15 15.97 21.49 Energy losses 3.76 7.54 100.87
Energy contracting cost 0.87 0.89 1.48 NEM fees 0.87 0.89 1.48
Total energy purchase cost 68.72 100.32 45.99 Retail operating costs 14.56 15.25 4.77
ACT Energy Efficiency Improvement Scheme costs 4.93 4.16 -15.61
Total retail costs 19.49 19.41 -0.38 Network costs 89.28 92.88 4.03
Total energy + retail + network costs 177.48 212.61 19.79 Retail margin 10.73 11.27 5.04
Total costs 188.21 223.88 18.95
Note: The 2016–17 energy purchase cost amount has been recalculated from that contained in the 2016–17 price reset due to the adjustments to the forward price source (from ICAP data to the ASX data) and averaging period (from 21 months to 23 months averaging period) and the Commission’s desire to maintain comparability across adjacent years under the index approach.
Figure 3.11 shows the contribution of the various cost components to the total percentage change in prices from 2016–17 to 2017–18. The primary driver of the price increase is the wholesale electricity purchase cost, driven by rapidly increasing forward prices. The wholesale electricity purchase cost contributes 13.26 percentage points of the total change of 18.95 per cent.
48 Final report: Standing offer prices for the supply of electricity to small customers from 1 July 2017
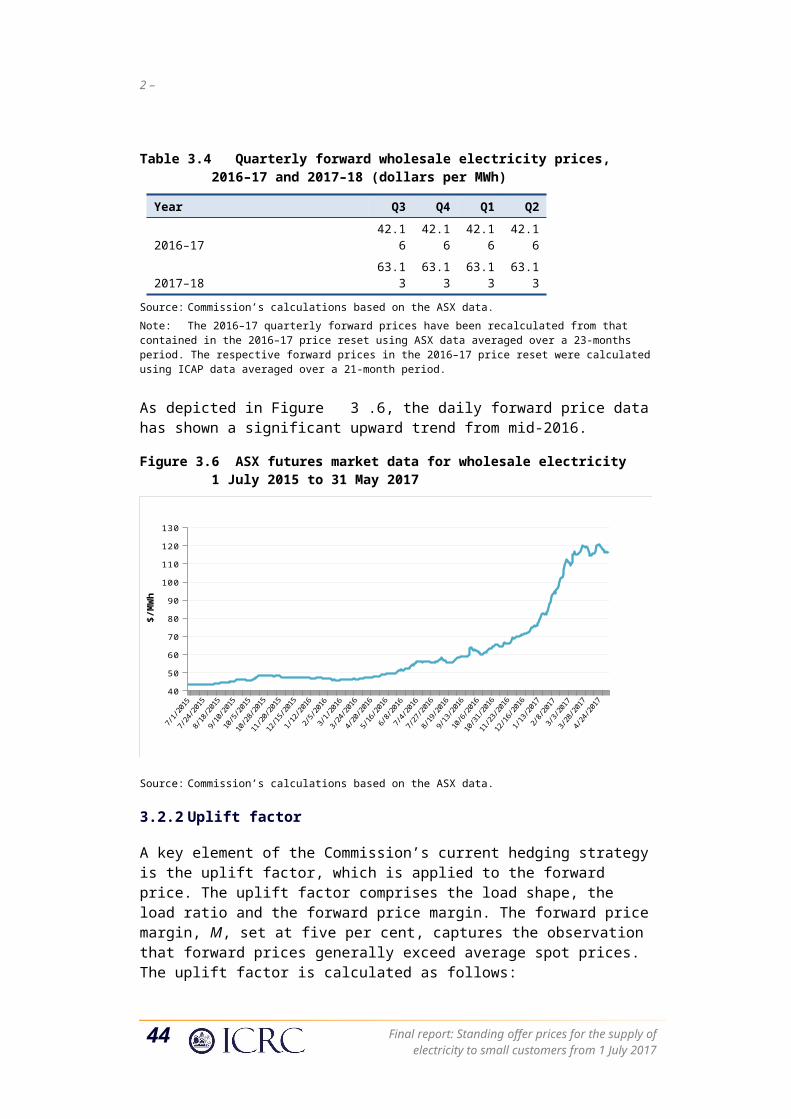
Figure 3.11 Components of the change in regulated retail electricity prices 2016–17 to 2017–18 57
Energy purchase cost
LRET and SRES costs
Energy losses
Energy contracting cost NEM fees
Retail operating costs EEIS costs
Network costs
Retail margin
2017-18 PRICE CHANGE
0.0%
2.0%
4.0%
6.0%
8.0%
10.0%
12.0%
14.0%
16.0%
18.0%
20.0%
13.26%
1.50% 2.01%
0.01% 0.01% 0.37% 0.41%
1.91%
0.29 %
18.95 %
Source: Commission’s calculations, noting that the contribution of EEIS costs to the total price change is negative.
Figure 3.12 shows the proportion of each cost component in total costs. An analysis of these cost components shows that most costs are substantially outside the control of the retailer and the Commission. These costs include:
the direct cost of purchasing electricity from the NEM (excluding the
implementation of hedging strategies);
the direct cost of complying with Commonwealth and Territory environmental
obligations;
direct costs associated with energy lost in transmission and distribution;
NEM fees payable to the AEMO for operating the wholesale market, and
charges for the carriage of electricity bought by its customers.
The main costs where the retailer may have some control relate to hedging and retail operating costs, and the costs allowed under the Commission’s benchmark regulatory approach. For example, the allowances provided under the hedging model and the mark-ups are provided to cover assumed holding costs for renewable energy certificates. The Commission notes that retail-operating costs only account for about seven per cent of the total costs and hedging costs are a small but necessary component of energy purchase costs. 57 This chart shows the separate effects of the positive or negative contribution of each of the components of the cost-index model to the total percentage change.
Final report: Standing offer prices for the supply of electricity to small customers from 1 July 2017 49
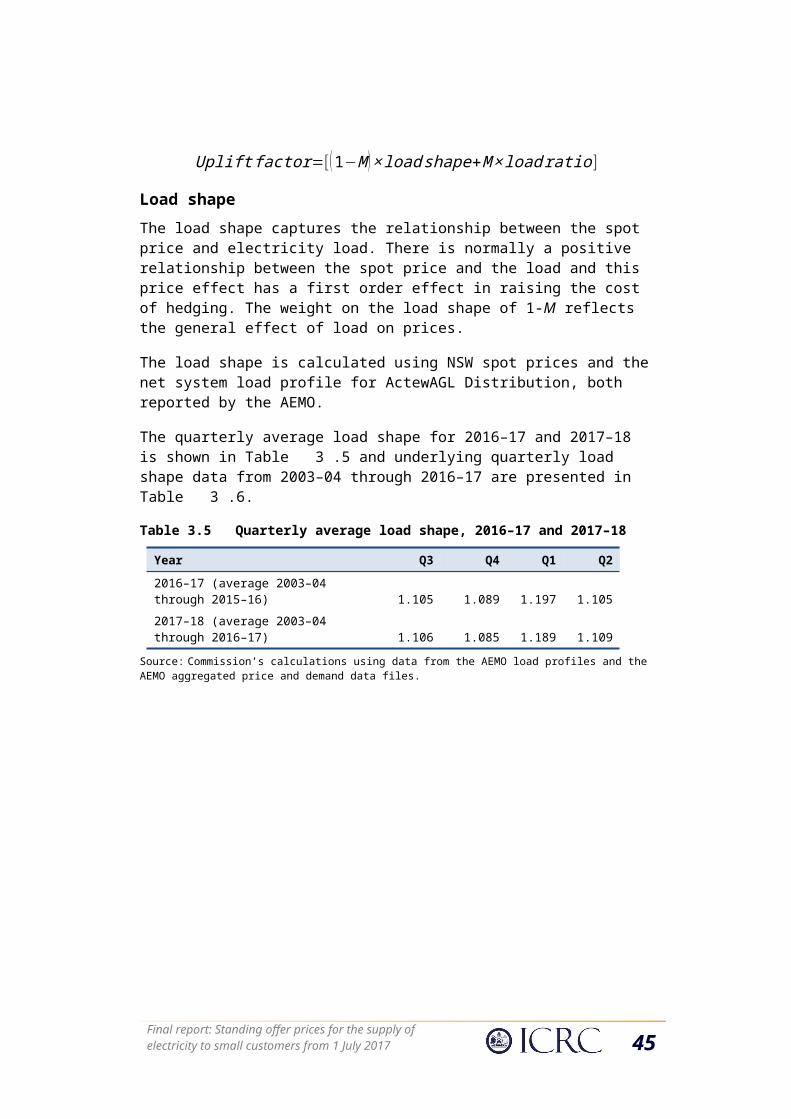
2 – Commission’s regulatory approach and pricing mode
Figure 3.12 Cost components in dollars per MWh as a share of total cost 2017–18
0
10
20
30
40
50
60
70
80
90
100
Retail operating costs (6.81%)
Retail margin (5.03%)
Energy Efficiency Scheme costs (1.86%)
Fit cost (8.89%)
Network costs - excluding FiT (32.59%)
NEM fees (0.40%)
Energy contracting cost (0.40%)
Energy losses (3.37%)
LRET and SRES costs (7.13%)
Wholesale energy purchase cost (33.51%)
Per c
ent
Allowed retail costs
Non-retail costs*
Source: Commission’s calculations. Note the retail margin amount of 5.03% is not the same as the overall margin set at 5.3%, as the former is a measured as a percentage of all components, including the retail margin. *Of the Non-retail costs, network and wholesale energy costs make up 75 per cent.
3.12 Impact on customers
Table 3.20 presents estimated electricity bills for a range of typical residential customers in 2017–18 as a result of the price increase of 18.95 per cent. A small customer may be representative of a single person living in an apartment, an average customer may be representative of a small family in a townhouse, and a large customer may be representative of a large family in a detached house. The annual impact on an average residential customer using 8,000kWh is an increase of $333 annually or $6.40 a week.
50 Final report: Standing offer prices for the supply of electricity to small customers from 1 July 2017
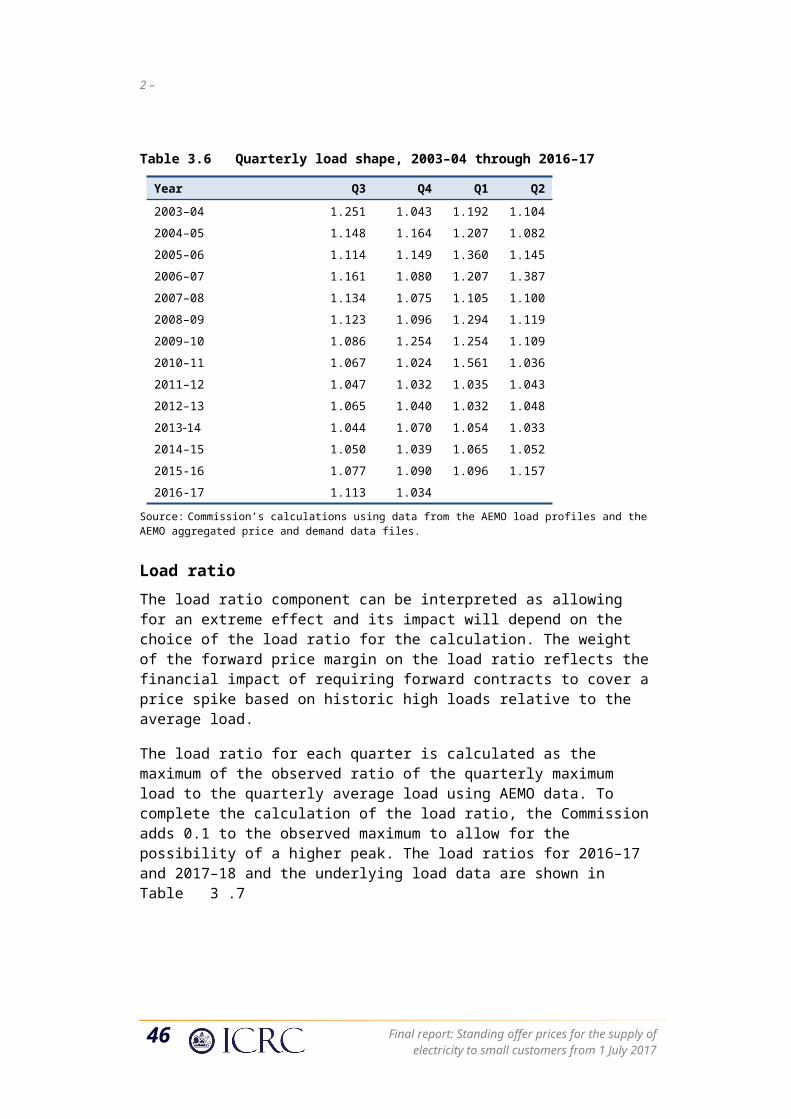
Table 3.20 Estimated annual bill changes for residential customers, 2016–17 and 2017–18
Customer consumption type
Annual usage (kWh)
Estimated annual bill 2016–17 ($)
Estimated annual bill 2017–18 ($) Change ($)
Large 12,000 2,488 2,959 471
Average 8,000 1,756 2,089 333
Small 4,000 1,025 1,219 194
Source: Commission’s calculations.
Table 3.21 presents estimates of annual electricity bills for a range of typical non-residential customers resulting from the electricity price increase of 18.95 per cent. The impact on a typical bill for an average non residential customer using 25,000kWh is $1,183 or $22.75 per week.
Table 3.21 Estimated annual bill changes for non-residential customers, 2016–17 and 2017–18
Customer consumption type
Annual usage (kWh)
Estimated annual bill 2016–17 ($)
Estimated annual bill 2017–18 ($) Change ($)
Large 40,000 9,732 11,576 1,844
Average 25,000 6,242 7,425 1,183
Small 10,000 2,752 3,274 522
Source: Commission’s calculations.
Final report: Standing offer prices for the supply of electricity to small customers from 1 July 2017 51
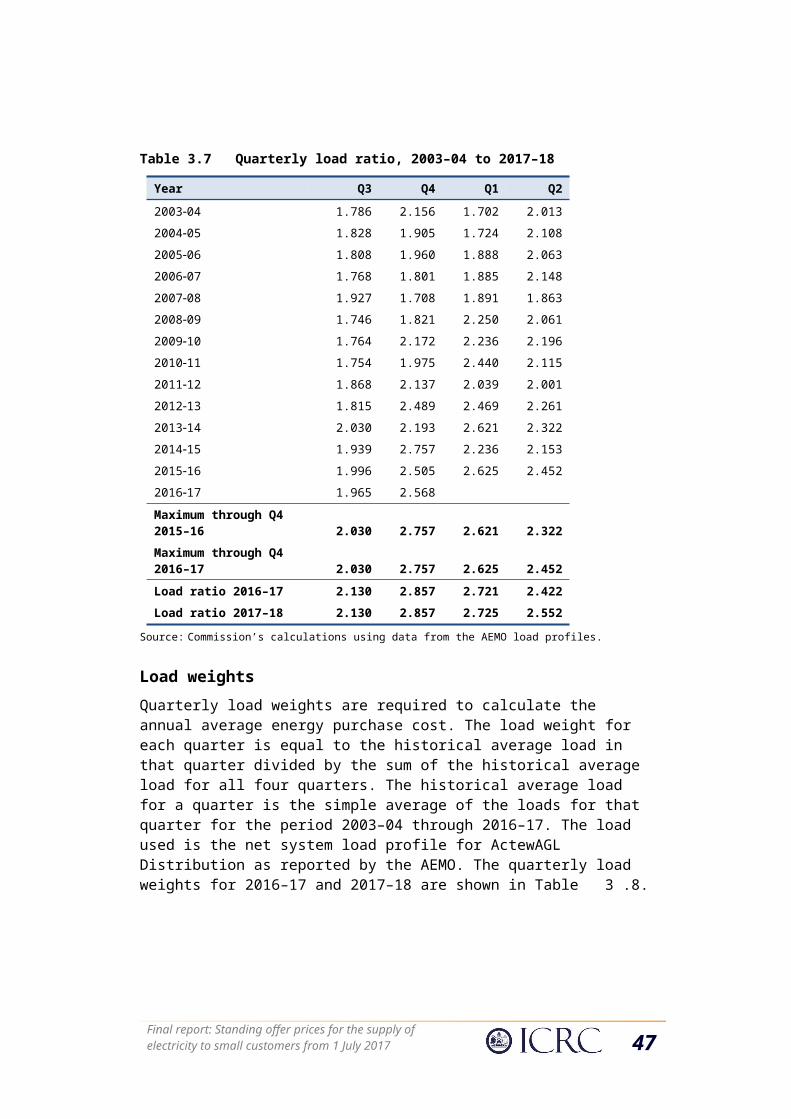
4 Annual recalibration and pass-through arrangements
This chapter describes the proposed procedure for setting regulated prices for 2018–19 and 2019–20 based on the Commission’s cost index model. It also sets out arrangements to pass-through the costs associated with regulatory and tax change events triggered during the regulatory period that are not recognised in the Commission’s cost index model.
4.1 Annual recalibration method
As discussed in Chapter 2, the Commission is undertaking two annual price recalibrations during the next regulatory period. The recalibration process will determine regulated prices for 2018–19 and 2019–20. This section sets out the details of the annual recalibration process, which is based on the Commission’s current annual adjustment process.
The Commission proposes the following process for each annual recalibration:
AAR will submit to the Commission on or before 10 May prior to the regulatory year in question the following information:
calculation of costs associated with achieving environmental objectives for the year in question, including calculation of LRET, SRES and ACT energy efficiency scheme costs, and any proposed adjustments; and
full accounting of all proposed pass-through costs.
AAR will submit to the Commission for verification the updated network costs for the regulated customer load as soon as they are approved by the AER:
The Commission will determine the energy purchase cost component based on data available to 31 May prior to the regulatory year in question and energy losses based on the AEMO data.
Based on this information, the Commission will determine the allowed percentage by which the weighted average price cap may adjust. The Commission will provide its direction to AAR by 7 June prior to the regulatory year in question. AAR will provide the Commission with its proposed schedule of regulated retail prices including the associated weighted average price cap calculations. The Commission will then, subject to an assessment that the proposals are consistent with the price direction, approve the proposed prices within two working days of receipt of the proposed schedule.
Table 4.22 shows the approach to calculating the individual cost components for the price recalibrations for each year that will determine the allowed percentage change. Approved pass-through amounts measured in dollars per MWh will be included as an additional component in the cost-index model as required. The Commission will inflate the dollar value of the pass-through amount into current dollars at the time of the recalibration using the Commission’s standard CPI adjustment formula.
Final report: Standing offer prices for the supply of electricity to small customers from 1 July 2017 53
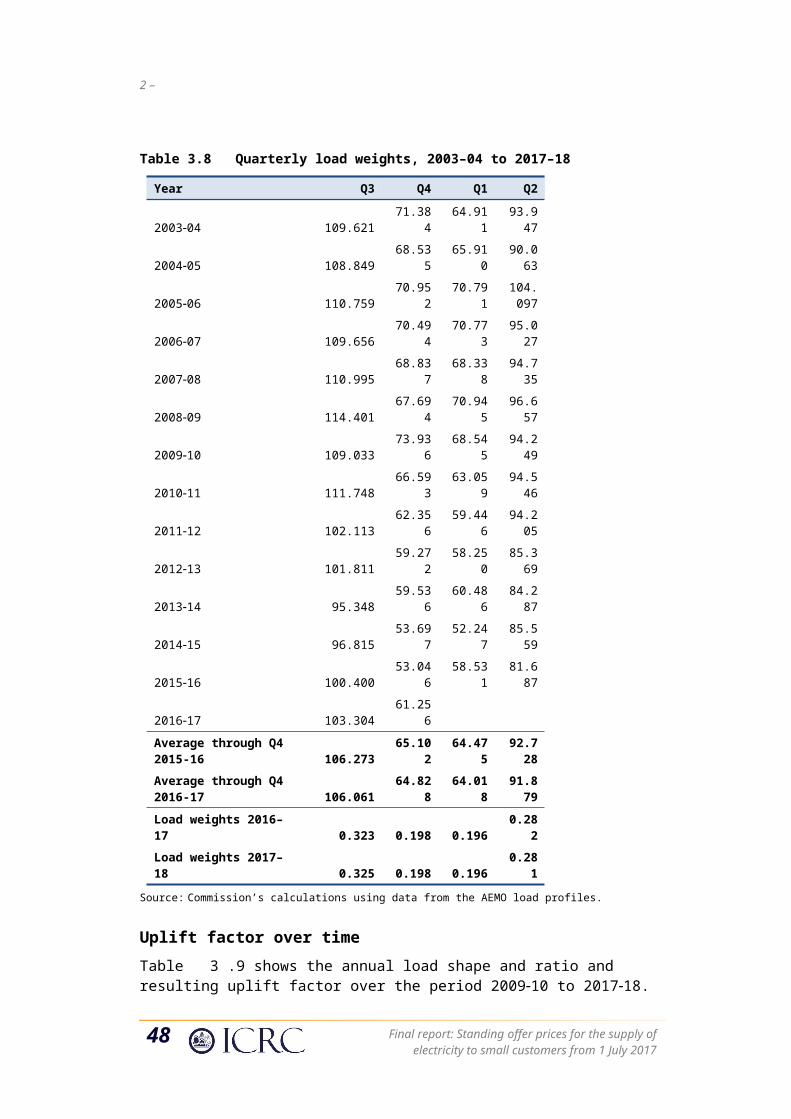
Error: Reference source not found
Table 4.22 Proposed annual recalibration of cost components
Component Method
Energy purchase cost ($/MWh) As determined by the Commission at the time of the recalibration using the energy purchase cost model.
LRET and SRES costs ($/MWh) Estimates from AAR for the 2018–19 and 2019–20 years respectively, which are verified and applied using the Commission’s methodology.
Energy Efficiency Improvement Scheme
Estimates from AAR for the 2018–19 and 2019–20 years as required, subject to a prudence and efficiency assessment, with costs determined using the Commission’s methodology.
Energy losses (%) Based on the AEMO’s estimates for 2018–19 and 2019–20 as appropriate.
Energy contracting costs ($/MWh) Previous year’s value adjusted by the change in CPI.
NEM fees ($/MWh) Previous year’s value adjusted by the change in CPI.
Retail operating costs ($/MWh) Adjust previous year’s value by the change in CPI, and convert this to a per MWh allowance based on customer numbers and energy usage at each annual price recalibration exercise.
Network costs ($/MWh) As determined and approved by the AER and applied by AAR to the standard retail contract customer load, and subsequently verified by the Commission.
Cost pass-through ($/MWh) Cost pass-through verified by the Commission in current dollars as adjusted by the change in CPI.
Retail margin (% ) –
The Commission proposes to use the weighted average price cap formula to control prices.
4.2 Pass-through arrangement details
As discussed in Chapter 2, the Commission is proposing to institute pass-through arrangements for the next regulatory period. The details of the proposed arrangements are set out below. It is important to note that costs passed-through can be positive or negative. A positive pass-through will increase regulated prices, while a negative pass-through will decrease regulated prices.
4.2.1 Regulatory change and tax change events
Event description
Regulatory change events
A regulatory change event is a decision made on or after 31 May 2017 and before 30 June 2020 by any ‘authority’ (any government or any minister, agency or department, instrumentality or other authority of government and the Commission, the AEMC, the AER or the AEMO) that has the effect of materially varying the nature, scope, standard or risk of providing services to regulated retail tariff customers, or the manner in which those services are provided. A regulatory change event includes obligations in respect of:
54 Final report: Standing offer prices for the supply of electricity to small customers from 1 July 2017
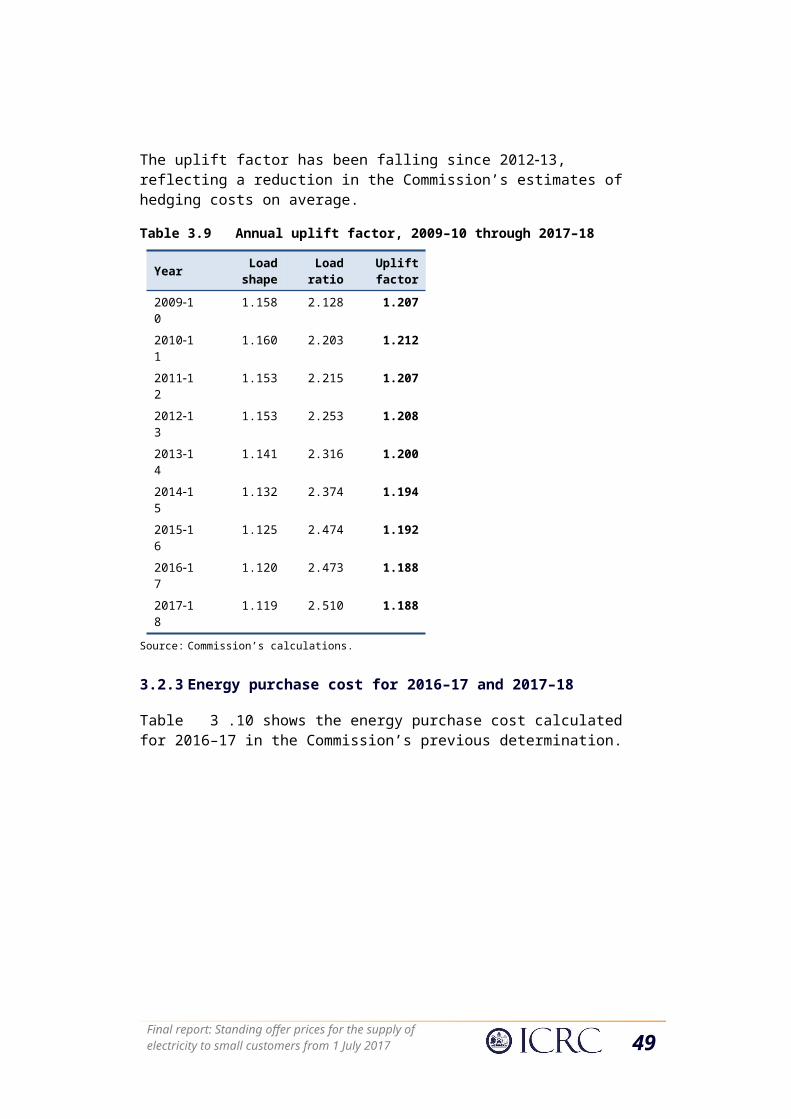
any customer hardship program;
retailer of last resort events;
prudent and efficient costs for relevant regulated services associated with Power of Choice compliance and which can be applied in the first year of the regulatory period; environmental schemes, including the LRET and SRES schemes and the EEIS; and
changes in distribution or transmission charges.
A regulatory change event does not include obligations in respect of:
any decision, determination or ruling in relation to energy loss factors.
Tax change events
A tax change event means the imposition of a relevant tax, the removal of a relevant tax, or a change in the way a relevant tax is interpreted or calculated. A relevant tax is any tax, levy, impost, deduction, charge, rate, duty or withholding tax that is levied on AAR by any authority (as defined above) and is payable by AAR, other than:
income tax and capital gains tax;
stamp duty;
AEMO fees;
fees payable by AAR in respect of its retail licence;
penalties, charges, fees and interest on late payments, or deficiencies in payments, relating to any tax; and
any tax that replaces or is equivalent or similar to any of the taxes referred to above (including any state-equivalent tax).
Initiation and timing of review and price adjustment
AAR and the Commission may initiate a regulatory change or tax change pass-through event review. AAR may make an application to the Commission and the Commission may initiate a pass-through review for a regulatory change or tax change event when the Commission is undertaking the annual price recalibration process for 2018–19 and 2019–20.
An exception is for prudent and efficient costs for relevant regulated services associated with Power of Choice compliance, which can be applied in the first year of the regulatory period;
Materiality threshold
As per the current provisions, possible pass-throughs can only occur as part of an annual reset process and annual recalibration of the cost-index model parameters does not have a materiality consideration. The Commission intends to maintain the current pass-through provisions for the next regulatory period.
Final report: Standing offer prices for the supply of electricity to small customers from 1 July 2017 55
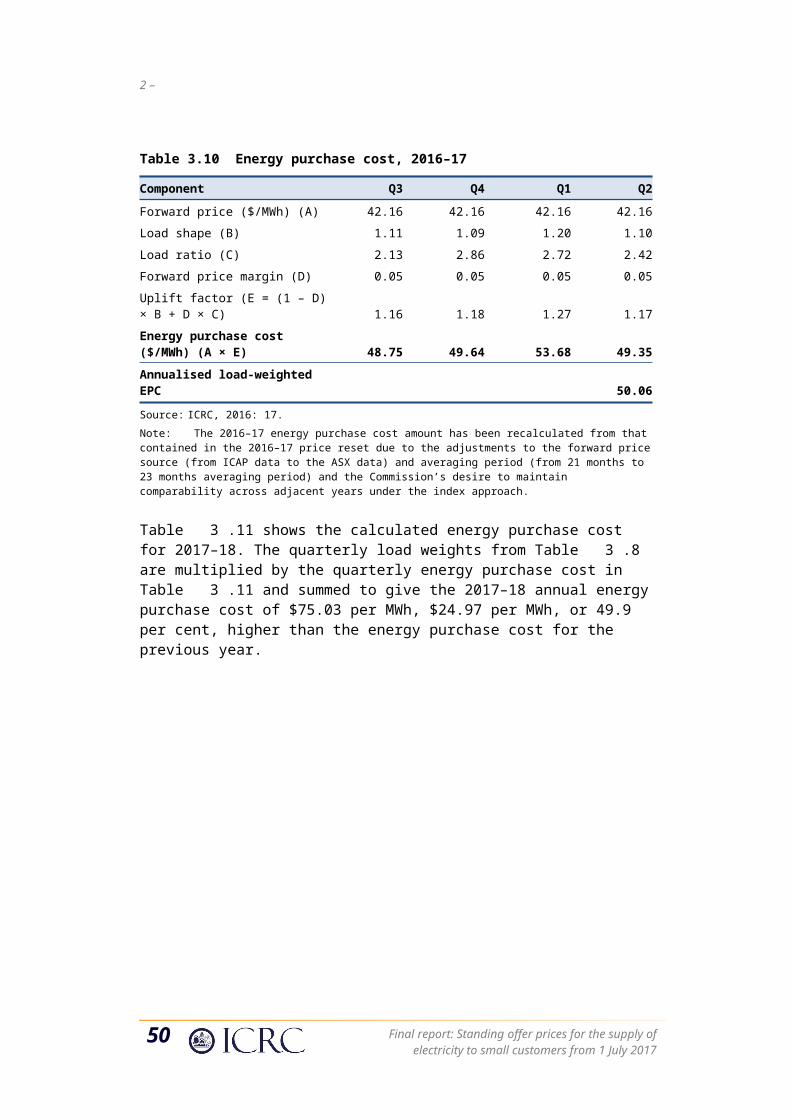
Error: Reference source not found
Calculating the pass-through amount
General matters
The Commission will calculate the pass-through amount when considering a pass-through event as part of an annual recalibration process, having regard to the following matters:
the implications for the efficient costs of AAR’s actions, including whether AAR has taken or omitted to take any action where such action or omission has increased the magnitude of the costs incurred;
the need to ensure that AAR does not recover costs to the extent that provisions have already been made or otherwise taken into account;
the need to ensure that AAR recovers only any actual or likely increment in efficient costs to the extent that such an actual or increment in efficient costs is solely a consequence of a pass-through event;
in the case of a regulatory change event, any costs that AAR has incurred prior to, but in preparation for, the occurrence of that regulatory change event; and
in the case of a tax change event, any change in the way another tax is calculated, or the removal or imposition of another tax which in the Commission’s opinion is complementary to the tax change event concerned.
In addition, in considering any pass-through event, the Commission may consult with affected stakeholders to the extent the Commission considers appropriate.
When determining the maximum average percentage change in regulated retail tariffs (Yt), for a regulatory or tax change pass-through event, the Commission will include the value of the pass-through event, which can be either negative or positive, in the cost-index model.
56 Final report: Standing offer prices for the supply of electricity to small customers from 1 July 2017
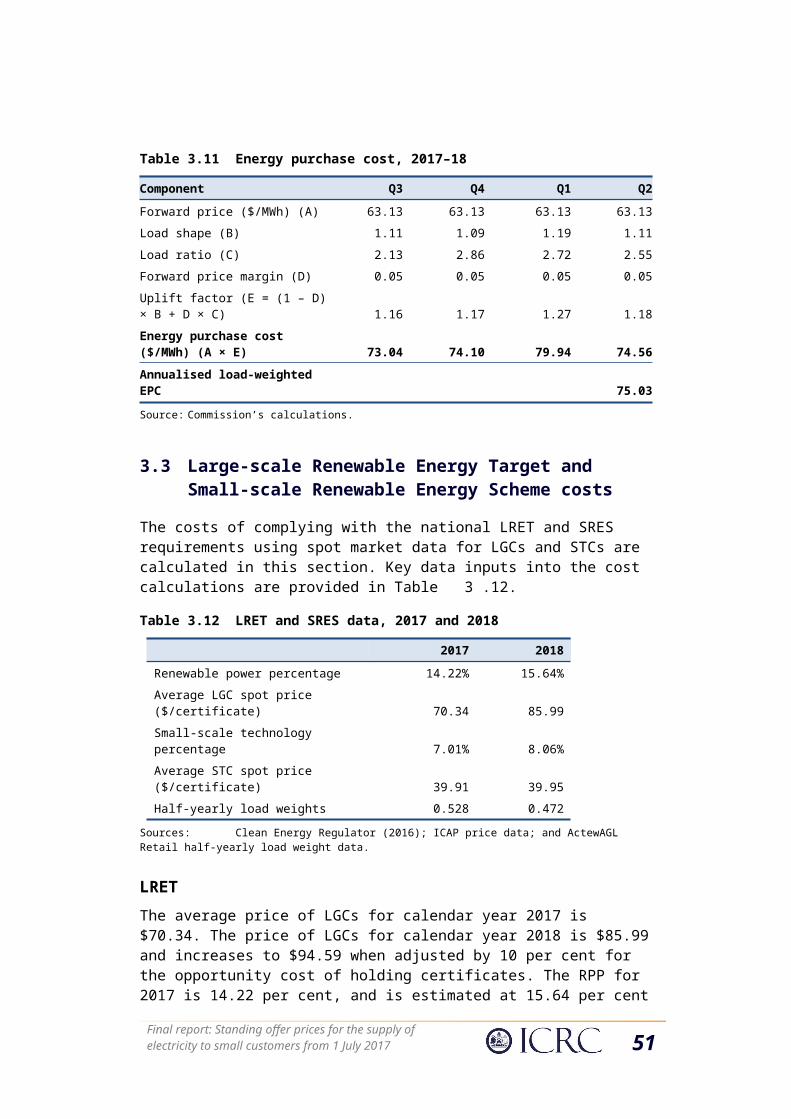
5 Model and methodology review
During the 2017–2020 regulatory period the Commission intends to re-evaluate the method by which it establishes a pricing model for the supply of electricity by AAR to customers on its regulated retail tariffs. Any changes to the model will be implemented in the regulatory period after 30 June 2020.
The Commission intends to conduct this review of its pricing model and methodology to ensure the method by which a price direction arrived at remains current, accurate and consistent with the Commission’s obligations under its Act. This review will ensure that model components are estimated using up-to-date data, and are estimated in the appropriate economic policy context.
As part of this review, the Commission’s overall pricing model, including but not limited to the following components, will be reviewed.
5.1 Cost benchmarking
The Commission’s pricing model determines the maximum average percentage change that AAR can apply to its suite of regulated tariffs on an annual basis. It does so by estimating the individual cost components that would be incurred by an efficient incumbent retailer in the same position as AAR when providing electricity supply services to customers on the regulated tariff.
The Commission’s current pricing model relies on cost benchmarks for three main cost categories:
wholesale electricity costs, which comprise energy purchase costs, LRET and SRES costs, energy losses, energy contracting costs and NEM fees;
network costs, which include transmission and distribution costs and the ACT’s renewable energy FiT schemes; and
retail costs, which comprise retail operating costs, EEIS compliance costs and retail margin.
These cost categories are estimated, then added together to produce total costs to be recovered in dollars per megawatt hour ($ per MWh). This cost is then used in conjunction with the total costs calculated for the previous year to produce a maximum allowable percentage change that AAR can apply under the weighted average price cap to its regulated retail tariffs for the first year of the next regulatory period.
Given the potential for changes in the economic policy environment 2017, the Commission intends to re-evaluate its benchmarking approach to the calculation of the maximum average percentage change that AAR can apply to its suite of regulated tariffs on an annual basis. Germane changes may include the ability of economic policy makers to implement advances in open data, economic simulation, machine-
Final report: Standing offer prices for the supply of electricity to small customers from 1 July 2017 57
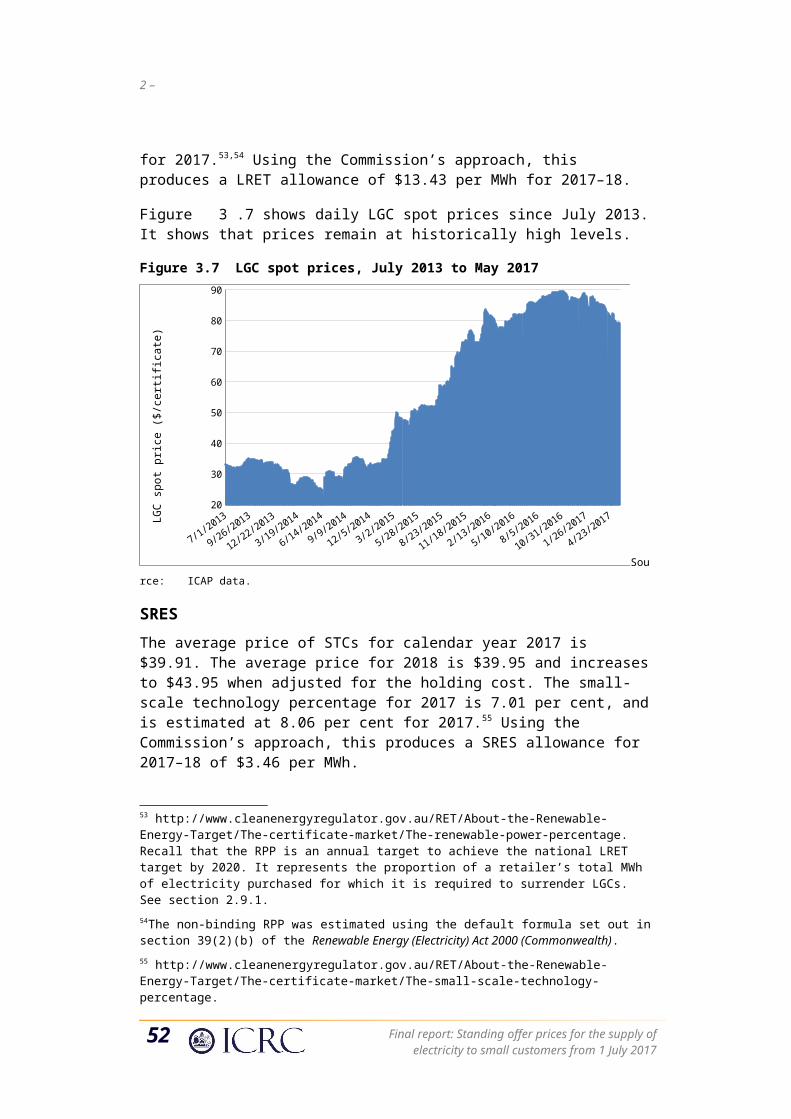
4– Annual recalibration and pass-through arrangements
learning estimation, unit-level international comparisons and evolving regulatory best-practice.
5.2 Energy purchase cost model
The Commission’s current energy purchase cost model incorporates a conservative hedging strategy. The Commission believes that its current hedging model continues to be the best approach available for estimating an allowed cost of hedging incurred by an efficient retailer. However, given 2016–17 observed price market volatility this appearance should be held to empiric account. The Commission therefore intends to re-evaluate the hedging strategy during the 2017–2020 regulatory period in time for any change to be included in regulatory periods after 30 June 2020.
With regards to the carbon cost component of the energy purchase cost model, the Commission intends to re-investigate the inclusion of an adjustment to the wholesale energy purchase cost in the model to account for the cost of carbon. An important consideration will be that if the current component is removed, the Commission’s model should be sufficiently flexible to facilitate alternatives should they be introduced.
The Commission will also revisit how the costs associated wholesale energy prices are addressed in the model, including the appropriateness of the current 23 month smoothing of wholesale electricity prices and the current benchmark approach to calculating the cost of wholesale electricity. Moreover, with the growth in the contribution of renewable electricity generation facilitated by the ACT’s feed-in tariffs, there is a perception that the FiT based contracts should provide a degree of self-hedging or wholesale price capping for ACT electricity consumers. Given that the Commission’s current model treats FiT costs as a separate cost component to the wholesale cost of electricity, the review will explore whether any change in the model is needed.
5.3 FiT, LRET and SRES Costs:
The Commission’s decision for 2017–20 is to maintain the current methodology for estimating LRET and SRES costs. This methodology applies a market-based approach for determining efficient LRET and SRES costs allowing for certificate holding costs and administrative operating costs associated with managing compliance with the scheme.
Given the potential for change in the economic and policy environment to have occurred during the previous regulatory period and that to occur during the next regulatory period from 2017, the Commission intends to revisit the allowance of certificate holding costs and LGC administrative operating costs for the incumbent retailer.
58 Final report: Standing offer prices for the supply of electricity to small customers from 1 July 2017
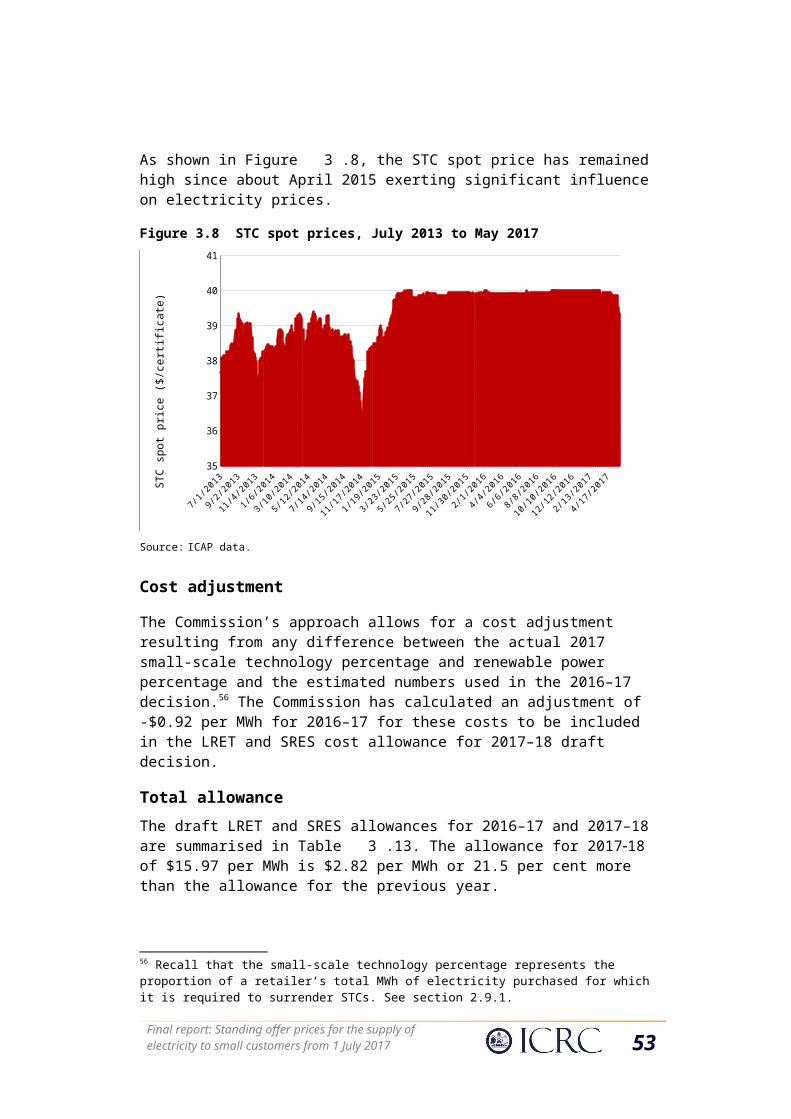
5.4 Energy contracting costs and NEM fees
The Commission estimated these cost components in 2003, and has adjusted them each year by the change in the CPI since then. Given the potential for change in the environment to have occurred since 2003, the Commission intends to re-evaluate the estimation of energy contracting costs and NEM fees of the incumbent retailer.
5.5 Retail operating costs
In 2003, the Commission estimated the retail operating costs allowance based on the cost estimates provided by AAR and benchmark observations of other regulatory decisions. As part of the Commission’s 2014 review, further adjustments were made to increase the per MWh allowance to match the IPART’s benchmark. Given that the Commission has not, since then, validated the retail operating cost allowance in the model based on recent cost estimates and cost benchmarks, it intends to re-evaluate the estimation of retail costs.
5.6 Retail margin
Consequently, the Commission has adjusted the margin to 5.3 per cent and set it as a percentage rather than a dollar per MWh amount. This decision is consistent with the Commission’s established regulatory decisions, takes into account submissions received from key stakeholders during the consultation process, and reflects established regulatory practice58.Given the potential for further changes in the economic environment from 2017 and the time that has elapsed since the retail electricity margin work of IPART was undertaken, the Commission intends to re-evaluate its approach to the calculation of the retail margin including the value of refreshing the work undertaken by IPART in 2013.
58 In particular, IPART (2013) noted that the best estimates of recommended ranges for the retail margin were between 5.3 per cent and 6.1 per cent, and “that any value chosen within this range is reasonable”: see IPART, 2013: 94.
Final report: Standing offer prices for the supply of electricity to small customers from 1 July 2017 59
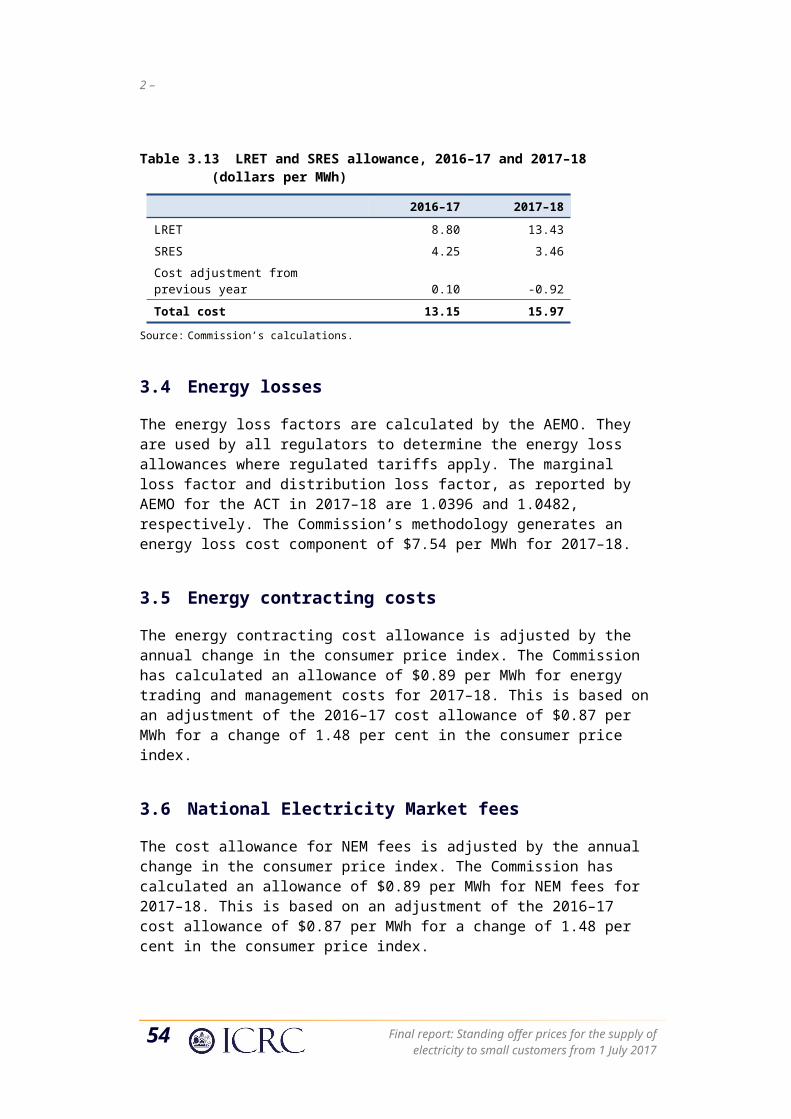
6 Compliance with the terms of reference and the ICRC Act
This chapter first sets out how the Commission’s investigation complies with the terms of reference. Second, it considers how the price direction will comply with the provisions of the ICRC Act, and particularly the requirements of section 20(2).
6.1 Compliance with the terms of reference
Table 6.23 Compliance with the terms of reference
Clause Requirement Chapter Comments2 The price direction will be for the period of
1 July 2017 to 30 June 2020.The Price direction must make provision for annual recalibrations to be undertaken by 30 June 2018 and 30 June 2019.
2, 4 The price direction applies for a three year period and provides for annual price recalibrations.
3.1a The Commission must consider the direct impact on electricity costs of government policies and pass through of costs and savings to regulated prices including but not limited to:
i The ACT retailer obligations under the Energy Efficiency Improvement Scheme.
2, 3 The prudent and efficient costs of the Act Government’s EEIS are included in the cost build-up.
ii the Commonwealth Government’s Large-scale Renewable Energy Target and Small-scale Renewable Energy Scheme
2, 3 LRET and SRES costs are included in the cost build-up.
iii any other schemes implemented to address climate change relevant to electricity pricing
N/A
3.1b The Commission must consider the efficient and prudent cost of managing risk in the cost of purchasing electricity for the period of the price direction.
2, 3 The energy purchase cost model incorporates a hedging strategy.
3.2 The Commission must identify and report on the efficient costs of complying with the Energy Efficiency (Cost of Living) Improvement Act 2012 for the period that the determination is being made.
2, 3 The costs of the ACT Government’s EEIS scheme are identified, assessed for prudence and efficiency and reported.
3.3 The Commission must identify and report on the cost allowance of the ACT FiTs (small and large scale) for the period that the determination is being made.
2, 3 The costs of the ACT FiTs are identified and reported.
3.4 The Commission must produce its final report within the period of 1 January 2017 to 7 June 2017, to provide sufficient time to allow AAR to make any necessary changes to its billing system and to provide information on the new tariff to customers for implementation effective 1 July 2017.
Final report released on 07 June 2017.
Final report: Standing offer prices for the supply of electricity to small customers from 1 July 2017 61
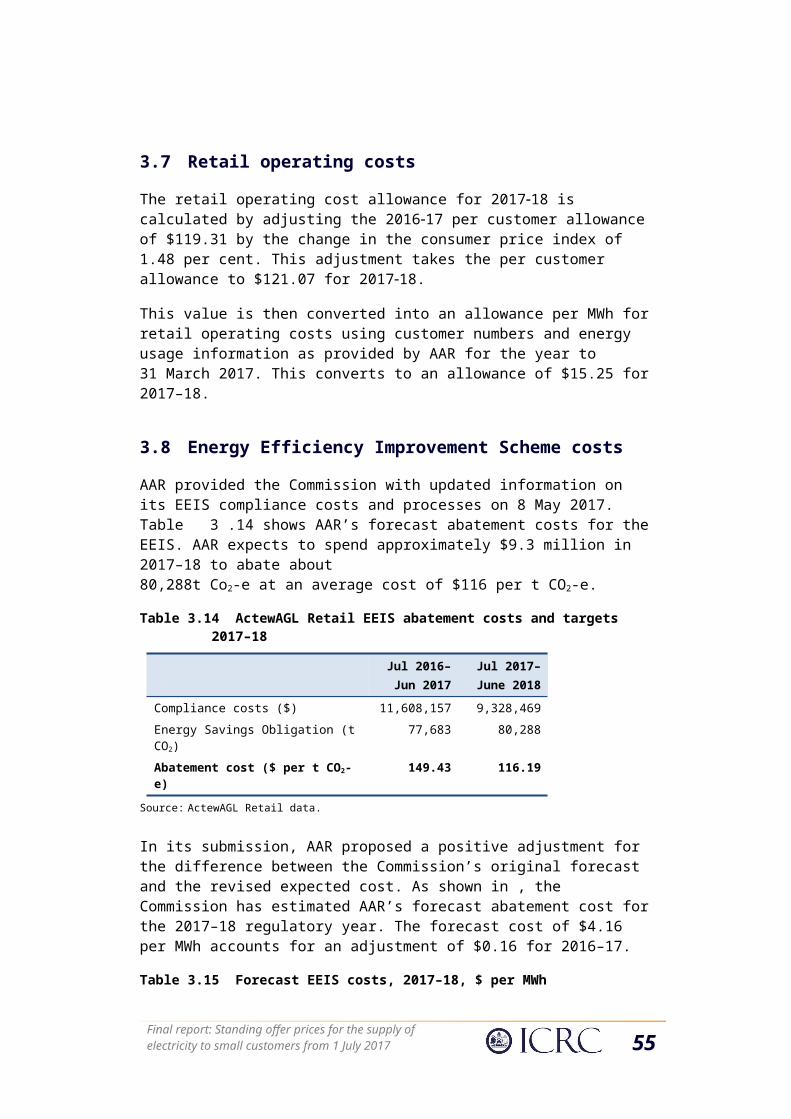
5– Model and methodology revieAnnual recalibration and pass-through arrangements
6.2 Compliance with the ICRC Act
6.2.1 Objectives
Table 6.24 Compliance with section 7 of the ICRC Act
Section 7 Requirement Chapter Comments
(a) to promote effective competition in the interests of consumers
3 The Commission considered whether a competition/CARC allowance should be included in the regulated retail electricity price in the ACT in order to promote competition. The Commission acknowledges that retailers incur costs relating to customer acquisition and management but maintains that it remains appropriate not to include an additional separate competition allowance because (1) the Commission, via its allowed retail operating cost structure, has recognised some costs relating to retail competition activities; and (2) it is not economically beneficial to introduce an additional allowance if it will set higher prices for consumers compared with a regulated monopoly situation.
(b) to facilitate an appropriate balance between efficiency and environmental and social considerations
2, 3, 4, The Commission’s retail electricity cost-index model is designed to recover the efficient costs of providing retail electricity services in the ACT. This includes the efficient costs of various environmental measures such as the national LRET and SRES schemes and the ACT energy efficiency schemes. Social considerations are taken into account first by ensuring that the regulated price is based on efficient costs. The Commission also considers the impacts of price changes on customer electricity bills.
(c) to ensure non-discriminatory access to monopoly and near monopolyinfrastructure
N/A
6.2.2 Section 19(L)
Table 6.25 Compliance with section 19(L) of the ICRC Act
Section 19L Requirement Chapter
Comments
The Objective of the Commission, when making a price direction in a regulated industry, is to promote the efficient investment in, and efficient operation and use of regulated services for the long term interests of consumers in relation to the price, quality, safety, reliability and security of the service.
2,3,4 The Commission’s retail electricity cost-index model is designed to recover the efficient costs of providing retail electricity services in the ACT. This includes the costs of meeting quality, reliability and safety standards. The long-term interests of consumers are taken into account by ensuring that the regulated price is based on efficient costs to meet the required standards. The Commission also considers the impacts of proposed price changes on customer electricity bills. The Commission’s model also includes the efficient costs of various environmental measures.
6.2.3 Section 20(2)
Table 6.26 Compliance with section 20(2) of the ICRC Act
Section 20(2) Requirement Chapter Comments(a) The protection of consumers
from abuses of monopoly 2, 3 The Commission applies a weighted average price cap
form of control to AAR’s suite of regulated retail
62 Final report: Standing offer prices for the supply of electricity to small customers from 1 July 2017
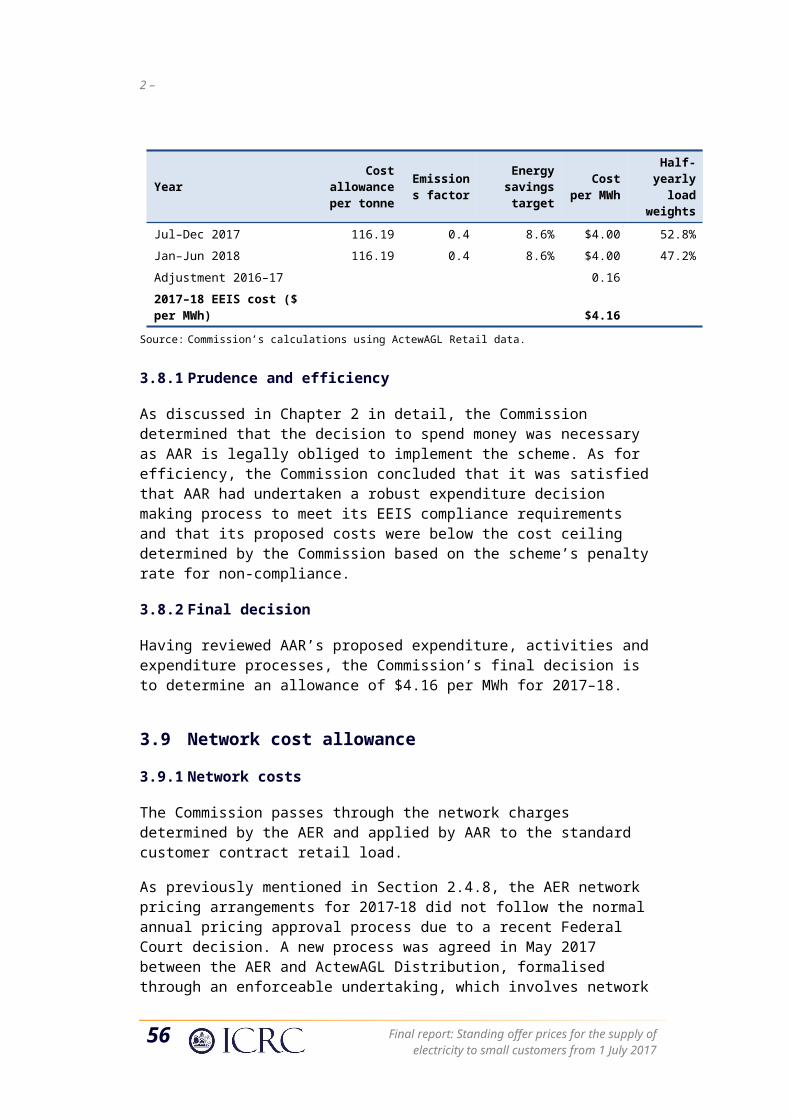
Section 20(2) Requirement Chapter Commentspower in terms of prices, pricing policies (including policies relating to the level or structure of prices for services) and standard of regulated services
electricity tariffs. The price cap is based on the recovery of efficient costs. Together these actions protect consumers from the abuses of monopoly power in terms of prices.
(b) Standards of quality, reliability and safety of the regulated services
2,3 The Commission’s retail electricity cost-index model, and in particular the retail operating cost component, is designed to cover the efficient costs of providing retail electricity services. This includes the costs of meeting quality, reliability and safety standards. As a specific example, the payment of ancillary services fees, which is captured in the cost-index model, assists the AEMO in providing for safe and reliable delivery of electricity to all consumers.
(c) The need for greater efficiency in the provision of regulated services to reduce costs to consumers and taxpayers
2,3 The Commission’s retail electricity cost-index model is based on the efficient costs of providing retail electricity services in the ACT. As an example, to determine the energy purchase cost allowance, the Commission has adopted an approach based on independent and verifiable market data and a range of assumptions based on industry standards to provide a reasonable estimate of the cost of purchasing wholesale energy from a competitive market pool.
(d) An appropriate rate of return on any investment in the regulated industry
2, 3, The Commission sets the retail margin at 5.3 per cent of the total efficient cost of providing retail electricity services. The Commission is confident that this provides in the current circumstances an appropriate rate of return on investment in the retail electricity industry.
(e) The cost of providing the regulated services
2, 3 The Commission’s retail electricity cost-index model is designed to recover the efficient costs of providing retail electricity services in the ACT.The Commission considers that the allowance granted for retail operating costs represents a reasonable balance between the need to allow cost recovery and the need to require the incumbent to operate efficiently.
(f) The principles of ecologically sustainable development
2, 3 The Commission’s retail electricity cost-index model includes the efficient costs of various environmental measures such as the national LRET and SRES schemes and the ACT energy efficiency schemes. These costs reflect to some extent the environmental costs incurred in the consumption of electricity that the Australian Government and the ACT Government consider should be passed through to consumers.
(g) The social impacts of the decision
2,3 Social considerations are taken into account first by ensuring that the regulated price is based on efficient costs. The Commission also considers the impacts of proposed price changes on customer electricity bills. In addition, the Commission has had regard to the social impacts of its decisions by not including a competition/CARC allowance.
(h) Considerations of demand management and least-cost planning
2, 3 The ACT Government’s energy efficiency scheme has a demand-management element. The costs of this scheme are accounted for in the cost-index model.
(i) The borrowing, capital and cash flow requirements of people providing regulated services and the need to renew or increase relevant assets in the regulated
2, 3 The Commission’s retail electricity pricing provides for the efficient costs of providing retail electricity services in the ACT. This includes a retail margin of 5.3 per cent of the total efficient cost. The Commission is confident that this provides sufficient room to meet the borrowing, capital and cash flow requirements and meet the retail
Final report: Standing offer prices for the supply of electricity to small customers from 1 July 2017 63
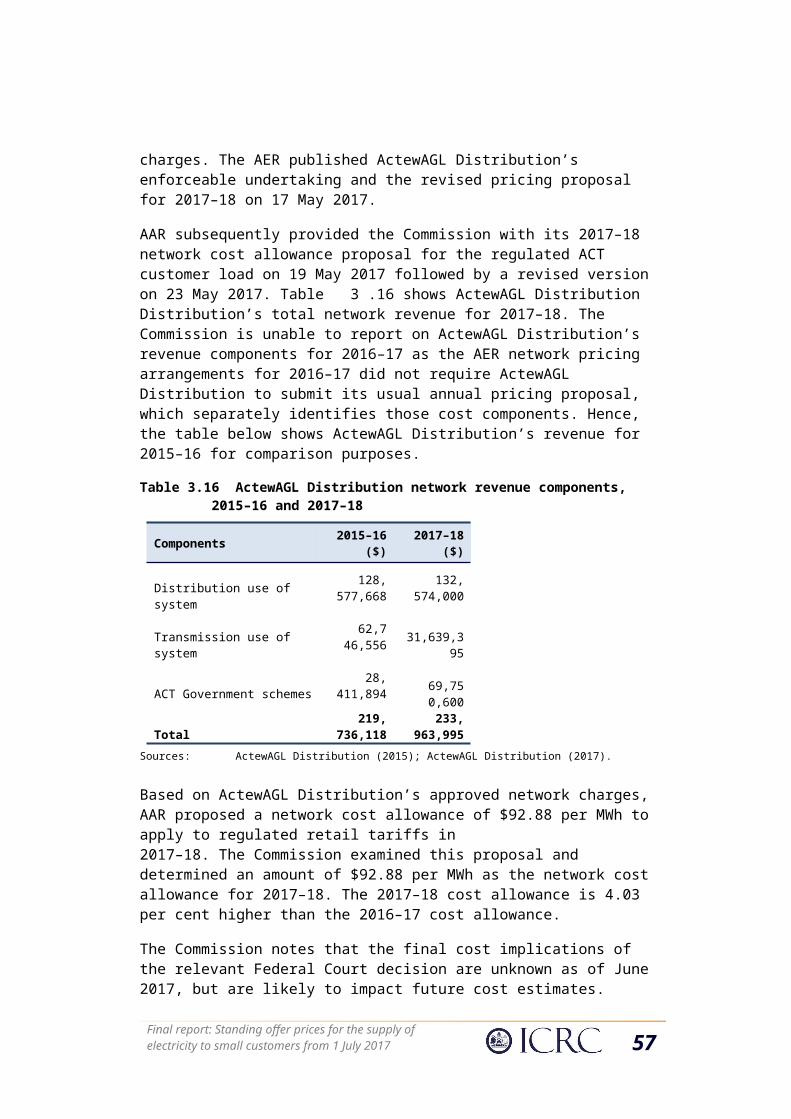
5– Model and methodology revieAnnual recalibration and pass-through arrangements
Section 20(2) Requirement Chapter Commentsindustry industry investment requirements.
(j) The effect on general price inflation over the medium term
2, 3 The Commission ensures that only efficient costs are applied in the cost-index model. A number of components of the model are adjusted each year by the change in the consumer price index.
(k) Any arrangements that a person providing regulated services has entered into for the exercise of its functions by some other person
2, 3 The recovery of energy losses in the cost-index model is mandated in the NEM framework and therefore meets the 20(2)(k) requirement.
64 Final report: Standing offer prices for the supply of electricity to small customers from 1 July 2017
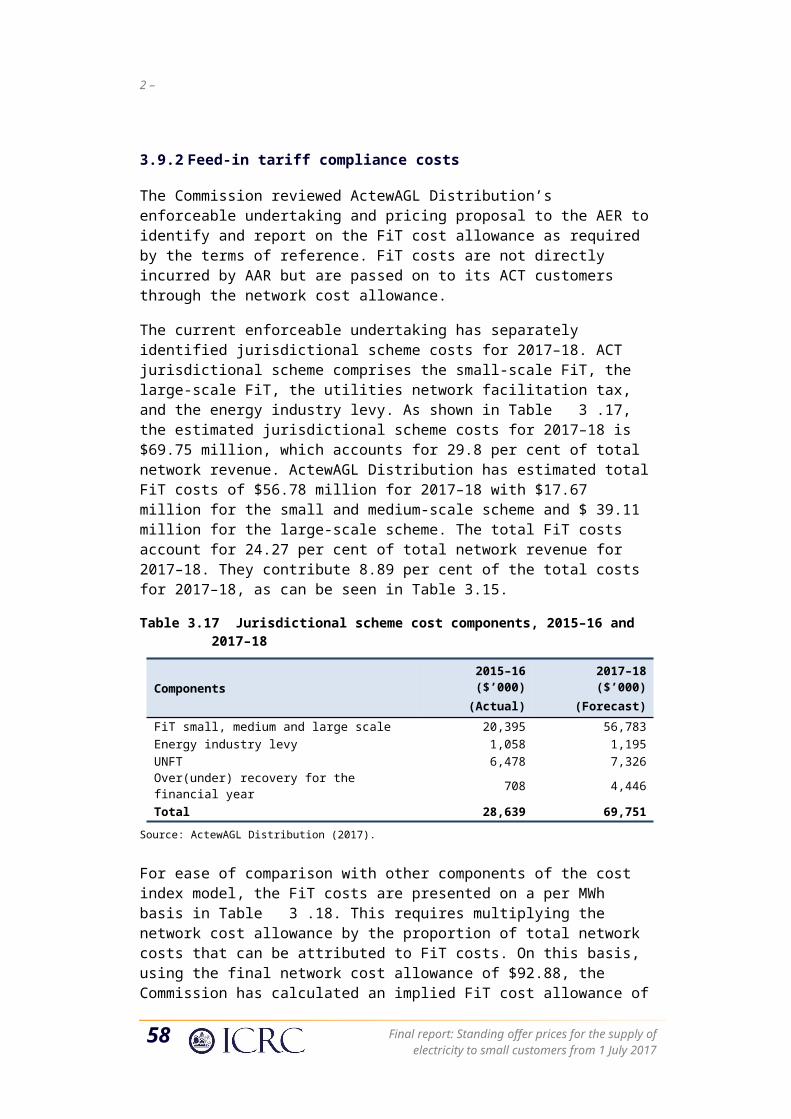
Appendix 1 Terms of referenceAustralian Capital Territory
Independent Competition and Regulatory Commission (Price Direction for the Supply of Electricity to Small Customers on Standard Retail Contracts) Terms of Reference Determination 2016Disallowable instrument DI2016–138
made under the
Independent Competition and Regulatory Commission Act 1997 (‘the Act’), Section 15 (Nature of industry references) and Section 16 (Terms of industry references).
1. Interpretation
In this instrument:
“National Energy Retail Law (ACT)” has the same meaning as in the National Energy Retail Law (ACT) Act 2012.
“small customer” has the same meaning as in the National Energy Retail Law (ACT).
“standing offer prices” has the same meaning as in the National Energy Retail Law (ACT).
“ActewAGL Retail” means the partnership of Icon Retail Investments Limited (ACN 074 371 207) and AGL ACT Retail Investments Pty Ltd (ACN 093 631 586).
2. Reference for investigation under Section 15
Under section 15(1) of the Act, I provide a reference to the Independent Competition and Regulatory Commission (the ‘Commission’) to determine a price direction for the standing offer prices for the supply of electricity to small customers who consume less than 100MWh of electricity over any period of 12 consecutive months.
The price direction will be for the period of 1 July 2017 to 30 June 2020.
The price direction must make provision for annual recalibrations to be undertaken by 30 June 2018 and 30 June 2019.
Under section 15(4) of the Act, the price direction determined by the Commission under this reference is to only apply to the electricity retailer ActewAGL Retail.
Final report: Standing offer prices for the supply of electricity to small customers from 1 July 2017 65
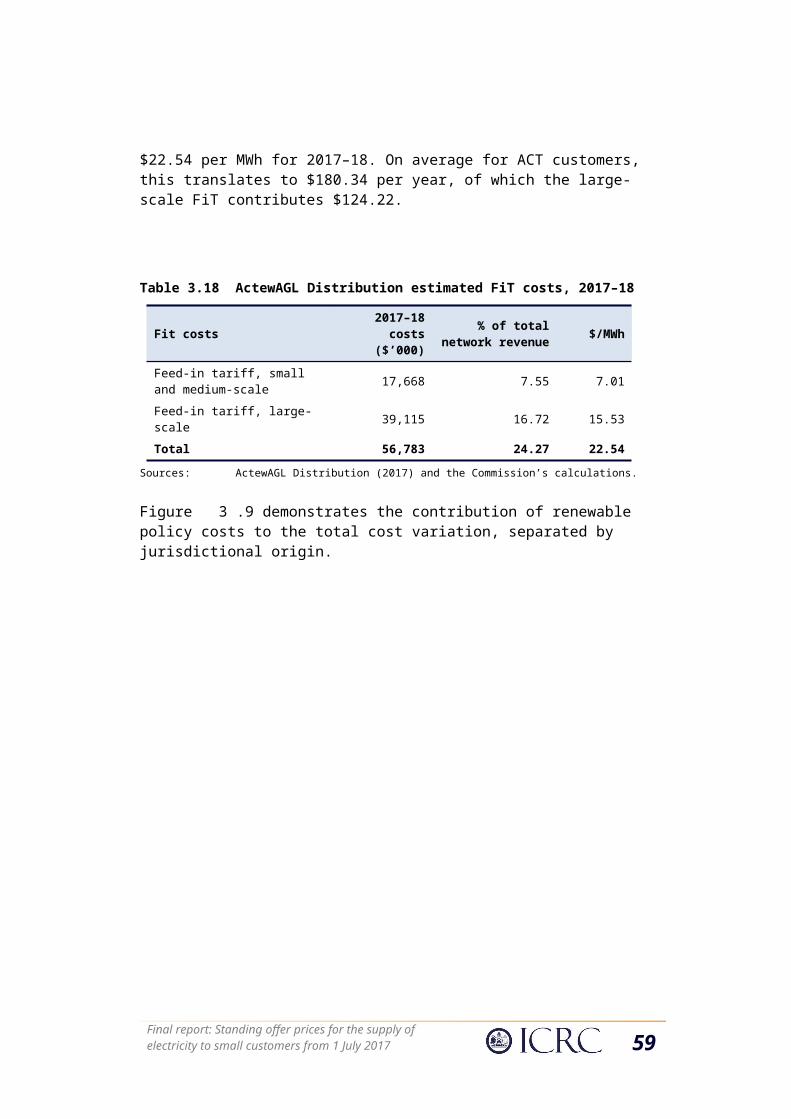
6 – Compliance with the terms of reference and the ICRC Act
3. Terms of reference for investigation under section 16Under section 16(1) of the Act, I require that the Commission consider the following matters in relation to the conduct of the investigation:
1. The Commission must consider:
a. The direct impact on electricity costs of government policies and pass through of costs and savings to regulated prices including, but not restricted to:
i. the ACT retailer obligations under the Energy Efficiency Improvement Scheme;
ii. the Commonwealth Government’s Large-scale Renewable Energy Target and Small-scale Renewable Energy Scheme; and
iii. any other schemes implemented to address climate change relevant to electricity pricing.
b. The efficient and prudent cost of managing risk in the cost of purchasing electricity for the period of the price direction.
2. The Commission must identify and report on the efficient costs of complying with the Energy Efficiency (Cost of Living) Improvement Act 2012 for the period that the determination is being made.
3. The Commission must identify and report on the cost allowance of the ACT Feed-in Tariffs (small and large scale) for the period that the determination is being made.
4. The Commission must release its final report within the period of 1 January 2017 to 7 June 2017, to provide sufficient time to allow ActewAGL Retail to make any necessary changes to its billing system and to provide information on the new tariff to customers for implementation effective 1 July 2017.
Andrew Barr MLA
Treasurer
22 June 2016
66 Final report: Standing offer prices for the supply of electricity to small customers from 1 July 2017
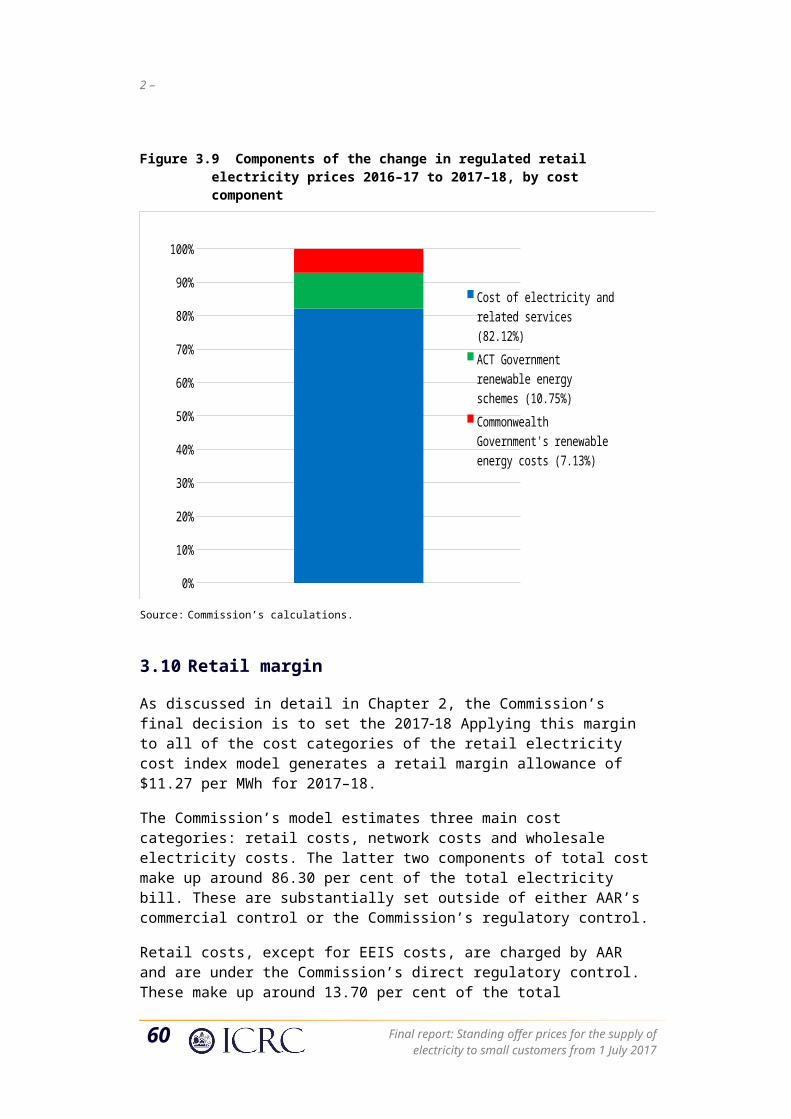
Appendix 2 Submissions
A2.1 Submissions on the issues paper
Date received Submitter Key issues raised/information provided
1 30 November 2016 AGL Energy Limited
Noted that the way retail price regulation is implemented in the ACT is one of the key barriers to entry.Argued that lower retail participation in the ACT compared to other jurisdictions and the high market share of ActewAGL are strong indicators that the regulated price cap has been set too low.Contended that the ICRC has misconstrued the purposes of both the CARC and headroom allowances, and argued they are not linked to start-up costs but are a fundamental component of a competitive electricity market. Argued that regulated prices should be set at levels that promote competition and be sufficiently high to provide an incentive for new retailers to develop offers that will encourage consumers to switch. Argued that if the Commission does not intend to include a CARC or headroom allowance, the retail operating cost should reflect the fact that fixed costs would have to be recovered over a smaller base compared with the top three retailers which the cost benchmark is based upon.
2 30 November 2016 ActewAGL Retail Limited
Supported the weighted average price cap.Recommended that the annual adjustment mechanism should be calculated as an X-factor that is applied to the average weighted price cap formula. Requested amendments to the cost pass-through provisions in the price direction and identified a potential cost pass-through application for the Power of Choice regulatory reforms to recover additional costs that arise within the regulatory control period 2017–20. Argued that the Power of Choice reforms are clearly regulatory changes and the circumstances where customers can opt of small meters are narrow. Noted that the necessary policy directions have already been in place for the Commission to consider including the costs of installing and supporting smart meters in regulated retail prices. Supported the Commission’s decision to return to using exchange traded ASX forward price data averaging over a 23-month period. Noted that the Commission’s current model is able to capture the significant rise in the forward price for wholesale electricity in 2016–17. Submitted that the Commission’s current approach to calculating hedging costs underestimates the efficient costs incurred by retailers. Argued that the Commission’s hedging costs model is based on a simple swap only hedge approach and that retailers in practice use more complex hedging structures such as a combination of base swaps, peak swaps and caps. Argued that competition continues to increase in the ACT retail electricity market and therefore retail price regulation is no longer warranted. Urged the Commission to include a commercially based benchmark allowance for CARC in its pricing determination for the forthcoming regulatory period.Stated that the EEIS costs can be assessed for prudence in terms of the abatement mechanism chosen by AAR to satisfy the schemes legislative requirements. Stated that future EEIS activities will focus more on encouraging energy efficient appliance replacements.
Final report: Standing offer prices for the supply of electricity to small customers from 1 July 2017 67
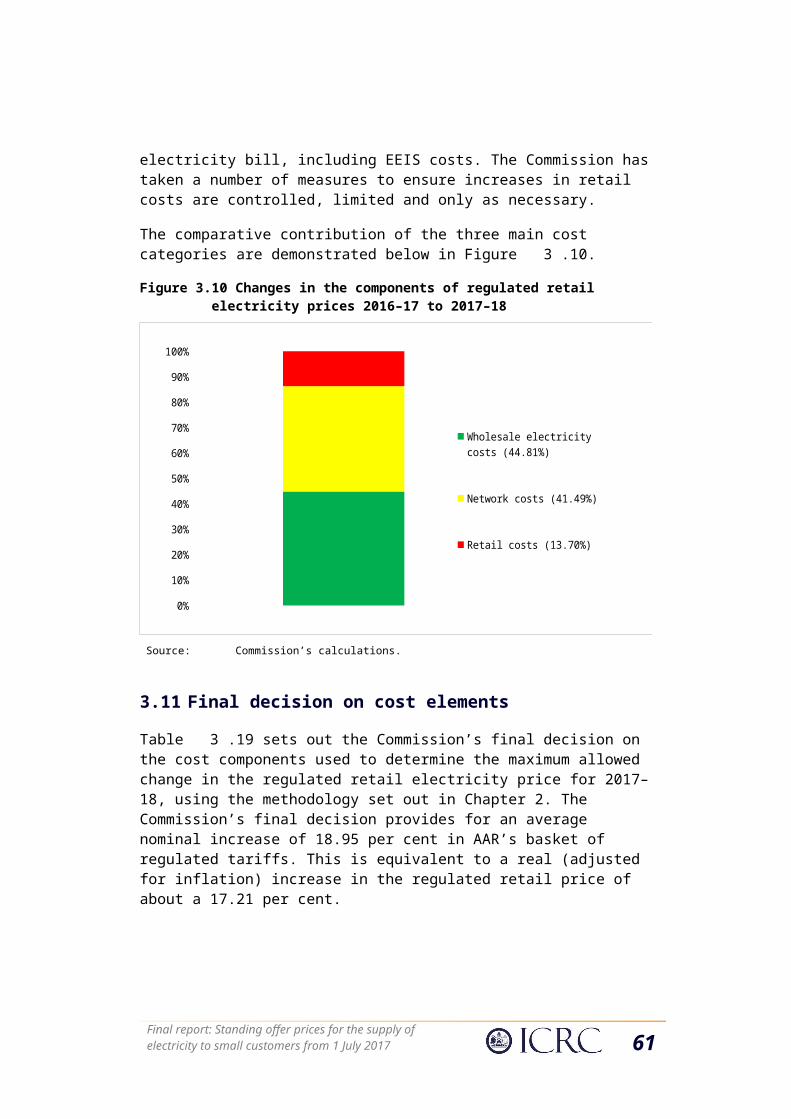
Appendix 1–Terms of reference
Date received Submitter Key issues raised/information provided
Argued that transitioning to appliance-based EEIS activities will affect adoption levels by low-income households and require additional incentives to increase participation. This will increase the total cost of delivering EEIS obligations.Supported the Commission’s proposal to continue to directly pass through network costs into retail prices.Supported the Commission’s market-based approach to determining efficient costs for the LRET and SRES.Supported the Commission’s methodology for calculating energy losses component based on the AEMO data.Considered the CPI adjustment applied by the Commission to energy contracting costs to be appropriate.Considered the benchmark retail margin of 6.04 per cent appropriate.Suggested that the carbon cost component be removed from the pricing model.
3 30 November 2016 Origin Energy Limited
Supported the adoption of a weighted average price cap (WAPC) ahead of setting actual tariffs or capping revenues.Supported a term of determination of three years with annual reviews of wholesale costs, including the SRES and LRET components of the energy cost. Strongly supported a mechanism that allows retailers to pass-through any unforeseen and uncertain costs imposts that cannot be determined at the time of setting retail prices.Suggested that the Commission review the merits of utilising a trade-weighted average instead of a simple average to reflect energy purchase trades that occur in the market. Noted that competition in the ACT is not as effective as in other jurisdictions and submitted this is due to the risk that electricity tariffs will not reflect a retailer’s actual cost of supply.Did not support the Commission’s proposal to exclude CARC from its calculation of retail costs. Stated it would support the Commission including an additional headroom allowance of five per cent.Supports a retail margin of a least 5.7 per cent.
4 30 November 2016 Australian Energy Council
Submitted that standing offer prices should be set at a level that reflects the true costs of operating in the market to allow retailers to compete. Did not support the Commission’s current pricing model for the retail operating costs component, as it does not incorporate any allowance to reflect CARC.
5 14 December 2016 The ACT Minister for Climate Change and Sustainability
Stated that the ACT Government supports the further uptake of energy efficiency measures in households and small businesses. Noted that as complying with the Energy Efficiency (Cost of living) Improvement Act 2012 (EEIS) is a mandatory obligation, it is critical that energy efficiency activities delivered under the scheme are cost effective.Suggested that the Commission’s methodology for assessing EEIS should include further scrutiny of the abatement costs to ensure the scheme is being delivered competitively and at the least cost to ACT energy consumers.Did not support the inclusion of a competition allowance.Supported the Commission’s view that Advanced Meter costs should be recovered from customers via contractual
68 Final report: Standing offer prices for the supply of electricity to small customers from 1 July 2017
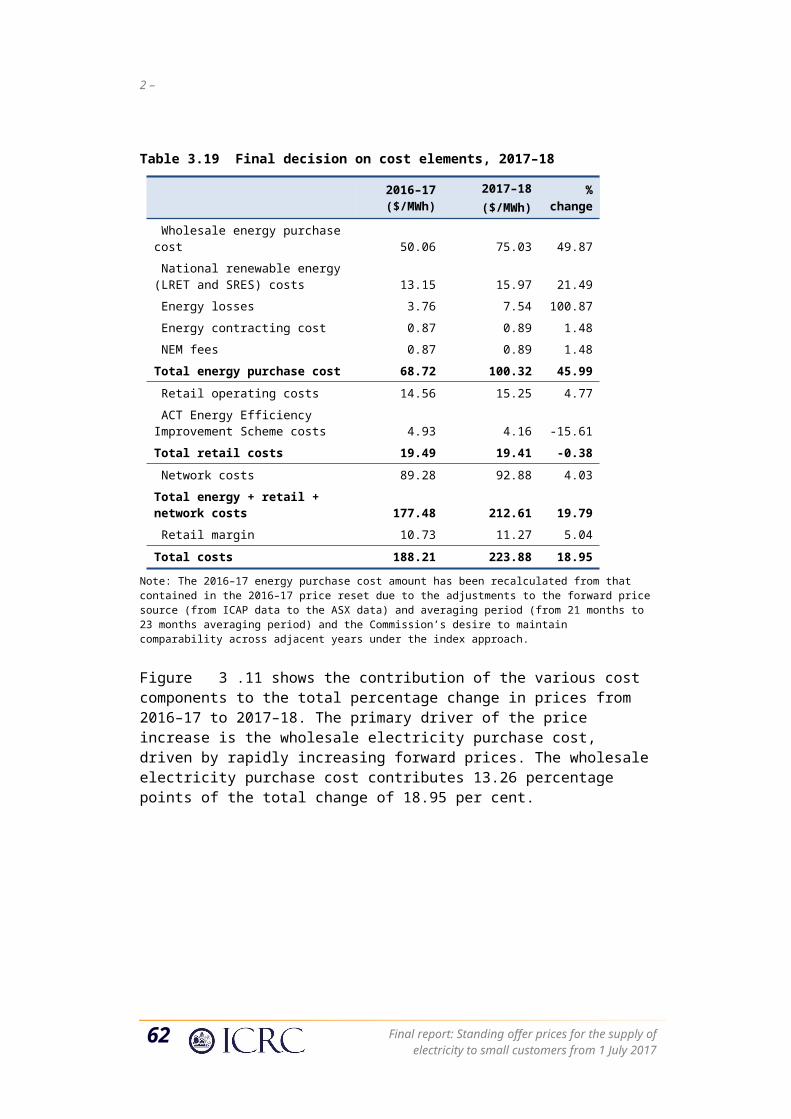
Date received Submitter Key issues raised/information provided
arrangements, rather than regulated tariffs.
6 14 December 2016 ACT Civil and Administrative Tribunal
Recommended that the Commission consider and prioritise the impact of its decisions on the most vulnerable members of the ACT community.Observed that the overarching objective of the new Section 19L in the ICRC Act is similar to those in the National Energy Law in that the long term interests of consumers are the paramount consideration.Supported a weighted average price cap form of regulation.Supported annual recalibrations updating the parameters of the retail cost index, but not affecting the determined methodology.Supported appropriate cost pass-through arrangements.Supported the Commission’s decision that the carbon cost be retained and initially set to zero.Cautions the Commission on the reliance of raw customer data on complaints published by the AER as they do not include hardship complaints. If these were included, the number of complaints in the ACT would be similar to other jurisdictions, but with a higher proportion of credit complaints than elsewhere.Supported that the costs of introducing smart meters should not be included in the standard regulated tariff. Noted that network costs are currently uncertain because of litigation in the Australian Competition Tribunal. This may led to price shocks and asks the Commission to smooth these possible shocks. Stated that it strongly opposes a ‘headroom’ allowance. Submitted that there is little customer churn and relatively low costs in acquiring and retaining customers in recent years. Noted that there is a highly competitive market in the ACT for large electricity customers.Observed that many of the discount market contract offers in the ACT market currently are based on a ‘pay on time’ condition which effectively excludes low-income customers who pay via CPay or other bill smoothing mechanisms.
A2.2 Submissions on the draft report
Date received Submitter Key issues raised/information provided
1 27 April 2017 ACT Energy Policy Consortium
Supported the Commission’s decision to restrict any increase in the retail margin to a CPI increase.Supported the Commission’s decision to refuse to introduce a headroom (competition) allowance.Supported the Commission’s decision to not amend the current pass-through provisions to include costs associated with Power of Choice reforms.Noted that the Commission and the AER should consider keeping a watch on the Power of Choice reforms to ensure customer interests are protected. Supported the retention of a carbon cost equal to zero.Recommended that the Commission supports actions by the ACT Government to shield the most vulnerable customers in the ACT
Final report: Standing offer prices for the supply of electricity to small customers from 1 July 2017 69
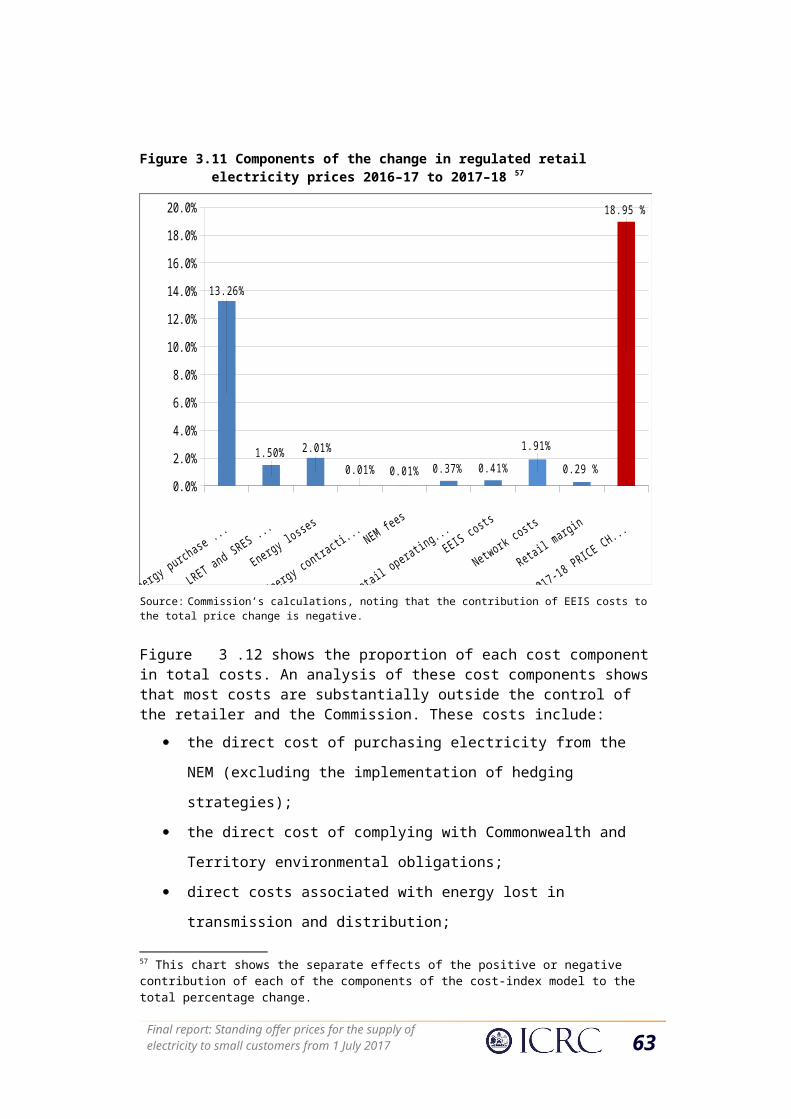
Appendix 1–Terms of reference
Date received Submitter Key issues raised/information provided
from the impact of rising prices. Noted that the proposed price change will have a significant impact on low income consumers, small businesses and community organisations. Noted that the proposed price increase creates risks for vulnerable consumers on fixed incomes particularly those who have Centrelink payments as their only source of income.Recommended increasing access and the value of concessions and improving industry hardship assistance programs.
2 28 April 2017 ActewAGL Retail Limited
Supported the continuation of the current form of control being a weighted average price cap that determines the maximum allowable percentage change that can apply to regulated tariffs.Supported the Commission’s proposed changes to the energy purchase cost model to use the ASX forward price data instead of ICAP’s over the counter data.Supported the Commission’s proposed changes to the energy purchase cost model to revert to the data periods used for averaging from 21 to 23 months.Supported the Commission’s proposed changes to the energy purchase cost model to continue to include the carbon cost in the model but setting to zero. Argued that the Commission’s new approach to calculating the retail margin in the Draft Report does not have any supporting evidence, is without regulatory precedent and fails to compensate for the costs of an efficient retailer.Argued that advice from economic consultants HoustonKemp shows the Commission’s approach to calculating the retail margin is incorrect, as is does not reflect the key drivers of changes in the retail margin.Argued that, on advice from HoustonKemp, the draft decision on the retail margin is not supported by any economic rationale, financial modelling, market data or other evidence, which is inconsistent with best practice methodology.
Argued that, on advice from HoustonKemp, the Commission’s proposal to fix the real per MWh value of the retail margin exposes them to the possibility they will not be able to recover their costs, given the expected increase in its cash flows over the 2017–20 period.Argued that, on advice from HoustonKemp, the Commission’s approach to calculating the retail margin is an outlier, with all jurisdictional regulators that continue regulate retail energy prices providing a retail margin as a percentage of the retailer’s total costs.Argued that the Commission’s new approach to calculating the retail margin has no empirical basis, does not align with the approach taken by other regulators nor the AEMC’s guidelines in making retail price decisions.Argued that the Commission’s new approach to calculating the retail margin does not comply with the pricing principles set out in the ICRC Act. Disagrees with the Commission’s draft report where it states that ROC already includes an allowance for CARC.Argued that the Commission has not explained why it has set ROC lower than other jurisdictions.Supported the Commission’s proposed approach to updating network costs when approved by the AER.Supported the ongoing use of the Commission’s method for
70 Final report: Standing offer prices for the supply of electricity to small customers from 1 July 2017
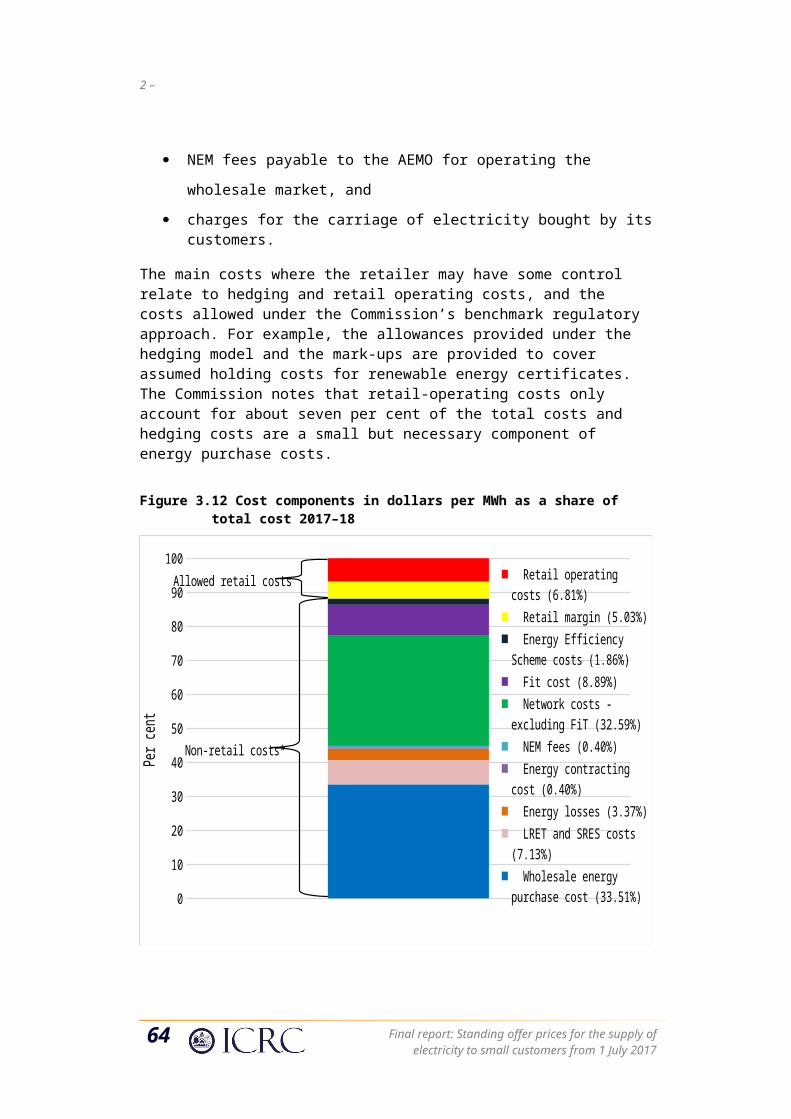
Date received Submitter Key issues raised/information provided
estimating LRET and SRES costs, in accordance with the Draft Report.Supported the Commission’s approach to calculating the cost allowance for energy losses, however, notes that the reference for marginal loss factor for 2017–18 will need to be updated to reflect the new virtual transmission node for the ACT.Supported the Commission’s approach of applying a CPI adjustment to energy contracting costs and NEM fees.Agreed with the Commission’s approach to pass through the costs of the Energy Efficient Improvement Scheme (EEIS).Argued that they will incur legitimate costs in order to comply with the Power of Choice regulatory changes that come into effect on 1 December 2017 and this should be allowed to be recovered during the 2017–20 regulatory period as it is a regulatory change event.Supported most aspects of the Commission’s approach to the annual recalibration which will occur within the next regulatory period but noted two inaccuracies in calculating ROC and the EEIS recalibration.
3 28 April 2017 Dr Shane West Suggested the ACT Government through Icon Water and AAR take control of electricity transmission and generation in the ACT by the formation of a Co-operative Energy Low Carbon Network (LCN).Suggested the ACT Government and ActewAGL in partnership with AGL reallocate funds from the Dalton open cycle gas turbine and convert this into a revised LCN project that has a combined cycle gas turbine and battery storage plant.
Suggested the ACT work with State and the Commonwealth Governments to introduce a 15 per cent domestic gas reserve to supply the LCN, based on the Western Australian model and Untied States domestic gas supply reservation. Suggested inter-governmental partnerships and public private partnerships should be explored for the proposed LCN with integrated electrical transmission and associated gas pipelines and feeds from appropriate transparent gas producers and suppliers.Supported the development of appropriate policy for a carbon intensity emissions trading scheme.Supported the utilisation of conventional gas supplies, no fracking near water reserves and no coal seam gas extraction on agricultural land.Noted that policy and legislation on fugitive emissions and abatement should be enforced with major gas producers funding this by contribution to a national sinking fund.
4 1 May 2017 AGL Energy Limited
Noted that the Commission’s wholesale energy cost methodology relies on approximately two years of ASX futures prices which has provided stability in the past, but in the current environment results in a significant lag and regulated prices are unlikely to reflect current market prices.Noted there is no headroom allowance to encourage competition.Noted there is no cost allowance for customer acquisition and retention costs (CARC).Argued that the Commission’s view of adopting the IPART’s benchmark retail operating costs (ROC) which allows for CARC is incorrect as the IPART’s definition of ROC was distinctly separate
Final report: Standing offer prices for the supply of electricity to small customers from 1 July 2017 71
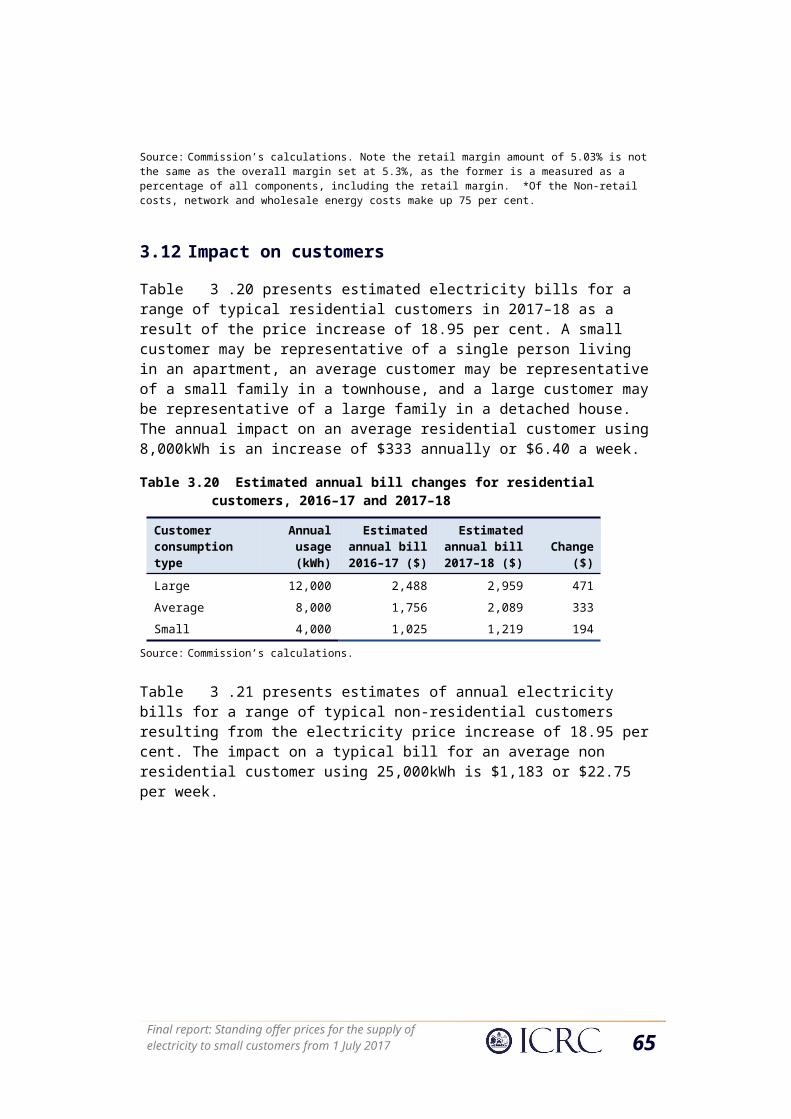
Appendix 1–Terms of reference
Date received Submitter Key issues raised/information provided
from CARC.Noted that significant and on-going costs are going to be incurred as retailers prepare for Power of Choice metering which begins 1 December 2017, and argued further that requirement was not in place when the IPART was considering the benchmark for ROC, and these costs should be taken into account in addition to ROC.Argued that as the Commission has changed the approach to setting the retail margin allowance by fixing it on a $/MWh basis in 2016/17 real terms, it has resulted in a reduction of the margin allowance by 0.5 per cent of total costs or 0.5 per cent of revenue. This results in a retail margin which is independent of the underlying costs.Noted that changing way the retail margin is set diverges from the approach used by other regulators and past Commission decisions.
5 2 May 2017 Origin Energy Limited
Argued the Commission’s proposal to limit the growth in the retail margin to the change in CPI does not align with the risks faced by retailers operating in the market.Argued the exclusion of CARC fails to recognise the costs that apply to all retailers, including incumbent retailers, in the ACT.Argued the Commission’s proposal to alter the methodology for applying the retail margin as well as the decision not to grant a competition allowance is a cause for concern as this will significantly understate the cost to retailers of servicing customers it the ACT.Suggested that the Government may need to provide some sort of additional financial support (i.e. one-off rebates) to segments of energy users that see significant increases in their annual bill.Noted that retail tariffs should be set at a level that is sufficient to protect and promote competitive market offers.Noted it anticipates that energy costs will be higher in the Final Report due to extreme weather conditions over the 2016–17 summer which led to significant increases in demand and forced energy contract costs to record average levels. Noted that the Draft Report only included a small network component increase and supports the Final Report including the network prices approved by the AER in June 2017.
6 18 April 2017 Wildlife Carers Group
Strongly recommended that AAR stop using helicopters with cameras attached to check powerlines for obstructions and that they be replaced by a cheaper alternative such as drones.Strongly recommended the Commission reduce electricity prices rather than increasing them.Recommended that the goods and services tax and all other taxes be removed and that online card use charges be abolished.Suggested free assistance with solar energy, maintenance and installation of batteries.
72 Final report: Standing offer prices for the supply of electricity to small customers from 1 July 2017
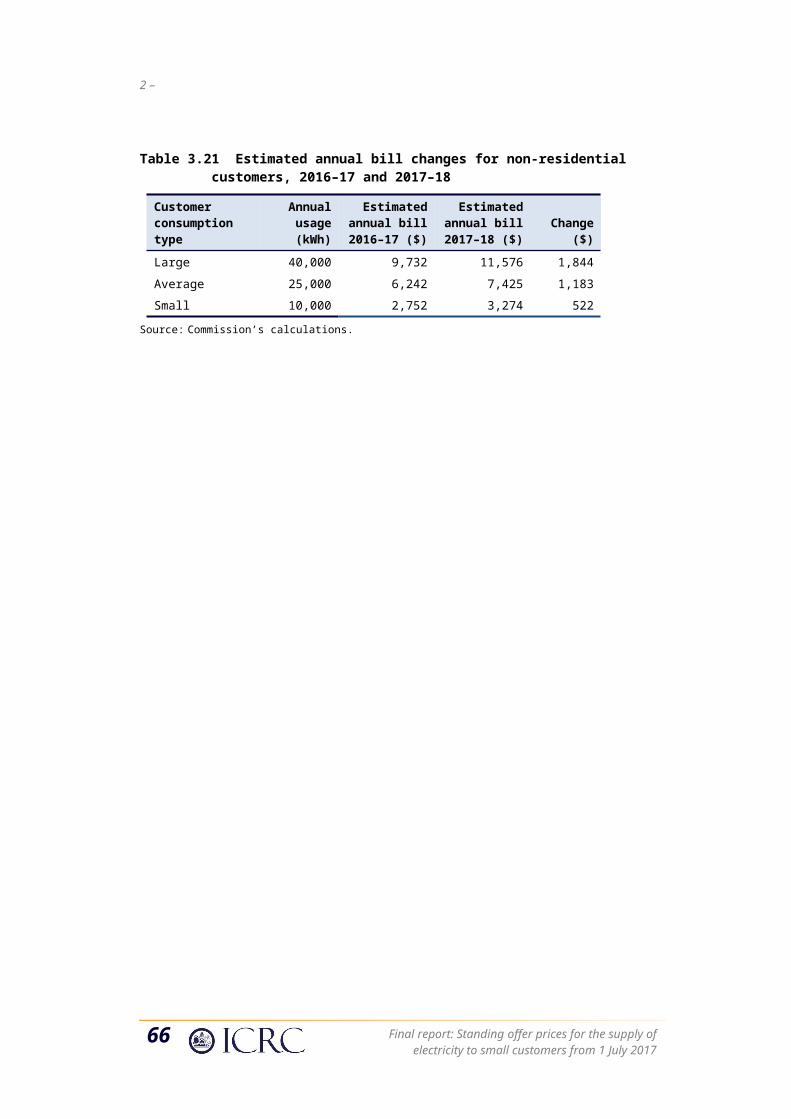
Appendix 3 The Commission’s hedging cost model
This appendix explains the Commission’s hedging cost model. Appendix 4 provides a mathematical derivation of the key equation in the model.
Due to the high volatility inherent in the wholesale electricity market, retailers hedge their exposure to risk by forward purchasing electricity in the contract market or by taking positions in the futures market. Forward contracts specify fixed prices for the supply of electricity to the retailer. Hedging greatly reduces the risk of price volatility for the retailer, contributing to financial stability. The main risk is that wholesale market prices could spike to high levels. However, hedging to reduce price volatility and avoid price spikes entails costs that need to be allowed for in setting retail electricity prices.
The market-based approach adopted by the Commission estimates the cost of purchasing electricity based on forward prices, observed market outcomes and the assumption that the hedging strategy is conservative in ensuring there are minimal cash flow and financial viability risks. This is based on the need to ensure that AAR, which is both the retailer of last resort and the incumbent retailer in the ACT, is not potentially exposed to financial failure, which would in turn seriously undermine the electricity supply arrangements in the ACT.
The essence of the hedging strategy is that a retailer purchases enough forward cover to reduce to a negligible level the possibility of having insufficient forward cover to meet demand in any trading interval. This means that, in most trading intervals, the retailer will most likely have more forward contracts than it needs. The hedging strategy assumes that these excess entitlements to electricity are sold on the spot market.
The Commission’s energy purchase cost model comprises six components: the forward price, the load shape, the load ratio, the forward price margin, the quarterly load weights and the cost of carbon (which is currently zero). The forward price represents the cost of pre-purchasing electricity to be delivered at a later date. The load shape and the load ratio are key drivers of the hedging cost.
The net cost of hedging is the difference between the cost of forward contracts and the revenue from the sale of contracts that are in surplus. This cost can be expressed on a per MWh basis as a forward price adjusted by an uplift factor, which depends on the forward price margin, load shape and load ratio.
The load shape reflects the extent to which the level of the load and the spot price move together and is measured by the ratio of the load-weighted spot price to the time-weighted spot price. The spot price is normally positively related to the load, as higher load typically requires higher cost sources of energy to be generated. The load shape has averaged about 1.1 or less in recent years.
Final report: Standing offer prices for the supply of electricity to small customers from 1 July 2017 73
Appendix 2 – Submissions
The load ratio, also often described as the load profile, is measured by the ratio of peak load to average load. It affects hedging costs directly by impacting on the cost of hedging cover to avoid price risks associated with the peak load. The Commission uses the maximum value of the load ratio calculated since 2003–04 and adds an additional 0.1 to the highest ratio to allow for a more extreme event. This reflects a conservative hedging approach considered to be reasonable because the distribution of wholesale electricity prices is not likely to be symmetric, i.e. the probability of very high prices is likely to be much higher than would occur with a symmetric normal statistical distribution. The load ratio has averaged about 2.3 in recent years.
The cost in dollars per MWh of the hedging strategy that is incorporated in the Commission’s model can be expressed as:59
Cost of hedging∈$ per MWh=FP× [ LS × (1−M )+LR × M ]
That is, the cost of hedging in dollars per MWh is equal to the forward price multiplied by an uplift factor, the term in the square brackets. The uplift factor is a weighted average of the load shape and the load ratio, where the weight on the load shape is equal to 1 minus the forward premium (1-M) and the weight on the load ratio is equal to the forward premium (M). As noted, the load shape component captures the effect of load on spot prices, which in turn increases the cost of hedging. The load ratio component can be interpreted as allowing for an extreme effect and its impact will depend on the choice of the load ratio number for the calculation. The forward price margin, set at five per cent, captures the observation that forward prices generally exceed average spot prices. The uplift factor has averaged about 1.2 in recent years.
The hedging cost calculation satisfies the precepts of the precautionary approach by accounting for the load variability risk through the load shape and the load ratio. The load shape accounts for the first-order risk moments of the joint spot price and load distribution. The load ratio adds a precautionary layer and captures the estimated impact of the worst-case load scenario, accounting for second-order or more extreme moments of the load distribution.
The Commission’s current energy purchase model is summarised in Box A3.5.
59 Appendix 4 provides a mathematical derivation of this expression.
74 Final report: Standing offer prices for the supply of electricity to small customers from 1 July 2017
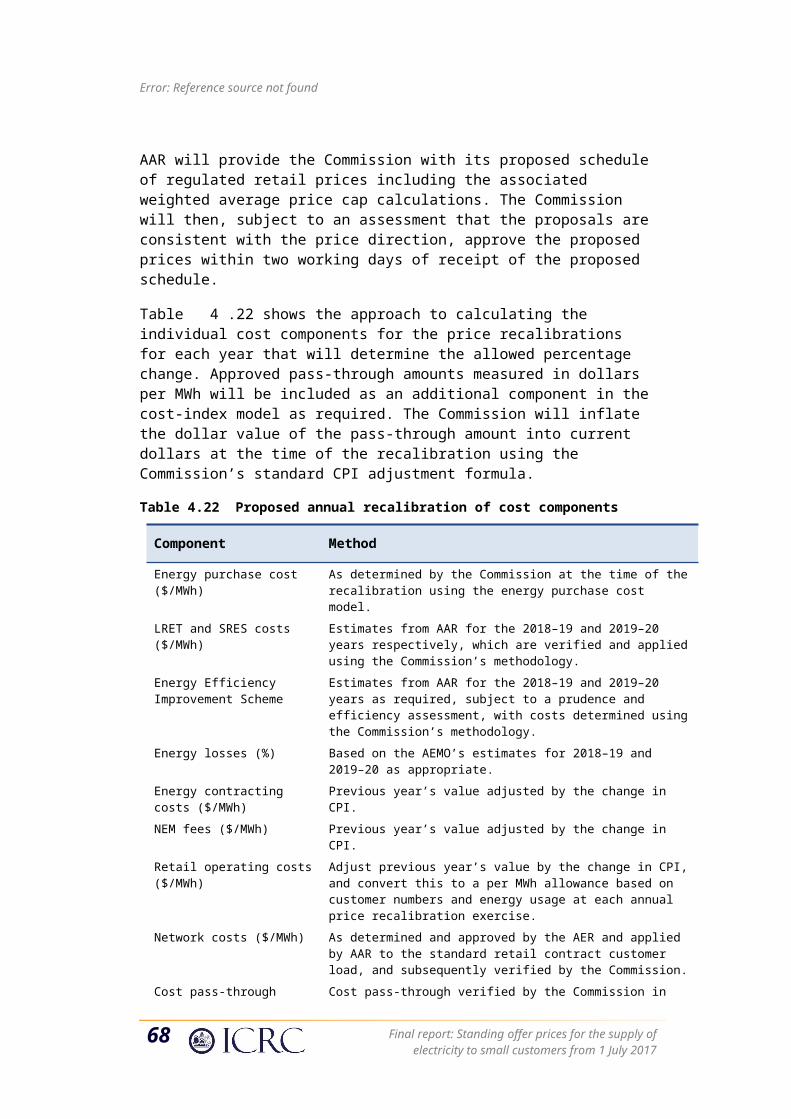
Box A3.5 Current energy purchase cost model summary
EPCs=FPs× [ (1−M s )× LSs+M s × LR s ]+C and
EPC=∑i=1
4
w s× EPCs
where the following are defined for each quarter s:
EPCs denotes the carbon-inclusive energy purchase cost;
FPs denotes the carbon-exclusive forward price;
M s denotes the forward price margin or mark up on the spot price;
LS s denotes the load shape measured by the ratio of the load-weighted to time-weighted spot price;
LRs denotes the load profile measured by the ratio between peak load and average load for the highest historical value, with a margin of 0.1 added for precautionary purposes;
C denotes the cost of carbon, which equals the price on carbon as mandated in legislation multiplied by the national carbon intensity factor. For the purposes of the model it is set to zero;
w s denotes the quarterly load weight;
the subscript s denotes the quarter; and
EPC without the subscript denotes the annual energy purchase cost.
Final report: Standing offer prices for the supply of electricity to small customers from 1 July 2017 75
Appendix 4 Derivation of the hedging cost
For the reasons explained in the text, the hypothetical hedging strategy that has been chosen comprises the retailer buying enough ‘flat’ or ‘base load’ contracts to cover any likely load and disposing of any contracts that turn out to be surplus to requirements on the spot market. As this is a conservative strategy, typically there should be surplus forward contracts.
Taking out forward contracts in quarterly blocks permits allowance to be made for differences in the load profile in different quarters. For any given quarter the variables are defined as follows:
Lt is the average load in half-hour trading interval t of the quarter in MW.
SPt is the spot price in half-hour trading interval t in dollars per MWh.
FP is the forward price for a ‘flat’ or ‘base load’ contract for the quarter in dollars per MWh.
L is the quantity of ‘flat’ or ‘base load’ forward contracts for the quarter in MW.
From which we may define the following summary measures for the quarter:
L= 1T
×∑t=1
T
Lt is the average load
where:
T is the number of half-hour trading intervals in the quarter.
SP= 1T
×∑t=1
T
SPt is the time-weighted average spot price.
SP=∑t=1
T
(SP t × Lt) ∕ L is the load-weighted average spot price.
LS=SP /SP is the load shape.
LR= L/L is the load ratio.
M=(FP−SP)/ SP is the forward premium on contracts.
Recognising that each trading interval is half an hour, the cost of the forward contracts purchased for each trading interval is then given by:
L × FP /2.
Final report: Standing offer prices for the supply of electricity to small customers from 1 July 2017 77
Appendix 2 – Submissions
The revenue from the sale of the contracts that turn out to be surplus in trading interval t is given by:
( L−Lt )× SPt /2.
The net cost of hedging in trading interval t is the difference between these two amounts, which after rearranging becomes:
( L × ( FP−SPt )+Lt × SPt ) /2.
Summing over all the trading intervals in the quarter, the total cost of hedging for the quarter is given by:
∑t =1
T
( L× ( FP−SPt )+Lt × SPt )/2.
Separating out variables invariant to the trading interval index gives:
¿.
Using the definitions of time-weighted average spot price and load-weighted average spot price and taking out T as a common factor gives:
T /2×( L × FP−L × SP+SP × L).
Using the definition of the load ratio and the load shape gives:
T /2×(L × LR × FP−L × LR × SP+SP× LS × L).
Using the definition of the forward margin:
SP=(1−M )× FP.
Hence the total cost of hedging for the quarter is given by:
T /2× L× FP ×[LR × M +LS × (1−M )].
Dividing by the energy supplied to customers over the quarter, which is equal to the average load, L, multiplied by the duration of the quarter in hours, T /2, yields the cost of hedging in dollars per MWh namely:
FP×[ LR × M +LS × (1−M )].
That is, the cost of hedging in dollars per MWh is equal to the forward price multiplied by an uplift factor, the term in the square brackets. The uplift factor is a weighted average of the load ratio and the load shape, where the weight on the load ratio is equal to the forward premium and the weight on the load shape is equal to 1 minus the forward premium. The load shape component can be interpreted as capturing the effect
78 Final report: Standing offer prices for the supply of electricity to small customers from 1 July 2017
of load on spot prices which in turn increases the cost of hedging. The load ratio component can be interpreted as allowing for an extreme effect and its impact will depend on the choice of the LR for the calculation.
Appendix 5 The LRES, ancillary and hedging costs
This appendix provides a brief review of the ACT’s large scale renewable energy scheme (LRES) and its implications for ancillary services and hedging of costs for retailers. It presents key findings in a separate consultant’s report.60
A5.1 Description of the ACT’s LRES
A key mechanism for implementing the ACT’s 100 per cent renewable energy target is the large scale FiT legislation, supported by the reverse auctions that have been used to purchase renewable energy.61
The ACT’s LRES requires ActewAGL Distribution to pay a FiT to an eligible renewable energy generation business on a monthly basis for the ‘eligible electricity’ generated. The generator must have registered Large-scale Generation Certificates (LGCs) for all eligible generation and transfer them to the Territory. LGCs provide proof that the generation is from a renewable energy source with each LGC representing one MWh of eligible generation. LGCs are administered by the Commonwealth Government Clean Energy Regulator.
The payments made by ActewAGL Distribution are based on a ‘contract-for-difference’ basis. This means ActewAGL Distribution pays the generator, for each delivered MWh, the difference between the generators’ FiT price and the spot price of that MWh in the wholesale market in the relevant wholesale market pool. This occurs for each 30 minute trading interval and is aggregated and paid monthly in arrears. If, over the course of a month, the wholesale spot price is below the FiT price, ActewAGL Distribution will pay the generator a top up amount. If the wholesale market spot price is higher than the FiT amount, ActewAGL Distribution will be paid the difference by the generator, and the costs or savings are passed on to all ACT electricity consumers in full through their retail suppliers. Thus the contract-for-difference payments are in effect treated like other allowed distribution costs that are passed through to retailers.62
60 Gawler, 2017.61 http://www.environment.act.gov.au/energy/cleaner-energy/how-do-the-acts-renewable-energy-reverse-auctions-work.62 This is in contrast to the Commonwealth schemes where retailers pay directly for renewable energy certificates to provide revenue to eligible renewables energy businesses.
Final report: Standing offer prices for the supply of electricity to small customers from 1 July 2017 79
Appendix 2 – Submissions
The contract-for-difference payment based on the trading period settlement is as follows:
Support payment = (FiT Price – Spot Price) * Quantity.
The FiT Price is the contract price. The Spot Price is that paid by AEMO which includes the loss factor applicable to the facility. The Quantity is the amount of electricity generated in each trading interval. However, there is scope for a minimum and a maximum quantity to be required in a period such as a financial year. If the maximum quantity is exceeded, then the Quantity in the formula may be set to zero63.
To date the LRES has been implemented with a series of reverse auctions for solar and wind power where the winning bidder is contracted to provide electricity at a specified prices. Most the energy is generated with wind power and around half of the energy is generated by wind power located in South Australia with a substantial contribution also sourced from Victoria. The rest is generated from locations in the ACT and NSW.
Eligible generators face spot prices in their regional markets while ACT retailers purchase spot and contract cover based on the NSW wholesale electricity prices.
A5.2 Implications of the LRES
The fact that the difference contract payment stream is ultimately recovered from the customers through progressive adjustment of network service charges has the following consequences:
1. The renewable energy generator receives a fixed price for its output and it not subject to price uncertainty in the relevant wholesale pool or the renewable energy certificate market. However, it is still subject to volume of production risk.
2. The retailer purchases from the relevant wholesale pool in the normal way and is subject to the risks associated with the volume of retail sales in comparison to the wholesale hedging volume.
3. There may be some short term cash imbalances for the distributor to the extent that the network service charges in a billing period do not exactly recover the difference payment cost paid in the billing period. The charges are adjusted in the next financial year having regard to accumulated surplus or deficits in payment transfers to customers.
4. There is no additional risk to the retailer as the network charges are passed on in full to customers, including the effect of the FiT difference payments.
63 http://www.legislation.act.gov.au/a/2011-56/current/pdf/2011-56.pdf presents the ACT. Part 4 with Clauses 17 to 19 defines how the scheme works.
80 Final report: Standing offer prices for the supply of electricity to small customers from 1 July 2017
5. There may be some short-term revenue shortfalls or surpluses depending on the mismatch between the variation in electricity pool prices in the New South Wales pool and the variation in the generator’s region as reflected in changes in the difference payments.
6. To the extent that prices in the generator region and the NSW region rise and fall together and are reflected in the hedge contract market, the supplementary difference payments will compensate for variability in the hedge contract market, so that ACT customers would see more stable electricity prices over time.
7. To the extent that prices in the generator region (for example South Australia) deviate markedly from pool and contract prices in NSW, ACT customers may see greater variability in their electricity costs. For example, if the South Australia market became export constrained and oversupplied, and it provided the majority of renewable energy under the LRES, the difference payments could create a burden on ACT customers who may not be compensated by corresponding lower pool prices in NSW. Conversely if the pool price in the generator region exceeds the contract price, then the difference payments would reduce electricity costs for ACT customers.
Note that the retailer’s hedging program is not affected by the FiT scheme as the retailer does not directly purchase the extra renewable energy. The retailer buys electricity from the spot and hedge markets irrespective of the volumes implied by the payment of difference payments from the complying renewable energy projects. The retailer’s risk profile is not affected by the pass through of the contract difference payments through the distribution charges to the customers. Note that the term ‘risk’ refers to variability of prices which implies benefits and costs to a party depending on the price outcome and whether they are a supplier or a buyer of energy.
A5.3 Transmission constraints and wholesale pool price divergence
The ACT customers’ risk profile (exposure to up and down price movements) is reduced to the extent that the NEM operates without significant transmission constraints between the renewable generation source region and NSW. This proposition, for example depends on the spot prices in South Australia and Victoria being close to the spot price in New South Wales. When spot prices exceed the FiT price ACT consumers will benefit from the pass through of excess revenue above the FiT price and conversely they will pay the gap when spot prices are below the FiT price. ACT customers will in effect bear the full risk of wholesale prices deviating from the FiT price. This will mean that they face more stable prices, provided that the geographic market prices are not separated due to transmission constraints.
However, if transmission constraints apply so that wholesale prices in the generation and retail regions deviate markedly. ACT customers may bear greater price risk. If, for
Final report: Standing offer prices for the supply of electricity to small customers from 1 July 2017 81
Appendix 2 – Submissions
example, regional wholesale prices diverged so that they decreased in New South Wales below the FiT and increased in South Australia above the Fi, and most of the renewables generation was sourced from South Australia, consumers would benefit from the increased revenue derived in the South Australian wholesale pool and passed through to them in lower distribution charges. However, if the price divergence was reversed so that wholesale prices increased sufficiently in NSW and decreased sufficiently in South Australia, ACT customers would face higher prices as the higher costs in NSW would be recovered through the hedging cost model and they would also have to pay higher distribution charges to fund the contractual FiT.
The extent of the risk depends on the extent to which eligible generators are based outside of NSW. The risk could also arise if new national electricity market regions applied within NSW and the ACT in the future.
A5.4 Secondary effects of the FiT Scheme
There will be secondary effects on the electricity market due to LRES which may need to be monitored, but will likely be immaterial, as follows:
1. The Scheme will increase the total amount of renewable energy in the NEM beyond that which otherwise would have been supplied.
2. This additional renewable energy may force closure of thermal plants with the following consequences:
a. Increasing the cost of ancillary services for frequency control unless battery storage is developed to replace the supply cost-effectively and mitigate the cost increase
b. Reducing the supply of swaps in the hedge market and increase the cost of hedging until energy storage facilities are developed to replace the lost hedging capacity
c. Reducing the spot revenue available to renewable energy generators due to greater volumes of electricity production at times of high solar radiation and high wind power generation
d. Reducing the spot market price of electricity generally until compensated for by additional closure of thermal power plants
3. The first two of these effects (a,b) would add to the costs of retailers and be passed on to ACT consumers through increased ancillary service charges and higher forward contract prices
4. The third effect (c) will increase the amount of support payments required to the extent that complying renewable energy resources are developed in the more constrained regions like Tasmania and South Australia. This represents a
82 Final report: Standing offer prices for the supply of electricity to small customers from 1 July 2017
risk to the scheme as the volume of renewable energy increases without commensurate development of storage and interconnection capacity.
5. The fourth effect (d) will provide some slight downward pressure on wholesale electricity prices until there is a response for retirement of thermal power plants.
A final point is that although the LRES may not have a material impact on ancillary costs by itself, ancillary services and costs are likely to need to increase materially in response to the growth of renewable energy generally and this may is likely to have implications for the recognition of ancillary costs in the Commission’s model. Currently ancillary costs, in the Commission’s model are assumed to increase only in line with the CPI.
Final report: Standing offer prices for the supply of electricity to small customers from 1 July 2017 83
Appendix 6 Comparison of residential electricity prices across Australian jurisdictions
This appendix provides a summary comparison of residential electricity prices for a number of Australian jurisdictions. This comparison is made using the best available public data as of 1 May 2017. Retail electricity prices in the ACT, Tasmania and regional Queensland remain regulated but most other Australian states have proceeded with deregulation of retail electricity prices.
A6.1 Recent reports comparing retail electricity prices
The AER’s State of the Energy Market Report 2017 found that estimated annual small customer electricity bills based on standing offers64 in the ACT were the lowest in Australia in 2016 (see Figure A6.13)65.
Figure A6.13 Estimated annual small customer electricity bills based on standing offers, 2016
Qld (Energ
ex)
NSW (A
usgrid)
NSW (E
ndeavour E
nergy)
NSW (E
ssential E
nergy)
Vic (Citipower)
Vic (Powerc
or)
Vic (AusN
et Ser
vices)
Vic (Jem
ena)
Vic (Unite
d Energ
y)
SA (E
TSA Utiliti
es)
Tas (A
urora En
ergy)
ACT (Acte
wAGL)0
500
1,000
1,500
2,000
2,500
3,000
$/ye
ar
Source: Data from AER (2017).
64 Customers can choose a standing offer if they do not want to sign up for a market retail offer. Standing offers prices are often set by the government depending on where you live.65 AER, 2017:131.
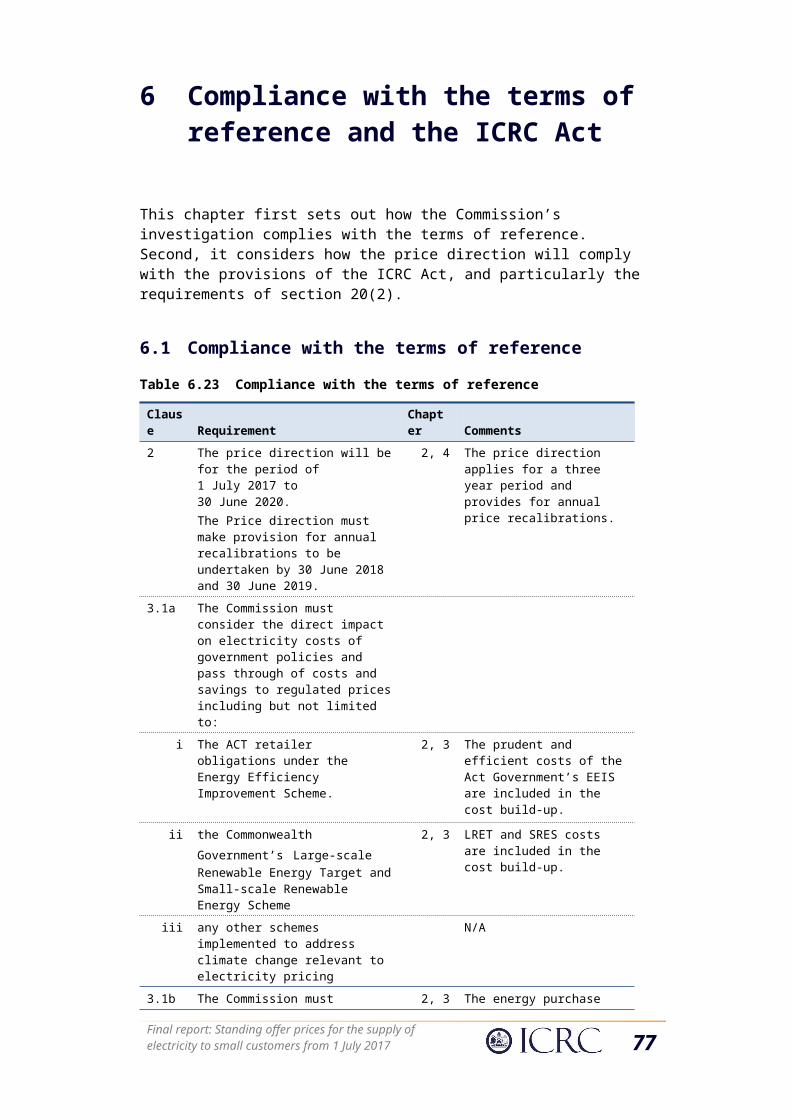
The recent Office of Tasmanian Economic Regulator (OTTER) report comparing Australian standing offer energy prices across jurisdictions found that customers in the ACT pay the lowest amount for annual consumption of 8,250kWh (see Figure A6.14).
Figure A6.14 Residential standing offer electricity bills based on annual consumption of 8,250 kWh
Source: OTTER (2017).
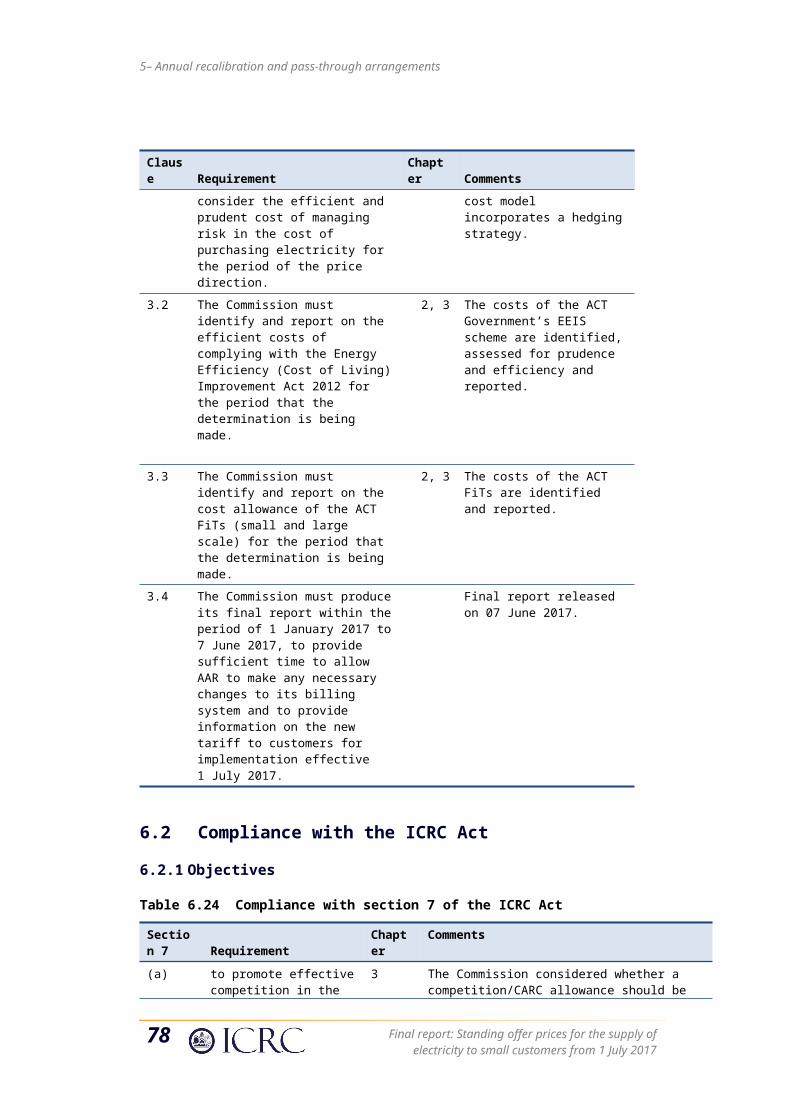
Appendix 6 – Comparison of residential electricity prices across Australian jurisdiction
The GetUp! Report of August 2016 compared household electricity bills in regulated ACT retail market to the bills in the deregulated markets in Victoria, NSW, South Australia and south-east Queensland.66,67 This report found that the total annual bill in the ACT is the lowest of all NEM jurisdictions.68 It further found that the regulated retail component in the ACT is much lower than the estimated retail component on the best offers from the big three energy retailers (AGL Energy, Energy Australia and Origin Energy) in the other regions of the NEM.
As the GetUp! Report noted, the charges for the provision of retail services in the ACT are on average about half of those in the other states in Australia (see Figure A6.15).
Figure A6.15 Breakdown of household electricity bills in select distribution zones, average of big three market offers on 2 August 2016
Source: CME (2016).
A recent report by Grattan Institute also noted that electricity prices in Sydney, Melbourne, Brisbane and Adelaide have almost doubled over the past decade.69
66 GetUp Group is a non-profit organisation. This report has been prepared for GetUp Group by CME, an economic consultancy focussing on Australia’s energy and utility industries.67 The data used in this analysis was obtained from retail offers disclosed in electricity fact sheets applicable to residential customers in Victoria, NSW, Queensland, the ACT and South Australia on 2 August 2016. It also used data on Great Britain for comparison purposes. 68 CME, 2016: 18.69 Wood, Blowers and Morgan, 2017: 3.
Final report: Standing offer prices for the supply of electricity to small customers from 1 July 2017 87
energex (QLD) ausgrid (NSW) united (VIC) actewAGL (ACT) Great Britainsapn (SA)
$2,000
$1,800
$1,600
$1,400
$1,200
Retail Environmental Metering Wholesale Network
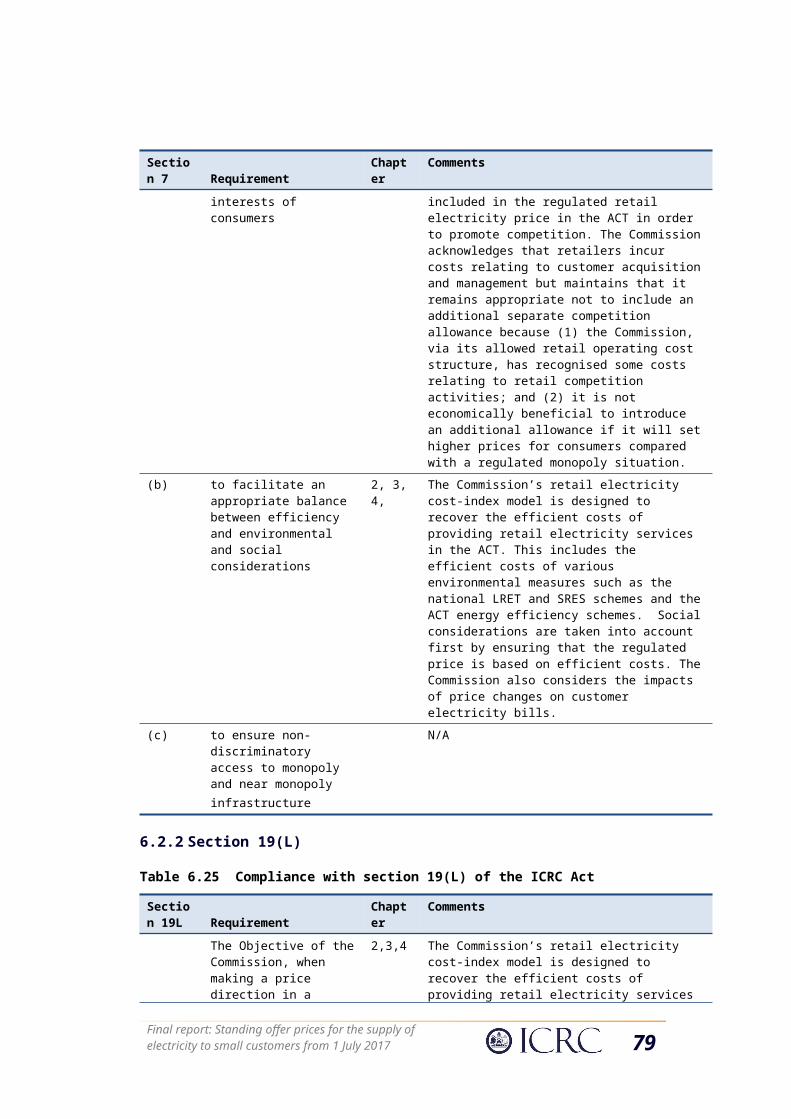
Appendix 5 – The LRES, ancillary and hedging cost
A6.2 Comparison of recent residential electricity prices across jurisdictions
Electricity retailers in Australia offer a range of contracts with different price and product characteristics. Table A4.1 shows the number of single rate and time of use offers available to residential electricity consumers in the ACT, Sydney, Brisbane, Adelaide and Hobart, sourced from the Energy Made Easy website as at September 2016.70 These offers are a mix of standard and market contracts. Single rate offers in Melbourne are also included, sourced from the Victorian Energy Compare website.71
Table A6.1 Retail electricity offers, September 2016
Single rate Time of use Total
ACT 23 15 38Sydney 74 72 146Brisbane 43 39 82Adelaide 60 8 68Melbourne 216 N/A 216Hobart 1 1 2
Source: www.energymadeeasy.gov.au and https://compare.switchon.vic.gov.au/. Accessed mid-September 2016, as cited in ICRC (2016).
Comparison of residential electricity prices across jurisdictions is difficult because of the range of offers that retailers make in deregulated markets.
Table A4.2 shows the estimated annual bill (including all discounts) for the current range of single rate offers available to residential customers in Canberra, Hobart, Sydney, Brisbane and Adelaide, as reported on the Energy Made Easy website. These offers are a mix of standard and market contracts. They also include single rate offers available to Melbourne residents, as reported on the Victoria Energy Compare website. To ensure comparability, all offers are based on an annual electricity consumption of about 7,500kWh.
The figures confirm that the average annual bill in72 Canberra even with the Commission’s determination of an 18.95 per cent increase remains less than in all the other capital cities.
70 Energy Made Easy is an Australian Government website maintained by the AER.71 Price comparisons on the Energy Made Easy website are only available for jurisdictions where the National Energy Retail Law has commenced, which is not the case in Victoria.72 Information reported in the table refers to a time period from September 2015 to September 2016.
88 Final report: Standing offer prices for the supply of electricity to small customers from 1 July 2017
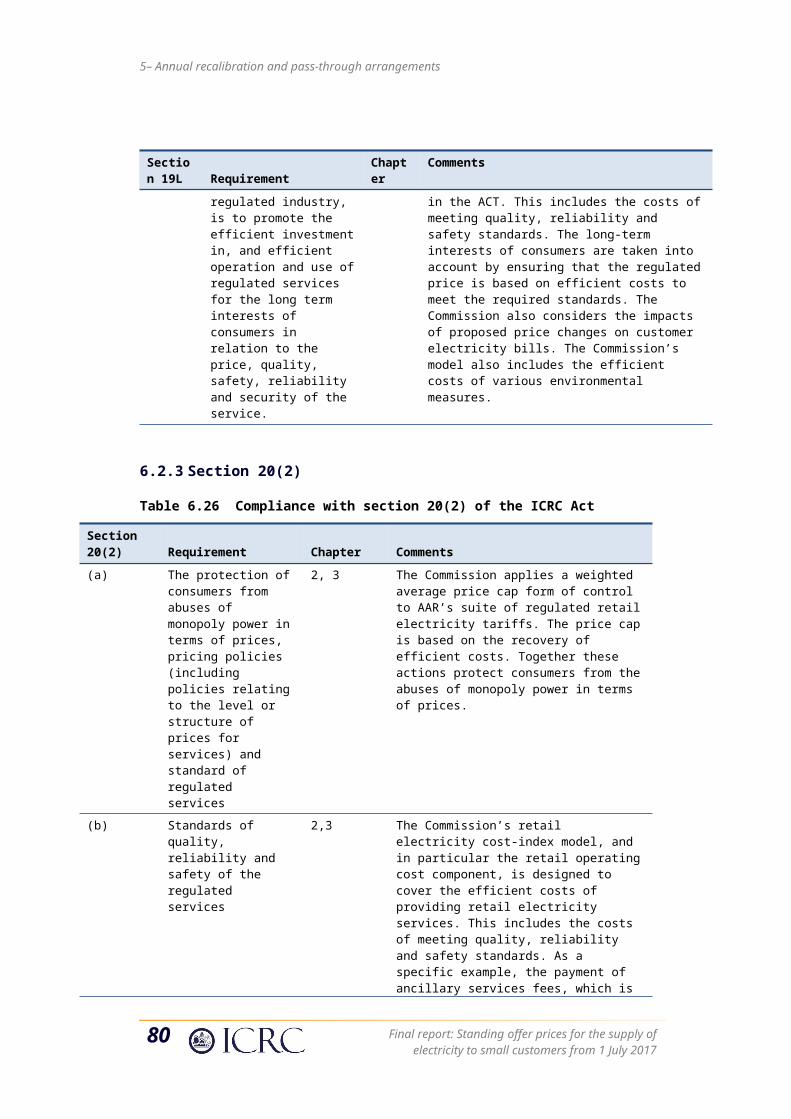
Appendix 6 – Comparison of residential electricity prices across Australian jurisdiction
Table A6.2 Comparison of retail electricity (single rate) prices, as at 22 February 2017(a)
Noof offers
Price range ($) Average bill($)
Canberra 34 1,465-2,301 1,590Sydney 78 1,946-3,686 2,221Brisbane 64 2,147-3,515 2,349
Adelaide 69 2,676-4,588 2,895Melbourne(b) 273 1,150-2,510 1,831
Hobart 1 2,284 2,284Perth N/A N/A N/A
Source: Data from www.energymadeeasy.gov.au and https://compare.switchon.vic.gov.au/. Accessed 22 February 2017.Note: (a) Estimated annual cost is based on a customer using 7,500 kWh of electricity per year on a single rate tariff at 22 February 2017; (b) Estimated cost is based on households using 7,500 kWh of electricity per year with three members, eight rooms, split system air-conditioning for heating and room air-conditioning for cooling, with no solar panels and with no controlled load connected to the house.
Final report: Standing offer prices for the supply of electricity to small customers from 1 July 2017 89
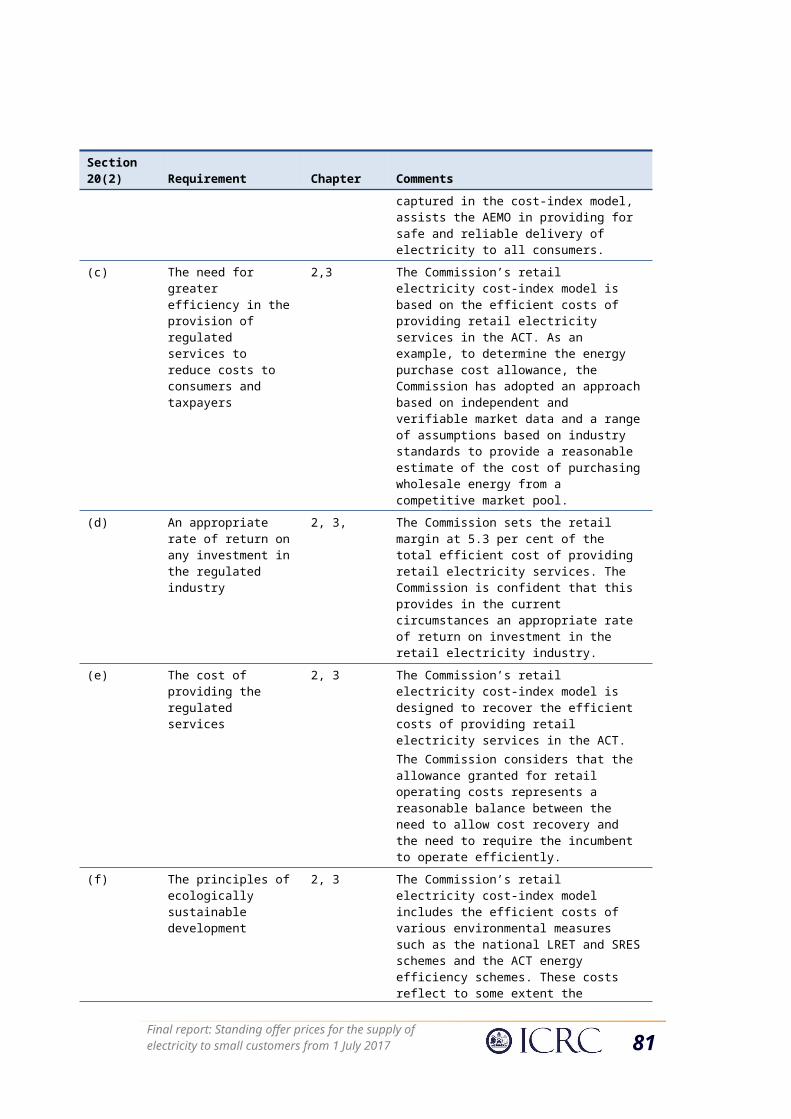
Abbreviations and acronymsAAR ActewAGL Retail Limited
ABS Australian Bureau of Statistics
ACAT ACT Civil and Administrative Tribunal
ACN Australian Company Number
ACT Australian Capital Territory
AEC Australian Energy Council
AEMC Australian Energy Market Commission
AEMO Australian Energy Market Operator
AER Australian Energy Regulator
AGL AGL Energy Limited
ASX Australian Securities Exchange
CARC Customer acquisition and retention costs
CPI Consumer Price Index
ECPC Energy Consumers Policy Consortium
EEIS Energy Efficiency Improvement Scheme
EPC Energy purchase cost
FiT Feed-in tariff
ICRC Independent Competition and Regulatory Commission
IPART Independent Pricing and Regulatory Tribunal
kWh Kilowatt hour
LCN Low carbon network
LGC Large-scale Generation Certificate
LR Load ratio
LRET Large-scale Renewable Energy Target
LS Load shape
MLA Member of the Legislative Assembly
MWh Megawatt hour
Final report: Standing offer prices for the supply of electricity to small customers from 1 July 2017 91
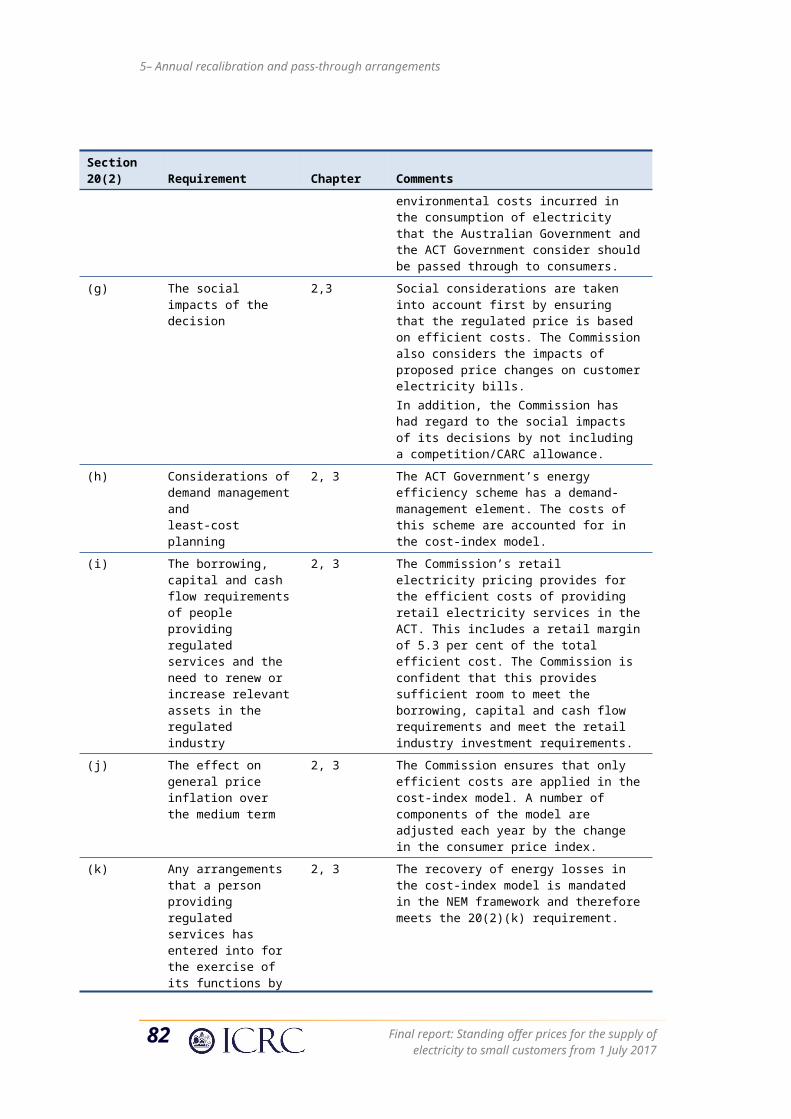
Appendix 6 – Comparison of residential electricity prices across Australian jurisdiction
NEM National Electricity Market
NSW New South Wales
UNFT Utilities Network Facilities Tax
OTC Over-the-counter
OTTER Office of the Tasmanian Economic Regulator
POC Power of Choice
ROC Retail operating costs
RPP Renewable power percentage
STC Small-scale Technology Certificate
SRES Small-scale Renewable Energy Scheme
WAPC Weighted average price cap
92 Final report: Standing offer prices for the supply of electricity to small customers from 1 July 2017
ReferencesACAT 2016. "Submission to Issues paper: Standing offer prices for the supply of
electricity to small customers from 1 July 2017." Canberra: Australian Capital Territory Civil and Administrative Tribunal.
ACT Government 1997. "Independent Competition and Regulatory Commission Act 1997." In: Counsel, AP (ed.) A1997-77. Canberra: ACT Government.
ActewAGL Distribution 2015. "2015-16 Network Pricing Proposal." Canberra: ActewAGL Distribution.
ActewAGL Distribution 2017. "ActewAGL Distribution 2017/18 network pricing proposal." Canberra: ActewAGL Distribution.
ActewAGL Retail 2016. "ActewAGL response to issues paper framework and approach: Standing offer prices for the supply of electricity to small customers from 1 July 2017." Canberra: ActewAGL Retail.
ActewAGL Retail 2017. "ActewAGl Retail response to draft report standing offer prices for the supply of electricity to small customers from 1 July 2017." Canberra: ActewAGL Retail.
AEC 2016. "Standing offer prices for the supply of electricity to small customers from 1 July 2017: Issues paper." Canberra: Australian Energy Council.
AGL 2016. "Issues paper: Standing offer prices for the supply of electricity to small electricity customers from 1 July 2017." Canberra: AGL.
AGL 2017. "Draft report: Standing offer prices for supply of electricity to small electricity customers from 1 July 2017." Canberra: AGL.
CME 2016. "Australia's retail electricity markets: Who is serving whom?" A report prepared for GetUp! : CME Australia
Gawler, R 2017, "Modelling the Efficient Costs of a Retailer Hedging Wholesale Electricity Prices with Renewable Energy Obligations", Canberra: Independent Competition and Regulatory Commission
ICRC 2003. "Final determination: Investigation into retail prices for non-contestable electricity customers in the ACT." Canberra: Independent Competition and Regulatory Commission
ICRC 2010. "Model for determining the energy purchase cost component of the transitional franchise tariff: Final technical paper." Canberra ACT: Independent Competition and Regulatory Commission
ICRC 2014a. "Draft report: Standing offer prices for the supply of electricity to small customers 1 July 2014 to 30 June 2017 ". Canberra ACT: Independent Competition and Regulatory Commission.
Final report: Standing offer prices for the supply of electricity to small customers from 1 July 2017 93
Abbreviations and acronyms
ICRC 2014b. "Final report: Standing offer prices for the supply of electricity to small customers 1 July 2014 to 30 June 2017 ". Canberra: Independent Competition and Regulatory Commission.
ICRC 2016. "Final Decision: Retail electricity price recalibration 2016-17." Canberra ACT: Independent Competition and Regulatory Commission.
ICRC 2017a. "Draft report: Standing offer prices for the supply of electricity to small customers from 1 July 2017." Canberra: Independent Competition and Regulatory Commission.
ICRC 2017b. "Standing offer prices for the supply of electricity to small customers from 1 July 2017: Draft report." Canberra: Independent Competition and Regulatory Commission
IPART 2013. "Review of regulated retail prices for electricity, 2013 to 2016 - Draft Report." Sydney: Independent Pricing and Regulatory Tribunal.
Origin 2016. "Retail prices for small electricity customers from 1 July 2017: Issues paper." Canberra: Origin.
Origin Energy 2017. "Retail prices for small electricity customers from 1 July 2017: Draft report." Canberra: Origin Energy.
Rattenbury, S 2016. "A letter: Response to ICRC issues paper on standing offer prices for the supply of electricity to small customers from 1 July 2017." Canberra.
Wood, T, Blowers, D and Morgan, G 2017. "Price shock: Is the retail electricity market failing consumers?". Carlton: Grattan Institute.
94 Final report: Standing offer prices for the supply of electricity to small customers from 1 July 2017