Regular Economic Report World Bank EU8+2 EU8+2...
41
1 World Bank EU8+2 Regular Economic Report September 2007 1 EU8+2 HIGHLIGHTS OF THE REPORT ---MAIN REPORT--- Events in global financial markets in recent weeks following developments in the US housing and mortgage market, and a reappraisal of risk have been dramatic. Shock waves coursing throughout the international system triggered a series of rare interventions by the US and European central banks, and increased volatility in equity and bond markets. The “benign” international financial conditions faced by the EU8+2 for several recent quarters, and the prospect of continued robust global growth, suddenly looked much less certain. Even the expectation of monetary tightening in the Eurozone and the US has shifted as the US cut its target rate and the discount rate. The current turbulence represents a test of the resilience of the EU8+2. While there has been a partial reversal of the initial movements of asset prices, bond spreads, and currency values, the episode may not be over and there may be further developments both in the US and in international markets. There remain two distinct risks for the EU8+2 as well as other emerging markets. The first is that tightening credit will weaken growth in developed markets with implications for emerging market growth transmitted via trade links. The second risk is that there might be a deepening financial crisis and the possibility of a sustained reduction in external finance. This would be most important for those emerging markets with large CADs. These forces will take some time to play out fully, but at present it appears the EU8+2 have been relatively unscathed. While emerging market bond spreads have increased during this episode, they remain at close to historic lows. The financial system transparency and governance practices and the reserve positions of the EU8+2 are strong and compare favorably with those prevailing in emerging markets during previous periods of turbulence. Macroeconomic polices are geared towards eventual euro adoption and are under the scrutiny of the EC. Moreover, among emerging markets, the recent increase in volatility has been greatest in Asia and Latin America where trade and economic linkages are stronger with the US than with Europe. A slowdown in US consumption would not likely have a severe direct impact on the EU8+2 countries, some of which are currently growing in excess of potential. The consequences of a reversal, or even simply a stoppage, of financing flows for those countries in the region with large CADs and dependent on the more volatile forms of external finance are potentially more serious, but as yet little evidence of such developments has emerged. In this atmosphere of short term turbulence it is important not to lose sight of the longer term trends and the fundamental challenges the EU8+2 continue to face. GDP growth in 1Q was very strong. In 2Q, before the latest financial turbulence, it slowed somewhat in several of them (HU, PL, EE, LT) in line with developments in the EU15. However, with the exception of Hungary, growth remains high throughout the EU8+2 and in the case of Latvia represents serious overheating. This growth is sustained largely by consumption and investment. With tightening labor markets, large increases in real wages and employment and very rapid credit 1 Prepared by a team of World Bank economists in the region led by Ron Hood and including Paulina Hołda, Stella Ilieva, Leszek Kasek, Ivailo Izvorski, Emilia Skrok, Matija Laco, Sanja Madzarevic-Sujster, Anton Marcincin, Catalin Pauna, Ewa Korczyc and Jan Rutkowski. Interns Piotr Żukowski and Adam Czerniak provided research assistance.
Transcript of Regular Economic Report World Bank EU8+2 EU8+2...

1
World Bank EU8+2 Regular Economic Report
September 20071
EU8+2
HIGHLIGHTS OF THE REPORT
---MAIN REPORT--- Events in global financial markets in recent weeks following developments in the US housing and mortgage market, and a reappraisal of risk have been dramatic. Shock waves coursing throughout the international system triggered a series of rare interventions by the US and European central banks, and increased volatility in equity and bond markets. The “benign” international financial conditions faced by the EU8+2 for several recent quarters, and the prospect of continued robust global growth, suddenly looked much less certain. Even the expectation of monetary tightening in the Eurozone and the US has shifted as the US cut its target rate and the discount rate.
The current turbulence represents a test of the resilience of the EU8+2. While there has been a partial reversal of the initial movements of asset prices, bond spreads, and currency values, the episode may not be over and there may be further developments both in the US and in international markets. There remain two distinct risks for the EU8+2 as well as other emerging markets. The first is that tightening credit will weaken growth in developed markets with implications for emerging market growth transmitted via trade links. The second risk is that there might be a deepening financial crisis and the possibility of a sustained reduction in external finance. This would be most important for those emerging markets with large CADs.
These forces will take some time to play out fully, but at present it appears the EU8+2 have been relatively unscathed. While emerging market bond spreads have increased during this episode, they remain at close to historic lows. The financial system transparency and governance practices and the reserve positions of the EU8+2 are strong and compare favorably with those prevailing in emerging markets during previous periods of turbulence. Macroeconomic polices are geared towards eventual euro adoption and are under the scrutiny of the EC. Moreover, among emerging markets, the recent increase in volatility has been greatest in Asia and Latin America where trade and economic linkages are stronger with the US than with Europe. A slowdown in US consumption would not likely have a severe direct impact on the EU8+2 countries, some of which are currently growing in excess of potential. The consequences of a reversal, or even simply a stoppage, of financing flows for those countries in the region with large CADs and dependent on the more volatile forms of external finance are potentially more serious, but as yet little evidence of such developments has emerged.
In this atmosphere of short term turbulence it is important not to lose sight of the longer term trends and the fundamental challenges the EU8+2 continue to face. GDP growth in 1Q was very strong. In 2Q, before the latest financial turbulence, it slowed somewhat in several of them (HU, PL, EE, LT) in line with developments in the EU15. However, with the exception of Hungary, growth remains high throughout the EU8+2 and in the case of Latvia represents serious overheating. This growth is sustained largely by consumption and investment. With tightening labor markets, large increases in real wages and employment and very rapid credit
1 Prepared by a team of World Bank economists in the region led by Ron Hood and including Paulina Hołda, Stella Ilieva, Leszek Kasek, Ivailo Izvorski, Emilia Skrok, Matija Laco, Sanja Madzarevic-Sujster, Anton Marcincin, Catalin Pauna, Ewa Korczyc and Jan Rutkowski. Interns Piotr Żukowski and Adam Czerniak provided research assistance.

2
expansion, a moderate slowdown in growth may in fact be desirable in the countries showing signs of overheating.
Foreign trade continued to expand in the first half of 2007 with trade deficits widening in some EU8+2 countries on the back of domestic-demand-driven imports. External imbalances deepened further in the most vulnerable countries, in Latvia exceeding 24% of GDP and in Bulgaria 19% of GDP. Only in the Czech Republic, Hungary, Slovakia, and Estonia did trade deficits actually improve. The CADs shrank only in the latter three. On the financing side in most countries the deficits were covered by FDI. Meanwhile in the Baltic countries, which have the largest imbalances, banking sector foreign borrowing remains the primary source of financing, driving gross external debt to very high levels.
Inflationary pressures have been rising in most of the EU8+2 countries this year, reflecting strengthened domestic demand and strong wage growth, as well as higher prices for food and imported energy. The y-o-y average inflation rate among the EU8+2 rose to 3.8% by August 2007 from 3.2% in December 2006, compared with little change in the eurozone inflation which dropped by 0.2 pp since December 2006. Inflation has surged further in August on the back of higher food prices reflecting this summer’s drought. The balance of risks for inflation and for central bank interest rates remains on the upside for the remainder of the year, with real wages growing faster than productivity in most countries.
Recent events in international capital markets present additional challenges to the EU8+2 in terms of inflation and monetary policy. The inflation-containing appreciation of floating EU8+2 currencies over the recent past seems to have abated and some currencies have depreciated, creating inflationary pressures via the rising cost of tradable goods. These pressures may need to be countered by tighter monetary policies, carefully calibrated against the actions of the ECB and Federal Reserve as they seek to settle markets in the short term.
Efforts towards fiscal consolidation continue to be insufficient. Measured as a share of GDP, public spending increases may not appear large, but GDP growth itself has been rapid and the authorities need to examine closely whether such large increases in real public expenditure can be made efficiently. There may be some erosion of fiscal positions going forward, as current information suggests fiscal loosening or at best no consolidation should be expected in about half of the countries. Any slowdown from global sources would cut into the recent pattern of revenue over performance.
---SPECIAL TOPIC--- Unemployment has fallen substantially in virtually all EU8+2 countries since 2004 due to strong growth in labor demand. This has given rise to skill shortages and associated wage pressures, often amplified by out-migration of EU8+2 workers. However, employment/working age population ratios remain relatively low.
In contrast to the earlier period of weak labor demand it is now the supply side of the labor market that constrains new job creation. Many persons of working age are economically inactive in EU8+2 either because they lack skills demanded by employers, or because of labor supply disincentives, such as early retirement benefits, generous disability schemes, high payroll taxes, and limited opportunities for flexible work arrangements. These effects are concentrated among the younger and older workers, while the participation rates for middle aged workers are similar to those of the EU15.
Hence the main challenge facing now EU8+2 is to mobilize labor supply to meet the demand. Addressing the emerging skills shortages is particularly important, because failure to do so will constrain job creation and future economic growth. To increase the effective labor supply EU8+2 countries need to: (a) improve labor supply incentives through reforming the social security systems, (b) improve worker skills through reforming the educational systems and improving domestic mobility; and (c) import labor with skills that are in short supply by opening labor markets to foreign workers. The weights assigned to each policy depend on the nature of the most binding constraint to labor supply, which vary across countries.

3
External Environment
Expectations of a continuation of the spirited global growth of the past several quarters have been shaken by the events in the US sub-prime mortgage market. The ensuing contraction of liquidity in the interbank markets in the US and Europe has accompanied a general reassessment and repricing of risk, and a global flight to quality. While there has been a partial reversal of the initial sharp movements of asset prices, bond spreads, currencies and financial flows, the episode is not over and there may be further bouts of instability both in the US and in international markets. There remain two distinct risks for the EU8+2 as well as other emerging markets. The first is that tightening credit conditions will hurt growth in developed markets with implications for emerging market growth transmitted via trade links. Growth is set to slow in developed markets, with most official bodies, including the OECD, the EC and the Federal Reserve, together with private sector forecasters, predicting a deceleration of about 0.2-0.4 in the US and the eurozone. Whether such a slowdown will affect the EU8+2 countries is less from certain; be as it may, growth in these countries has already decelerated this year. Of greater concern would be a deepening of the financial tensions and the possibility of a sustained reduction in external finance especially for those emerging markets with large CADs. So far, however, there is little evidence of these more serious consequences surfacing among the EU8+2.
1. Recent turbulence in the US sub-prime debt market has translated into a tightening of liquidity, triggering extraordinary measures by the US Federal Reserve, the Bank of England, the ECB and other central banks. In the wake of worsening performance of the US mortgage and structured markets (CDOs, see Box 1) there has been a general flight to quality causing US treasury bill yields to plunge (Chart 1) and a number of global players have been forced to close better performing positions creating turbulence across other asset classes and regions. Short-term market interest rates (Chart 2) and market volatility jumped (Chart 3) and the liquidity squeeze prompted the central banks in the euro area, US, UK, and Australia to provide liquidity injections to ease the pressure. In a bid to normalize short-term funding markets, on August 17 the US Federal Reserve cut its discount rate by 50 bps and announced it will extend loans against a wider range of collateral (including mortgages) for up to 30 days, as opposed to the standard overnight period. The US central bank further cut its key federal funds rate and the discount rate by 50 basis points on September 18, concerned that the risk of recession triggered by the shakeout of financial market confidence outweighs the risk of inflation trending higher. Despite some relief in the equity markets following the central banks’ measures, credit markets remain vulnerable, with full impact of losses yet to be revealed. There is still some risk that the current credit turmoil may expand.
Chart 1. US Treasury bill yields
3.0
3.5
4.0
4.5
5.0
5.5
Jan-07 Feb-07 Apr-07 Jun-07 Aug-07
3M 2Y 10Y
Source: Reuters.

4
Chart 2. Libor rates Chart 3. Implied volatility, VIX
3.03.54.04.55.05.56.06.57.0
16-Jul 29-Jul 11-Aug 24-Aug
US Libor Euro zone LiborCanada Libor UK Libor
0
10
20
30
40
Jan-06 Mar-06 May-06 Jul-06 Sep-06
Source: Reuters. Source: Reuters.
Box 1. US sub-prime mortgage and CDO markets
The immediate cause of the current market turmoil can be traced to the US sub-prime mortgage market which had been booming in recent years. This market evolved in an environment of historically low real interest rates, surging real estate prices and the development of new financial instruments that spread risk more widely, including to foreign and leveraged investors. Sub-prime mortgages were offered to individuals who, due to low credit worthiness or poor previous credit history, do not qualify for a regular mortgage (about 25% of all Americans). This asset class presents more risk, but at the same time yields more profit as long as individuals are able to service their debt.
In order to transfer credit risk banks create structures in which they bundle groups of obligations into various risk classes which are then sold to other market participants in the form of Collateralized Debt Obligations (CDOs). Collectively the buyers of CDOs bear the risk that the underlying obligation is not paid. Thus the risks of mortgage obligations are spread. To address investors preferences CDOs are structured in tranches of different quality (defined by risk and yield). Each tranche is rated by an independent rating agency, with the best tranches often rated at the safest (triple-A) rate. In the event of default, available payments are made in priority of risk class.
Problems arose from two basic facts. First, it is apparent that the risks of default on the underlying mortgages (and similar assets) were underestimated. The mortgage-backed securities market expanded robustly on the back of the US real estate boom and low interest rates. The sub-prime segment developed particularly fast, as apparently banks loosened their credit standards, on the back of growing asset prices. Sub-prime mortgage default rates started to go up as real estate markets weakened and interest rates rose.
High-yielding CDOs proved to be of low quality, underlining valuation and ratings problems2. Moreover, a substantial bulge of floating rate mortgages remains to be rolled over in the near future at now higher rates.
2 Due to lack of a liquid secondary market for CDOs with valuations based on models using limited data.

5
Chart 4. Sub-prime 60 day delinquencies by mortgage vintage year, adjustable rate mortgages, in percent of payments due
Chart 5. Itraxx crossover*, bp
0
2
4
6
8
10
12
0 10 20 30 40 50 60
2006
2005
2004
2003
months after origination
150
200
250
300
350
400
450
500
550
Jan-07 Feb-07 Apr-07 May-07 Jul-07 Aug-07
Source: JPMorgan Chase & Co. * index of 50 high-yield, junk-rated corporate bonds, key barometer of credit market sentiment Source: Reuters.
Second, a significant portion of the CDOs were held by investors who had been financing themselves in the short term commercial paper market. As the default rates rose, these investors could no longer access the commercial paper market. Commercial paper was generally shunned and rates rose as investors fled to treasuries and other high quality debt instruments (Chart 5). The problems in the commercial paper market triggered the activation of backup lines or credits with sponsoring banks, putting the liquidity of selected banks under pressure and forcing central banks to step in to arrest the contagion. In mid-July Bear Stearns was forced to liquidate its two ‘structured credit strategies’ funds, with assets previously reported at USD 20bn. Given a number of similar cases revealed since then (BNP Paribas, Dillon Read), the phenomenon of leveraged overexposure to subprime-backed securities, however difficult to estimate, may be more widespread.
2. The credit market developments spilled over into the global equity, debt and currency markets causing concerns about contagion effects. On the back of investor flight away from riskier assets, stock indices around the world recorded significant declines. On August 16 (a day before the Fed rate cut) the main Warsaw index closed down 6.3%, Prague fell 5.5%, Budapest 4.2% - yet still performing better than Turkey (down 6.7%), Indonesia (5.9%) or Philippines (6.0%). In China, the stock index weakened slightly by 2.1%, but rebounded strongly afterwards.
Chart 6. Stock market performance in Visegrad countries, BG and RO
Chart 7. Stock market performance in the Baltics and Slovenia
Chart 8. Stock market performance, developed economies
80
85
90
95
100
105
110
115
2-Jul 17-Jul 1-Aug 16-Aug 31-Aug
PL
CZ
HU
BG
RO
SK
80
85
90
95
100
105
110
115
120
2-Jul 17-Jul 1-Aug 16-Aug 31-Aug
EE
LT
LV
SI
80
85
90
95
100
105
110
115
120
2-Jul 17-Jul 1-Aug 16-Aug 31-Aug
DE_DEX
US_DJIA
RU_IRTS
US_S&P500
UK_F
July 2, 2007 = 100. Source: Reuters July 2, 2007 = 100. Source: Reuters July 2, 2007 = 100. Source: Reuters
3. However, the effects for emerging markets have so far been less than feared. While some stocks in emerging markets fell, some among the EU8+2 have actually risen over their

6
early July levels, and generally the performance has not been much worse than that of developed country stock markets (Chart 6, Chart 7, Chart 8). Most striking perhaps though, is the behavior of the bond markets. Although EMBI spreads have increased, the minor uptick since July is very modest compared with the much higher spreads prevailing over the last several years (Chart 9) and with the sharply rising volatility the US stock market (Chart 10).
Chart 9. EMBI spreads Chart 10. EMBI spread vs implied volatility
0
500
1000
1500
2000
Jan-98 Jan-99 Jan-00 Jan-01 Jan-02 Jan-03 Jan-04 Jan-05 Jan-06 Jan-07
EMBI+ spreadEMBI+ LatAm spreadEMBI+ Asia spreadEMBI+ Europe spread
0100200300400500600700800900
100011001200
Jan-00 Jan-01 Jan-02 Jan-03 Jan-04 Jan-05 Jan-06 Jan-070
5
10
15
20
2530
35
40
45
50EMBI+ spread (RHS)VIX (LHS)
Source: Reuters Source: Reuters
4. The EU8+2 were less affected than other emerging markets. Bond spreads widened in all emerging markets since early August but more so in Asia and Latin America than in Europe. Currency movements were also less pronounced in EU8+2. Major equity markets declined worldwide (except in China), but the performance of the EU8+2 indices was the same or better than those of major industrial countries. Within the region the greatest losses were recorded in Hungary (Chart 6), with the equity index losing 14% and local currency 8.2% since July, 24 (Poland was also significantly affected, more due to technical correction after stock exchange rally earlier in 2007 than weaker fundamentals). In a broader context, other emerging markets, in particular Turkey, reacted much more sharply to the turmoil. Since mid August, the Fed decision and easing of liquidity pressures have helped to reverse these trends with emerging markets rebounding and regaining part of the losses.
Chart 11. Selected EU8+2 bond spreads, in bp
0
20
40
60
80
100
Jan-07 Feb-07 Apr-07 Jun-07 Aug-07
LT
RO
BG LV
0
20
40
60
80
100
Jan-07 Feb-07 Apr-07 Jun-07 Aug-07
HU PL
CZSK
Notes : 10Y eurobonds, vs. Eurozone Source: Reuters

7
Chart 12. EMBI+ spreads
0
50
100
150
200
250
300
Jan-07 Apr-07 Jul-07
EMBI+ spreadEMBI+ Russia spreadEMBI+ LatAm spreadEMBI+ Asia spreadEMBI+ Europe spread
Source: www.cbonds.info
Table 1. Performance of equities and currencies of emerging markets
Equity markets, stock indices, %
change Currencies, vs. USD, %
end 2006 - July, 24
lowest level since
July, 24
recovery from
lowest levels (as of Sep 14)
lowest
level since July, 24
recovery from
lowest levels (as of Sep 14)
Czech Republic 15.9 -10.2 6.2 -1.9 4.7 Estonia 14.2 -10.1 3.1 -3.1 3.6 Hungary 19.6 -14.0 5.4 -8.2 5.9 Latvia 11.5 -3.8 7.5 -3.1 2.8 Lithuania 16.3 -7.1 3.7 -2.9 3.3 Poland 29.4 -14.9 7.8 -4.2 4.9 Slovakia 0.7 0.0 3.2 -4.9 3.7 Bulgaria -5.5 0.1 0.2 -2.9 3.4 Romania 34.3 -13.7 6.5 -7.2 0.4 Croatia 55.6 -6.9 0.0 -2.6 3.3 Russia 6.7 -11.2 6.2 -2.0 2.2 South Africa 18.8 -12.2 10.5 -7.7 3.2 Turkey 37.4 -18.2 12.8 -10.7 11.0 Argentina 7.2 -18.2 11.3 -0.6 1.5 Brazil 25.5 -13.9 13.9 -11.1 9.9 Mexico 19.0 -11.7 9.0 -3.2 0.7 Hong Kong 17.6 -13.1 22.1 -0.1 0.5 Indonesia 33.0 -20.5 16.6 -4.5 1.0 Malaysia 27.0 -14.4 8.2 -3.2 0.9 Taiwan 24.5 -17.0 11.6 -1.0 0.2 Thailand 29.6 -14.8 8.2 -12.7 0.0 DJIA 6.5 -6.9 5.5 SP500 9.3 -7.2 6.1 NASDAQ 18.3 -6.9 3.7 DAX 4.1 -9.8 8.6
Source: ISI, Reuters, staff calculations.
5. Some signs of weakening of the global economy were already visible in 2Q and prospects going forward are now clearly less buoyant given the recent financial market turbulence. Considerable uncertainty remains about the implications of the ongoing financial market developments for real economies. Declining asset prices, tightening financing conditions and lower confidence are likely to translate into weaker consumption in the United States, with spillovers in a number of other regions. This would add to a slowdown that was already beginning to appear before events of July-August. Accordingly, GDP growth in the US is expected to decelerate in 2H 2007, while 2Q actual figures have been revised downwards. Meanwhile, in the Eurozone, after a disappointing 2Q (especially in Germany and France),

8
growth is expected to pick up slightly later in 2007, but the growth upswing of the last several quarters seems to be coming to an end. Recent quarterly OECD forecasts for 2007 show slight downward revisions, in particularly in the US (Table 2).
Table 2. OECD growth forecasts 2Q06 3Q06 4Q06 1Q07 2Q07 3Q07E 4Q07E 2006 2007E
q/q, SAUS 0.6 0.5 0.6 0.2 1.0 0.5 0.4 3.3 1.9 ↓ (2.1)Euro area 1.0 0.6 0.9 0.7 0.3 0.6 0.5 2.6 2.6 ↓ (2.7)Japan 0.3 0.1 1.3 0.8 0.1 0.5 0.5 2.2 2.4 (2.4)Germany 1.2 0.8 0.9 0.5 0.3 0.6 0.5 2.7 2.6 ↓ (2.9)France 1.1 0.0 0.6 0.5 0.3 0.6 0.5 2.0 1.8 ↓ (2.2)Italy 0.6 0.3 1.1 0.3 0.1 0.3 0.4 1.9 1.8 ↓ (2.0)
Notes: for 2007 and 2008 previous forecasts from OECD Economics Outlook May 2007 were included in parenthesis. Source: OECD, Interim Assessment, September 5, 2007.
6. The effects of a moderate global slowdown may not be that severe for the EU8+2. While exports from the EU8+2 have been increasing, domestic demand stemming from growing employment and wages, remains the main driver of GDP growth. Indeed the Baltics, Romania and Bulgaria have been wrestling with overheating problems. Moreover, the most important export markets for the EU8+2 are in the EU15 (see Output Developments section), and unlike Latin America and Asia, exposure to the US market is relatively small.
7. The effects of deepening financial turbulence would potentially be more serious for the EU8+2, but are more difficult to predict. The greatest risk is that the countries that have large current account deficits – the Baltics, Romania and Bulgaria – are suddenly less able to finance them through capital inflows and are forced into an economic contraction. This is particularly true for countries like Hungary that are highly dependent on more volatile portfolio inflows than on FDI. Banking sector foreign borrowing which is the main financing source in the Baltics is generally less volatile than portfolio flows, but the extreme surge in the Latvian CAD (to 30% of GDP in the 12 months to end July ) clearly cannot be financed in this way in a sustained manner. There are other potential risks as well. A general retreat from mortgage lending provoked by US experience would lead to broad based credit tightening and weaken the booming construction sector in the EU8+2. Moreover, the increased risk sensitivity may cause the unwinding of carry trades making external finance more difficult for higher interest, carry trade destination countries. Until now, however, these more serious consequences do not appear to have emerged in strength.
8. Commodity price have risen. The price of oil recently reached an all time high of over USD 80 per barrel. Gold also hit a 27-year high in September and wheat prices are being strongly influenced by severe drought in Australia.
OUTPUT DEVELOPMENTS
Output growth slowed somewhat in 2Q following strong expansion in 1Q (aside from Hungary) which was driven largely by domestic demand - for consumption in the case of the Baltic States and Romania - and for investment in the case of in Poland, Slovenia and Bulgaria. Sources of growth were more balanced in the Czech Republic and Slovakia. Growth in value
Chart 13. Brent
40
45
50
55
60
65
70
75
80
85
Jan-
06
Mar
-06
May
-06
Jul-0
6
Sep-
06
Nov
-06
Jan-
07
Mar
-07
May
-07
Jul-0
7
Sep-
07
Source: Reuters.

9
added remains largely generated by market services and industry, but recently the construction sector has expanded rapidly, with its share of overall growth increasing across the region. Over the remainder of the year and into 2008 growth is likely to continue to be dominated by domestic demand. The effects of a possible US slowdown are likely to be relatively minor unless they sharply slow the economies of Europe with which the EU8+2 trade most intensively. Neither the consensus growth estimates for 3Q and beyond, nor those of the national authorities have been significantly adjusted in the wake of the turbulence. However, some indices of market sentiment have softened and evidence is mounting that real estate markets in the Baltics have softened sharply which could have implications for the construction sector. Vulnerability to capital flight or stoppages remains, especially for the countries with large current account deficits.
9. With the exception of Hungary, the EU8+2 recorded impressive output growth in the first quarter 2007, but preliminary figures for the second quarter suggest that it has lost some strength in all countries apart from Bulgaria and Slovakia -Chart 14. The mere 1.2% growth in Hungary confirms that fiscal adjustment, while necessary, involves a costly and painful decline in domestic absorption. GDP growth in Poland returned to the past trend after a record high expansion in the first quarter of 2007 that was partly attributable to a warm winter that enabled an extraordinary boost in construction. In line with expectations, significant slowdown was observed in Estonia, mainly due to gradual decline in domestic demand. However, a further slight dampening effect (estimated at 0.5 to 1 percentage point of GDP) may have come from the Russian actions following political turmoil in April, including Russian embargoes on transit trade and reported boycott of Estonian products in Russia3.In the Czech Republic, Lithuania, and Romania, where the slowdown was marginal, and also in Bulgaria and Slovakia, which observed a slight acceleration, growth remained stable and high. Despite a slight deceleration, Latvia still exhibits symptoms of overheating with output growth apparently higher than potential. The youngest euro area member – Slovenia enjoyed remarkable output performance in the first quarter (+7.2%), but the data for the second quarter proved it would be difficult to sustain for 2007 as a whole.
10. Domestic demand remains the main driver of GDP growth across the region, with the exception of Hungary, where (aside from changes in stocks) only external demand contributed positively to output growth in the first half of this year. While the contribution of net exports was positive in Slovakia and close to zero in the Czech Republic, it was large and negative but shrinking in Bulgaria, Estonia, and Latvia and negative and widening in Lithuania, Poland, Slovenia and Romania. (Chart 15).
11. The growth of domestic demand was predominantly sustained by consumption in the Baltic States, Slovakia, and Romania, while investment was the main driving force in Poland, Slovenia and Bulgaria. In the Czech Republic, half of the growth of domestic demand was due to consumption and half to inventory accumulation. A strong change in stocks was responsible for higher than expected GDP growth in Poland in the second quarter of 2007. Nevertheless, apart from Latvia which is the fastest growing country in the region, the growth rate of fixed investment outperformed consumption in all countries (Chart 16). It accelerated
3 Russia relies on Estonia for the transit of around 1/3 of its heavy petroleum products. After 10 day embargo in April and the reduction of shipment intensity imposed in June, shipments returned to normal levels in August.
Chart 14. GDP growth rates (% yoy)
02468
10121416
CZ EE HU LV LT PL SK SI BG RO
3Q 06 4Q 06 1Q 07
2Q 07 2006
Source: CSOs

10
in a half of them in the second quarter of 2007 as compared to the first quarter of this year (and slowed down but remained robust in Bulgaria, Lithuania, Poland, Slovenia, and Slovakia).
Chart 15. Contribution to GDP growth, yoy, percentage points
-15
-10
-5
0
5
10
15
20
25
4Q 0
6
1Q 0
7
2Q 0
7
4Q 0
6
1Q 0
7
2Q 0
7
4Q 0
6
1Q 0
7
2Q 0
7
4Q 0
6
1Q 0
7
2Q 0
7
4Q 0
6
1Q 0
7
2Q 0
7
4Q 0
6
1Q 0
7
2Q 0
7
4Q 0
6
1Q 0
7
2Q 0
7
4Q 0
6
1Q 0
7
2Q 0
7
4Q 0
6
1Q 0
7
2Q 0
7
4Q 0
6
1Q 0
7
2Q 0
7
CZ EE HU LV LT PL SK SI BG RO
Statistical discrapencyNet exportsChange in inventoriesGross f ixed capital formationFinal consumption expenditure
Note: Because of relatively high statistical discrepancy, the contributions in Estonia, in particular this of net exports should be interpreted with caution. Source: CSOs, Eurostat, ISI, staff calculations.
12. Most countries in the region enjoy robust consumption growth. This has largely been sustained by increasing wage bills. Strong real wage growth is accompanied by rapid job creation. Further impetus comes from robust bank lending to households, and expansionary fiscal stances in some countries (the Baltic States, Romania). The increase in household wealth due to galloping asset prices during the boom phase of equity markets, which has since slowed, is now playing a less important role.
Chart 16. Consumption, Investment and GDP growth, yoy, %
-5
0
5
10
15
20
25
30
35
40
4Q 0
61Q
07
2Q 0
74Q
06
1Q 0
72Q
07
4Q 0
61Q
07
2Q 0
74Q
06
1Q 0
72Q
07
4Q 0
61Q
07
2Q 0
74Q
06
1Q 0
72Q
07
4Q 0
61Q
07
2Q 0
74Q
06
1Q 0
72Q
07
4Q 0
61Q
07
2Q 0
74Q
06
1Q 0
72Q
07
CZ EE HU LV LT PL SK SI BG RO
ConsumptionGross Fixed InvestmentGDP
Source: CSOs.
13. Value added growth is still generated largely by market services and industry, while developments in construction and agriculture are especially volatile this year because of weather anomalies. The expansion of construction was affected positively in several countries in the first quarter of 2007 (the Baltic States, Poland, Romania, and the Czech Republic) – see: Box 2. This sector has become increasingly important for growth across the region in recent years.

11
14. Agricultural production may surprise negatively in the second half of this year in countries in the south of the region because of the severe and protracted drought. However, because of the small share of agriculture in total value added (usually below 5%) the impact will be more important for prices than for output developments. The negative supply shock in the cereal markets in different parts of the world (South Europe, China, Australia) placed upward pressure on global food commodity prices. Rising food prices have to be treated as additional pro-inflation factor by central bankers who are already concerned about the inflationary effects of tightening labor markets (see below).
Chart 17. Contribution to gross value added growth, yoy, percentage points
-5.0
0.0
5.0
10.0
15.0
20.0
4Q 0
6
1Q 0
7
2Q 0
7
4Q 0
6
1Q 0
7
2Q 0
7
4Q 0
6
1Q 0
7
2Q 0
7
4Q 0
6
1Q 0
7
2Q 0
7
4Q 0
6
1Q 0
7
2Q 0
7
4Q 0
6
1Q 0
7
2Q 0
7
4Q 0
6
1Q 0
7
2Q 0
7
4Q 0
6
1Q 0
7
2Q 0
7
4Q 0
6
1Q 0
7
2Q 0
7
4Q 0
6
1Q 0
7
2Q 0
7
CZ EE HU LV LT PL SK SI BG RO
Agriculture IndustryConstructions Market ServicesNon-market services
Notes: The breakdown of services into market and non-market ones is not available for Bulgaria and Romania. For Bulgaria, construction is reported together with industry. Source: Eurostat, ISI, CSOs.
Box 2: Construction sector developments The construction sector is flourishing in the EU8+2. The share of the construction sector in gross value added is growing in all countries across the region but Hungary. In 2006 real growth of the sector ranged from 2.2% in the Czech Republic to more than 19% in Lithuania and Romania (Table 3) and the share of construction in value added in 2006 ranged between 4.7% in Hungary to more than 8.6% in Lithuania) making it one of main contributors to overall GDP growth. Table 3. Construction sector in EU8+2
2001
-200
5
2006
2001
-200
5
2006
2001
-200
5
2006
2001
-200
5
2006
2001
-200
5
2006
2001
-200
5
2006
2001
-200
5
2006
2001
-200
5
2006
2001
-200
5
2006
2001
-200
5
2006
2001
-200
5
2006
Construction real growth yoy 1.6 2.2 8.7 13.3 4.4 -3.2 11.9 13.6 12.0 19.8 -2.0 14.7 3.9 9.8 1.4 11.8 5.7 9.9 8.9 19.4 1.2 4.0
Share of value added % 6.4 6.8 6.3 8.0 5.0 4.7 5.7 6.8 6.8 8.6 6.1 6.6 6.6 6.9 5.8 6.2 4.7 5.9 6.5 7.9 5.8 6.2
Contribution to VA ppp 0.1 0.1 0.5 1.0 0.2 -0.2 0.7 0.8 0.8 1.5 -0.2 0.9 0.2 0.7 0.1 0.7 0.3 0.5 0.5 1.4 0.1 0.2
Growth in no. of employees yoy 0.0 -0.9 3.9 23.4 3.2 1.6 10.4 20.2 9.4 13.2 -0.6 3.4 1.3 9.1 0.6 7.2 5.3 10.1 1.5 2.8
Share of emplyment % 11.5 8.4 9.7 9.1 10.1 8.1 10.2 10.0 9.6 9.8 5.9 4.6 9.2 7.3 9.3 8.0 5.5 5.2 9.6 7.4
Contribution to empl 0.0 -0.1 0.4 1.8 0.3 0.1 0.9 1.8 0.9 1.2 0.0 0.2 0.1 0.6 0.1 0.5 0.3 0.5 0.1 0.2
BG RO EU15LT PL SK SICZ EE HU LV
Source: CSOs, Eurostat, Bank staff calculations.
The construction boom is most pronounced in the Baltic countries, Bulgaria and Romania (Chart 18). While most of the countries in the region are seeing growth of construction output, the performance across states varies considerably. After impressive growth in the 1Q 2007 (mainly due to favorable weather conditions), the second quarter 2007 saw a further expansion in construction in Slovenia, Lithuania, Romania, Poland and Latvia. The rates of

12
change for total construction activity are broadly in line with those for building and civil engineering. Chart 18. Volume Index of Production (Building and civil engineering; 2000=100)
0
50
100
150
200
250
300
350
1Q 0
03Q
00
1Q 0
13Q
01
1Q 0
23Q
02
1Q 0
33Q
03
1Q 0
43Q
04
1Q 0
53Q
05
1Q 0
63Q
06
1Q 0
73Q
07
CZ HU
PL SK
0
50
100
150
200
250
300
350
1Q 0
03Q
00
1Q 0
13Q
01
1Q 0
23Q
02
1Q 0
33Q
03
1Q 0
43Q
04
1Q 0
53Q
05
1Q 0
63Q
06
1Q 0
73Q
07
EE LVLT SI
0
50
100
150
200
250
300
350
1Q 0
03Q
00
1Q 0
13Q
01
1Q 0
23Q
02
1Q 0
33Q
03
1Q 0
43Q
04
1Q 0
53Q
05
1Q 0
63Q
06
1Q 0
73Q
07
BG
RO
Source: Eurostat.
The EU8+2 region is witnessing a boom in both housing and civil engineering sectors (Chart 19). The outstanding performance in civil engineering was to a large extent triggered by public investment spending sustained in part by inflows of EU structural and cohesion funds. The share of public investment to GDP grew more in 2006 than in 2001-2005 in all countries but Estonia, Slovakia and Romania (Chart 20). The Baltic countries, which received the largest amount of EU structural funds relative to their GDP, recorded outstanding performance in terms of construction output in civil engineering (Chart 21). The impressive growth of building construction is associated with strong growth in consumption.
Chart 19. Y-o-Y change in Volume Index of Production
Building and civil engineering Buildings Civil engineering
-10.00.0
10.020.030.040.050.060.070.0
CZ EE HU
LV LT PL SK SI BG RO
1Q 07 2Q 072006 EA12 (1Q 07)
-10.00.0
10.020.030.040.050.060.070.0
CZ EE HU
LV LT PL SK SI BG RO
1Q 07 2Q 072006 EA12 (1Q 07)
-20.0
0.0
20.0
40.0
60.0
80.0
CZ EE HU
LV LT PL SK SI BG RO
1Q 07 2Q 072006 EA12 (1Q 07)
Source: Eurostat.
Chart 20.Share of public capital spending to GDP
Chart 21. Share of structural funds inflows to GDP
0.0
1.0
2.0
3.0
4.0
5.0
6.0
CZ EE HU LV LT PL SK SI BG RO
2001-2005 2006
0
0.2
0.4
0.6
0.8
1
1.2
1.4
1.6
HU CZ PL SK SI LT EE LV
2004 2005 2006p
Source: Eurostat.
The overall prospects for the construction sector remain favorable, although there are some worrisome signs. Strong economic growth in the region as well as EU funds inflow will favorably influence further performance of the sector. On the other hand, rising wages, increasing prices for material and labor market tightening signal emerging bottlenecks. Increasingly construction specialists in EU8+2 claim that labor shortages are serious obstacle to further growth. (Chart 22) There are also clear signs that the real estate market in the Baltics has cooled considerably and

13
this would be expected to have negative repercussions for the construction industry.
Chart 22. Shortage of labor as a problem for the construction sector
0102030405060708090
Jan-
04
Jul-0
4
Jan-
05
Jul-0
5
Jan-
06
Jul-0
6
Jan-
07
Jul-0
7
EE LV LT SI
0
5
10
15
20
25
30
Jan-
04
Jul-0
4
Jan-
05
Jul-0
5
Jan-
06
Jul-0
6
Jan-
07
Jul-0
7
CZ HU
PL SK
0
5
10
15
20
25
30
Jan-
04
Jul-0
4
Jan-
05
Jul-0
5
Jan-
06
Jul-0
6
Jan-
07
Jul-0
7
BG RO
Source: EC- Economic Sentiment Indicator
15. The impact of an eventual slowdown of US consumption on the EU8+2 should be modest unless it is significantly deeper than currently expected and affects the eurozone – the main export market for the region. Notwithstanding weaker trade links with the US (on average below 3% of overall exports in the region, (Chart 23), EU membership and prospects for euro adoption may help to insulate the EU8+2 from abrupt shifts of global investor sentiment towards emerging markets.4
Chart 23. Geographical destination of exports of the EU8+2, structure in %
2.12.3
2.4
1.7
1.53.21.52.2
5.6
2.0
0%
20%
40%
60%
80%
100%
2004
2005
2006
Jan-
May
07
2004
2005
2006
Jan-
May
07
2004
2005
2006
Jan-
May
07
2004
2005
2006
Jan-
May
07
2004
2005
2006
Jan-
May
07
2004
2005
2006
Jan-
May
07
2004
2005
2006
Jan-
May
07
2004
2005
2006
Jan-
May
07
2004
2005
2006
Jan-
May
07
2004
2005
2006
Jan-
May
07
EU15 NMS Russia USA RoW
CZ EE HU LV LT PL SI SK BG RO
Note: NMS – New Member States; RoW – Rest of the World. Source: Eurostat.
16. Are market analysts or national authorities in the region concerned about recent developments on global financial markets? Neither private sector analysts nor public authorities, who are just preparing their draft budgets 2008, have made major adjustments their macroeconomic forecasts following the events of July and August (see also section on Public Finances). Comparing market consensus forecasts from late August with those from late
4 Emerging Economies’ Liquidity Vulnerability Index made by the S&P, which takes into account factors like gross and net external borrowing needs, FDI coverage of current account deficit, real exchange rate appreciation as compared to medium-term average and other factors, suggests that globally the most vulnerable countries are Latvia, Iceland, Bulgaria, Turkey, and Romania.

14
May, and available official forecasts with scenarios projected in the recent Convergence Programs, the changes are small and in most cases upwards (as far as growth is concerned). Only in Estonia and Hungary, are market consensus forecasts of GDP growth in 2007 lower than 3 months before, and there are no changes for 2008. Except for Slovakia, inflationary pressures are expected to mount across the region and forecasts were revised upwards. Expectations concerning current account balances deteriorated in all countries, even among those already having huge double-digit current deficits. Those national authorities who revealed their macroeconomic assumptions for budgets 2008 made rather minor revisions to their forecasts from late 2006, usually in the same direction as the market consensus (see Table 4).
Table 4. Consensus and Official Macroeconomic Forecasts
2006 2007F 2008F 2006 2007F 2008F 2006 2007F 2008F 2007F 2008F 2007F 2008F 2007F 2008FAugust 2007 6.4 5.5 4.8 2.5 2.6 3.4 -3.1 -4.0 -4.4 CNB, Autumn'07 6.2 5.4 n.a. n.a. n.a. n.a.May 2007 6.4 5.2 4.8 2.5 2.5 3.1 -3.1 -4.0 -4.1 Conv. Program 4.9 4.8 2.4 2.6 -2.0 -1.0August 2007 11.4 8.8 7.4 4.4 5.5 5.8 -15.7 -18.1 -18.7 MoF, 22 Aug 8.1 7.3 6.1 7.4 -16.8 -15.9May 2007 11.4 8.9 7.8 4.4 4.9 4.8 -15.7 -15.5 -15.4 Conv. Program 8.3 7.7 4.3 4.4 -13.4 -11.8August 2007 3.9 2.5 3.0 3.9 7.4 3.8 -5.8 -4.9 -4.8 MoF, 18 Sept 2.2 2.8 7.5 4.5 n.a. n.a.May 2007 3.9 2.5 3.0 3.9 7.2 3.7 -5.8 -4.8 -4.6 Conv. Program 2.2 2.6 6.2 3.3 -3.3 -2.3August 2007 11.9 9.9 7.8 6.5 8.2 6.4 -21.1 -24.7 -23.3 Draft budget' 08 n.a. n.a. n.a. n.a. n.a. n.a.May 2007 11.9 9.2 7.8 6.5 7.6 6.1 -21.1 -21.6 -20.7 Conv. Program 9.0 7.5 6.4 5.2 -18.5 -17.7August 2007 7.5 7.9 6.6 3.8 4.7 4.5 -10.8 -13.4 -14.2 MoF, 3 Sept 8.6 6.5 5.2 5.6 -14.1** -14.4**May 2007 7.5 7.0 6.7 3.8 4.3 4.0 -10.8 -12.0 -12.2 Conv. Program 6.3 5.3 4.7 3.4 -9.8 -9.2August 2007 6.1 6.4 5.5 1.0 2.3 2.9 -2.3 -3.2 -4.1 Draft budget' 08 6.5 5.5 2.2 2.3 -4.0 -5.0May 2007 6.1 6.0 5.2 1.0 2.2 2.7 -2.3 -2.8 -3.4 Conv. Program 5.1 5.1 2.1 2.5 -2.5 -3.1August 2007 8.3 8.8 7.1 4.5 2.6 2.5 -8.3 -4.9 -3.3 MoF, Sept 8.8 6.8 2.4 2.0 -4.0 -2.6May 2007 8.3 8.7 6.8 4.5 2.7 2.6 -8.3 -4.7 -3.2 Conv. Program 7.1 5.5 3.1 2.0 -3.5 -2.8August 2007 5.2 5.1 4.5 2.5 2.8 2.7 -2.6 -2.7 -2.1 Spring' 07 4.7 4.4 3.0 2.7 n.a. n.a.May 2007 5.2 4.6 4.5 2.5 2.5 2.5 -2.6 -2.5 -1.9 Conv. Program 4.3 4.2 2.7 2.5 -1.6 -1.3August 2007 6.1 5.9 6.0 7.3 5.3 4.5 -15.8 -18.5 -17.6 Draft budget' 08 n.a. n.a. n.a. n.a. n.a. n.a.May 2007 6.1 5.8 5.8 7.3 4.9 3.9 -15.8 -15.7 -14.7 Conv. Program 5.9 6.2 2.9 1.9 -13.6 -12.7August 2007 7.7 6.3 5.7 6.6 4.1 4.3 -10.3 -14.9 -15.8 Draft budget' 08 n.a. n.a. n.a. n.a. n.a. n.a.May 2007 7.7 6.3 5.6 6.6 4.2 4.2 -10.3 -13.3 -13.3 Conv. Program 6.5 6.3 4.5 4.3 -10.3 -10.2
Note: Improvement (increase in case of output growth and current account balance and decrease - in case of inflation)*) assuming USD/LCU exchange rate from 2006
Consensus forecasts Official forecastsCurrent acc. (% of GDP*) Output, % Inflation, % CA (% of GDP)Output growth, % Inflation, average, %
BG
PL
SK
SI
LV
RO
CZ
EE
HU
LT
Source: Consensus Economics, Convergence Programs, EC, staff projections.
17. Early indicators suggest that most countries have already reached their peak growth, and 2007 as a whole will be better than 2006 only in Slovakia, Poland, Lithuania, and presumably Bulgaria. In August, indicators of economic sentiment have floated lower in most EU8+2 apart from Latvia, Romania, and Hungary. (Chart 24). While August data for Poland, Slovakia and Slovenia may have drifted down only temporarily, in the Czech Republic, Bulgaria, and in particular Estonia they seem to confirm a downward tendency and indicate some moderation of the growth rate in the third quarter of 2007.

15
Chart 24. Economic Sentiment Indicator
70
80
90
100
110
120
130
140
150
Jan-05 Jun-05 Nov-05 Apr-06 Sep-06 Feb-07 Jul-07
CZ HUPL SK
70
80
90
100
110
120
130
140
150
Jan-05 Jun-05 Nov-05 Apr-06 Sep-06 Feb-07 Jul-07
EE LVLT SI
70
80
90
100
110
120
130
140
150
Jan-05 Jun-05 Nov-05 Apr-06 Sep-06 Feb-07 Jul-07
BG RO
Source: EC.
LABOR MARKET DEVELOPMENTS
Labor markets in the region have further improved, with employment increases resulting from strong economic growth and greater responsiveness of labor supply. Growth exceeds productivity increases and is no longer jobless. During the last 2-3 years the EU8+2 labor markets have experienced a fundamental shift from a shortage of jobs to shortages of skills and workers. Just after the EU accession migration to EU-15 from some countries (Poland, Slovakia, and the Baltic states) helped to lower unemployment in the latter. However, migration is now contributing to labor shortages in selected sectors and is drawing immigrants from further east (see more in the Special Topic). These tightening conditions are contributing to increases in real wages and the wage bill.
18. In the latest quarters unemployment rates have either continued to fall or have remained fairly stable despite upward seasonal pressures. In several countries unemployment rates declined to historical minima (the Baltic States, the Czech Republic, and Poland) (Chart 25). Employment rates in Latvia, and also in Estonia reached the highest levels since the start of transition and are around 68% for people aged between 15 and 64 years, which is close to the Lisbon strategy target of 70%. Nevertheless, further employment increases may be limited because of structural nature of joblessness due to skills mismatches and unwillingness to relocate or retrain, which is particularly relevant for those who stayed out of the labor market longer (see the long-term unemployment rates in the Special Topic).
Chart 25. Unemployment rates, %
0
5
10
15
20
25
1Q 0
5
2Q 0
5
3Q 0
5
4Q 0
5
1Q 0
6
2Q 0
6
3Q 0
6
4Q 0
6
1Q 0
7
2Q 0
7
CZ HUPL SK
2
4
6
8
10
12
14
16
1Q 0
5
2Q 0
5
3Q 0
5
4Q 0
5
1Q 0
6
2Q 0
6
3Q 0
6
4Q 0
6
1Q 0
7
2Q 0
7
LV SILT EE
02468
10121416
1Q 0
5
2Q 0
5
3Q 0
5
4Q 0
5
1Q 0
6
2Q 0
6
3Q 0
6
4Q 0
6
1Q 0
7
2Q 0
7
BG RO
Source: Eurostat, Bank staff calculations
19. The recent trends have undoubtedly strengthened the power of employees in the wage bargaining process. Real wages have begun to grow rapidly in Poland where their expansion had been moderate so far (Chart 26). The highest growth is occurring in sectors which suffer most from shortages of workers (for example, construction). Rising employment and strong dynamics of real wages are pushing the growth of the wage bill into double digits (Chart 27). Nevertheless, demands of higher wages for public sector employees come into sight in most countries in the region. In Bulgaria and Poland, trade unions are prepared to resort to strikes or the threat of strikes in wage setting negotiations.

16
Chart 26. Real wage growth, yoy, %
-5.00.05.0
10.015.020.025.0
1Q 0
5
2Q 0
5
3Q 0
5
4Q 0
5
1Q 0
6
2Q 0
6
3Q 0
6
4Q 0
6
1Q 0
7
2Q 0
7
CZ PLSK HU
-5.00.05.0
10.015.020.025.0
1Q 0
5
2Q 0
5
3Q 0
5
4Q 0
5
1Q 0
6
2Q 0
6
3Q 0
6
4Q 0
6
1Q 0
7
2Q 0
7
EE LVLT SI
-5.00.05.0
10.015.020.025.0
1Q 0
5
2Q 0
5
3Q 0
5
4Q 0
5
1Q 0
6
2Q 0
6
3Q 0
6
4Q 0
6
1Q 0
7
2Q 0
7
BG RO
Source: CSOs, Bank staff calculations.
20. In several countries, there are proposals to raise minimum wages or set them at a higher percentage of the average monthly wage (Lithuania, Latvia, Poland, and Bulgaria). But in Lithuania net disposable incomes were already fuelled by income tax rates cuts of 5 percentage points (effective from July 2006). In Poland, net wages will be further boosted by a two step cut of social security contribution rates (disability contributions) equal to 3 pp. of gross salary from July 2007 and 4 pp. from January 2008. In Bulgaria, social security contribution rates will be cut by 3 pp as of October 1, 2007 while the minimum wage will increase by 22% in January 2008. Moreover, excessive wage demands or an increase of minimum wages may undermine prospects for further labor market improvement, in particular in the segment of low-skilled workers and labor market entrants.
21. In all countries apart from Slovakia and Slovenia, wages are growing faster than labor productivity. Rising unit labor costs (see Chart 28) provoke central bankers in the region to tighten monetary policies (Poland and the Czech Republic). Apart from inflationary pressures, excessive ULC growth may undermine competitiveness and prospects for sustained long-term output growth and further labor market improvement.
Chart 27. Real wage bill (yoy, %) compared with real wages growth (yoy, %)
40
20
10
0
40
20
10
0
40
20
10
0
40
20
10
0
-10-10
30
70
110
150
Mar
-05
May
-05
Jul-0
5
Sep-
05
Nov
-05
Jan-
06
Mar
-06
May
-06
Jul-0
6
Sep-
06
Nov
-06
Jan-
07
Mar
-07
May
-07
38412 38612 38812 39012 39212
Poland
Czech Republic
Estonia
Lithuania1Q
05
2Q 0
5
3Q 0
5
4Q 0
5
1Q 0
6
2Q 0
6
3Q 0
6
4Q 0
6
1Q 0
7
2Q 0
7
real growth of wage billreal growth of average wage
Source: CSOs, Bank staff calculations.

17
Chart 28. ULC – economy wide, 4-quarter moving average, yoy, %
-10
-5
0
5
10
15
201Q
200
32Q
200
33Q
200
34Q
200
31Q
200
42Q
200
43Q
200
44Q
200
41Q
200
52Q
200
53Q
200
54Q
200
51Q
200
62Q
200
63Q
200
64Q
200
61Q
200
72Q
200
7
CZ HUPL SK
-10
-5
0
5
10
15
20
1Q 2
003
2Q 2
003
3Q 2
003
4Q 2
003
1Q 2
004
2Q 2
004
3Q 2
004
4Q 2
004
1Q 2
005
2Q 2
005
3Q 2
005
4Q 2
005
1Q 2
006
2Q 2
006
3Q 2
006
4Q 2
006
1Q 2
007
2Q 2
007
SI EE BGLT LV RO
Source: CSOs, Eurostat, Bank staff calculations
INFLATION AND EXCHANGE RATE DEVELOPMENTS
Inflationary pressures have been rising in most of the EU8+2 countries this year, reflecting strengthened domestic demand and strong wage growth, as well as higher prices for food and imported energy. The yoy average inflation rate among the EU8+2 rose to 3.8% by August 2007 from 3.2% in December 2006, compared with little change in the eurozone inflation which dropped since December 2006 by 0.2pp.5 Inflation surged in August on the back of higher food prices reflecting this summer’s drought. The balance of risks for inflation and for central bank interest rates remains on the upside for the remainder of the year, with real wages growing faster than productivity growth in most countries.
22. The pickup in inflation has been most pronounced in Bulgaria, Latvia and Estonia this year (Chart 29). In Bulgaria, year-on-year inflation rose sharply to 9.3% by August reflecting a surge in food prices this summer, hikes in administered prices and strong wage pressures. Inflation in Latvia and Estonia reached 10.2% and 6.1% year-on-year in August, respectively, underpinning concerns about overheating in these economies.
23. Inflation also rose in the Czech Republic and Poland, leading central banks to hike key policy rates in both countries. Inflationary pressures in Poland have both increased, due to higher prices for food, stronger domestic demand and wage increases. Growth in average nominal wages has more than doubled to about 8% y-o-y in first half of 2007 on the back of a substantial reduction in unemployment. In the Czech Republic nominal wages grew in the 1H 2007 by 7.6%.
24. After falling through mid-year thanks to currency appreciation and delays in adjusting administered prices, inflation has risen recently in Romania. Year-on-year HICP rose to 5% in August after declining to 4.1% in July from 4.9% in December 2006.
25. In contrast, inflation in Hungary has begun to ease after surging earlier in the year as a result of hikes in excise tax rates and administered prices, enabling a reduction in central bank interest rates. Inflation in Slovakia experienced the strongest deceleration this year, helping the central bank cut official interest rates in two steps by a cumulative 50 basis points and strengthening expectations that eurozone entry is likely in 2009 as targeted by the authorities.
26. Over recent months, both energy and food prices have moved higher. In the first half of 2007 the upward trend in agricultural and food prices, which account for approximately 25% of the HICP basket, contributed to the inflation increase mostly in the Baltic countries and
5 The inflation rate for the EU8+2 is weighted by nominal GDP. Eurozone y-o-y inflation in December 2006 was 1.9 percent, in August 2007 1.7 percent.

18
Hungary. This increase in food inflation results from a combination of weather conditions, rising global food prices and the lagged impact of higher energy costs on food prices.
Chart 29. HICP- all
0
2
4
6
8
10
12
Jan-
05
Apr-
05
Jul-0
5
Oct
-05
Jan-
06
Apr-
06
Jul-0
6
Oct
-06
Jan-
07
Apr-
07
Jul-0
7
CZ HUPL SK
0
2
4
6
8
10
12
Jan-
05
Apr-
05
Jul-0
5
Oct
-05
Jan-
06
Apr-
06
Jul-0
6
Oct
-06
Jan-
07
Apr-
07
Jul-0
7
LV SILT EE
0
2
4
6
8
10
12
Jan-
05
Apr-
05
Jul-0
5
Oct
-05
Jan-
06
Apr-
06
Jul-0
6
Oct
-06
Jan-
07
Apr-
07
Jul-0
7
BG RO
Chart 30. HICP-Core Inflation
0
2
4
6
8
10
12
Jan-
05
Apr-
05
Jul-0
5
Oct
-05
Jan-
06
Apr-
06
Jul-0
6
Oct
-06
Jan-
07
Apr-
07
Jul-0
7
CZ HUPL SK
0
2
4
6
8
10
12
Jan-
05
Apr-
05
Jul-0
5
Oct
-05
Jan-
06
Apr-
06
Jul-0
6
Oct
-06
Jan-
07
Apr-
07
Jul-0
7
LV SILT EE
0
2
4
6
8
10
12
Jan-
05
Apr-
05
Jul-0
5
Oct
-05
Jan-
06
Apr-
06
Jul-0
6
Oct
-06
Jan-
07
Apr-
07
Jul-0
7
BG RO
Chart 31. HICP-food
-505
1015202530
Jan-
05
Apr-
05
Jul-0
5
Oct
-05
Jan-
06
Apr-
06
Jul-0
6
Oct
-06
Jan-
07
Apr-
07
Jul-0
7
CZ HUPL SK
-505
1015202530
Jan-
05
Apr-
05
Jul-0
5
Oct
-05
Jan-
06
Apr-
06
Jul-0
6
Oct
-06
Jan-
07
Apr-
07
Jul-0
7
LV SILT EE
-505
10
15202530
Jan-
05
Apr-
05
Jul-0
5
Oct
-05
Jan-
06
Apr-
06
Jul-0
6
Oct
-06
Jan-
07
Apr-
07
Jul-0
7
BG RO
Source: Eurostat.
19
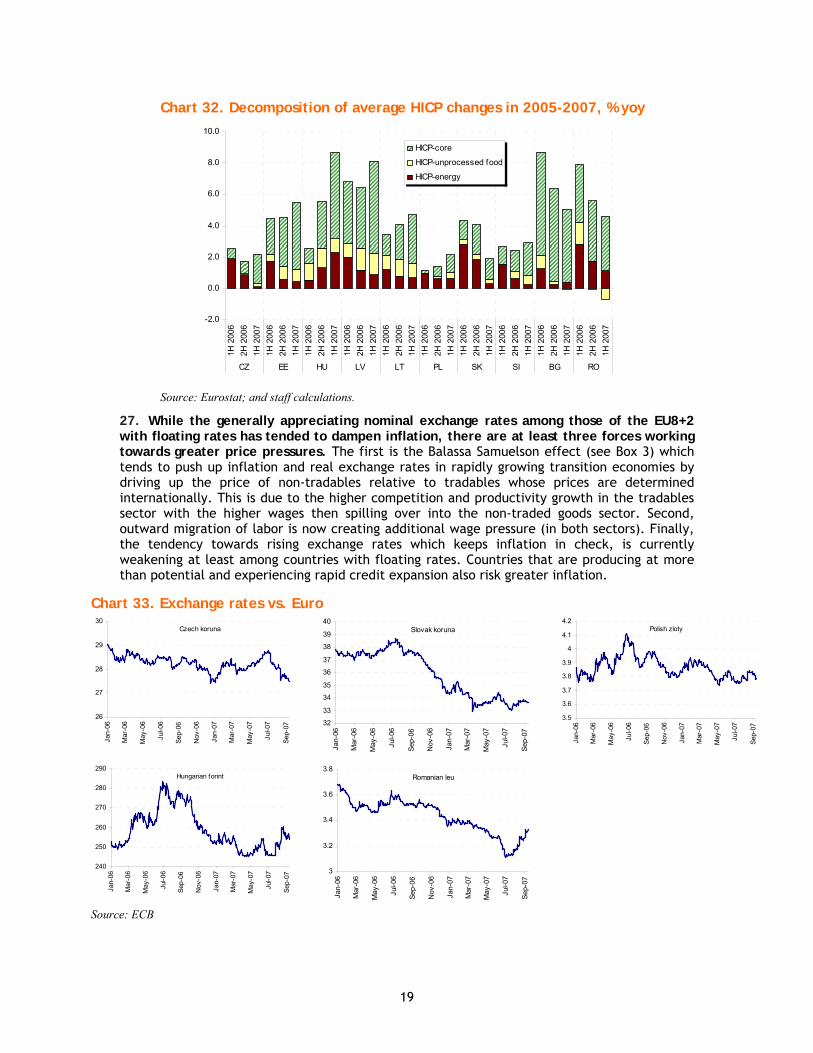
Chart 32. Decomposition of average HICP changes in 2005-2007, % yoy
-2.0
0.0
2.0
4.0
6.0
8.0
10.0
1H 2
006
2H 2
006
1H 2
007
1H 2
006
2H 2
006
1H 2
007
1H 2
006
2H 2
006
1H 2
007
1H 2
006
2H 2
006
1H 2
007
1H 2
006
2H 2
006
1H 2
007
1H 2
006
2H 2
006
1H 2
007
1H 2
006
2H 2
006
1H 2
007
1H 2
006
2H 2
006
1H 2
007
1H 2
006
2H 2
006
1H 2
007
1H 2
006
2H 2
006
1H 2
007
CZ EE HU LV LT PL SK SI BG RO
HICP-core
HICP-unprocessed food
HICP-energy
Source: Eurostat; and staff calculations.
27. While the generally appreciating nominal exchange rates among those of the EU8+2 with floating rates has tended to dampen inflation, there are at least three forces working towards greater price pressures. The first is the Balassa Samuelson effect (see Box 3) which tends to push up inflation and real exchange rates in rapidly growing transition economies by driving up the price of non-tradables relative to tradables whose prices are determined internationally. This is due to the higher competition and productivity growth in the tradables sector with the higher wages then spilling over into the non-traded goods sector. Second, outward migration of labor is now creating additional wage pressure (in both sectors). Finally, the tendency towards rising exchange rates which keeps inflation in check, is currently weakening at least among countries with floating rates. Countries that are producing at more than potential and experiencing rapid credit expansion also risk greater inflation.
Chart 33. Exchange rates vs. Euro
Czech koruna
26
27
28
29
30
Jan-
06
Mar
-06
May
-06
Jul-0
6
Sep-
06
Nov
-06
Jan-
07
Mar
-07
May
-07
Jul-0
7
Sep-
07
Slovak koruna
32
33
34
35
36
37
38
39
40
Jan-
06
Mar
-06
May
-06
Jul-0
6
Sep-
06
Nov
-06
Jan-
07
Mar
-07
May
-07
Jul-0
7
Sep-
07
Polish zloty
3.5
3.6
3.7
3.8
3.9
4
4.1
4.2
Jan-
06
Mar
-06
May
-06
Jul-0
6
Sep-
06
Nov
-06
Jan-
07
Mar
-07
May
-07
Jul-0
7
Sep-
07
Hungarian forint
240
250
260
270
280
290
Jan-
06
Mar
-06
May
-06
Jul-0
6
Sep-
06
Nov
-06
Jan-
07
Mar
-07
May
-07
Jul-0
7
Sep-
07
Romanian leu
3
3.2
3.4
3.6
3.8
Jan-
06
Mar
-06
May
-06
Jul-0
6
Sep-
06
Nov
-06
Jan-
07
Mar
-07
May
-07
Jul-0
7
Sep-
07
Source: ECB
20
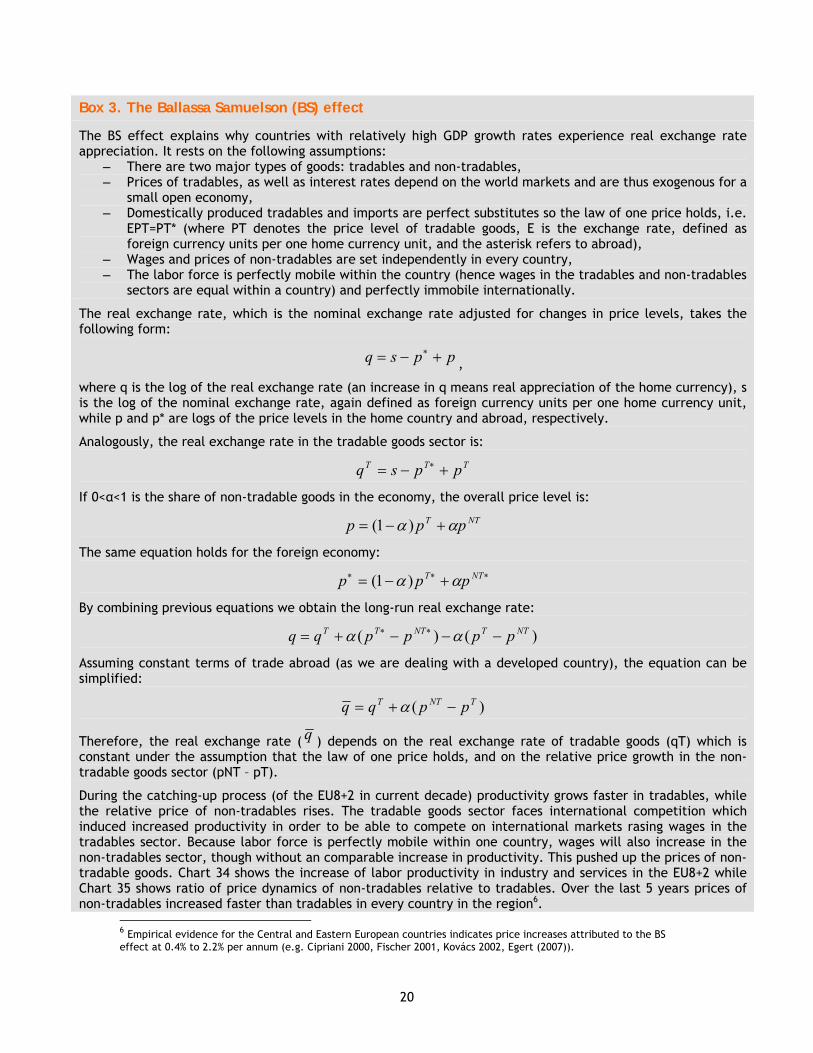
Box 3. The Ballassa Samuelson (BS) effect
The BS effect explains why countries with relatively high GDP growth rates experience real exchange rate appreciation. It rests on the following assumptions:
– There are two major types of goods: tradables and non-tradables, – Prices of tradables, as well as interest rates depend on the world markets and are thus exogenous for a
small open economy, – Domestically produced tradables and imports are perfect substitutes so the law of one price holds, i.e.
EPT=PT* (where PT denotes the price level of tradable goods, E is the exchange rate, defined as foreign currency units per one home currency unit, and the asterisk refers to abroad),
– Wages and prices of non-tradables are set independently in every country, – The labor force is perfectly mobile within the country (hence wages in the tradables and non-tradables
sectors are equal within a country) and perfectly immobile internationally.
The real exchange rate, which is the nominal exchange rate adjusted for changes in price levels, takes the following form:
ppsq +−= ∗,
where q is the log of the real exchange rate (an increase in q means real appreciation of the home currency), s is the log of the nominal exchange rate, again defined as foreign currency units per one home currency unit, while p and p* are logs of the price levels in the home country and abroad, respectively.
Analogously, the real exchange rate in the tradable goods sector is:
TTT ppsq +−= ∗
If 0<α<1 is the share of non-tradable goods in the economy, the overall price level is:
NTT ppp αα +−= )1( The same equation holds for the foreign economy:
∗∗∗ +−= NTT ppp αα )1( By combining previous equations we obtain the long-run real exchange rate:
)()( NTTNTTT ppppqq −−−+= ∗∗ αα Assuming constant terms of trade abroad (as we are dealing with a developed country), the equation can be simplified:
)( TNTT ppqq −+= α
Therefore, the real exchange rate ( q ) depends on the real exchange rate of tradable goods (qT) which is constant under the assumption that the law of one price holds, and on the relative price growth in the non-tradable goods sector (pNT – pT).
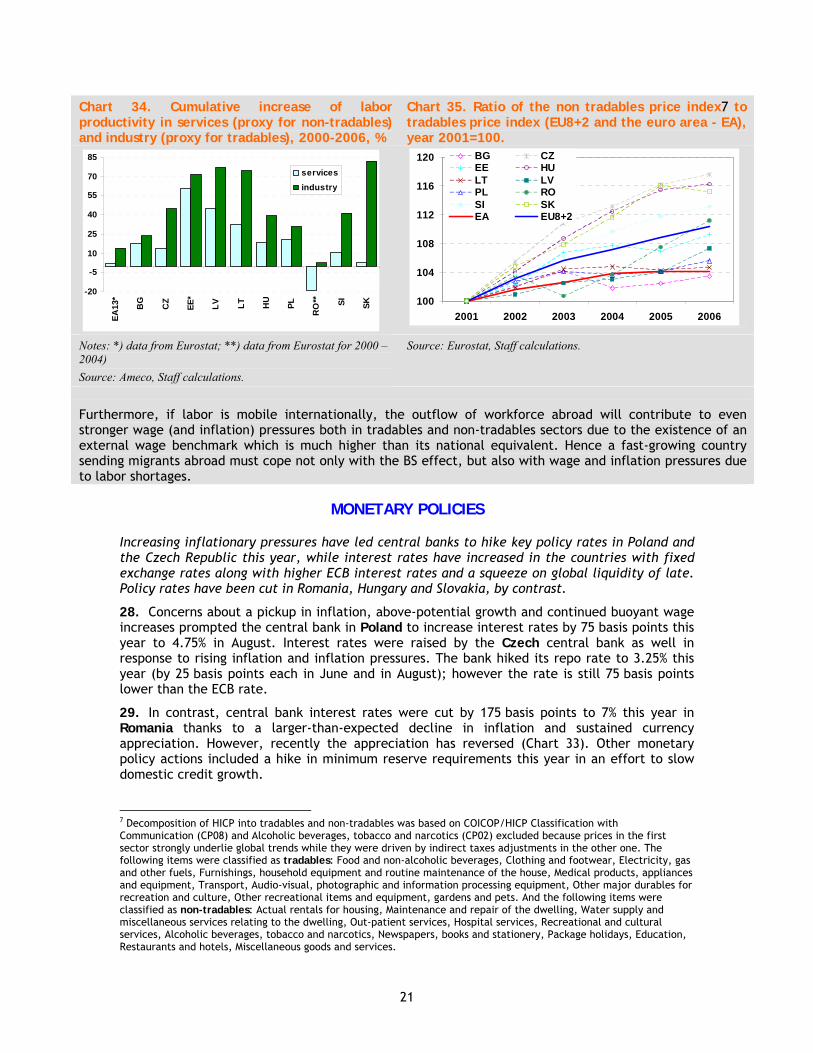
During the catching-up process (of the EU8+2 in current decade) productivity grows faster in tradables, while the relative price of non-tradables rises. The tradable goods sector faces international competition which induced increased productivity in order to be able to compete on international markets rasing wages in the tradables sector. Because labor force is perfectly mobile within one country, wages will also increase in the non-tradables sector, though without an comparable increase in productivity. This pushed up the prices of non-tradable goods. Chart 34 shows the increase of labor productivity in industry and services in the EU8+2 while Chart 35 shows ratio of price dynamics of non-tradables relative to tradables. Over the last 5 years prices of non-tradables increased faster than tradables in every country in the region6.
6 Empirical evidence for the Central and Eastern European countries indicates price increases attributed to the BS effect at 0.4% to 2.2% per annum (e.g. Cipriani 2000, Fischer 2001, Kovács 2002, Egert (2007)).
21
Chart 34. Cumulative increase of labor productivity in services (proxy for non-tradables) and industry (proxy for tradables), 2000-2006, %
Chart 35. Ratio of the non tradables price index7 to tradables price index (EU8+2 and the euro area - EA), year 2001=100.
-20
-5
10
25
40
55
70
85
EA13
*
BG
CZ
EE*
LV LT HU
PL
RO
** SI SK
servicesindustry
100
104
108
112
116
120
2001 2002 2003 2004 2005 2006
BG CZEE HULT LVPL ROSI SKEA EU8+2
Notes: *) data from Eurostat; **) data from Eurostat for 2000 – 2004) Source: Ameco, Staff calculations.
Source: Eurostat, Staff calculations.
Furthermore, if labor is mobile internationally, the outflow of workforce abroad will contribute to even stronger wage (and inflation) pressures both in tradables and non-tradables sectors due to the existence of an external wage benchmark which is much higher than its national equivalent. Hence a fast-growing country sending migrants abroad must cope not only with the BS effect, but also with wage and inflation pressures due to labor shortages.
MONETARY POLICIES
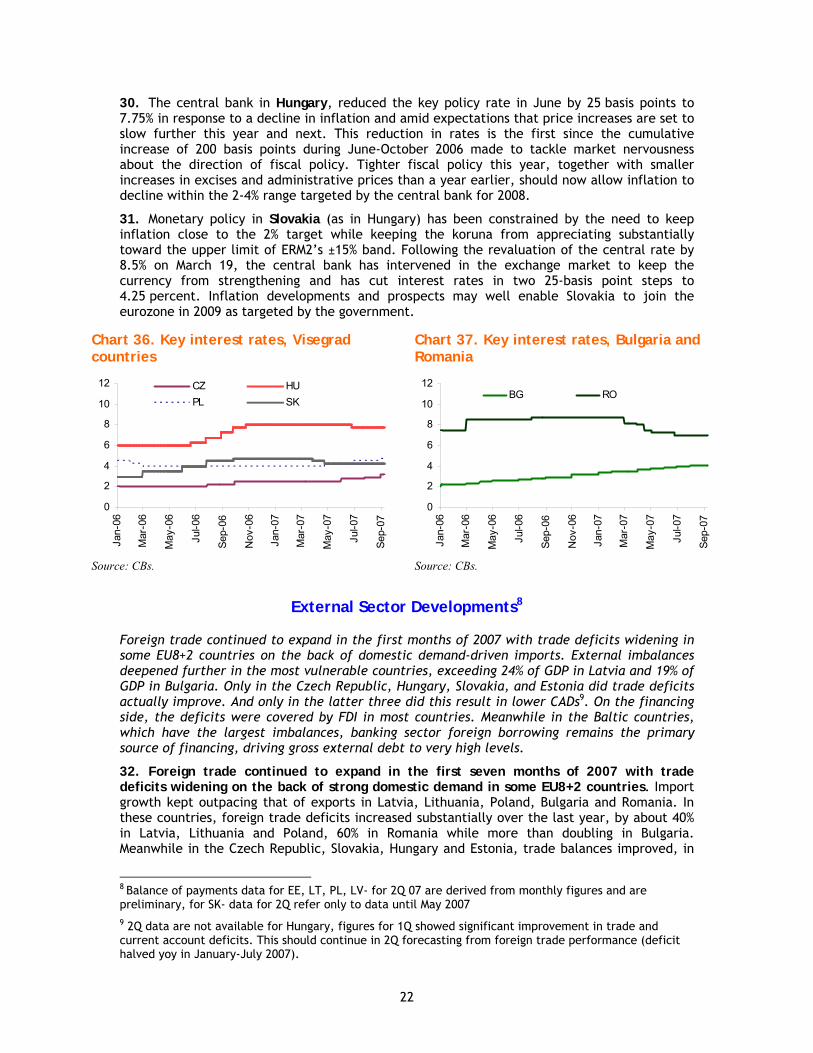
Increasing inflationary pressures have led central banks to hike key policy rates in Poland and the Czech Republic this year, while interest rates have increased in the countries with fixed exchange rates along with higher ECB interest rates and a squeeze on global liquidity of late. Policy rates have been cut in Romania, Hungary and Slovakia, by contrast.
28. Concerns about a pickup in inflation, above-potential growth and continued buoyant wage increases prompted the central bank in Poland to increase interest rates by 75 basis points this year to 4.75% in August. Interest rates were raised by the Czech central bank as well in response to rising inflation and inflation pressures. The bank hiked its repo rate to 3.25% this year (by 25 basis points each in June and in August); however the rate is still 75 basis points lower than the ECB rate.
29. In contrast, central bank interest rates were cut by 175 basis points to 7% this year in Romania thanks to a larger-than-expected decline in inflation and sustained currency appreciation. However, recently the appreciation has reversed (Chart 33). Other monetary policy actions included a hike in minimum reserve requirements this year in an effort to slow domestic credit growth.
7 Decomposition of HICP into tradables and non-tradables was based on COICOP/HICP Classification with Communication (CP08) and Alcoholic beverages, tobacco and narcotics (CP02) excluded because prices in the first sector strongly underlie global trends while they were driven by indirect taxes adjustments in the other one. The following items were classified as tradables: Food and non-alcoholic beverages, Clothing and footwear, Electricity, gas and other fuels, Furnishings, household equipment and routine maintenance of the house, Medical products, appliances and equipment, Transport, Audio-visual, photographic and information processing equipment, Other major durables for recreation and culture, Other recreational items and equipment, gardens and pets. And the following items were classified as non-tradables: Actual rentals for housing, Maintenance and repair of the dwelling, Water supply and miscellaneous services relating to the dwelling, Out-patient services, Hospital services, Recreational and cultural services, Alcoholic beverages, tobacco and narcotics, Newspapers, books and stationery, Package holidays, Education, Restaurants and hotels, Miscellaneous goods and services.
22
30. The central bank in Hungary, reduced the key policy rate in June by 25 basis points to 7.75% in response to a decline in inflation and amid expectations that price increases are set to slow further this year and next. This reduction in rates is the first since the cumulative increase of 200 basis points during June-October 2006 made to tackle market nervousness about the direction of fiscal policy. Tighter fiscal policy this year, together with smaller increases in excises and administrative prices than a year earlier, should now allow inflation to decline within the 2-4% range targeted by the central bank for 2008.
31. Monetary policy in Slovakia (as in Hungary) has been constrained by the need to keep inflation close to the 2% target while keeping the koruna from appreciating substantially toward the upper limit of ERM2’s ±15% band. Following the revaluation of the central rate by 8.5% on March 19, the central bank has intervened in the exchange market to keep the currency from strengthening and has cut interest rates in two 25-basis point steps to 4.25 percent. Inflation developments and prospects may well enable Slovakia to join the eurozone in 2009 as targeted by the government.
Chart 36. Key interest rates, Visegrad countries
Chart 37. Key interest rates, Bulgaria and Romania
0
2
4
6
8
10
12
Jan-
06
Mar
-06
May
-06
Jul-0
6
Sep-
06
Nov
-06
Jan-
07
Mar
-07
May
-07
Jul-0
7
Sep-
07CZ HUPL SK
0
2
4
6
8
10
12
Jan-
06
Mar
-06
May
-06
Jul-0
6
Sep-
06
Nov
-06
Jan-
07
Mar
-07
May
-07
Jul-0
7
Sep-
07
BG RO
Source: CBs. Source: CBs.
External Sector Developments8
Foreign trade continued to expand in the first months of 2007 with trade deficits widening in some EU8+2 countries on the back of domestic demand-driven imports. External imbalances deepened further in the most vulnerable countries, exceeding 24% of GDP in Latvia and 19% of GDP in Bulgaria. Only in the Czech Republic, Hungary, Slovakia, and Estonia did trade deficits actually improve. And only in the latter three did this result in lower CADs9. On the financing side, the deficits were covered by FDI in most countries. Meanwhile in the Baltic countries, which have the largest imbalances, banking sector foreign borrowing remains the primary source of financing, driving gross external debt to very high levels.
32. Foreign trade continued to expand in the first seven months of 2007 with trade deficits widening on the back of strong domestic demand in some EU8+2 countries. Import growth kept outpacing that of exports in Latvia, Lithuania, Poland, Bulgaria and Romania. In these countries, foreign trade deficits increased substantially over the last year, by about 40% in Latvia, Lithuania and Poland, 60% in Romania while more than doubling in Bulgaria. Meanwhile in the Czech Republic, Slovakia, Hungary and Estonia, trade balances improved, in
8 Balance of payments data for EE, LT, PL, LV- for 2Q 07 are derived from monthly figures and are preliminary, for SK- data for 2Q refer only to data until May 2007 9 2Q data are not available for Hungary, figures for 1Q showed significant improvement in trade and current account deficits. This should continue in 2Q forecasting from foreign trade performance (deficit halved yoy in January-July 2007).

23
the latter due to a significant slowdown in imports. In other countries exports performed relatively better than imports (for more detailed analysis on export performance in recent years see Box 4).
Box 4. Decomposition of export performance - Constant Market Share Analysis
A country’s export growth can be attributed to improvements in competitiveness, in which case one would expect to see increases in market share. Or growth may be attributable to the composition of a country’s exports, with a greater concentration in product categories or regional markets that are growing relatively quickly, even if the country’s share in these products or markets is not increasing. The Constant Market Share analysis (CMS) is used to explore this by decomposing the relative export performance into four separate effects:
− A ‘competitiveness effect’, which shows pure competitiveness effect excluding the impact of the exports structure.
− A ‘structure effect’ which is positive for a country whose exports are more concentrated in high growing products and markets than are world exports. This effect can be further decomposed into three terms:
– A ‘market effect’, which defines the part of export growth attributable to regional structure of exports
– A ‘product effect’, which accounts for changes in product composition of the country’s exports
– A ‘residual effect’, which embodied all other factors.
This methodology (explained in detail in Annex 1) was used to assess export performance of the EU8+2 countries between 2000 and 2006 relative to export performance of EU27 as a benchmark group. In addition to overall export performance, we assessed the performance in exports by product groups and trade partners. (Respectively: 4 product groups: resource based, low-tech, medium-tech and high-tech manufactures, and the main trade partners: EU15, EU10 and CIS countries).
The competitiveness effect played a key role in improving relative export performance in all EU8+2 countries, while in some countries the structure of exports was also of some importance, especially in Latvia, Bulgaria and Lithuania. In their relative export performance all EU8+2 countries are, ceteris paribus, becoming more competitive vis-à-vis EU as a whole. At the same time the product and regional structure of exports plays a positive but minor role in boosting relative export performance. Decomposition of the structural component shows relatively more importance of the market effect, especially in Lithuania, Latvia, Slovakia and Bulgaria, whereas the product effect contribution was insignificant or marginal, except in Bulgaria. This implies that while the product composition of the EU8+2 exports had rather a neutral or only slightly positive role in raising their export performance, it is the relatively high portion of trade with the fast growing countries that has a more important role in improving their export shares.

24
Chart 38. The structural and competitiveness effects in the EU8+2 export performance, 2000-2006
Chart 39. Decomposition of export performance of the EU8+2 countries, 2000-2006
EE
HU
LT
PLSIRO CZ
LV
SKBG
-0.1
0.0
0.1
0.2
0.3
0.4
0.0 0.5 1.0 1.5competitiveness effect
stru
ctur
al e
ffect
-0.5
0.0
0.5
1.0
1.5
2.0
CZ EE HU LV LT PL SK SI BG RO
competitiveness product market residual
Source: Comext, staff calculations. Note: Difference between export growth rates in reporting
country and EU27 in percentage points; detailed methodology see Annex 1 Source: Comext, staff calculations.
Further insight can be gained by look more closely at the level of technological sophistication of exports. The analysis reveals that it is largely these high tech exports that drive the overall export performance. Not only are these the product categories and markets where the NMS are enjoying the greatest competitiveness gains, but they are also the fastest growing markets. This suggests that investments in the higher tech export production will lead to increasing shares of the fastest growing pies. Conversely, a concentration in low tech and resource-based exports leads to relatively poor export performance. While overall the competitiveness effect is the stronger determinant of export performance there are differences across countries. There were huge relative export gains in competitiveness in high end products in the Czech Republic and Slovakia on the back of strong FDI in these countries. While the market effect (for medium and high tech goods) was particularly strong in Latvia and Bulgaria.
Chart 40. Export performance by product groups Resource based manufactures Low technology manufactures
-1
0
1
2
3
4
CZ EE HU LV LT PL SK SI BG RO
competitiveness product market residual
-1
0
1
2
3
4
CZ EE HU LV LT PL SK SI BG RO
competitiveness product market residual

25
Medium technology manufactures High technology manufactures
-1
0
1
2
3
4
CZ EE HU LV LT PL SK SI BG RO
competitiveness product market residual
-1
01
2
3
45
6
CZ EE HU LV LT PL SK SI BG RO
competitiveness product market residual
Source: Comext, staff calculations.
These patterns hold when looking a various groups of trade partner countries (EU15, EU8+2, CIS). Competitiveness is the again the dominant factor in all three partner areas. (Note the sharply higher penetration of the CIS markets.)
Chart 41. Export performance by trade partners EU15 EU8+2
-1
01
2
3
45
6
CZ EE HU LV LT PL SK SI BG RO
competitiveness product market residual
-1
01
2
3
45
6
CZ EE HU LV LT PL SK SI BG RO
competitiveness product market residual
CIS
-1
01
2
3
45
6
CZ EE HU LV LT PL SK SI BG RO
competitiveness product market residual
Source: Comext, staff calculations
33. Current account deficits widened in most countries of the region, in particular in countries already experiencing large external imbalances. According to preliminary 2Q 07 data, external positions further deteriorated in Latvia, Lithuania, Bulgaria and Romania, while in Estonia it improved slightly – on the back of improved trade deficit – but still remained on the very high level, above 15% of GDP. Despite increasing trade surplus, current account deficit widened in the Czech Republic due to increasing income and transfers deficit. Apart from
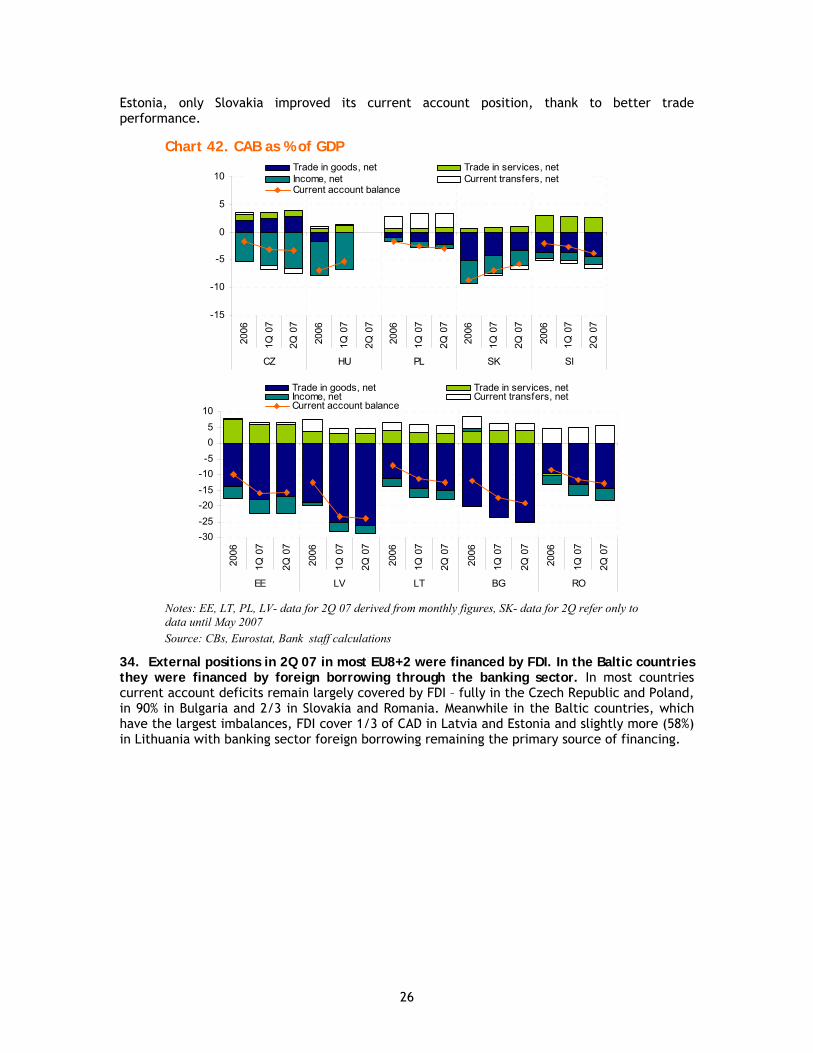
26
Estonia, only Slovakia improved its current account position, thank to better trade performance.
Chart 42. CAB as % of GDP
-15
-10
-5
0
5
10
2006
1Q 0
7
2Q 0
7
2006
1Q 0
7
2Q 0
7
2006
1Q 0
7
2Q 0
7
2006
1Q 0
7
2Q 0
7
2006
1Q 0
7
2Q 0
7
CZ HU PL SK SI
Trade in goods, net Trade in services, netIncome, net Current transfers, netCurrent account balance
-30-25-20-15-10-505
10
2006
1Q 0
7
2Q 0
7
2006
1Q 0
7
2Q 0
7
2006
1Q 0
7
2Q 0
7
2006
1Q 0
7
2Q 0
7
2006
1Q 0
7
2Q 0
7
EE LV LT BG RO
Trade in goods, net Trade in services, netIncome, net Current transfers, netCurrent account balance
Notes: EE, LT, PL, LV- data for 2Q 07 derived from monthly figures, SK- data for 2Q refer only to data until May 2007 Source: CBs, Eurostat, Bank staff calculations
34. External positions in 2Q 07 in most EU8+2 were financed by FDI. In the Baltic countries they were financed by foreign borrowing through the banking sector. In most countries current account deficits remain largely covered by FDI – fully in the Czech Republic and Poland, in 90% in Bulgaria and 2/3 in Slovakia and Romania. Meanwhile in the Baltic countries, which have the largest imbalances, FDI cover 1/3 of CAD in Latvia and Estonia and slightly more (58%) in Lithuania with banking sector foreign borrowing remaining the primary source of financing.

27
Chart 43. CA financing
-500-400-300-200-100
0100200300400500600700
2006
1Q 0
7
2Q 0
7
2006
1Q 0
7
2Q 0
7
2006
1Q 0
7
2Q 0
7
2006
1Q 0
7
2Q 0
7
CZ EE PL SI***
Capital account FDI, netPortfolio investment, equity Portfolio investment, debtOther* Change in reserves**
-100-50
050
100150200250300350
2006
1Q 0
7
2Q 0
7
2006
1Q 0
7
2Q 0
7
2006
1Q 0
7
2Q 0
7
2006
1Q 0
7
2Q 0
7
2006
1Q 0
7
2Q 0
7
2006
1Q 0
7
2Q 0
7
HU LV LT SK*** BG RO***
Capital account FDI, netPortfolio investment, equity Portfolio investment, debtOther* Change in reserves**
Notes: EE, LT, PL, LV- data for 2Q 07 derived from monthly figures, SK- data for 2Q refer only to data until May 2007 The sum of flows above and below the horizontal axis sums up to 100% (equals the value of the current account deficit) *) financial derivatives, other investment and net errors and omissions; **) negative values denote increase of reserves; ***) portfolio investment include equity and debt Source: CBs, Eurostat, staff calculations.
35. The impact of the recent market turmoil and of any consequent portfolio outflows will be reported in balance of payments figures only with some lag, yet financial market data suggest that EU8+2 are recovering from the emerging market sell-off (see also external environment section). Potentially, Hungary and Poland may be among the most affected by the portfolio outflow from the EU8+2, the former due to relatively weaker fundamentals and the later due to a technical correction after stock exchange rally earlier in 2007. Other countries rely to a greater extent on more stable sources of financing for their external positions.
36. Rating agencies however remain concerned about persistent overheating pressures in the Baltic countries, especially Latvia although the real estate boom in these countries seems to be coming to an end. Rating outlooks for the Baltic countries were revised downwards in recent months (S&P to negative for Lithuania (May) and Estonia (July)). In early August Standard & Poor’s forecast a soft landing for the Baltic countries, with the credit bubble expected to slowly deflate starting from 4Q 07 as the real estate boom in three Baltic States comes to an end. This base scenario assumed that the ECB will continue to tighten monetary policy, and that the Baltic authorities will avoid further fiscal stimulus to their respective economies. In the second half of August a downgrade of the actual rating for Latvia (Fitch from A- to BBB+, outlook remaining stable) provided a clear warning signal for the government that policy reaction to overheating pressures is not sufficient. The rating outlook for Latvia and Estonia was also lowered by Moody’s Investors Services (from positive to stable in mid September).

28
PUBLIC FINANCES
About half of the countries, most notably Hungary, have been improving their fiscal positions, and other half are not taking advantage of the robust growth to deepen consolidation efforts and redress fiscal imbalances. Expansionary fiscal policy is adding a strong pro-cyclical impulse to the already overheated economies of at least two of the countries. This is not new, however as EU8+2 over the last few years have used rapid GDP growth to increase public spending substantially, rather than taking the opportunity to establish a better public-private balance in the economy and to persevere with remaining structural reform agendas. Information on the budget drafts for 2008 is scarce in a majority of countries, despite the advanced phase of the cycle. However, from the information currently available, it seems that in about half of the countries fiscal loosening or at least no consolidation could be expected, and in several countries fiscal policy continues to rely on ad-hoc spending cuts, rather than being guided by strong, flexible and transparent public financial management practices directed at enhancing efficiency and creating room for growth-enhancing investment projects funded by the EU.
37. The performances of central government budgets in the first six months of this year point towards deterioration in five countries (Table 5). Because of high economic growth, revenues are higher in real terms than in the same period in 2006: from 1% higher in the Czech Republic to 22% in Poland. However, expenditures grew between 2% to 24%, leading to a deterioration of the budget balance y/y in five countries. In Hungary by contrast, although the recession negatively affected budget revenues, the fall there was not too dramatic, and the country significantly improved its budgetary position – although the deficit has already reached 66% of the budget plan for this year. The other three countries either increased their surpluses or reduced their deficits.
Table 5. Central Government Budget performance 1H2007, real % change y/y BG CZ EE HU LV LT PL RO SK HR
Total Revenues 11.9 1.1 14.5 -2.3 19.1 12.2 22.3 13.4 3.7 11.1
PIT 22.6 5.3 58.4 6.4 26.9 .. 35.7 41.6 -5.8 11.4
CIT 35.1 -5.5 40.2 -3.0 43.7 .. 28.6 25.9 10.7 22.9
VAT 8.4 11.6 21.0 3.7 23.4 .. 15.5 -1.3 4.5 9.2
Total Expenditures 6.0 2.5 16.6 -5.4 23.1 16.5 5.9 24.0 3.8 5.6
Balance 46.5 -83.7 -16.1 -13.3 -13.6 42.5 -79.8 -119.6 5.4 -69.1
Change ↑○ ↓○ ↓○ ↓● ↓○ ↑○ ↓● ○→● ↑● ↓●
Source: MFs, WB Note: for balance, ● denotes deficit, ○ surplus, ↑ higher, ↓ lower, and ○→● from surplus to deficit.
38. It is expected that almost all countries will end up with better fiscal outcomes than originally planned. Bulgaria and Estonia will run surpluses higher than planned. Latvia, in an attempt to stabilize the overheated economy amended the budget to produce a surplus of 0.4% of GDP instead of initially planned 1.3% of GDP deficit. Hungary, Poland, Slovakia and Slovenia will run lower than expected deficits, and the Czech Republic will stay at the planned level. Meanwhile Lithuania will most likely record slightly higher deficit than targeted.
39. However, consolidation efforts of about a half of them are not sufficiently ambitious. Five countries seem to be making efforts to take advantage of the solid growth to consolidate their cyclically-adjusted balances (Table 6). These include Hungary, Estonia, Poland, Slovakia and Latvia, where the government shows a renewed determination to address overheating pressures. Bulgaria also improved, at least in terms of reducing its negative consolidation effort from -2.6 to -0.4, by running a much higher headline surplus. The rest of the countries either made marginal consolidation efforts, or even allowed a deterioration (Bulgaria, Romania).

29
Table 6. Half of the countries are making serious consolidation efforts Budget 2007 Most recent estimates for 2007
Headline Balance
Cyclically adjusted balance
Consolidation effort
Headline Balance
Cyclically adjusted balance
Consolidation effort
Bulgaria 0.8 0.4 -2.6 3.0 2.6 -0.4
Czech R. -4.0 -4.0 -0.2 -4.0 -3.8 0.0
Estonia 1.2 1.0 -1.2 3.4 3.1 0.9
Hungary -6.8 -5.6 4.1 -6.4 -5.1 4.6
Latvia -1.3 -1.8 -0.9 0.4 -0.1 0.8
Lithuania -0.9 -0.8 0.6 -1.2 -1.1 0.3
Poland -3.4 -1.4 0.5 -3.0 -1.0 0.9
Romania -2.7 -3.4 -0.5 -2.8 -3.4 -0.5
Slovakia -2.9 -1.9 0.7 -2.7 -1.8 0.8
Slovenia -1.5 -1.6 0.1 -1.3 -1.5 0.2
Notes: WB estimate of GFS86 deficit includes off-budgetary activities. In % of GDP, ESA95 (except Croatia in GFS86). Consolidation effort is the difference between structural balance in 2007 and 2006. Positive consolidation effort (in pp. of GDP) indicates fiscal policy tightening Source: Budget 2007 Convergence Programs; Most recent estimates – Ministries of Finance, IMF, WB and EC.
40. The missing link between high economic growth and fiscal tightening in NMS is not new as strong economic growth often goes hand in hand with double digit growth of real fiscal spending. Only two out of ten NMS10 used high GDP growth to generate a budget surplus in 2004-2006 (Chart 44 - Chart 47). By contrast, government spending outpaced GDP growth, especially in Hungary and Latvia, where the size of government increased annually by 3.6ppt and 1.2ppt, respectively.
41. It is challenging to spend such rapidly increasing resources effectively. An abundance of funds which could finance restructuring costs and well-conceived capital investment projects, may instead weaken incentives to improve the functioning of the administration. In Latvia government expenditures grew annually by 12.6% in real terms, in Lithuania and Estonia by some 7.7%, and in Hungary by 6.7% in 2004-06. Four NMS boosted public sector wages growth – Romania (by an average real annual rate of 12.7% in 2004-06), Latvia (11.3%), Lithuania (9.1%) and Estonia (6.8%). By contrast, Slovakia, Hungary and Bulgaria kept wages in that period unchanged.
10 Note that Bulgaria and Romania joined only in 2007.

30
42. Recent financial turmoil and potentially slowing global growth calls for caution in the projection of economic growth and thus fiscal revenues in 2008. Should output growth decline by one percentage point in EU8+2, deficits could climb up by 0.4-0.5 percentage points, almost exclusively because of lower fiscal revenues11. Those countries that have already reported projections of GDP growth for the next year have generally conservative estimates. However, only few countries have disclosed their budget drafts and it is difficult to assess the extent of planned tightening.
43. At this stage it appears the majority of countries to plan to cut taxes next year while increasing expenditures. Tax rates, whether on personal and corporate income, or value added, will be lowered in Bulgaria, Czech Republic, Estonia and Slovakia. At the same time, spending on pensions, social assistance, health and education will increase in Croatia, Estonia, Poland and Romania. There are a few exceptions: Hungary, which is struggling to reduce its twin deficits; and the Czech Republic which appears to be successfully reforming its expenditures by lowering social and health expenditures, while improving the targeting of assistance.
44. The information available, suggests that in 2008 four countries will consolidate their public finances – particularly Hungary, but also Czech Republic, Slovakia and Latvia. Other countries will progress less, and there may be some fiscal loosening (especially Estonia, but to some extent also Bulgaria and Poland).
11 See Girouard and Andre (2005) quoted in May 2007 issue of Regular Economic Report, page 31.
Chart 44. High budget deficit in good times Average GDP real growth and deficit, 2004-06
Chart 45. The higher economic growth, the higher growth in real spending by the government GDP and GG expenditure average real growth, 04-06
BG
CZ
LVLT
RO
SK
HR
EE
HU
PL
SI
-9
-7
-5
-3
-1
1
3
4 5 6 7 8 9 10 11GDP real growth
GG
def
icit
in %
of G
DP
BGCZ
EE
LV
LT
ROSK
HU
PLSI
0
2
4
6
8
10
12
14
4 5 6 7 8 9 10 11GDP real growth
GG
Exp
endi
ture
real
gro
wth
Chart 46. Public wages expanded in four countries GDP and GG wages real growth, 2004-06
Chart 47. Gross investment expanded in almost all NMS GDP and GG gross capital form. real growth, 04-06
BG
CZ
LV
LT
RO
EE
HUPL
SI
SK
-2
0
2
4
6
8
10
12
14
4 5 6 7 8 9 10 11GDP real growth
GG
wag
e bi
ll re
al g
row
th
BG LVLT
RO
CZ
EE
HUPL
SI
SK-2
3
8
13
18
23
4 5 6 7 8 9 10 11GDP real growth
GG
gro
ss c
apita
l for
mat
ion
real
gro
wth
Source: Eurostat and Bank staff calculations Notes: Croatian figure in GFS86.

31
• In Bulgaria, the government has announced a flat income tax of 10% starting in 2008, and an increase of social contributions paid by employees from 35% to 40% (while the total rate remains unchanged). The minimum wage is set to increase by 22%, while low-paid workers in the public sector would get a one-time pay raise to be compensated for by the introduction of the flat income tax. The planned budget surplus is 2.5% of GDP.
• Major reforms are set to correct for pre-election fiscal promises in the Czech Republic, while aiming for 3% of GDP budget deficit in 2008. The reforms contain the following components: (i) a 15% flat personal income tax rate in 2008 (which is equivalent to the current 23% rate, as the new tax base includes also social contributions) and 12.5% since 2009; (ii) a gradual corporate income tax reduction from the current 24% to 19% in 2010 (however, almost all 120 exceptions from CIT were kept and some new exceptions were established); (iii) a hike in the lower VAT rate from 5% to 9%; (iv) reduction of several social benefits and sickness pay; (v) co-payments for doctor visits and prescribed pharmaceuticals hospital stays and urgent treatments. Furthermore, the government plans to increase the retirement age to 65 this autumn, set growth in public sector wages in 2008-10 to 1.5%, and introduce opt out provisions with redirection of part of the savings to private pension funds.
• In Estonia, the government plans to cut personal income tax rates from 22% to 18% by 2011 and increase the amount of tax-exempt income and the number of allowances. Other plans include boosting spending on health and education, including public sector wages, and double average monthly pensions by 2011. Overall, the draft budget targets a surplus of 1.3% of GDP in 2008, which is considerably above the surplus target of 0.5% of GDP set down in the budget strategy approved in spring, but still appears a significant fiscal loosening, compared to the surplus of 3.4% of GDP expected in 2007.
• Hungary. For 2008, the authorities’ deficit target of 4.3% of GDP appears likely to be met taking into account expenditure measures in the pipeline (relating to disability pensions and early retirement) and the expiration of certain one-off obligations. Upside risks for both years are related to the future of wage freezes. However, based on current policies, the deficit might be higher than projected by the authorities in 2009 and 2010. Public debt is expected to remain above 65% of GDP for the next few years.
• Latvia. The Finance Ministry works on budget with a 0.5% of GDP surplus for next year, with steps being taken to make the surplus even higher. In view of increasing overheating pressures, the government is committed to develop a cross-sectoral macroeconomic stabilization plan to address current macroeconomic situation, dealing with the most urgent challenges such as facilitating exports, curbing inflation, decreasing the current account deficit, and increasing labor productivity. Plans being discussed aim at a budget surplus of more than 1% of GDP in 2008 -2010, GDP growth rates of not more than 7% - 8% p.a., inflation of 3% and a current account deficit of 10% of GDP.
• The Lithuanian parliament passed the bill on fiscal discipline, which aims at better planning of expenditures and keeping the budget in balance or a surplus. However, the October 2008 parliamentary elections may complicate the tightening plans and the bill is more likely to be applied starting from the 2009 budget. Thus, in contrast to calls for early and ambitious steps to contain emerging vulnerabilities, the government seems to view more measured responses as appropriate and politically feasible. On the positive side, all outstanding restitution payments will be honored in 2007, including some of the obligations being brought forward from 2008. Thus the fiscal stance in 2008 could be more contractionary.
• The Polish cabinet is committed to keeping its nominal budget anchor of 30 bln. PLN, which should not be challenging given that the economy is booming, and the general government deficit (in line with ESA 95) is planned at 3.1% of GDP. It will be difficult to achieve any fiscal consolidation in the light of new commitments which include a social security rate cut of an additional 4 pp from January 2008, an annual pension

32
valorization based partly on wage increases, increases of the lowest pensions, child tax relief, pro-family measures, the return of VAT on construction materials, bailouts of some hospitals, availability of early retirement schemes, and promises of higher wage increases in the public sector. These measures increase the risk of fiscal loosening in 2008.
• In Romania, the government envisages a deficit of 2.7% of GDP in 2008. The government has reconfirmed its earlier intention to reduce the social contributions by 6ppt in 2008, from around 46% of the gross wage currently. At the same time, state pensions will increase by an average of 43% by end-2009 starting in 2008 (or possibly with November 2007), and likely costing more than 1% of GDP.
• In Slovakia, the headline deficit is planned at 2.3% of GDP, and, while taking into account net transfers from the EU, would imply a contractionary stance. However, the government plans higher expenditure on health care, pensions and other social spending, and agriculture. The rising share of non-discretionary expenditure would reduce budgetary flexibility, making it difficult to create fiscal space for EU funds co-financing and accommodating possible macroeconomic shocks. The draft budget 2008-10, although the first to be publicly accessible among the EU8+2, lacks transparency because it concentrates on central government, rather than the consolidated government. Overall, revenues will rise by 7 % y/y in real terms, and expenditures – net of pension reform cost – by 4.3%. The budget will be affected by current hot debates about revisions to the second pension pillar, construction of Bratislava–Kosice highway, which should include also 140 km built by PPP, and uncertainty about financing the health care.
• The government of Slovenia increased its fiscal target in 2008 from -1% of GDP to -1.3% of GDP mainly because of higher spending on railway infrastructure. Some social transfers are likely to be increased ahead of the general election in late 2008.

33
Vulnerability Indicators in the EU8+2 in 1Q 07
CZ EE HU LT LV PL SK BG RO
GDP growth, SNA (real, %, yoy) 6.1 9.8 2.7 8.3 11.2 7.4 9.0 6.2 6.0Current account balance, (4Q cumulative, % of GDP) -3.2 -16.2 -5.2 -11.5 -23.5 -2.5 -6.9 -17.3 -11.6FDI (4Q cumulative, % of GDP) 3.6 2.8 0.7 6.1 7.3 3.1 5.5 15.7 8.4Total gross external debt (eop, % of GDP) 37.6 101.0 87.6 63.2 120.2 47.1 52.4 79.1 28.4Change of international reserves in euro (eop, relative to previous period, %) -0.2 -0.9 3.7 -3.6 4.1 3.5 25.6 0.6 3.5
Reserves-to-short-term debt ratio (eop, %) 192.0 42.3 154.0 99.2 133.6 137.1 210.2 139.7 339.9Money Supply-to-Reserves ratio (eop, %) 315.6 337.1 303.2 256.4 130.7 347.2 133.0 186.5 81.6Credit to private sector (eop, % of GDP) 41.1 86.7 53.3 52.6 90.3 34.4 38.7 51.3 28.3Growth rate of credit to the private sector (avg, %) 20.5 40.3 12.8 37.8 59.1 28.3 21.0 36.6 50.7Foreign currency loans to the private sector (eop, % of loans to priv. sect.) 10.6 77.9 49.9 49.3 77.3 26.9 20.7 47.1 48.4
Short-term (3M) interest rates spreads to euro area (avg, basis points) -124.0 10.0 433.0 1.0 85.0 38.0 73.0 25.0 308.0
Change of stock exchange index (avg, relative to previous period, %) 7.1 22.7 2.7 13.8 9.6 9.4 2.2 18.4 9.2
Sovereign credit rating according to S&P's* A-/P/A-2 A/N/A-1 BBB+/S/A-2 A/N/A-1 BBB+/N/A-2 A-/S/A-2 A/S/A-1 BBB+/S/A-2 BBB-/S/A-3
*current S&P rating, the symbols in line with S&P ratings denote the outlook, S= Stable, N=Negative, P=Positive Source: CBs, ISI, IMF IFS, staff calculations
Annex 1. Export Decomposition: CMS Methodology
Assessment of the relative export performance is based on the decomposition in the variation in the aggregate export market share between two periods in the following way:
⎥⎦
⎤⎢⎣
⎡−+⎥
⎦
⎤⎢⎣
⎡−=− ∗∗∗∗ ∑∑∑∑ )()( ij
i jijij
i jijijij ggggg θθθ (1)
where:
)(1
)(1
)()(
∗−
∗−
∗∗ −=
t
tt
XXXg
is the percentage change of exports in period t,
)(1
)(1,)(
∗−
∗−∗ =
t
tijij X
Xθ
is the share of product i to destination market j in total exports in period t-1, and
∑∑ ∗∗∗ =i j
ijij gg )()()( θ
gij being the percentage change in exports of product I to market j in period t. The optional asterisk denotes the world economy (benchmark group). The first term in square brackets in equation (1) is the structure effect, which can be further decomposed into three terms:
− product effect = ∗∗∑ − ii
ii g)( θθ
− market effect = ∗∗∑ − jj
jj g)( θθ
− residual effect, which accounts for the rest of the structure effect. In the above equations, θi denotes the share of product i, and θj the share of market j in total exports, while g*i/j stands for the growth of world exports of product i / market j in period t.

34
The CMS analysis was based on Comext database available in Eurostat which provides value of exports from EU27 countries to ca 180 countries. Computations in this analysis were performed at the SITC 3-digit level data (ca. 280 product groups), excluding SITC9 (Commodities and transactions, n.e.s.). The product classification by category is based on Lall (2000)12. As in Eurostat only EU members are available as reporting countries, the presented CMS analysis should be interpreted as a decomposition of the export performance of the country considered relative to the average of EU27 countries rather than the entire world.
Annex 2. Exchange rate inflation pass-through
The impact of exchange rate movements on prices varies depending on a range of microeconomic and macroeconomic factors. Some general relations can be however observed for the EU8+2 countries.
Table 7. Table 7 shows the development of import prices and the nominal effective exchange (NEER) rate in four out of ten countries with floating exchange rate regimes. A simple visual analysis reveals a strong negative correlation between those two values (note that NEER is plotted on an inverted scale). A more detailed investigation of the correlations shows that the highest response varies from 0.69 (CZ) to 0.89 (RO) and is usually not lagged (except for PL, where the highest correlation is achieved with import prices lagged by 1 quarter).
Maximum correlation
Lag in quarters
CZ -0.69 0 HU -0.83 0 PL -0.78 1 RO -0.89 0 Source: Eurostat, own calculations
Chart 48. Import prices and NEER (inverted scale), y-o-y change Czech Republic
-12-10
-8-6-4
-20
24
1Q 0
1
3Q 0
1
1Q 0
2
3Q 0
2
1Q 0
3
3Q 0
3
1Q 0
4
3Q 0
4
1Q 0
5
3Q 0
5
1Q 0
6
3Q 0
6
1Q 0
7
-0.10
-0.05
0.00
0.05
0.10
0.15Import pricesNEER
Hungary
-10
-5
0
5
10
151Q
01
3Q 0
1
1Q 0
2
3Q 0
2
1Q 0
3
3Q 0
3
1Q 0
4
3Q 0
4
1Q 0
5
3Q 0
5
1Q 0
6
3Q 0
6
1Q 0
7
-0.15
-0.10
-0.05
0.00
0.05
0.10
Import pricesNEER
Poland
-10
-5
0
5
10
15
1Q 0
1
3Q 0
1
1Q 0
2
3Q 0
2
1Q 0
3
3Q 0
3
1Q 0
4
3Q 0
4
1Q 0
5
3Q 0
5
1Q 0
6
3Q 0
6
1Q 0
7
-0.20-0.15-0.10-0.050.000.050.100.150.200.25
Import pricesNEER
Romania
-10
0
10
20
30
40
50
1Q 0
1
3Q 0
1
1Q 0
2
3Q 0
2
1Q 0
3
3Q 0
3
1Q 0
4
3Q 0
4
1Q 0
5
3Q 0
5
1Q 0
6
3Q 0
6
1Q 0
7
-0.30-0.25-0.20-0.15-0.10-0.050.000.050.100.150.20
Import pricesNEER
Source: Eurostat, CSOs, EC
Further, it would appear that while moving down the distribution chain, the price response becomes weaker and more lagged. Chart 49 presents the pass-through of import price inflation to domestic producer and consumer prices. It shows that producer prices in manufacturing have indeed followed import prices, while the pass-through to core inflation (HICP minus food and energy) is not as strong or clear (see also Table 7). Producer prices react almost immediately to changes in import prices, with the maximum lag being only 2 quarters and
12 Lall S., The Technological Structure and Performance of Developing Country Manufactured Exports, 1985-1998, Queen Elizabeth House, University of Oxford, QEH Working Paper Series 44.

35
the correlation between the variables very high. The correlation between import prices and the harmonized index of consumer prices (HICP) is weaker in all of the countries.
Chart 49. Import prices, PPI in manufacturing and core inflation, y-o-y change Czech Republic
-0.06
-0.04
-0.02
0.00
0.02
0.04
0.06
0.08
1Q 0
2
3Q 0
2
1Q 0
3
3Q 0
3
1Q 0
4
3Q 0
4
1Q 0
5
3Q 0
5
1Q 0
6
3Q 0
6
1Q 0
7
-12
-10
-8
-6
-4
-2
0
2
4
PPI in manufacturingCore inflationImport prices
Hungary
-0.04
-0.02
0.00
0.02
0.04
0.06
0.08
0.10
1Q 0
2
3Q 0
2
1Q 0
3
3Q 0
3
1Q 0
4
3Q 0
4
1Q 0
5
3Q 0
5
1Q 0
6
3Q 0
6
1Q 0
7
-10
-5
0
5
10
15
PPI in manufacturingCore inflationImport prices
Poland
-0.04
-0.02
0.00
0.02
0.04
0.06
0.08
0.10
1Q 0
2
3Q 0
2
1Q 0
3
3Q 0
3
1Q 0
4
3Q 0
4
1Q 0
5
3Q 0
5
1Q 0
6
3Q 0
6
1Q 0
7
-10
-5
0
5
10
15
PPI in manufacturingCore inflationImport prices
Romania
0.00
0.05
0.10
0.15
0.20
0.25
1Q 0
2
3Q 0
2
1Q 0
3
3Q 0
3
1Q 0
4
3Q 0
4
1Q 0
5
3Q 0
5
1Q 0
6
3Q 0
6
1Q 0
7
-10
-5
0
5
10
15
20
25
PPI in manufacturingCore inflationImport prices
Source: Eurostat, CSOs, EC
Table 8. Correlation of different price indices with import price inflation PPI Core inflation HICP Energy Goods Industrial goods Services
Max. corr.
Lag (quart.)
Max. corr.
Lag (quart.)
Max. corr.
Lag (quart.)
Max. corr.
Lag (quart.)
Max.corr.
Lag (quart.)
Max. corr.
Lag (quart.)
Max. corr.
Lag (quart.)
CZ 0.73 1 0.51 4 0.82 3 0.62 7 0.85 2 0.61 7 0.58 4 HU 0.87 0 0.14 3 0.51 3 0.69 2 0.67 2 0.32 2 -0.05 4 PL 0.63 2 0.51 3 0.39 5 0.56 8 0.47 5 0.59 5 0.05 9 RO 0.97 0 0.88 2 0.87 5 0.89 6 0.86 6 0.91 6 0.85 5
Furthermore, consumer prices tend to be stickier than producer prices, with maximum responses lagged by 2 (RO) to even 4 quarters (CZ). A further decomposition of HICP shows how prices of various goods react to changes in import prices. The reaction of core inflation appears to be lagged much like the whole HICP, with correlations being slightly lower. The response of energy prices in some countries is quite fast (2 quarters in HU), while in others it is lagged up to 8 quarters (PL), with maximum correlations being high in all of the countries. As for consumer and industrial goods, the lags are similar across most of the states (only in CZ the reaction of consumer goods is quicker), while correlations in some countries are higher for consumer goods (CZ, HU) and in some for industrial goods (PL, RO). The prices of services react more slowly than other prices (lags 4 – 9) with correlations from -0.05 (HU) up to 0.85 (RO).
A cross-country comparison shows that domestic prices react most quickly to import price changes in Hungary. Only the core inflation in HU seems to be somewhat insulated from the pass-through effect, which maybe related to the frequent regulatory prices changes, including taxes that distort core CPI index. Producer prices tend to react quickly in all of the countries, the correlation being highest in RO. The slowest and weakest response of energy prices is observed in PL. When it comes to industrial goods, the longest lag was in CZ and the biggest correlation in RO, with a quite small correlation in HU (though with a very short response time). As far as prices of services are concerned, in two of the countries (HU, PL) correlations were very low, while in the other two (CZ, RO) they were rather high.
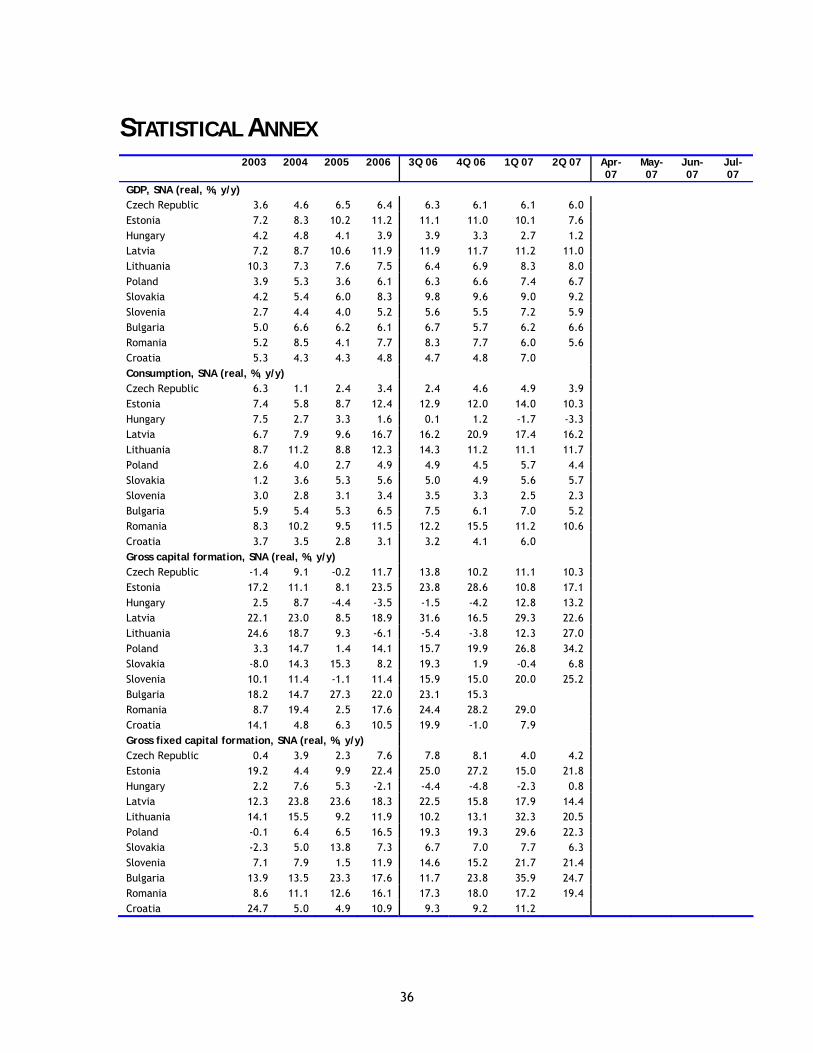
36
STATISTICAL ANNEX 2003 2004 2005 2006 3Q 06 4Q 06 1Q 07 2Q 07 Apr-
07 May-07
Jun-07
Jul-07
GDP, SNA (real, %, y/y) Czech Republic 3.6 4.6 6.5 6.4 6.3 6.1 6.1 6.0 Estonia 7.2 8.3 10.2 11.2 11.1 11.0 10.1 7.6 Hungary 4.2 4.8 4.1 3.9 3.9 3.3 2.7 1.2 Latvia 7.2 8.7 10.6 11.9 11.9 11.7 11.2 11.0 Lithuania 10.3 7.3 7.6 7.5 6.4 6.9 8.3 8.0 Poland 3.9 5.3 3.6 6.1 6.3 6.6 7.4 6.7 Slovakia 4.2 5.4 6.0 8.3 9.8 9.6 9.0 9.2 Slovenia 2.7 4.4 4.0 5.2 5.6 5.5 7.2 5.9 Bulgaria 5.0 6.6 6.2 6.1 6.7 5.7 6.2 6.6 Romania 5.2 8.5 4.1 7.7 8.3 7.7 6.0 5.6 Croatia 5.3 4.3 4.3 4.8 4.7 4.8 7.0 Consumption, SNA (real, %, y/y) Czech Republic 6.3 1.1 2.4 3.4 2.4 4.6 4.9 3.9 Estonia 7.4 5.8 8.7 12.4 12.9 12.0 14.0 10.3 Hungary 7.5 2.7 3.3 1.6 0.1 1.2 -1.7 -3.3 Latvia 6.7 7.9 9.6 16.7 16.2 20.9 17.4 16.2 Lithuania 8.7 11.2 8.8 12.3 14.3 11.2 11.1 11.7 Poland 2.6 4.0 2.7 4.9 4.9 4.5 5.7 4.4 Slovakia 1.2 3.6 5.3 5.6 5.0 4.9 5.6 5.7 Slovenia 3.0 2.8 3.1 3.4 3.5 3.3 2.5 2.3 Bulgaria 5.9 5.4 5.3 6.5 7.5 6.1 7.0 5.2 Romania 8.3 10.2 9.5 11.5 12.2 15.5 11.2 10.6 Croatia 3.7 3.5 2.8 3.1 3.2 4.1 6.0 Gross capital formation, SNA (real, %, y/y) Czech Republic -1.4 9.1 -0.2 11.7 13.8 10.2 11.1 10.3 Estonia 17.2 11.1 8.1 23.5 23.8 28.6 10.8 17.1 Hungary 2.5 8.7 -4.4 -3.5 -1.5 -4.2 12.8 13.2 Latvia 22.1 23.0 8.5 18.9 31.6 16.5 29.3 22.6 Lithuania 24.6 18.7 9.3 -6.1 -5.4 -3.8 12.3 27.0 Poland 3.3 14.7 1.4 14.1 15.7 19.9 26.8 34.2 Slovakia -8.0 14.3 15.3 8.2 19.3 1.9 -0.4 6.8 Slovenia 10.1 11.4 -1.1 11.4 15.9 15.0 20.0 25.2 Bulgaria 18.2 14.7 27.3 22.0 23.1 15.3 Romania 8.7 19.4 2.5 17.6 24.4 28.2 29.0 Croatia 14.1 4.8 6.3 10.5 19.9 -1.0 7.9 Gross fixed capital formation, SNA (real, %, y/y) Czech Republic 0.4 3.9 2.3 7.6 7.8 8.1 4.0 4.2 Estonia 19.2 4.4 9.9 22.4 25.0 27.2 15.0 21.8 Hungary 2.2 7.6 5.3 -2.1 -4.4 -4.8 -2.3 0.8 Latvia 12.3 23.8 23.6 18.3 22.5 15.8 17.9 14.4 Lithuania 14.1 15.5 9.2 11.9 10.2 13.1 32.3 20.5 Poland -0.1 6.4 6.5 16.5 19.3 19.3 29.6 22.3 Slovakia -2.3 5.0 13.8 7.3 6.7 7.0 7.7 6.3 Slovenia 7.1 7.9 1.5 11.9 14.6 15.2 21.7 21.4 Bulgaria 13.9 13.5 23.3 17.6 11.7 23.8 35.9 24.7 Romania 8.6 11.1 12.6 16.1 17.3 18.0 17.2 19.4 Croatia 24.7 5.0 4.9 10.9 9.3 9.2 11.2

37
2003 2004 2005 2006 3Q 06 4Q 06 1Q 07 2Q 07 Apr-
07 May-07
Jun-07
Jul-07
Exports, SNA (real, %, y/y) Czech Republic 7.2 20.7 11.8 15.9 12.7 17.1 15.3 13.8 Estonia 8.0 16.6 20.5 8.3 7.1 -0.7 6.5 3.3 Hungary 6.2 15.7 11.5 17.9 17.2 20.1 17.6 14.6 Latvia 5.2 9.4 20.3 5.3 3.5 -3.0 8.4 8.7 Lithuania 6.9 4.4 14.5 15.4 14.1 8.0 5.6 4.5 Poland 14.2 14.0 8.0 14.5 14.5 10.6 11.8 7.8 Slovakia 15.9 7.9 13.5 20.7 23.8 22.6 24.1 18.0 Slovenia 3.1 12.5 10.5 10.0 6.9 9.5 14.3 13.6 Bulgaria 10.7 12.7 8.5 9.0 8.4 5.4 2.2 5.7 Romania 8.4 13.9 8.1 10.6 10.6 8.6 12.9 2.4 Croatia 11.4 5.7 4.6 6.9 2.2 11.1 3.0 Imports, SNA (real, %, y/y) Czech Republic 8.0 17.9 5.0 15.2 11.8 17.1 16.1 13.9 Estonia 10.4 15.5 16.3 17.1 15.0 10.8 9.8 3.5 Hungary 9.3 14.1 6.9 12.4 10.4 14.5 14.9 14.1 Latvia 13.1 16.6 14.8 17.5 22.4 16.6 29.5 23.0 Lithuania 10.4 14.9 16.0 15.4 18.3 9.5 10.3 16.0 Poland 9.3 15.2 4.7 15.8 15.9 16.0 14.7 14.2 Slovakia 7.6 8.8 15.5 17.8 22.9 15.3 17.7 14.1 Slovenia 6.7 13.4 7.0 10.4 8.4 10.7 14.6 17.0 Bulgaria 16.4 14.5 13.1 15.1 14.7 13.9 13.2 10.7 Romania 16.0 22.1 16.6 23.0 24.7 25.5 23.8 20.8 Croatia 12.1 4.6 3.5 7.3 5.5 5.0 3.7 Industrial production (%, y/y) Czech Republic 5.5 9.6 6.7 9.7 8.2 7.7 11.6 9.3 3.5 6.8 6.6 11.5 Estonia 11.1 10.5 10.9 7.0 6.1 5.5 8.8 7.5 1.5 6.2 5.7 7.4 Hungary 6.4 7.4 7.0 10.1 10.2 9.9 9.4 7.6 1.9 3.2 8.9 12.1 Latvia 6.5 6.0 5.6 5.1 5.1 2.7 1.0 1.3 4.8 3.6 1.2 1.8 Lithuania 16.1 10.8 7.3 7.8 6.9 -1.0 -0.7 3.2 9.6 0.1 5.1 12.2 Poland 8.3 12.3 4.1 12.1 12.3 10.9 13.2 8.8 5.7 8.1 5.6 10.4 Slovakia 5.1 4.2 3.6 9.8 11.0 9.7 15.3 14.9 3.5 17.5 11.3 20.1 Slovenia 1.4 4.8 3.1 6.5 7.6 6.9 9.2 7.9 0.2 3.9 6.0 8.9 Bulgaria 14.1 17.1 6.7 6.1 6.9 3.4 7.0 8.8 2.7 7.0 7.7 13.0 Romania 3.2 5.4 2.2 7.1 7.7 7.1 7.6 4.6 0.6 6.8 4.6 7.1 Croatia 4.1 3.7 5.1 4.5 5.9 6.1 8.0 7.1 9.4 7.7 4.4 8.5 Retail sales (excl. motor vehicles, automotive fuel, %, y/y) Czech Republic 4.0 3.0 3.7 6.5 5.9 6.1 8.6 7.3 5.6 6.6 6.9 7.4 Estonia 9.9 15.5 12.0 16.3 16.0 18.3 20.7 15.7 14.0 16.0 15.0 11.0 Hungary 8.9 5.7 5.6 4.3 4.4 2.1 0.0 -3.0 5.7 -3.5 -3.6 Latvia 13.4 12.5 21.2 19.7 19.4 25.2 29.0 24.3 14.0 24.4 24.4 24.7 Lithuania 11.1 10.7 12.9 7.2 7.1 6.2 12.7 14.7 6.6 15.9 15.4 11.5 Poland 3.6 7.1 2.1 12.0 12.0 13.9 17.0 15.4 13.3 14.8 16.2 17.1 Slovakia -5.2 6.2 9.7 8.8 9.0 8.8 3.8 7.8 8.6 9.7 7.5 5.9 Slovenia 3.8 6.8 1.4 -0.3 0.4 2.7 0.6 1.8 1.2 -2.0 1.1 Bulgaria 11.0 14.5 12.7 13.0 14.1 14.0 12.0 10.0 Romania 17.6 24.3 25.4 21.0 3.9 13.4 16.3 11.8 15.5 23.3 Croatia 5.8 2.5 3.0 2.2 2.1 4.1 7.7 5.8 7.1 6.2 4.1 6.0

38
2003 2004 2005 2006 3Q 06 4Q 06 1Q 07 2Q 07 Apr-
07 May-07
Jun-07
Jul-07
Unemployment (%, NSA, LFS data) Czech Republic 7.8 8.3 7.9 7.1 7.0 6.5 6.0 5.3 Estonia 10.0 9.7 7.9 5.9 5.4 5.6 5.3 5.2 Hungary 5.9 6.1 7.2 7.5 7.5 7.5 7.5 7.0 Latvia 10.5 10.4 8.9 6.8 6.2 6.1 7.1 6.1 Lithuania 12.4 11.4 8.3 5.6 5.7 4.8 5.0 4.8 Poland 19.6 19.0 17.7 13.8 13.0 12.2 11.3 10.4 Slovakia 17.6 18.2 16.3 13.4 12.8 12.0 11.5 11.1 Slovenia 6.7 6.3 6.5 6.0 5.5 5.6 5.7 4.6 Bulgaria 13.7 12.0 10.1 9.0 8.8 8.4 8.0 6.8 Romania 7.0 8.1 7.2 7.4 7.0 7.2 7.1 7.1 Croatia 14.3 13.8 12.7 11.2 ... 10.5 11.2 CPI inflation (%, average y/y) Czech Republic 0.1 2.8 1.9 2.5 2.9 1.5 1.6 2.5 2.8 2.4 2.5 2.3 Estonia 1.3 3.0 4.1 4.4 4.4 4.5 5.2 5.7 4.3 5.7 5.8 6.4 Hungary 4.7 6.8 3.6 3.9 4.1 6.4 8.5 8.6 2.3 8.5 8.6 8.4 Latvia 2.9 6.2 6.7 6.5 6.5 6.3 7.6 8.6 6.1 8.2 8.8 9.5 Lithuania -1.2 1.2 2.7 3.8 3.9 4.2 4.3 4.8 3.5 4.8 4.8 5.1 Poland 0.8 3.5 2.1 1.0 1.4 1.3 2.0 2.4 0.7 2.3 2.6 2.3 Slovakia 8.5 7.5 2.7 4.5 4.9 4.1 2.8 2.5 4.5 2.3 2.5 2.3 Slovenia 5.6 3.6 2.5 3.0 2.5 2.2 2.4 3.0 2.7 2.9 3.6 3.8 Bulgaria 2.3 6.1 5.0 7.3 6.7 6.1 5.2 4.7 8.1 4.3 5.6 8.4 Romania 15.3 11.9 9.0 6.6 5.9 4.8 3.8 3.8 6.9 3.8 3.8 4.0 Croatia 1.8 2.1 3.3 3.2 3.2 2.2 1.5 2.1 2.3 2.2 1.9 2.1 PPI (%, average y/y) Czech Republic -0.3 5.7 3.0 1.6 2.6 2.2 3.2 4.1 0.5 4.1 4.6 4.1 Estonia 0.2 2.9 2.1 4.5 4.8 5.7 7.0 8.5 3.9 8.7 8.3 8.7 Hungary 2.4 3.5 4.3 6.5 9.4 5.7 3.5 -0.5 5.8 0.4 -2.0 -2.8 Latvia 3.2 8.6 7.8 13.2 11.4 12.8 15.8 17.8 8.8 18.0 17.7 17.6 Lithuania -0.2 6.8 13.5 2.8 6.2 1.0 1.1 4.8 9.6 5.6 5.0 4.1 Poland 2.6 7.0 0.7 2.3 3.5 2.8 3.3 2.0 1.7 2.1 1.7 1.5 Slovakia 8.3 2.6 5.3 5.7 6.8 2.8 0.1 -1.7 5.9 -2.1 -1.9 -3.1 Slovenia 2.5 4.3 2.7 2.3 2.6 3.1 4.2 4.7 1.7 4.7 4.6 4.3 Bulgaria 6.0 6.9 6.9 9.0 5.9 7.7 6.3 4.8 5.4 6.0 7.3 Romania 19.1 10.6 11.6 12.6 11.0 9.4 7.6 10.6 7.6 6.4 5.6 Croatia 1.9 3.5 3.0 2.9 2.7 1.7 2.0 2.5 2.3 2.3 2.9 3.6 Exchange rate (nominal, LCU/EUR, period average) Czech Republic 31.8 31.9 29.8 28.3 28.3 28.0 28.0 28.3 28.5 28.2 28.5 28.4 Estonia 15.6 15.6 15.6 15.6 15.6 15.6 15.6 15.6 15.6 15.6 15.6 15.6 Hungary 253.6 251.7 248.1 264.3 275.4 260.3 252.3 248.3 265.5 248.4 250.3 246.9 Latvia 0.641 0.665 0.696 0.696 0.696 0.697 0.702 0.699 0.696 0.697 0.696 0.697 Lithuania 3.453 3.453 3.453 3.453 3.453 3.453 3.453 3.453 3.453 3.453 3.453 3.453 Poland 4.400 4.527 4.023 3.896 3.954 3.848 3.886 3.801 3.918 3.782 3.807 3.768 Slovakia 41.5 40.0 38.6 37.2 37.8 35.9 34.3 33.8 37.4 33.7 34.0 33.3 Slovenia 233.8 239.1 239.6 239.6 239.6 239.6 239.6 239.6 239.6 239.6 239.6 239.6 Bulgaria 2.0 2.0 2.0 2.0 2.0 2.0 2.0 2.0 2.0 2.0 2.0 2.0 Romania 37551.0 40510.0 3.6 3.5 3.5 3.5 3.4 3.3 3.5 3.3 3.2 3.1 Croatia 7.6 7.5 7.4 7.3 7.3 7.4 7.4 7.4 7.4 7.3 7.3 7.3

39
2003 2004 2005 2006 3Q 06 4Q 06 1Q 07 2Q 07 Apr-
07 May-07
Jun-07
Jul-07
Exchange rate (nominal, LCU/USD, period average) Czech Republic 28.2 25.7 24.0 22.6 22.2 21.7 21.4 20.9 23.3 20.9 21.3 20.7 Estonia 13.9 12.6 12.6 12.5 12.3 12.1 11.9 11.6 12.8 11.6 11.7 11.4 Hungary 224.4 202.6 199.7 210.5 216.2 201.6 192.6 183.8 216.3 183.9 186.2 179.8 Latvia 0.6 0.5 0.6 0.6 0.6 0.5 0.5 0.5 0.6 0.5 0.5 0.5 Lithuania 3.1 2.8 2.8 2.8 2.7 2.7 2.6 2.6 2.8 2.6 2.6 2.5 Poland 3.9 3.7 3.2 3.1 3.1 3.0 3.0 2.8 3.2 2.8 2.8 2.7 Slovakia 36.8 32.3 31.0 29.7 29.7 27.9 26.2 25.0 30.5 25.0 25.3 24.3 Slovenia 207.1 192.4 192.7 191.0 188.0 185.9 Bulgaria 1.7 1.6 1.6 1.6 1.5 1.5 1.5 1.5 1.6 1.4 1.5 1.4 Romania 3.3 3.3 2.9 2.8 2.8 2.7 2.6 2.4 2.8 2.4 2.4 2.3 Croatia 6.7 6.0 5.9 5.8 5.7 5.7 5.6 5.5 5.4 5.4 5.5 5.3 Real effective exchange rate, CPI based (%, period average, y/y), (negative value= depreciation) Czech Republic -2.7 3.0 2.2 4.2 5.3 3.9 2.1 0.6 4.2 0.2 -0.8 Estonia 2.4 1.7 0.5 2.2 1.9 2.4 3.3 3.6 0.2 3.5 3.4 Hungary 0.2 7.7 0.6 -1.4 -8.6 1.6 8.2 14.3 -8.0 12.2 15.1 Latvia -3.3 1.1 -1.2 3.7 3.6 3.8 4.6 5.6 1.6 5.3 6.0 Lithuania 1.3 -0.5 -0.9 1.4 1.1 2.2 2.9 2.6 -1.8 2.5 2.0 Poland -10.4 7.0 5.2 1.1 1.0 1.5 -1.1 4.0 3.1 3.1 5.8 Slovakia 13.5 7.9 1.0 7.1 5.0 9.1 9.7 10.9 5.4 10.6 10.5 Slovenia 2.5 -1.1 -0.8 0.2 0.0 0.4 0.9 0.9 -1.7 0.7 0.9 Bulgaria 3.8 2.9 -0.1 2.4 6.1 4.9 -5.9 -10.6 1.8 -11.1 -11.0 Romania -1.7 6.5 10.6 7.2 4.1 8.6 8.7 9.0 6.7 8.6 10.8 Croatia -2.5 -3.3 -2.1 -1.9 -2.7 -2.8 -1.6 -0.1 -1.6 -1.0 Exports of goods (EUR, %, y/y) Czech Republic 5.8 28.8 13.2 20.6 17.6 22.4 19.0 16.4 11.1 12.9 14.0 21.3 Estonia 9.9 19.3 29.6 22.0 19.8 11.7 8.5 8.0 28.3 11.5 2.7 13.7 Hungary 4.4 17.3 13.2 18.5 16.1 21.1 18.0 14.9 8.4 10.8 17.6 20.7 Latvia 5.8 26.0 28.7 18.2 19.6 16.2 24.4 24.0 9.2 28.1 19.5 24.7 Lithuania 11.2 21.4 26.9 18.7 17.1 0.6 6.3 7.4 17.8 2.8 11.3 24.2 Poland 9.3 26.9 19.2 22.7 23.4 19.7 14.4 10.8 14.5 9.2 8.3 13.8 Slovakia 26.7 15.5 15.5 29.0 30.4 32.5 38.1 30.6 17.0 30.2 24.0 34.4 Slovenia 2.9 16.6 17.6 19.7 18.0 20.0 21.8 18.7 12.3 17.8 17.3 22.0 Bulgaria 10.0 19.7 18.6 26.6 32.1 15.8 6.7 8.2 3.2 11.5 9.8 14.7 Romania 6.4 21.3 17.5 16.2 9.3 15.4 12.2 11.0 4.3 7.0 10.1 19.1 Croatia 5.3 18.1 9.5 16.7 12.0 19.2 1.9 16.7 24.3 9.3 17.9 20.1 Imports of goods (EUR, %, y/y) Czech Republic 6.4 23.0 9.3 20.7 16.8 21.9 18.0 14.1 11.3 9.5 14.0 20.7 Estonia 12.9 16.9 22.5 28.8 26.3 17.9 8.8 4.8 32.3 11.4 -7.9 1.4 Hungary 5.9 15.2 9.9 16.5 13.1 17.7 13.9 12.6 4.2 7.9 16.0 15.5 Latvia 8.1 23.3 22.6 31.5 34.6 28.7 33.2 25.8 22.9 21.3 27.4 39.4 Lithuania 7.1 16.8 25.5 23.5 23.7 10.7 13.7 16.7 -3.4 13.6 11.8 25.1 Poland 3.2 19.5 13.3 23.8 23.8 23.4 16.1 14.1 13.4 9.1 12.6 18.9 Slovakia 13.7 20.6 18.5 28.4 32.8 25.9 27.3 24.3 17.1 25.1 21.4 29.4 Slovenia 5.7 16.7 14.5 17.4 15.6 17.2 19.9 22.9 5.9 21.6 17.2 20.1 Bulgaria 14.3 20.3 26.9 25.2 28.0 24.0 19.3 18.0 15.6 17.6 20.7 19.6 Romania 12.3 24.0 23.9 25.1 22.5 26.5 33.5 25.1 15.3 22.4 23.6 28.4 Croatia 10.7 6.5 11.9 14.4 13.0 11.2 7.9 10.9 16.4 15.6 1.2 17.0

40
2003 2004 2005 2006 3Q 06 4Q 06 1Q 07 2Q 07 Apr-
07 May-07
Jun-07
Jul-07
Trade balance (% GDP) Czech Republic -2.7 -0.5 2.0 2.1 2.0 2.1 2.5 2.8 Estonia -15.8 -17.0 -13.7 -17.7 -16.9 -17.7 -17.9 -17.2 Hungary -3.9 -3.0 -1.6 -0.5 -1.0 -0.5 Latvia -17.8 -20.2 -18.9 -24.4 -23.2 -24.4 -25.3 -26.2 Lithuania -9.0 -10.6 -11.4 -13.9 -13.2 -13.9 -14.5 -15.3 Poland -2.6 -2.3 -0.9 -1.4 -1.1 -1.4 -1.7 -2.1 Slovakia -1.9 -3.5 -5.2 -5.6 -6.4 -5.6 -4.2 -3.3 Slovenia -2.2 -3.8 -3.7 -3.8 -3.8 -3.8 -3.7 -4.4 Bulgaria -14.0 -11.9 -20.2 -22.2 -20.8 -22.2 -23.6 -24.9 Romania -7.6 -8.7 -9.8 -12.1 -11.4 -12.1 -13.2 -14.4 Croatia -26.6 -23.5 -24.1 -24.4 -24.3 -24.4 -23.4 Current account (% GDP) Czech Republic -6.2 -5.2 -1.6 -3.1 -2.3 -3.1 -3.1 -3.4 Estonia -11.3 -12.3 -10.0 -15.5 -13.8 -15.5 -15.9 -15.6 Hungary -7.9 -8.4 -6.8 -5.8 -6.1 -5.8 -5.2 Latvia -8.1 -12.9 -12.6 -21.1 -18.0 -21.1 -23.5 -24.1 Lithuania -6.8 -7.7 -7.2 -10.8 -9.9 -10.8 -11.5 -12.5 Poland -2.1 -4.3 -1.7 -2.3 -1.9 -2.3 -2.5 -3.0 Slovakia -0.8 -3.4 -8.6 -8.3 -10.3 -8.3 -6.9 -5.8 Slovenia -0.8 -2.7 -2.0 -2.5 -2.5 -2.5 -2.7 -3.9 Bulgaria -5.6 -5.3 -12.0 -15.7 -13.9 -15.7 -17.3 -19.1 Romania -5.9 -8.4 -8.6 -10.3 -9.9 -10.3 -11.6 -12.9 Croatia -7.1 -5.1 -6.4 -7.8 -8.0 -7.8 -7.5 FDI net (% GDP) Czech Republic 2.1 3.6 9.3 3.2 4.1 3.2 3.6 3.8 Estonia 7.9 5.8 15.6 3.5 1.2 3.5 2.7 4.6 Hungary 0.6 3.3 4.8 2.7 6.0 2.7 0.7 Latvia 2.3 4.3 3.7 7.4 5.8 7.4 7.3 8.1 Lithuania 0.8 2.3 2.7 5.1 2.2 5.1 6.1 6.4 Poland 2.0 4.7 2.1 3.0 2.6 3.0 3.1 2.5 Slovakia 2.2 3.3 4.1 6.9 7.0 6.9 5.5 3.7 Slovenia -0.6 0.9 -0.2 -1.0 0.0 -1.0 -1.0 -0.9 Bulgaria 10.5 9.1 14.5 16.8 15.1 16.8 16.7 16.9 Romania 3.7 8.4 6.6 9.3 7.0 9.3 8.4 8.3 Croatia 6.4 2.1 3.9 7.4 5.1 7.4 8.5 Net portfolio investment (% GDP) Czech Republic -1.4 1.9 -2.7 -0.8 -2.4 -0.8 -1.2 -0.2 Estonia 1.8 6.0 -15.7 -8.1 -8.2 -8.1 -2.6 -3.2 Hungary 3.5 6.7 4.0 5.6 2.8 5.6 3.1 Latvia -2.0 1.7 -0.7 -0.1 0.0 -0.1 0.4 -1.1 Lithuania 1.5 0.9 -1.0 -0.8 -2.2 -0.8 -3.1 -2.5 Poland 1.1 3.7 4.1 -0.8 -0.7 -0.8 -2.0 -1.8 Slovakia -1.7 2.1 -2.1 2.9 1.7 2.9 -0.9 0.6 Slovenia -0.9 -2.4 -5.9 -4.9 -5.2 -4.9 -6.0 -9.1 Bulgaria -1.1 -2.0 -5.9 0.5 0.3 0.5 -0.7 -0.4 Romania 1.0 -0.7 1.0 0.1 -0.1 0.1 -0.1 0.1 Croatia 3.3 1.0 -3.8 -1.3 -0.5 -1.3 -0.3

41
2003 2004 2005 2006 3Q 06 4Q 06 1Q 07 2Q 07 Apr-
07 May-07
Jun-07
Jul-07
General government balance (ESA95, % GDP) Czech Republic -6.6 -2.9 -3.5 -2.9 Estonia 2.0 2.3 2.3 3.8 Hungary -7.2 -6.4 -7.8 -9.2 Latvia -1.6 -1.0 -0.2 0.4 Lithuania -1.3 -1.5 -0.5 -0.3 Poland -6.3 -5.7 -4.3 -3.9 Slovakia -2.8 -2.4 -2.8 -3.4 Slovenia -2.8 -2.3 -1.5 -1.4 Bulgaria -0.9 2.2 1.9 3.3 Romania -1.5 -1.5 -1.4 -1.9 Croatia -4.5 -5.0 -2.9 -2.2 General government revenue (ESA95, % GDP) Czech Republic 40.7 41.5 40.4 39.7 Estonia 37.4 36.6 35.5 37.0 Hungary 41.9 42.5 42.2 43.7 Latvia 33.2 34.7 35.2 37.4 Lithuania 32.0 31.8 33.1 33.3 Poland 38.4 37.0 39.1 39.6 Slovakia 37.5 35.4 35.2 33.9 Slovenia 45.3 45.1 45.6 44.8 Bulgaria 40.0 41.4 41.4 39.9 Romania 32.1 31.1 32.4 30.1 Croatia 45.0 45.0 General government expenditure (ESA95, % GDP) Czech Republic 47.3 44.4 44.0 42.6 Estonia 35.3 34.2 33.2 33.2 Hungary 49.1 48.9 50.0 53.0 Latvia 34.8 35.8 35.5 37.0 Lithuania 33.2 33.4 33.6 33.6 Poland 44.7 42.7 43.5 43.6 Slovakia 40.3 37.8 38.0 37.3 Slovenia 48.0 47.4 47.0 46.3 Bulgaria 40.9 39.3 39.5 36.6 Romania 33.6 32.6 33.7 32.0 Croatia 47.9 47.2 Public debt (ESA95, % GDP) Czech Republic 30.1 30.7 30.4 30.4 Estonia 5.7 5.2 4.4 4.1 Hungary 58.0 59.4 61.7 66.0 Latvia 14.4 14.5 12.0 10.0 Lithuania 21.2 19.4 18.6 18.2 Poland 47.1 45.7 47.1 47.8 Slovakia 42.4 41.5 34.5 30.7 Slovenia 28.6 28.9 28.4 27.8 Bulgaria 45.9 37.9 29.2 22.8 Romania 21.5 18.8 15.8 12.4 Croatia 40.8 43.2 43.8 41.0 Oil (Brent) USD/BBL 28.8 35.8 50.9 65.4 69.2 59.5 57.8 69.0 67.7 67.4 71.8 77.9
Exch. Rate (USD/EUR) 1.131 1.244 1.244 1.244 1.274 1.289 1.311 1.348 1.227 1.351 1.342 1.372 Source: Eurostat, EC, WIIW, CSOs, NCBs, World Bank, IMF IFS, staff calculations.