Programma Concerto “RENAISSANCE” Lombardia Region sustainable urban & rural communities

WW
W.A
SR-L
OM
BARD
IA.IT
ENG
LISH
REGIONALSTATISTICAL YEARBOOK
2O11Lombardiain Europe

Director-GeneralAntonio Vincenzo LentiniTechnical and Scientific CommitteeRosalia Coniglio, Antonio Vincenzo Lentini, Anna Maria ZerboniWorking groupArianna Carra, Paolo Caruso, Iris Eforti, Nicolina Marino, Paolo LongoniScientific CoordinationAnna Maria ZerboniTechnical and operative coordinationIris EfortiDatabase updatingPaola ZitoTranslationPaola ZitoAcknowledgement is given to the staff of Éupolis Lombardia, Unioncame-re Lombardia and Istat for their precious contribution to the collection of the data. Acknowledgement is also given to all the Bodies that supplied the data presented in this publication.The complete collection and the monthly update of the statistical data is available on the internet www.asr-lombardia.itCopyright 2002 by Regione Lombardia, Unioncamere Lombardia, Istat.Registration nr. 20, Court of Milan, 21 January 2002.Graphic projectGramma - Communication agency - Social CooperativeVia E. Fonseca Pimentel, 7 - 20127 Milano.Printed by Arti Grafiche Colombo - Via M. D’Azeglio, 16 - 20060 Gessate (MI)The publication is not for sale. Reproduction is authorised provided that the source is acknowledged.Printed: June 2011

1METHODOLOGICAL NOTE
The new regional comparisons comprise 50 European areas and two macro aggregates: EU27 for the European Union and EU27 for statistics that do not cover the two new Member State (Bulgaria and Romania).This publication provides national statistics of the 27 Member States, which enable to compare Italy and Lombardia to other Member States, as well as regional statistics, covering those regions that are similar to Lombardia.The 22 regions that are compared to Lombardia belong to the NUTS1 and NUTS2 categories and have been selected according to a set of parameters (described here below).The NUTS nomenclature (Nomenclature of territorial units for statistics) is drawn up by Eurostat according to a hierarchical classification of the institutional levels present in the various European countries.NUTS0 is country level (it for Italy, de for Germany, fr for France…). The NUTS1 category includes the German and Belgian Federal States and aggregates of regions of the most populated states (de1 for Bayern, be2 for Vlaams Gewest, itc for the North-West of Italy, ukg for theWest Midlands in the United Kingdom…). The NUTS2 category corresponds to the Italian regions, the French departments, the Spanish autonomous communities (itc4 for Lombardia, fr71 for Rhône-Alps, es51 for Cataluña…).
LThe NUTS structure is the following: •it Italia •itc NordOvest •itc4 Lombardia
The parameters used to select the regions to be compared with Lombardia refer to:according to the following parameters: •Surfacearea •Population •Populationdensity •GrossDomesticProduct •PercapitaGrossDomesticProduct

2
The values of the regions selected varied between + / - 50% compared to the values recorded in Lombardia; the data presented refer to those regions that had the largest number of parameters complying with this criterion.
Although not fully meeting the parameters required, some other regions were included in the comparisons, in order to provide a more balanced description of the various Member States.Hence the statistics presented cover 23 regional areas (13 NUTS1 and 10 NUTS2), including Lombardia, out of a total of 82 areas under NUTS1 level and 254 areas under NUTS2 level.
METHODOLOGICAL NOTE
CONTENTS
INTRODUCTION
TERRITORY
POPULATION
HEALTH
EDUCATION
LABOUR MARKET
ECONOMIC ACCOUNTS
HOUSEHOLD INCOME
TOURISM
TRANSPORTATION
INFORMATION SOCIETY
Notes to the tables
: data not available PPS purchasing power standard
3CONTENTS
% compared to the values recorded in Lombardia; the data presented refer to those regions that had
the parameters required, some other regions were included in the comparisons, in order to provide a more balanced
NUTS1 and 10 areas under NUTS1 level and
METHODOLOGICAL NOTE 1
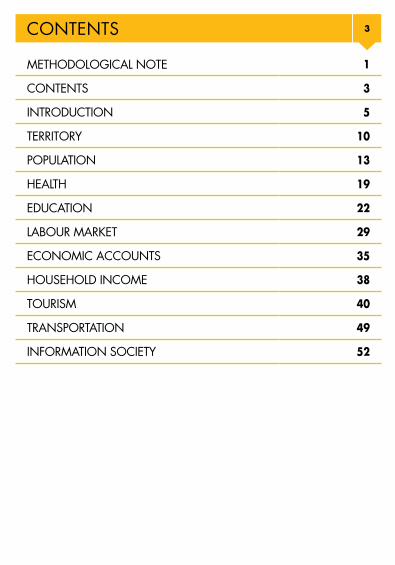
CONTENTS 3
INTRODUCTION 5
TERRITORY 10
POPULATION 13
HEALTH 19
EDUCATION 22
LABOUR MARKET 29
ECONOMIC ACCOUNTS 35
HOUSEHOLD INCOME 38
TOURISM 40
TRANSPORTATION 49
INFORMATION SOCIETY 52

THE 23 SELECTED REGIONS
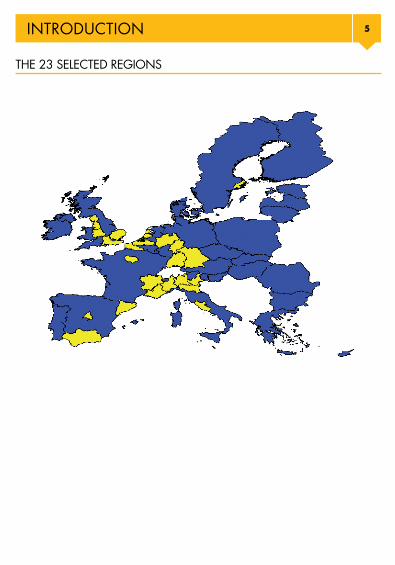
5INTRODUCTION
THE 23 SELECTED REGIONS

6 INTRODUCTION
Code BE2Region Vlaams GewestChief town Antwerpen
Code DE1Region Baden-WürttembergChief town Stuttgart
Code DE2Region BayernChief town München
Code DE7Region HessenChief town Wiesbaden
Code DEARegion Nordrhein - WestfalenChief town Düsseldorf
Code FR10Region Île de FranceChief town Paris
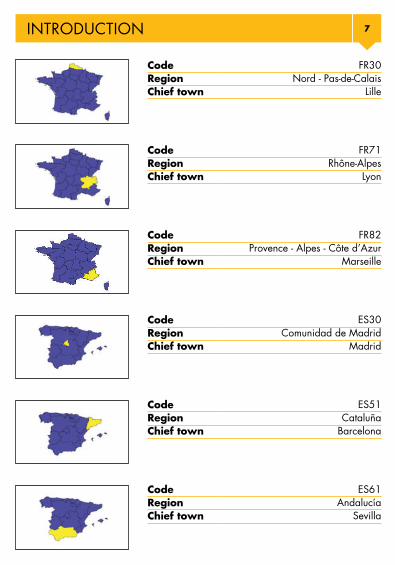
7INTRODUCTION
BE2Vlaams Gewest
Antwerpen
DE1Baden-Württemberg
Stuttgart
DE2Bayern
München
DE7Hessen
Wiesbaden
DEANordrhein - Westfalen
Düsseldorf
FR10Île de France
Paris
Code FR30Region Nord - Pas-de-CalaisChief town Lille
Code FR71Region Rhône-AlpesChief town Lyon
Code FR82Region Provence - Alpes - Côte d’AzurChief town Marseille
Code ES30Region Comunidad de MadridChief town Madrid
Code ES51Region CataluñaChief town Barcelona
Code ES61Region Andalucía Chief town Sevilla

8 INTRODUCTION
Code NL3Region West-NederlandChief town Amsterdam
Code SE11Region StockholmChief town Stockholm
Code UKDRegion North WestChief town Manchester
Code UKGRegion West MidlandsChief town Birmingham
Code UKHRegion EasternChief town Luton
Code UKJRegion South EastChief town Southampton

9INTRODUCTION
NL3West-Nederland
Amsterdam
SE11StockholmStockholm
UKDNorth WestManchester
UKGWest Midlands
Birmingham
UKHEastern
Luton
UKJSouth East
Southampton
Code ITC1Region PiemonteChief town Torino
Code ITC4Region LombardiaChief town Milano
Code ITD3Region VenetoChief town Venezia
Code ITD5Region Emilia-RomagnaChief town Bologna
Code ITE4Region LazioChief town Roma
10
MAIN DEMOGRAPHIC INDICATORS. EUROPEAN REGIONS. YEAR 2008
EU27EU25BE2 Vlaams GewestDE1 Baden-WürttembergDE2 BayernDE7 HessenDEA Nordrhein-WestfalenES3 Comunidad de MadridES51 CataluñaES61 AndalucíaFR1 Île de FranceFR3 Nord - Pas-de-CalaisFR71 Rhône-Alpes
FR82 Provence - Alpes - Côte d’Azur
ITC1 PiemonteITC4 LombardiaITD3 VenetoITD5 Emilia-RomagnaITE4 LazioNL3 West-NederlandSE01 StockholmUKD North WestUKG West MidlandsUKH EasternUKJ South EastSource: Eurostat
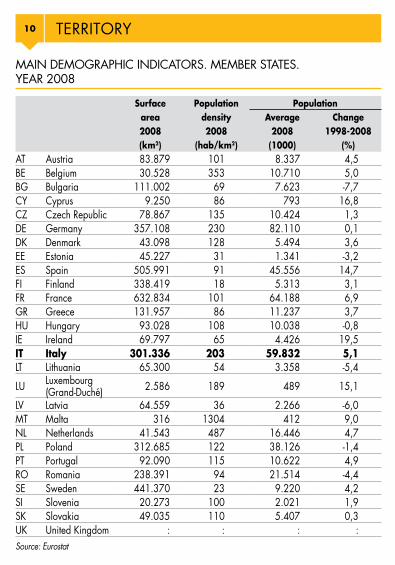
MAIN DEMOGRAPHIC INDICATORS. MEMBER STATES. YEAR 2008
Surface Population Populationarea density Average Change2008 2008 2008 1998-2008(km2) (hab/km2) (1000) (%)
AT Austria 83.879 101 8.337 4,5BE Belgium 30.528 353 10.710 5,0BG Bulgaria 111.002 69 7.623 -7,7CY Cyprus 9.250 86 793 16,8CZ Czech Republic 78.867 135 10.424 1,3DE Germany 357.108 230 82.110 0,1DK Denmark 43.098 128 5.494 3,6EE Estonia 45.227 31 1.341 -3,2ES Spain 505.991 91 45.556 14,7FI Finland 338.419 18 5.313 3,1FR France 632.834 101 64.188 6,9GR Greece 131.957 86 11.237 3,7HU Hungary 93.028 108 10.038 -0,8IE Ireland 69.797 65 4.426 19,5IT Italy 301.336 203 59.832 5,1LT Lithuania 65.300 54 3.358 -5,4
LU Luxembourg (Grand-Duché) 2.586 189 489 15,1
LV Latvia 64.559 36 2.266 -6,0MT Malta 316 1304 412 9,0NL Netherlands 41.543 487 16.446 4,7PL Poland 312.685 122 38.126 -1,4PT Portugal 92.090 115 10.622 4,9RO Romania 238.391 94 21.514 -4,4SE Sweden 441.370 23 9.220 4,2SI Slovenia 20.273 100 2.021 1,9SK Slovakia 49.035 110 5.407 0,3UK United Kingdom : : : :Source: Eurostat
TERRITORY

11
MAIN DEMOGRAPHIC INDICATORS. EUROPEAN REGIONS. YEAR 2008
Surface Population Populationarea density Average Change2008 2008 2008 1998-2008(km2) (hab/km2) (1000) (%)
EU27 4.403.357 : : :EU25 4.053.964 : : :BE2 Vlaams Gewest 13.522 463 6.185 4,5DE1 Baden-Württemberg 35.752 301 10.750 3,3DE2 Bayern 70.552 178 12.520 3,7DE7 Hessen 21.115 287 6.069 0,6DEA Nordrhein-Westfalen 34.086 527 17.965 -0,1ES3 Comunidad de Madrid 8.028 784 6.242 22,1ES51 Cataluña 32.113 227 7.264 17,8ES61 Andalucía 87.598 94 8.098 12,6FR1 Île de France 12.012 974 11.694 7,0FR3 Nord - Pas-de-Calais 12.414 324 4.025 0,7FR71 Rhône-Alpes 43.698 141 6.141 9,2
FR82 Provence - Alpes - Côte d’Azur 31.400 156 4.900 9,1
ITC1 Piemonte 25.403 178 4.417 4,3ITC4 Lombardia 23.863 425 9.693 8,5ITD3 Veneto 18.399 277 4.859 9,1ITD5 Emilia-Romagna 22.117 200 4.307 9,8ITE4 Lazio 17.236 331 5.594 9,0NL3 West-Nederland 11.893 889 7.695 5,0SE01 Stockholm 6.789 302 1.965 10,8UKD North West 14.163 : : :UKG West Midlands 13.004 : : :UKH Eastern 19.126 : : :UKJ South East 19.086 : : :Source: Eurostat
Change1998-2008
(%)4,55,0-7,7
16,81,30,13,6-3,2
14,73,16,93,7-0,8
19,55,1-5,4
15,1
-6,09,04,7-1,44,9-4,44,21,90,3
:
TERRITORY

12 TERRITORY
Source: calculation based on Eurostat data
The European regions observed are characterised by different population densities. These range from less than 100 inhabitants per km2 (Andalucía) to nearly 1,000 inhabitants per km2 (Île de France).
The population density of Île de France is more than two times greater than the one of Lombardia, whichisequalto425inhabitantsperkm2.
POPULATION DENSITY. YEAR 2008
Inhabitants per km2
POPULATION CHANGES IN THE EU MEMBER STATES (‰). YEARS 2008-2009
Source: calculation based on Eurostat data
POPULATION CHANGES IN SELECTED EUROPEAN REGIONS (‰). YEARS 2008-2009
Source: calculation based on Eurostat data
25
20
15
10
5
0
-5
-10
25
15
5
-5

13POPULATION
Fonte: elaborazione su dati Eurostat
Fonte: elaborazione su dati Eurostat
Popolazione
-10
-5
0
5
10
15
20
25
Variazioni ‰ popolazione. Stati europei. Anni 2008-2009
-5
5
15
25
Mad
rid
Sto
ccol
ma
Fian
dre
Em
ilia-
Rom
agna
And
alus
ia
Lazi
o
Vene
to
Lom
bard
ia
Rhô
ne-A
lpes
Cat
alog
na
Pro
venz
a-A
lpi-C
osta
A
zzur
ra
Pie
mon
te
Pae
si B
assi
Occ
iden
tali
Île d
e Fr
ance
Nor
d - P
as-d
e-C
alai
s
Bad
en-W
ürtte
mbe
rg
Bav
iera
Ass
ia
Ren
ania
Set
t. - V
estfa
lia
Variazioni ‰ popolazione. Regioni europee. Anni 2008-2009
The European regions observed are characterised by different population densities. These range (Andalucía) to nearly 1,000 inhabitants per km2 (Île de
The population density of Île de France is more than two times greater than the one of Lombardia,
POPULATION CHANGES IN THE EU MEMBER STATES (‰). YEARS 2008-2009
Source: calculation based on Eurostat data
Fonte: elaborazione su dati Eurostat
Fonte: elaborazione su dati Eurostat
Popolazione
-10
-5
0
5
10
15
20
25
Variazioni ‰ popolazione. Stati europei. Anni 2008-2009
-5
5
15
25
Mad
rid
Sto
ccol
ma
Fian
dre
Em
ilia-
Rom
agna
And
alus
ia
Lazi
o
Vene
to
Lom
bard
ia
Rhô
ne-A
lpes
Cat
alog
na
Pro
venz
a-A
lpi-C
osta
A
zzur
ra
Pie
mon
te
Pae
si B
assi
Occ
iden
tali
Île d
e Fr
ance
Nor
d - P
as-d
e-C
alai
s
Bad
en-W
ürtte
mbe
rg
Bav
iera
Ass
ia
Ren
ania
Set
t. - V
estfa
lia
Variazioni ‰ popolazione. Regioni europee. Anni 2008-2009
POPULATION CHANGES IN SELECTED EUROPEAN REGIONS (‰). YEARS 2008-2009
Source: calculation based on Eurostat data
LU BE ES IE SI CY CZ MT SE IT DK FR NL FI AT GR SK PT PL EE RO HU DE LV BG LT
25
20
15
10
5
0
-5
-10
25
15
5
-5
Mad
rid
Stoc
khol
m
Vlaa
ms
Gew
est
Emili
a-Ro
mag
na
And
aluc
ía
Lazi
o
Vene
to
Lom
bard
ia
Rhôn
e-A
lpes
Cata
luña
Prov
ence
- A
lpes
- Cô
ted’
Azu
r Piem
onte
Wes
t-Ned
erla
nd
Île d
e Fr
ance
Nor
d - P
as-d
e-Ca
lais
Bade
n-W
ürtte
mbe
rg
Baye
rn
Hes
sen
Nor
drhe
in-W
estfa
len

14
POPULATION CHANGES. EUROPEAN REGIONS. YEAR 2009
EU27EU25BE2 Vlaams GewestDE1 Baden-WürttembergDE2 BayernDE7 HessenDEA Nordrhein-WestfalenES3 Comunidad de MadridES51 CataluñaES61 AndalucíaFR1 Île de FranceFR3 Nord - Pas-de-CalaisFR71 Rhône-Alpes
FR82 Provence - Alpes - Côte d’Azur
ITC1 PiemonteITC4 LombardiaITD3 VenetoITD5 Emilia-RomagnaITE4 LazioNL3 West-NederlandSE11 StockholmUKD North WestUKG West MidlandsUKH EasternUKJ South EastSource: Eurostat
POPULATION CHANGES. MEMBER STATES. YEAR 2009
Resident population Breakdown by age
1.1.20091.1.2008 1.1.2009 Change (‰) <25 years >=65 years
AT Austria 8.318.592 8.355.260 4,4 22,5 22,2BE Belgium 10.666.866 10.839.905 16,2 : :BG Bulgaria 7.640.238 7.606.551 -4,4 21,8 21,8CY Cyprus 789.269 796.875 9,6 27,0 18,1
CZ Czech Republic 10.381.130 10.467.542 8,3 22,6 19,3
DE Germany 82.217.837 82.002.356 -2,6 20,5 24,9DK Denmark 5.475.791 5.511.451 6,5 24,2 21,9EE Estonia 1.340.935 1.340.415 -0,4 24,9 21,8ES Spain 45.283.259 45.828.172 12,0 20,7 21,5FI Finland 5.300.484 5.326.314 4,9 23,7 22,1FR France 64.007.290 64.369.147 5,7 24,9 22,7GR Greece 11.213.785 11.260.402 4,2 20,6 23,3HU Hungary 10.045.401 10.030.975 -1,4 22,6 21,1IE Ireland 4.401.335 4.450.030 11,1 27,3 17,9IT Italy 59.619.290 60.045.068 7,1 19,5 24,8LT Lithuania 3.366.357 3.349.872 -4,9 26,0 20,7
LU Luxembourg (Grand-Duché) 483.799 493.500 20,1 23,8 20,0
LV Latvia 2.270.894 2.261.294 -4,2 24,4 21,7MT Malta 410.290 413.609 8,1 24,9 19,1NL Netherlands 16.405.399 16.485.787 4,9 23,8 21,1PL Poland 38.115.641 38.135.876 0,5 25,5 18,3PT Portugal 10.617.575 10.627.250 0,9 21,4 22,9RO Romania 21.528.627 21.498.616 -1,4 24,6 19,9SE Sweden 9.182.927 9.256.347 8,0 24,6 23,1SI Slovenia 2.010.269 2.032.362 11,0 21,5 20,9SK Slovakia 5.400.998 5.412.254 2,1 25,6 16,9
UK United Kingdom 61.191.951 : : : :
Source: Eurostat
POPULATION

15POPULATION
POPULATION CHANGES. EUROPEAN REGIONS. YEAR 2009
Resident population Breakdown by age
1.1.2009
1.1.2008 1.1.2009 Change (‰)
<25 years
>=65 years
EU27 497.686.229 : : : :EU25 468.517.364 : : : :BE2 Vlaams Gewest 6.161.600 6.251.983 14,7 : :DE1 Baden-Württemberg 10.749.755 10.749.506 -0,0 21,6 24,1DE2 Bayern 12.520.332 12.519.728 -0,0 21,2 24,1DE7 Hessen 6.072.555 6.064.953 -1,3 20,4 24,5DEA Nordrhein-Westfalen 17.996.621 17.933.064 -3,5 21,2 24,9ES3 Comunidad de Madrid 6.189.297 6.295.011 17,1 21,0 19,9ES51 Cataluña 7.238.051 7.290.292 7,2 20,2 21,7ES61 Andalucía 8.046.131 8.150.467 13,0 23,4 20,0FR1 Île de France 11.659.260 11.729.613 6,0 26,5 19,0FR3 Nord - Pas-de-Calais 4.024.490 4.025.344 0,2 27,4 21,0FR71 Rhône-Alpes 6.117.229 6.165.126 7,8 25,6 22,2
FR82 Provence - Alpes - Côte d’Azur 4.882.913 4.918.050 7,2 23,5 25,1
ITC1 Piemonte 4.401.266 4.432.571 7,1 17,1 26,9ITC4 Lombardia 9.642.406 9.742.676 10,4 18,4 24,6ITD3 Veneto 4.832.340 4.885.548 11,0 18,7 24,4ITD5 Emilia-Romagna 4.275.802 4.337.979 14,5 16,9 26,8ITE4 Lazio 5.561.017 5.626.710 11,8 19,2 24,3NL3 West-Nederland 7.669.533 7.719.856 6,6 23,9 20,5SE11 Stockholm 1.949.516 1.981.263 16,3 24,6 20,1UKD North West 6.868.896 : : : :UKG West Midlands 5.393.394 : : : :UKH Eastern 5.683.034 : : : :UKJ South East 8.332.007 : : : :Source: Eurostat
Breakdown by age
1.1.2009>=65 years
22,2:
21,818,1
19,3
24,921,921,821,522,122,723,321,117,924,820,7
20,0
21,719,121,118,322,919,923,120,916,9
:
16 POPULATION
BIRTHS AND DEATHS. MEMBER STATES. YEAR 2008
AT AustriaBE BelgiumBG BulgariaCY CyprusCZ Czech RepublicDE GermanyDK DenmarkEE EstoniaES SpainFI FinlandFR FranceGR GreeceHU HungaryIE IrelandIT ItalyLT Lithuania
LU Luxembourg (Grand-Duché)
LV LatviaMT MaltaNL NetherlandsPL PolandPT PortugalRO RomaniaSE SwedenSI SloveniaSK SlovakiaUK United KingdomSource: Eurostat
Source: calculation based on Eurostat data
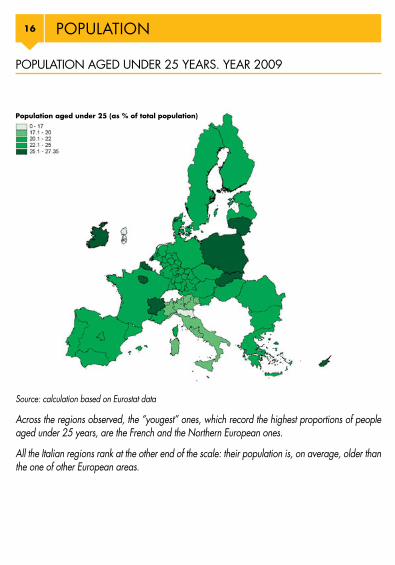
Across the regions observed, the “yougest” ones, which record the highest proportions of people agedunder25years,aretheFrenchandtheNorthernEuropeanones.
All the Italian regions rank at the other end of the scale: their population is, on average, older than the one of other European areas.
POPULATION AGED UNDER 25 YEARS. YEAR 2009
Population aged under 25 (as % of total population)

17POPULATION
BIRTHS AND DEATHS. MEMBER STATES. YEAR 2008
Births Deaths Birth rates Death rates(1000) (per 1000 inhabitants)
AT Austria 78,0 75,0 9,0 9,0BE Belgium : : : :BG Bulgaria 78,0 111,0 10,0 14,0CY Cyprus 9,0 5,0 : :CZ Czech Republic 120,0 105,0 11,0 10,0DE Germany : : : :DK Denmark 65,0 55,0 12,0 10,0EE Estonia 16,0 17,0 12,0 12,0ES Spain 519,0 384,0 11,0 8,0FI Finland 60,0 49,0 11,0 9,0FR France 828,0 541,0 : :GR Greece 118,0 108,0 11,0 10,0HU Hungary 99,0 130,0 10,0 13,0IE Ireland 75,0 28,0 17,0 6,0IT Italy 577,0 585,0 10,0 10,0LT Lithuania 35,0 44,0 10,0 13,0
LU Luxembourg (Grand-Duché) 6,0 4,0 : :
LV Latvia 24,0 31,0 11,0 14,0MT Malta 4,0 3,0 10,0 8,0NL Netherlands 185,0 135,0 11,0 8,0PL Poland 414,0 379,0 11,0 10,0PT Portugal 105,0 104,0 10,0 10,0RO Romania 222,0 253,0 10,0 12,0SE Sweden 109,0 91,0 12,0 10,0SI Slovenia 22,0 18,0 11,0 9,0SK Slovakia 57,0 53,0 11,0 10,0UK United Kingdom : : : :Source: Eurostat
Across the regions observed, the “yougest” ones, which record the highest proportions of people
All the Italian regions rank at the other end of the scale: their population is, on average, older than

18
HEALTH-CARE SERVICES: PERSONNEL AND HOSPITAL BEDS. MEMBER STATES. YEAR 2008
AT AustriaBE BelgiumBG BulgariaCY Cyprus
CZ Czech Republic
DE GermanyDK DenmarkEE EstoniaES SpainFI FinlandFR FranceGR GreeceHU HungaryIE IrelandIT ItalyLT Lithuania
LU Luxembourg (Grand-Duché)
LV LatviaMT MaltaNL NetherlandsPL PolandPT PortugalRO RomaniaSE SwedenSI SloveniaSK Slovakia
UK United Kingdom
Source: Eurostat
POPULATION
BIRTHS AND DEATHS. EUROPEAN REGIONS. YEAR 2008
Births Deaths Birth rates Death rates(1000) (per 1000 inhabitants)
EU27 : : : : EU25 : : : :BE2 Vlaams Gewest : : : :DE1 Baden-Württemberg 92,0 96,0 : :DE2 Bayern 106,0 121,0 : :DE7 Hessen 52,0 60,0 : :DEA Nordrhein-Westfalen 150,0 190,0 : :ES3 Comunidad de Madrid 79,0 41,0 13,0 7,0ES51 Cataluña 89,0 60,0 12,0 8,0ES61 Andalucía 100,0 66,0 12,0 8,0FR1 Île de France 181,0 70,0 : :FR3 Nord - Pas-de-Calais 56,0 36,0 : :FR71 Rhône-Alpes 81,0 46,0 : :
FR82 Provence - Alpes - Côte d’Azur 59,0 45,0 : :
ITC1 Piemonte 40,0 49,0 9,0 11,0ITC4 Lombardia 99,0 90,0 10,0 9,0ITD3 Veneto 49,0 45,0 10,0 9,0ITD5 Emilia-Romagna 42,0 48,0 10,0 11,0ITE4 Lazio 57,0 52,0 10,0 9,0NL3 West-Nederland 91,0 62,0 12,0 8,0SE11 Stockholm 28,0 16,0 14,0 8,0UKD North West : : : :UKG West Midlands : : : :UKH Eastern : : : :UKJ South East : : : :Source: Eurostat

19
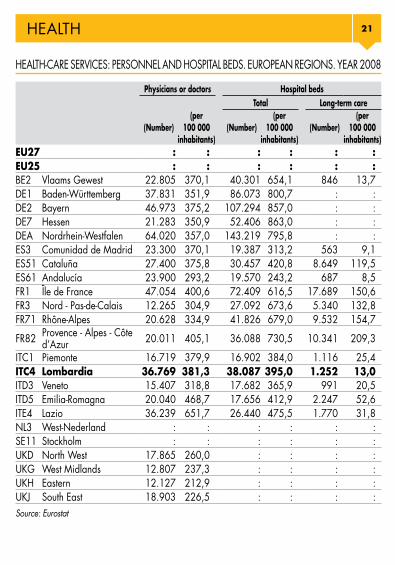
HEALTH-CARE SERVICES: PERSONNEL AND HOSPITAL BEDS. MEMBER STATES. YEAR 2008
Physicians or doctors Hospital bedsTotal Long-term care
(Number)(per
100 000 inhabitants)
(Number)(per
100 000 inhabitants)
(Number)(per
100 000 inhabitants)
AT Austria 38.313 459 64.267 772,6 2.406 28,9BE Belgium 43.212 405 70.410 660,1 1.823 17,1BG Bulgaria 27.480 361 49.507 648,0 988 12,9CY Cyprus 2.276 286 2.977 377,2 : :
CZ Czech Republic 36.921 353 74.924 715,8 6.756 64,5
DE Germany 292.129 356 674.420 820,3 : :DK Denmark : : 19.594 357,8 : :EE Estonia 4.490 335 : : : :ES Spain 159.500 348 146.934 324,5 14.635 32,3FI Finland : : : : : :FR France 213.821 332 440.656 684,8 98.000 152,3GR Greece : : 53.652 478,4 : :HU Hungary 31.024 309 70.714 703,9 11.218 111,7IE Ireland 13.763 309 : : 6.728 152,9IT Italy 246.834 414 221.418 371,4 11.006 18,5LT Lithuania 12.413 371 22.958 685,3 1.267 37,8
LU Luxembourg (Grand-Duché) : : 2.721 562,4 : :
LV Latvia 7.040 311 16.907 744,5 971 42,8MT Malta : : 3.025 731,4 1.018 246,1NL Netherlands : : : : : :PL Poland 82.397 216 252.375 662,1 14.344 37,6PT Portugal 38.932 366 35.762 336,8 : :RO Romania 47.617 222 141.327 656,5 27.078 125,8SE Sweden : : : : : :SI Slovenia 4.854 239 9.586 476,9 99 4,9SK Slovakia 18.121 335 35.452 656,4 3.933 72,8
UK United Kingdom 157.658 258 205.977 336,7 : :
Source: Eurostat
HEALTH
Death rates(per 1000 inhabitants)
: ::::::
7,08,08,0
:::
:
11,09,09,0
11,09,08,08,0
::::

20
HEALTH-CARE SERVICES: PERSONNEL AND HOSPITAL BEDS. EUROPEAN REGIONS. YEAR 2008
EU27EU25BE2 Vlaams GewestDE1 Baden-WürttembergDE2 BayernDE7 HessenDEA Nordrhein-WestfalenES3 Comunidad de MadridES51 CataluñaES61 AndalucíaFR1 Île de FranceFR3 Nord - Pas-de-CalaisFR71 Rhône-Alpes
FR82 Provence - Alpes - Côte d’Azur
ITC1 PiemonteITC4 LombardiaITD3 VenetoITD5 Emilia-RomagnaITE4 LazioNL3 West-NederlandSE11 StockholmUKD North WestUKG West MidlandsUKH EasternUKJ South EastSource: Eurostat
HEALTH
Fonte: elaborazione su dati Eurostat
Fonte: elaborazione su dati Eurostat
Sanità
0
50
100
150
200
250
300
350
400
Numero di medici ogni 100.000 abitanti. Stati europei. Anno 2008
0
100
200
300
400
500
600
Lazi
o
Emili
a-R
omag
na
Prov
enza
-Alp
i-C
osta
Azz
urra
Île d
e Fr
ance
Lom
bard
ia
Piem
onte
Cat
alog
na
Bav
iera
Fian
dre
Mad
rid
Ren
ania
Set
t. -
Vest
falia
Bad
en-
Wür
ttem
berg
Ass
ia
Rhô
ne-A
lpes
Vene
to
Nor
d - P
as-d
e-C
alai
s
And
alus
ia
Nor
th W
est
Wes
t Mid
land
s
Sout
h Ea
st
East
ern
Numero di medici ogni 100.000 abitanti. Regioni europee. Anno 2008
NUMBER OF PHYSICIANS OR DOCTORS PER 100 000 INHABITANTS IN THE EU MEMBER STATES. YEAR 2008
Source: calculation based on Eurostat data
NUMBER OF PHYSICIANS OR DOCTORS PER 100 000 INHABITANTS IN SELECTED REGIONS. YEAR 2008
Fonte: elaborazione su dati Eurostat
Fonte: elaborazione su dati Eurostat
Sanità
0
50
100
150
200
250
300
350
400
Numero di medici ogni 100.000 abitanti. Stati europei. Anno 2008
0
100
200
300
400
500
600
Lazi
o
Emili
a-R
omag
na
Prov
enza
-Alp
i-C
osta
Azz
urra
Île d
e Fr
ance
Lom
bard
ia
Piem
onte
Cat
alog
na
Bav
iera
Fian
dre
Mad
rid
Ren
ania
Set
t. -
Vest
falia
Bad
en-
Wür
ttem
berg
Ass
ia
Rhô
ne-A
lpes
Vene
to
Nor
d - P
as-d
e-C
alai
s
And
alus
ia
Nor
th W
est
Wes
t Mid
land
s
Sout
h Ea
st
East
ern
Numero di medici ogni 100.000 abitanti. Regioni europee. Anno 2008
Source: calculation based on Eurostat data
AT IT BE LT PT BG DE CZ ES EE SK FR LV HU IE CY UK SI RO PL
400
350
300
250
200
150
100
50
0
600
500
400
300
200
100
0
Lazi
o
Emili
a-Ro
mag
na
Prov
ence
- A
lpes
- Côt
e d’
Azu
r
Île d
e Fr
ance
Lom
bard
ia
Piem
onte
Cata
luña
Baye
rn
Vlaa
ms
Gew
est
Mad
rid
Nor
drhe
in-
Wes
tfale
n
Bade
n-W
ürtte
mbe
rg
Hes
sen
Rhôn
e-A
lpes
Vene
to
Nor
d - P
as-
de-C
alai
s
And
aluc
ía
Nor
th W
est
Wes
t Mid
land
s
Sout
h Ea
st
East
ern
21
HEALTH-CARE SERVICES: PERSONNEL AND HOSPITAL BEDS. EUROPEAN REGIONS. YEAR 2008
Physicians or doctors Hospital bedsTotal Long-term care
(Number)(per
100 000 inhabitants)
(Number)(per
100 000 inhabitants)
(Number)(per
100 000 inhabitants)
EU27 : : : : : :EU25 : : : : : :BE2 Vlaams Gewest 22.805 370,1 40.301 654,1 846 13,7DE1 Baden-Württemberg 37.831 351,9 86.073 800,7 : :DE2 Bayern 46.973 375,2 107.294 857,0 : :DE7 Hessen 21.283 350,9 52.406 863,0 : :DEA Nordrhein-Westfalen 64.020 357,0 143.219 795,8 : :ES3 Comunidad de Madrid 23.300 370,1 19.387 313,2 563 9,1ES51 Cataluña 27.400 375,8 30.457 420,8 8.649 119,5ES61 Andalucía 23.900 293,2 19.570 243,2 687 8,5FR1 Île de France 47.054 400,6 72.409 616,5 17.689 150,6FR3 Nord - Pas-de-Calais 12.265 304,9 27.092 673,6 5.340 132,8FR71 Rhône-Alpes 20.628 334,9 41.826 679,0 9.532 154,7
FR82 Provence - Alpes - Côte d’Azur 20.011 405,1 36.088 730,5 10.341 209,3
ITC1 Piemonte 16.719 379,9 16.902 384,0 1.116 25,4ITC4 Lombardia 36.769 381,3 38.087 395,0 1.252 13,0ITD3 Veneto 15.407 318,8 17.682 365,9 991 20,5ITD5 Emilia-Romagna 20.040 468,7 17.656 412,9 2.247 52,6ITE4 Lazio 36.239 651,7 26.440 475,5 1.770 31,8NL3 West-Nederland : : : : : :SE11 Stockholm : : : : : :UKD North West 17.865 260,0 : : : :UKG West Midlands 12.807 237,3 : : : :UKH Eastern 12.127 212,9 : : : :UKJ South East 18.903 226,5 : : : :Source: Eurostat
HEALTH
Lazi
o
Emili
a-R
omag
na
Prov
enza
-Alp
i-C
osta
Azz
urra
Île d
e Fr
ance
Lom
bard
ia
Piem
onte
Cat
alog
na
Bav
iera
Fian
dre
Mad
rid
Ren
ania
Set
t. -
Vest
falia
Bad
en-
Wür
ttem
berg
Ass
ia
Rhô
ne-A
lpes
Vene
to
Nor
d - P
as-d
e-C
alai
s
And
alus
ia
Nor
th W
est
Wes
t Mid
land
s
Sout
h Ea
st
East
ern
NUMBER OF PHYSICIANS OR DOCTORS PER 100 000 INHABITANTS
NUMBER OF PHYSICIANS OR DOCTORS PER 100 000 INHABITANTS
Lazi
o
Emili
a-R
omag
na
Prov
enza
-Alp
i-C
osta
Azz
urra
Île d
e Fr
ance
Lom
bard
ia
Piem
onte
Cat
alog
na
Bav
iera
Fian
dre
Mad
rid
Ren
ania
Set
t. -
Vest
falia
Bad
en-
Wür
ttem
berg
Ass
ia
Rhô
ne-A
lpes
Vene
to
Nor
d - P
as-d
e-C
alai
s
And
alus
ia
Nor
th W
est
Wes
t Mid
land
s
Sout
h Ea
st
East
ern
East
ern

22
PUPILS AND STUDENTS ENROLLED IN SCHOOLS AND IN UNIVERSITIES. MEMBER STATES.YEAR 2009
Total (1) Primary school Lower secondary school
AT Austria 1.702.316 331.565 372.099BE Belgium 2.860.871 731.603 333.532BG Bulgaria 1.322.952 261.007 241.014CY Cyprus : :CZ Czech Republic 2.152.977 460.486 403.662DE Germany 16.370.235 3.150.822 5.017.872DK Denmark 1.411.190 406.622 247.738EE Estonia : :ES Spain 9.442.726 2.811.257 1.962.662FI Finland 1.388.187 351.095 199.301FR France 14.805.090 4.152.622 3.233.123GR Greece : :HU Hungary 2.150.217 389.908 433.736IE Ireland 1.078.258 498.838 176.853IT Italy 11.165.203 2.855.232 1.790.125LT Lithuania : :LU Luxembourg (Grand-Duché) : :LV Latvia : :MT Malta : :NL Netherlands 3.792.370 1.290.029 761.223PL Poland 8.926.687 2.294.434 1.402.446PT Portugal 2.435.665 760.038 523.155RO Romania 4.532.082 859.169 893.166SE Sweden 2.414.577 665.570 382.322SI Slovenia 427.665 107.334 57.651SK Slovakia 1.176.803 217.805 293.519UK United Kingdom 13.411.975 4.416.474 2.458.437Source: Eurostat (1)Thetotalincludes“pre-primaryeducation”(ISCED0)
EDUCATION

23
Primary school Lower secondary school
Upper secondary school
Post-secondary education University
331.565 372.099 390.882 66.087 308.150731.603 333.532 872.679 72.985 425.219261.007 241.014 326.254 7.976 274.247
: : : : :460.486 403.662 477.158 90.925 416.847
3.150.822 5.017.872 2.745.415 554.751 2.438.600406.622 247.738 269.798 999 234.574
: : : : :2.811.257 1.962.662 1.102.355 : 1.800.834
351.095 199.301 366.112 23.504 296.6914.152.622 3.233.123 2.646.350 42.032 2.172.855
: : : : :389.908 433.736 537.142 66.075 397.679498.838 176.853 152.375 65.678 182.609
2.855.232 1.790.125 2.817.537 38.883 2.011.713: : : : :: : : : :: : : : :: : : : :
1.290.029 761.223 726.755 5.669 618.5022.294.434 1.402.446 1.837.850 322.829 2.149.998
760.038 523.155 498.327 6.515 373.002859.169 893.166 973.615 55.089 1.098.188665.570 382.322 535.173 22.543 422.580107.334 57.651 99.829 1.991 114.391217.805 293.519 284.656 3.651 234.997
4.416.474 2.458.437 3.336.211 32.904 2.046.249
24 EDUCATION
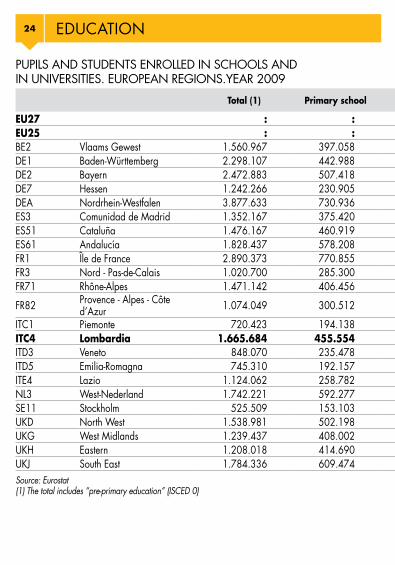
PUPILS AND STUDENTS ENROLLED IN SCHOOLS AND IN UNIVERSITIES. EUROPEAN REGIONS.YEAR 2009
Total (1) Primary school Lower secondary school
EU27 : :EU25 : :BE2 Vlaams Gewest 1.560.967 397.058 147.053DE1 Baden-Württemberg 2.298.107 442.988 757.569DE2 Bayern 2.472.883 507.418 785.314DE7 Hessen 1.242.266 230.905 375.673DEA Nordrhein-Westfalen 3.877.633 730.936 1.239.145ES3 Comunidad de Madrid 1.352.167 375.420 254.421ES51 Cataluña 1.476.167 460.919 283.892ES61 Andalucía 1.828.437 578.208 410.218FR1 Île de France 2.890.373 770.855 583.274FR3 Nord - Pas-de-Calais 1.020.700 285.300 214.941FR71 Rhône-Alpes 1.471.142 406.456 320.997
FR82 Provence - Alpes - Côte d’Azur 1.074.049 300.512 245.821
ITC1 Piemonte 720.423 194.138 120.939ITC4 Lombardia 1.665.684 455.554 270.112ITD3 Veneto 848.070 235.478 140.051ITD5 Emilia-Romagna 745.310 192.157 111.234ITE4 Lazio 1.124.062 258.782 163.169NL3 West-Nederland 1.742.221 592.277 331.604SE11 Stockholm 525.509 153.103 79.704UKD North West 1.538.981 502.198 280.718UKG West Midlands 1.239.437 408.002 232.779UKH Eastern 1.208.018 414.690 225.607UKJ South East 1.784.336 609.474 326.116Source: Eurostat (1)Thetotalincludes“pre-primaryeducation”(ISCED0)

25
Primary school Lower secondary school
Upper secondary school
Post-secondary education University
: : : : :: : : : :
397.058 147.053 528.311 44.998 208.624442.988 757.569 369.611 68.827 309.894507.418 785.314 443.506 55.969 311.450230.905 375.673 206.396 35.874 197.948730.936 1.239.145 612.411 172.460 578.482375.420 254.421 139.971 : 296.259460.919 283.892 159.274 : 250.930578.208 410.218 206.222 : 288.334770.855 583.274 473.383 8.033 568.433285.300 214.941 179.402 3.170 143.337406.456 320.997 254.522 4.627 230.099
300.512 245.821 198.019 3.368 150.597
194.138 120.939 176.917 6.508 111.344455.554 270.112 395.048 1.147 275.899235.478 140.051 211.348 11.447 112.945192.157 111.234 171.452 2.080 158.254258.782 163.169 263.328 936 288.423592.277 331.604 323.105 2.260 309.327153.103 79.704 106.810 6.716 85.760502.198 280.718 387.342 3.567 223.764408.002 232.779 306.087 3.509 172.430414.690 225.607 299.947 2.160 170.251609.474 326.116 444.956 3.363 272.939

26
ACTIVE POPULATION BY EDUCATIONAL LEVEL (% BREAKDOWN). MEMBER STATES. YEAR 2009
Primary and lower secondary
education
Upper secondary education
Tertiary education
Total Females Total Females Total FemalesAT Austria 17,5 20,3 63,6 62,2 18,9 17,5BE Belgium 21,8 18,4 40,5 38,7 37,7 42,9BG Bulgaria 15,9 14,1 58,7 53,9 25,3 31,9CY Cyprus 24,4 22,1 39,3 36,0 36,3 42,0CZ Czech Republic 6,5 8,4 77,1 75,1 16,4 16,5DE Germany 15,5 16,0 58,1 60,0 26,2 23,8DK Denmark 25,8 25,0 40,7 37,6 31,1 35,0EE Estonia 10,5 7,4 53,9 47,5 35,6 45,0ES Spain 44,2 38,5 23,7 24,9 32,1 36,5FI Finland 16,8 14,6 47,0 43,4 36,2 42,1FR France 24,8 23,8 44,1 41,7 31,0 34,4GR Greece 34,5 27,7 39,7 42,1 25,8 30,3HU Hungary 13,7 14,4 63,8 58,8 22,5 26,8IE Ireland 21,8 15,2 37,8 37,9 37,4 44,1IT Italy 37,4 29,8 45,8 48,7 16,8 21,5LT Lithuania 6,8 5,3 59,6 54,7 33,6 40,0
LU Luxembourg (Grand-Duché) 19,9 21,4 40,2 39,9 37,8 37,0
LV Latvia 12,5 8,4 60,8 57,7 26,6 34,0MT Malta 61,1 51,3 21,4 23,2 17,5 25,4NL Netherlands 25,7 24,3 41,8 43,0 31,6 31,9PL Poland 8,8 7,6 66,7 61,5 24,5 30,9PT Portugal 67,9 63,0 16,8 17,6 15,3 19,3RO Romania 25,0 27,1 59,9 55,7 15,0 17,3SE Sweden 18,5 17,8 49,3 44,5 31,4 36,9SI Slovenia 14,3 14,6 61,2 54,7 24,5 30,7SK Slovakia 5,9 6,5 77,5 74,7 16,6 18,8UK United Kingdom 20,9 21,1 44,6 42,2 33,7 35,9Source: Eurostat
EDUCATION
ACTIVE POPULATION BY EDUCATIONAL LEVEL (% BREAKDOWN). EUROPEAN REGIONS. YEAR 2009
EU27EU25BE2 Vlaams GewestDE1 Baden-WürttembergDE2 BayernDE7 HessenDEA Nordrhein-WestfalenES3 Comunidad de MadridES51 CataluñaES61 AndalucíaFR1 Île de FranceFR3 Nord - Pas-de-CalaisFR71 Rhône-Alpes
FR82 Provence - Alpes - Côte d’Azur
ITC1 PiemonteITC4 LombardiaITD3 VenetoITD5 Emilia-RomagnaITE4 LazioNL3 West-NederlandSE11 StockholmUKD North WestUKG West MidlandsUKH EasternUKJ South EastSource: Eurostat

27EDUCATION
Tertiary education
Females17,542,931,942,016,523,835,045,036,542,134,430,326,844,121,540,0
37,0
34,025,431,930,919,317,336,930,718,835,9
ACTIVE POPULATION BY EDUCATIONAL LEVEL (% BREAKDOWN). EUROPEAN REGIONS. YEAR 2009
Primary and lower secondary
education
Upper secondary education
Tertiary education
Total Females Total Females Total FemalesEU27 24,3 22,4 48,5 47,7 26,9 29,7EU25 24,4 22,3 47,9 47,3 27,4 30,2BE2 Vlaams Gewest 20,2 17,0 42,2 40,6 37,6 42,5DE1 Baden-Württemberg 17,3 19,3 54,1 57,6 28,5 23,1DE2 Bayern 15,4 17,4 57,4 60,0 26,8 22,2DE7 Hessen 15,5 16,4 57,0 60,0 27,3 23,4DEA Nordrhein-Westfalen 18,1 17,8 57,9 61,5 23,6 20,3ES3 Comunidad de Madrid 32,5 29,2 27,8 28,2 39,7 42,6ES51 Cataluña 43,5 37,6 24,1 26,3 32,4 36,0ES61 Andalucía 52,4 46,4 20,5 22,1 27,1 31,6FR1 Île de France 23,3 21,5 34,7 33,4 42,0 45,1FR3 Nord - Pas-de-Calais 25,9 24,0 44,8 43,9 29,4 32,1FR71 Rhône-Alpes 23,8 22,6 45,4 43,3 30,7 34,1
FR82 Provence - Alpes - Côte d’Azur 28,1 26,6 42,8 40,6 29,1 32,8
ITC1 Piemonte 38,6 32,6 46,4 50,0 15,1 17,4ITC4 Lombardia 36,4 30,0 46,3 49,4 17,3 20,6ITD3 Veneto 36,1 31,1 49,6 51,2 14,3 17,6ITD5 Emilia-Romagna 35,4 29,8 47,0 49,0 17,6 21,2ITE4 Lazio 27,6 21,0 50,9 52,4 21,6 26,7NL3 West-Nederland 24,2 22,7 39,8 40,6 35,2 35,9SE11 Stockholm 15,0 14,9 44,4 40,2 39,6 44,2UKD North West 21,9 22,3 45,7 43,4 31,5 33,6UKG West Midlands 24,6 24,3 45,5 44,0 29,0 30,9UKH Eastern 23,0 23,7 46,8 43,6 29,5 32,1UKJ South East 19,3 20,4 44,7 42,6 35,1 36,4Source: Eurostat

28 EDUCATION
ACTIVE POPULATION (AGED 15 YEARS AND OVER) AND EMPLOYMENT (1000 UNITS). MEMBER STATES. YEAR 2009
AT AustriaBE BelgiumBG BulgariaCY CyprusCZ Czech RepublicDE GermanyDK DenmarkEE EstoniaES SpainFI FinlandFR FranceGR GreeceHU HungaryIE IrelandIT ItalyLT Lithuania
LU Luxembourg (Grand-Duché)
LV LatviaMT MaltaNL NetherlandsPL PolandPT PortugalRO RomaniaSE SwedenSI SloveniaSK SlovakiaUK United KingdomSource: Eurostat
Fonte: elaborazione su dati Eurostat
Fonte: elaborazione su dati Eurostat
Istruzione
0
5
10
15
20
25
30
35
40
% popolazione attiva con istruzione universitaria. Stati europei. Anno 2009
0 5
10 15 20 25 30 35 40 45
Île d
e Fr
ance
Mad
rid
Stoc
colm
a
Fian
dre
Paes
i Bas
si
Occ
iden
tali
Sout
h Ea
st
Cat
alog
na
Nor
th W
est
Rhô
ne-A
lpes
East
ern
Nor
d - P
as-d
e-C
alai
s Pr
oven
za-A
lpi-
Cos
ta A
zzur
ra
Wes
t Mid
land
s
Bad
en-
Wür
ttem
berg
Ass
ia
And
alus
ia
Bav
iera
Ren
ania
Set
t. -
Vest
falia
Lazi
o
Emili
a-R
omag
na
Lom
bard
ia
Piem
onte
Vene
to
% popolazione attiva con istruzione universitaria. Regioni europee. Anno 2009
ACTIVE POPULATION HOLDING A UNIVERSITY DEGREE (AS % OF TOTAL ACTIVE POPULATION). EU MEMBER STATES. YEAR 2009
Source: calculation based on Eurostat data
Fonte: elaborazione su dati Eurostat
Fonte: elaborazione su dati Eurostat
Istruzione
0
5
10
15
20
25
30
35
40
% popolazione attiva con istruzione universitaria. Stati europei. Anno 2009
0 5
10 15 20 25 30 35 40 45
Île d
e Fr
ance
Mad
rid
Stoc
colm
a
Fian
dre
Paes
i Bas
si
Occ
iden
tali
Sout
h Ea
st
Cat
alog
na
Nor
th W
est
Rhô
ne-A
lpes
East
ern
Nor
d - P
as-d
e-C
alai
s Pr
oven
za-A
lpi-
Cos
ta A
zzur
ra
Wes
t Mid
land
s
Bad
en-
Wür
ttem
berg
Ass
ia
And
alus
ia
Bav
iera
Ren
ania
Set
t. -
Vest
falia
Lazi
o
Emili
a-R
omag
na
Lom
bard
ia
Piem
onte
Vene
to
% popolazione attiva con istruzione universitaria. Regioni europee. Anno 2009
ACTIVE POPULATION HOLDING A UNIVERSITY DEGREE (AS % OF TOTAL ACTIVE POPULATION). SELECTED EUROPEAN REGIONS. YEAR 2009
Source: calculation based on Eurostat data
40
35
30
25
20
15
10
5
0
LU BE IE CY FI EE UK LT ES NL SE DK FR LV DE GR BG PL SI HU AT MT IT SK CZ PT RO
4540353025201510
50
Île d
e Fr
ance
Mad
rid
Stoc
khol
m
Vlaa
ms
Gew
est
Wes
t-Ned
erla
nd
Sout
h Ea
st
Cata
luña
Nor
th W
est
Rhôn
e-A
lpes
East
ern
Nor
d - P
as-d
e-Ca
lais
Prov
ence
- A
lpes
- Côt
e d’
Azu
r
Wes
t Mid
land
s
Bade
n-W
ürtte
mbe
rg
Hes
sen
And
aluc
ía
Baye
rn
Nor
drhe
in-
Wes
tfale
n
Lazi
o
Emili
a-Ro
mag
na
Vene
to
Piem
onte
Lom
bard
ia
29LABOUR MARKET
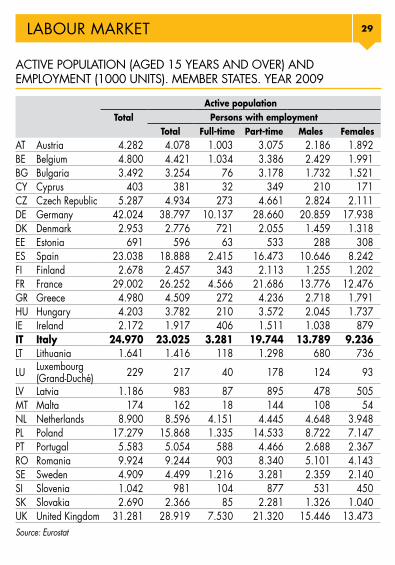
ACTIVE POPULATION (AGED 15 YEARS AND OVER) AND EMPLOYMENT (1000 UNITS). MEMBER STATES. YEAR 2009
Active populationTotal Persons with employment
Total Full-time Part-time Males FemalesAT Austria 4.282 4.078 1.003 3.075 2.186 1.892BE Belgium 4.800 4.421 1.034 3.386 2.429 1.991BG Bulgaria 3.492 3.254 76 3.178 1.732 1.521CY Cyprus 403 381 32 349 210 171CZ Czech Republic 5.287 4.934 273 4.661 2.824 2.111DE Germany 42.024 38.797 10.137 28.660 20.859 17.938DK Denmark 2.953 2.776 721 2.055 1.459 1.318EE Estonia 691 596 63 533 288 308ES Spain 23.038 18.888 2.415 16.473 10.646 8.242FI Finland 2.678 2.457 343 2.113 1.255 1.202FR France 29.002 26.252 4.566 21.686 13.776 12.476GR Greece 4.980 4.509 272 4.236 2.718 1.791HU Hungary 4.203 3.782 210 3.572 2.045 1.737IE Ireland 2.172 1.917 406 1.511 1.038 879IT Italy 24.970 23.025 3.281 19.744 13.789 9.236LT Lithuania 1.641 1.416 118 1.298 680 736
LU Luxembourg (Grand-Duché) 229 217 40 178 124 93
LV Latvia 1.186 983 87 895 478 505MT Malta 174 162 18 144 108 54NL Netherlands 8.900 8.596 4.151 4.445 4.648 3.948PL Poland 17.279 15.868 1.335 14.533 8.722 7.147PT Portugal 5.583 5.054 588 4.466 2.688 2.367RO Romania 9.924 9.244 903 8.340 5.101 4.143SE Sweden 4.909 4.499 1.216 3.281 2.359 2.140SI Slovenia 1.042 981 104 877 531 450SK Slovakia 2.690 2.366 85 2.281 1.326 1.040UK United Kingdom 31.281 28.919 7.530 21.320 15.446 13.473Source: Eurostat
Île d
e Fr
ance
Mad
rid
Stoc
colm
a
Fian
dre
Paes
i Bas
si
Occ
iden
tali
Sout
h Ea
st
Cat
alog
na
Nor
th W
est
Rhô
ne-A
lpes
East
ern
Nor
d - P
as-d
e-C
alai
s Pr
oven
za-A
lpi-
Cos
ta A
zzur
ra
Wes
t Mid
land
s
Bad
en-
Wür
ttem
berg
Ass
ia
And
alus
ia
Bav
iera
Ren
ania
Set
t. -
Vest
falia
Lazi
o
Emili
a-R
omag
na
Lom
bard
ia
Piem
onte
Vene
to
ACTIVE POPULATION HOLDING A UNIVERSITY DEGREE (AS % OF TOTAL
Île d
e Fr
ance
Mad
rid
Stoc
colm
a
Fian
dre
Paes
i Bas
si
Occ
iden
tali
Sout
h Ea
st
Cat
alog
na
Nor
th W
est
Rhô
ne-A
lpes
East
ern
Nor
d - P
as-d
e-C
alai
s Pr
oven
za-A
lpi-
Cos
ta A
zzur
ra
Wes
t Mid
land
s
Bad
en-
Wür
ttem
berg
Ass
ia
And
alus
ia
Bav
iera
Ren
ania
Set
t. -
Vest
falia
Lazi
o
Emili
a-R
omag
na
Lom
bard
ia
Piem
onte
Vene
to
ACTIVE POPULATION HOLDING A UNIVERSITY DEGREE (AS % OF TOTAL ACTIVE POPULATION). SELECTED EUROPEAN REGIONS. YEAR 2009
Vene
to

30
ACTIVE POPULATION (AGED 15 YEARS AND OVER) AND EMPLOYMENT (1000 UNITS). EUROPEAN REGIONS. YEAR 2009
Active populationTotal Persons with employment
Total Full-time Part-time Males FemalesEU27 239.810 218.371 41.007 177.291 119.463 98.908EU25 226.394 205.874 40.028 165.773 112.630 93.244BE2 Vlaams Gewest 2.856 2.715 656 2.059 1.485 1.230DE1 Baden-Württemberg 5.661 5.375 1.450 3.924 2.873 2.502DE2 Bayern 6.643 6.309 1.633 4.676 3.407 2.902DE7 Hessen 3.099 2.902 814 2.089 1.559 1.343DEA Nordrhein-Westfalen 8.741 8.059 2.189 5.870 4.388 3.671ES3 Comunidad de Madrid 3.394 2.918 366 2.552 1.576 1.342ES51 Cataluña 3.808 3.189 378 2.811 1.746 1.443ES61 Andalucía 3.916 2.923 408 2.516 1.711 1.213FR1 Île de France 5.750 5.267 695 4.572 2.704 2.563FR3 Nord - Pas-de-Calais 1.699 1.471 284 1.186 791 680FR71 Rhône-Alpes 2.812 2.569 530 2.039 1.350 1.219
FR82 Provence - Alpes - Côte d’Azur 2.127 1.926 364 1.562 1.010 916
ITC1 Piemonte 1.997 1.860 245 1.616 1.061 800ITC4 Lombardia 4.543 4.300 656 3.644 2.504 1.796ITD3 Veneto 2.217 2.112 314 1.798 1.250 862ITD5 Emilia-Romagna 2.054 1.956 261 1.695 1.092 864ITE4 Lazio 2.449 2.241 338 1.903 1.316 925NL3 West-Nederland 4.222 4.082 1.939 2.144 2.195 1.888SE11 Stockholm 1.129 1.052 248 803 543 509UKD North West 3.419 3.133 810 2.315 1.656 1.477UKG West Midlands 2.697 2.437 625 1.805 1.302 1.135UKH Eastern 2.973 2.790 737 2.048 1.511 1.278UKJ South East 4.401 4.145 1.137 3.001 2.218 1.927Source: Eurostat
LABOUR MARKET
UNEMPLOYMENT AND UNEMPLOYMENT RATES. MEMBER STATES. YEAR 2008
AT AustriaBE BelgiumBG BulgariaCY CyprusCZ Czech
RepublicDE GermanyDK DenmarkEE EstoniaES SpainFI FinlandFR FranceGR GreeceHU HungaryIE IrelandIT ItalyLT Lithuania
LULuxembourg (Grand-Duché)
LV LatviaMT MaltaNL NetherlandsPL PolandPT PortugalRO RomaniaSE SwedenSI SloveniaSK Slovakia
UK United Kingdom
Source: Eurostat
31
EMPLOYMENT (1000 UNITS). EUROPEAN REGIONS. YEAR 2009
Females98.90893.244
1.2302.5022.9021.3433.6711.3421.4431.2132.563
6801.219
916
8001.796
862864925
1.888509
1.4771.1351.2781.927
LABOUR MARKET
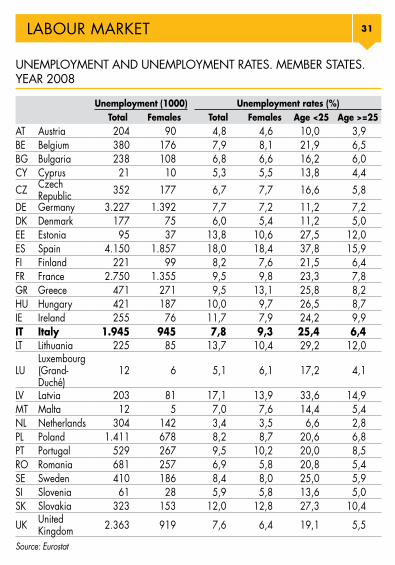
UNEMPLOYMENT AND UNEMPLOYMENT RATES. MEMBER STATES. YEAR 2008
Unemployment (1000) Unemployment rates (%)Total Females Total Females Age <25 Age >=25
AT Austria 204 90 4,8 4,6 10,0 3,9BE Belgium 380 176 7,9 8,1 21,9 6,5BG Bulgaria 238 108 6,8 6,6 16,2 6,0CY Cyprus 21 10 5,3 5,5 13,8 4,4CZ Czech
Republic 352 177 6,7 7,7 16,6 5,8DE Germany 3.227 1.392 7,7 7,2 11,2 7,2DK Denmark 177 75 6,0 5,4 11,2 5,0EE Estonia 95 37 13,8 10,6 27,5 12,0ES Spain 4.150 1.857 18,0 18,4 37,8 15,9FI Finland 221 99 8,2 7,6 21,5 6,4FR France 2.750 1.355 9,5 9,8 23,3 7,8GR Greece 471 271 9,5 13,1 25,8 8,2HU Hungary 421 187 10,0 9,7 26,5 8,7IE Ireland 255 76 11,7 7,9 24,2 9,9IT Italy 1.945 945 7,8 9,3 25,4 6,4LT Lithuania 225 85 13,7 10,4 29,2 12,0
LULuxembourg (Grand-Duché)
12 6 5,1 6,1 17,2 4,1
LV Latvia 203 81 17,1 13,9 33,6 14,9MT Malta 12 5 7,0 7,6 14,4 5,4NL Netherlands 304 142 3,4 3,5 6,6 2,8PL Poland 1.411 678 8,2 8,7 20,6 6,8PT Portugal 529 267 9,5 10,2 20,0 8,5RO Romania 681 257 6,9 5,8 20,8 5,4SE Sweden 410 186 8,4 8,0 25,0 5,9SI Slovenia 61 28 5,9 5,8 13,6 5,0SK Slovakia 323 153 12,0 12,8 27,3 10,4
UK United Kingdom 2.363 919 7,6 6,4 19,1 5,5
Source: Eurostat

32 LABOUR MARKET
UNEMPLOYMENT AND UNEMPLOYMENT RATES. EUROPEAN REGIONS. YEAR 2008
Unemployment (1000) Unemployment rates (%)
Total Females Total Females Age <25 Age >=25EU27 21.439 9.660 8,9 8,9 19,9 7,6EU25 20.521 9.295 9,1 9,1 19,9 7,7BE2 Vlaams Gewest 141 64 4,9 4,9 15,7 3,9DE1 Baden-Württemberg 286 131 5,1 5,0 8,3 4,6DE2 Bayern 334 152 5,0 5,0 8,0 4,6DE7 Hessen 197 88 6,3 6,1 11,2 5,8DEA Nordrhein-Westfalen 682 275 7,8 7,0 12,3 7,3ES3 Comunidad de Madrid 476 218 14,0 13,9 34,4 12,1ES51 Cataluña 619 259 16,2 15,2 37,1 14,1ES61 Andalucía 993 451 25,4 27,1 45,0 22,8FR1 Île de France 483 217 8,4 7,8 19,5 7,2FR3 Nord - Pas-de-Calais 229 106 13,5 13,4 35,9 10,3FR71 Rhône-Alpes 243 120 8,7 8,9 21,6 6,9
FR82 Provence - Alpes - Côte d’Azur 202 98 9,5 9,6 24,8 7,8
ITC1 Piemonte 137 68 6,8 7,8 24,1 5,6ITC4 Lombardia 244 123 5,4 6,4 18,5 4,4ITD3 Veneto 106 59 4,8 6,4 14,4 4,0ITD5 Emilia-Romagna 98 50 4,8 5,5 18,3 3,9ITE4 Lazio 208 112 8,5 10,8 30,6 6,9NL3 West-Nederland 139 65 3,3 3,3 6,6 2,7SE11 Stockholm 76 36 6,8 6,5 22,1 4,9UKD North West 285 106 8,3 6,7 20,8 6,0UKG West Midlands 261 92 9,7 7,5 24,0 7,1UKH Eastern 184 77 6,2 5,7 16,5 4,4UKJ South East 255 101 5,8 5,0 16,2 4,1Source: Eurostat
Source: calculation based on Eurostat data
Also in 2009 the region with the lowest female unemployment rate was the West Nederland, at 3.3% (compared to 2.8% in 2008). Vlaams Gewest, the English South East and two German regions(Baden-Württemberg
Lombardia,position amongst the regions observed.
FEMALE UNEMPLOYMENT. YEAR 2009
Female unemployment rates (%)

33LABOUR MARKET
Unemployment rates (%)
Age <25 Age >=257,67,73,94,64,65,87,3
12,114,122,87,2
10,36,9
7,8
5,64,44,03,96,92,74,96,07,14,44,1
Source: calculation based on Eurostat data
Also in 2009 the region with the lowest female unemployment rate was the West Nederland, at 3.3% (compared to 2.8% in 2008). Vlaams Gewest, the English South East and two German regions(Baden-WürttembergandBayern)followedatacertaindistance,allataround5.0%.
Lombardia,withafemaleunemploymentrateequalto6.4%(4.8%in2008),rankedinthe9thposition amongst the regions observed.
FEMALE UNEMPLOYMENT. YEAR 2009
Female unemployment rates (%)

34 LABOUR MARKET
Fonte: elaborazione su dati Eurostat
Fonte: elaborazione su dati Eurostat
Lavoro
0%
20%
40%
60%
80%
100%
Distribuzione dell'occupazione secondo il genere. Stati europei. Anno 2009
Femmine Maschi
0%
20%
40%
60%
80%
100%
Distribuzione dell'occupazione secondo il genere. Regioni europee. Anno 2009
Femmine Maschi
Fonte: elaborazione su dati Eurostat
Fonte: elaborazione su dati Eurostat
Lavoro
0%
20%
40%
60%
80%
100%
Distribuzione dell'occupazione secondo il genere. Stati europei. Anno 2009
Femmine Maschi
0%
20%
40%
60%
80%
100%
Distribuzione dell'occupazione secondo il genere. Regioni europee. Anno 2009
Femmine Maschi
EMPLOYMENT BY GENDER. MEMBER STATES. YEAR 2009
Fonte: elaborazione su dati Eurostat
Fonte: elaborazione su dati Eurostat
Lavoro
0%
20%
40%
60%
80%
100%
Distribuzione dell'occupazione secondo il genere. Stati europei. Anno 2009
Femmine Maschi
0%
20%
40%
60%
80%
100%
Distribuzione dell'occupazione secondo il genere. Regioni europee. Anno 2009
Femmine Maschi
Source: calculation based on Eurostat data
EMPLOYMENT BY GENDER. SELECTED EUROPEAN REGIONS. YEAR 2009
Source: calculation based on Eurostat data
GROSS DOMESTIC PRODUCT. MEMBER STATES. YEAR 2008
AT AustriaBE BelgiumBG BulgariaCY Cyprus
CZ Czech Republic
DE GermanyDK DenmarkEE EstoniaES SpainFI FinlandFR FranceGR GreeceHU HungaryIE IrelandIT ItalyLT Lithuania
LU Luxembourg (Grand-Duché)
LV LatviaMT MaltaNL NetherlandsPL PolandPT PortugalRO RomaniaSE SwedenSI SloveniaSK SlovakiaUK United
KingdomSource: Eurostat
100%
80%
60%
40%
20%
0%LT EE LV FI SE FR DK PT BG UK AT DE HU NL SI IE BE PL CY RO SK ES LU CZ IT GR MT
Île de
Fran
ce
Stock
holm
Prove
nce -
Alpe
s - Cô
te d’A
zur
Rhôn
e-Alpe
s
North
West
West M
idlan
ds
Bade
n-Wür
ttembe
rg
South
East
Hessen
Nord - P
as-de
-Cala
is
West-N
ederl
and
Madrid
Baye
rn
Easte
rn
Nordrhe
in-West
falen
Vlaams G
ewest
Catal
uña
Emilia
-Romag
na
Piemon
te
Lomba
rdia
Vene
toLa
zio
Andalu
cía
Distribuzione dell'occupazione secondo il genere. Regioni europee. Anno 2009
Femmine Maschi Females
Distribuzione dell'occupazione secondo il genere. Regioni europee. Anno 2009
Femmine Maschi Males
Lavoro
Distribuzione dell'occupazione secondo il genere. Stati europei. Anno 2009
Distribuzione dell'occupazione secondo il genere. Regioni europee. Anno 2009
Femmine Maschi Females
Lavoro
Distribuzione dell'occupazione secondo il genere. Stati europei. Anno 2009
Distribuzione dell'occupazione secondo il genere. Regioni europee. Anno 2009
Femmine Maschi Males
100%
80%
60%
40%
20%
0%

35ECONOMIC ACCOUNTS
Femmine Maschi
Femmine Maschi
EMPLOYMENT BY GENDER. SELECTED EUROPEAN REGIONS.
GROSS DOMESTIC PRODUCT. MEMBER STATES. YEAR 2008
Total Per capita as % of total EU27Million euro Million PPS Euro (EU27 = 100)
AT Austria 283.085 259.221 34.000 136,0 2,3BE Belgium 345.006 308.142 32.200 129,0 2,8BG Bulgaria 35.431 82.922 4.700 19,0 0,3CY Cyprus 17.287 19.316 21.800 87,0 0,1
CZ Czech Republic 147.879 210.336 14.200 57,0 1,2
DE Germany 2.481.200 2.381.851 30.200 121,0 19,9DK Denmark 233.482 169.250 42.500 170,0 1,9EE Estonia 16.107 22.812 12.000 48,0 0,1ES Spain 1.088.124 1.180.204 23.900 95,0 8,7FI Finland 184.649 156.702 34.800 139,0 1,5FR France 1.948.511 1.713.350 30.400 121,0 15,6GR Greece 236.917 263.725 21.100 84,0 1,9HU Hungary 106.373 162.140 10.600 42,0 0,9IE Ireland 179.989 147.840 40.500 162,0 1,4IT Italy 1.567.851 1.553.327 26.200 105,0 12,5LT Lithuania 32.288 51.348 9.600 38,0 0,3
LU Luxembourg (Grand-Duché) 39.640 34.176 81.200 324,0 0,3
LV Latvia 23.037 32.013 10.200 41,0 0,2MT Malta 5.797 8.026 14.100 56,0 0,0NL Netherlands 596.226 550.170 36.300 145,0 4,8PL Poland 363.154 537.211 9.500 38,0 2,9PT Portugal 172.022 206.906 16.200 65,0 1,4RO Romania 139.765 251.305 6.500 26,0 1,1SE Sweden 333.256 284.000 36.000 144,0 2,7SI Slovenia 37.305 46.135 18.400 74,0 0,3SK Slovakia 64.572 98.037 11.900 48,0 0,5UK United
Kingdom 1.815.417 1.763.903 29.600 118,0 14,5
Source: Eurostat
Vene
to
Femmine Maschi Femmine Maschi Males
Femmine Maschi Femmine Maschi Males

36
GROSS DOMESTIC PRODUCT. EUROPEAN REGIONS. YEAR 2008
Total Per capita as % of total EU27Million euro Million PPS Euro (EU27
= 100)EU27 12.494.369 12.494.369 25.100 100,0 :EU25 12.319.173 12.160.142 : : :BE2 Vlaams Gewest 199.292 177.998 32.200 129,0 57,8DE1 Baden-Württemberg 362.920 348.389 33.800 135,0 14,6DE2 Bayern 442.210 424.504 35.300 141,0 17,8DE7 Hessen 220.055 211.244 36.300 145,0 8,9DEA Nordrhein-Westfalen 544.334 522.538 30.300 121,0 21,9ES3 Comunidad de Madrid 193.172 209.518 30.900 123,0 17,8ES51 Cataluña 202.823 219.987 27.900 111,0 18,6ES61 Andalucía 149.010 161.619 18.400 73,0 13,7FR1 Île de France 558.330 490.946 47.800 191,0 28,7FR3 Nord - Pas-de-Calais 99.411 87.414 24.700 99,0 5,1FR71 Rhône-Alpes 187.324 164.717 30.500 122,0 9,6
FR82 Provence - Alpes - Côte d’Azur 140.264 123.336 28.600 114,0 7,2
ITC1 Piemonte 127.014 125.837 28.800 115,0 8,1ITC4 Lombardia 328.222 325.181 33.900 135,0 20,9ITD3 Veneto 149.385 148.001 30.700 123,0 9,5ITD5 Emilia-Romagna 138.675 137.391 32.200 129,0 8,8ITE4 Lazio 174.116 172.503 31.100 124,0 11,1NL3 West-Nederland 302.475 279.111 39.300 157,0 50,7SE11 Stockholm 97.005 82.668 49.200 196,0 29,1UKD North West 174.198 169.255 25.200 101,0 9,6UKG West Midlands 134.959 131.130 24.900 99,0 7,4UKH Eastern 159.457 154.932 28.000 112,0 8,8UKJ South East 261.173 253.762 31.300 125,0 14,4Source: Eurostat
ECONOMIC ACCOUNTS
Source: calculation based on Eurostat data
In2008,acrossAndalusia(27%doubles the EU average).
InLombardia,the one of some European regions, was the highest in Italy.
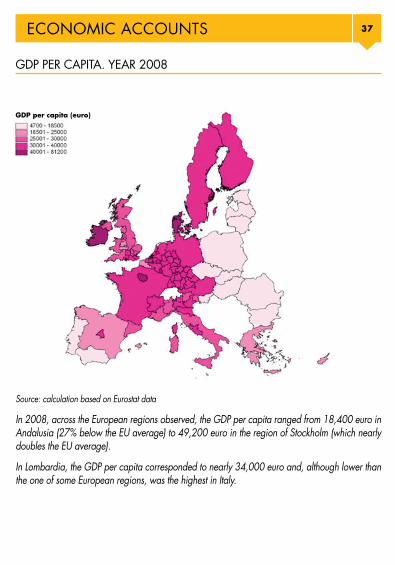
GDP PER CAPITA. YEAR 2008
GDP per capita (euro)
37
GROSS DOMESTIC PRODUCT. EUROPEAN REGIONS. YEAR 2008
as % of total EU27
(EU27
100,0 :: :
129,0 57,8135,0 14,6141,0 17,8145,0 8,9121,0 21,9123,0 17,8111,0 18,673,0 13,7
191,0 28,799,0 5,1
122,0 9,6
114,0 7,2
115,0 8,1135,0 20,9123,0 9,5129,0 8,8124,0 11,1157,0 50,7196,0 29,1101,0 9,699,0 7,4
112,0 8,8125,0 14,4
ECONOMIC ACCOUNTS
Source: calculation based on Eurostat data
In2008,acrosstheEuropeanregionsobserved,theGDPpercapitarangedfrom18,400euroinAndalusia(27%belowtheEUaverage)to49,200eurointheregionofStockholm(whichnearlydoubles the EU average).
InLombardia,theGDPpercapitacorrespondedtonearly34,000euroand,althoughlowerthanthe one of some European regions, was the highest in Italy.
GDP PER CAPITA. YEAR 2008
GDP per capita (euro)

38
ALLOCATION OF PRIMARY INCOME ACCOUNT (HOUSEHOLD SECTOR, MILLION EURO). MEMBER STATES. YEAR 2008
Resources Uses Net balance
Wages and
salaries
Property income received
Net surplus and net mixed income
Property income paid
of primaryincomes
AT Austria 138.813 28.004 33.416 5.387 194.846BE Belgium 181.823 38.929 33.448 6.787 247.413BG Bulgaria : : : : :CY Cyprus : : : : :CZ Czech Republic 64.711 6.068 18.110 1.327 87.561DE Germany 1.225.060 443.710 229.570 67.790 1.830.550DK Denmark 129.626 18.056 8.957 16.371 141.157EE Estonia 8.407 1.004 934 838 9.506ES Spain 531.239 70.904 181.438 35.672 747.909FI Finland 91.451 11.771 13.507 4.996 111.733FR France 1.013.347 178.383 243.698 47.090 1.388.338GR Greece 8.595 2.284 5.371 443 1.581HU Hungary 50.050 5.263 11.884 2.164 65.034IE Ireland : 7.787 19.522 8.276 :IT Italy 655.899 438.148 268.931 216.914 1.146.064LT Lithuania 14.456 4.137 2.190 511 20.272
LU Luxembourg (Grand-Duché) : : : : :
LV Latvia 11.997 1.718 1.630 456 14.889MT Malta 2.569 : 1.707 : :NL Netherlands 289.663 61.868 46.965 33.680 364.816PL Poland 138.270 15.254 83.149 5.368 231.306PT Portugal 85.955 21.202 14.631 8.542 113.245RO Romania 59.736 2.754 25.072 1.054 86.507SE Sweden 179.137 20.796 19.943 10.688 209.188SI Slovenia 18.960 1.139 4.313 518 23.894SK Slovakia 25.100 1.818 14.020 821 40.117UK United Kingdom 965.685 217.180 129.678 77.018 1.235.525Source: Eurostat
HOUSEHOLD INCOME
ALLOCATION OF PRIMARY INCOME ACCOUNT (HOUSEHOLD SECTOR, MILLION EURO). EUROPEAN REGIONS. YEAR 2008
EU27EU25BE2 Vlaams GewestDE1 Baden-WürttembergDE2 BayernDE7 HessenDEA Nordrhein-WestfalenES3 Comunidad de MadridES51 CataluñaES61 AndalucíaFR1 Île de FranceFR3 Nord - Pas-de-CalaisFR71 Rhône-Alpes
FR82 Provence - Alpes - Côte d’Azur
ITC1 PiemonteITC4 LombardiaITD3 VenetoITD5 Emilia-RomagnaITE4 LazioNL3 West-NederlandSE11 StockholmUKD North WestUKG West MidlandsUKH EasternUKJ South EastSource: Eurostat

39HOUSEHOLD INCOME
ALLOCATION OF PRIMARY INCOME ACCOUNT (HOUSEHOLD
Net balanceof primary
incomes
194.846247.413
::
87.5611.830.550
141.1579.506
747.909111.733
1.388.3381.581
65.034:
1.146.06420.272
:
14.889:
364.816231.306113.24586.507
209.18823.89440.117
1.235.525
ALLOCATION OF PRIMARY INCOME ACCOUNT (HOUSEHOLD SECTOR, MILLION EURO). EUROPEAN REGIONS. YEAR 2008
Resources UsesNet
balance of primary
incomes
Wages and salaries
Property income received
Net surplus and net mixed income
Property income paid
EU27 : : : : :EU25 : : : : :BE2 Vlaams Gewest 112.552 24.991 21.206 3.980 154.769DE1 Baden-Württemberg 178.981 73.730 32.690 10.571 274.830DE2 Bayern 207.619 78.815 42.210 12.359 316.286DE7 Hessen 99.586 37.195 18.169 6.122 148.828DEA Nordrhein-Westfalen 269.144 113.044 50.784 15.296 417.677ES3 Comunidad de Madrid 97.843 13.172 28.683 6.317 133.382ES51 Cataluña 99.485 14.266 31.785 7.347 138.188ES61 Andalucía 71.047 7.512 28.415 5.847 101.127FR1 Île de France 265.234 41.444 52.934 8.067 351.544FR3 Nord - Pas-de-Calais 55.321 9.161 10.275 2.707 72.049FR71 Rhône-Alpes 100.383 17.468 23.831 4.354 137.328
FR82 Provence - Alpes - Côte d’Azur 70.283 13.979 19.503 3.508 100.258
ITC1 Piemonte 52.382 41.550 23.690 19.435 98.186ITC4 Lombardia 131.375 91.824 52.978 41.860 234.318ITD3 Veneto 61.193 42.786 24.659 20.133 108.505ITD5 Emilia-Romagna 56.566 42.773 24.943 20.113 104.169ITE4 Lazio 72.989 39.847 26.369 20.342 118.864NL3 West-Nederland 146.986 30.588 22.494 16.322 183.663SE11 Stockholm 46.558 6.962 5.397 3.193 55.724UKD North West 93.841 19.243 9.932 6.659 116.360UKG West Midlands 74.442 15.736 8.670 5.910 92.940UKH Eastern 93.872 22.405 14.569 7.779 123.067UKJ South East 152.028 37.877 24.088 14.975 199.020Source: Eurostat

40 TOURISM
NUMBER OF ACCOMMODATION ESTABLISHMENTS, ROOMS, BED-PLACES. MEMBER STATES. YEAR 2009
Hotels and similar establishments
Number of establishments Rooms Bed-places Number of
establishments
AT Austria 13.645 288.934 587.899 6.741BE Belgium 2.036 57.967 126.134 1.492BG Bulgaria 1.784 112.014 249.193CY Cyprus 699 41.965 84.327CZ Czech Republic 4.469 114.452 260.736 3.088DE Germany 35.814 926.612 1.693.973 17.365DK Denmark 471 39.109 77.448EE Estonia 387 14.923 30.826ES Spain 18.387 864.933 1.736.937 22.367FI Finland 867 55.146 120.175FR France 17.723 624.224 1.248.448 11.128GR Greece 9.559 383.008 732.279HU Hungary 2.042 : 157.464IE Ireland 3.624 74.136 162.713 4.850IT Italy 33.967 1.088.088 2.227.832 111.391LT Lithuania 380 11.962 23.839
LU Luxembourg (Grand-Duché) 261 7.751 14.709
LV Latvia 451 12.421 25.392MT Malta 158 18.243 39.062NL Netherlands 3.151 100.493 203.852 3.900PL Poland 2.836 109.534 221.633 4.156PT Portugal 1.988 120.737 273.804RO Romania 4.566 121.167 247.426SE Sweden 1.982 108.168 221.767 2.115SI Slovenia 667 22.004 44.185SK Slovakia 1.324 35.878 74.066 1.359UK United Kingdom 38.306 613.389 1.243.233 45.090Source: Eurostat

41
NUMBER OF ACCOMMODATION ESTABLISHMENTS, ROOMS,
Other accommodation etablishments
Bed-places Number of establishments Bed-places
of which in tourist campsitesNumber of
establishments Bed-places
587.899 6.741 376.668 553 198.407126.134 1.492 242.534 506 102.740249.193 466 32.160 12 1.38584.327 156 4.476 4 2.808
260.736 3.088 202.351 485 28.2821.693.973 17.365 1.537.046 2.806 854.568
77.448 585 313.589 411 272.75430.826 704 18.645 127 6.252
1.736.937 22.367 1.500.873 1.233 770.367120.175 454 98.603 253 81.087
1.248.448 11.128 4.616.790 7.923 3.674.848732.279 319 87.892 319 87.892157.464 951 144.409 249 81.902162.713 4.850 56.912 100 23.340
2.227.832 111.391 2.370.850 2.573 1.324.38323.839 176 12.005 16 2.184
14.709 224 51.329 97 47.517
25.392 108 7.104 32 2.28139.062 7 1.048 : :
203.852 3.900 1.000.556 2.324 722.706221.633 4.156 384.868 125 19.692273.804 311 191.383 225 180.584247.426 513 55.329 55 25.475221.767 2.115 562.175 1.060 478.36044.185 333 41.362 63 18.51074.066 1.359 55.474 71 3.391
1.243.233 45.090 1.748.040 4.577 1.235.376

42 TOURISM
NUMBER OF ACCOMMODATION ESTABLISHMENTS, ROOMS, BED-PLACES. EUROPEAN REGIONS. YEAR 2009
Hotels and similar establishments
Number of establishments Rooms Bed-places Number of
establishments
EU27 201.544 : 12.129.352 240.349EU25 195.194 : 11.632.733 239.370BE2 Vlaams Gewest 1.266 30.409 68.512DE1 Baden-Württemberg 5.140 119.945 213.656 1.622DE2 Bayern 9.347 215.273 396.888 3.934DE7 Hessen 2.602 81.738 139.261DEA Nordrhein-Westfalen 4.113 116.130 203.041ES3 Comunidad de Madrid 1.311 54.850 102.750ES51 Cataluña 2.754 147.927 300.826 2.837ES61 Andalucía 2.894 137.980 295.008 2.324FR1 Île de France 2.360 150.274 300.548FR3 Nord - Pas-de-Calais 408 17.841 35.682FR71 Rhône-Alpes 2.151 67.142 134.284 1.521
FR82 Provence - Alpes - Côte d’Azur 2.037 68.209 136.418 1.272
ITC1 Piemonte 1.562 42.767 84.855 3.398ITC4 Lombardia 3.001 101.569 198.582 3.064ITD3 Veneto 3.050 111.310 212.539 47.413ITD5 Emilia-Romagna 4.503 153.431 296.292 4.076ITE4 Lazio 1.992 80.190 161.839 5.964NL3 West-Nederland 1.410 57.977 117.209 1.003SE11 Stockholm 274 26.238 51.585UKD North West 5.090 88.241 185.270 4.716UKG West Midlands 2.189 49.704 99.646 1.095UKH Eastern 2.576 33.126 67.488 1.903UKJ South East 5.926 85.094 175.577 3.434Source: Eurostat

43
NUMBER OF ACCOMMODATION ESTABLISHMENTS, ROOMS,
Hotels and similar establishments Other accommodation etablishments
Bed-places Number of establishments Bed-places
of which in tourist campsitesNumber of
establishments Bed-places
12.129.352 240.349 15.714.471 : :11.632.733 239.370 15.626.982 : :
68.512 871 143.285 245 51.376213.656 1.622 143.003 325 89.828396.888 3.934 253.359 432 142.048139.261 837 84.121 232 50.472203.041 942 102.306 258 59.236102.750 314 28.656 21 17.873300.826 2.837 432.375 352 334.122295.008 2.324 159.776 164 90.255300.548 280 118.819 103 64.71635.682 392 149.137 355 142.268
134.284 1.521 529.870 844 293.568
136.418 1.272 577.443 712 389.416
84.855 3.398 96.452 173 50.264198.582 3.064 135.594 207 88.992212.539 47.413 482.876 188 222.052296.292 4.076 137.871 125 86.994161.839 5.964 131.129 128 77.207117.209 1.003 304.405 635 226.23251.585 112 22.193 40 15.928
185.270 4.716 154.110 407 95.17899.646 1.095 45.588 157 27.12367.488 1.903 121.883 262 99.539
175.577 3.434 267.636 483 224.476

44
ARRIVALS AND NIGHTS SPENT BY RESIDENTS AND NON-RESIDENTS IN HOTELS AND SIMILAR ESTABLISHMENTS. MEMBER STATES. YEAR 2009
Hotels and similar establishmentsResidents
Arrivals Nights spent Average length of stay
AT Austria 8.322.507 22.273.027 2,7 15.520.385BE Belgium 3.217.353 5.604.243 1,7BG Bulgaria 2.100.105 4.675.538 2,2CY Cyprus 592.686 1.319.561 2,2CZ Czech Republic 3.726.093 9.327.513 2,5DE Germany 81.075.597 172.755.810 2,1 20.965.704DK Denmark 2.038.612 5.707.684 2,8EE Estonia 560.083 943.950 1,7ES Spain 45.138.083 109.756.879 2,4 32.002.237FI Finland 6.429.217 10.929.696 1,7FR France 75.884.324 127.904.350 1,7 28.926.790GR Greece 7.352.183 18.366.858 2,5HU Hungary 3.065.846 7.201.482 2,3IE Ireland : 8.452.000 :IT Italy 43.698.082 139.789.528 3,2 32.632.696LT Lithuania 413.817 754.545 1,8
LU Luxembourg (Grand-Duché) 30.238 88.949 2,9
LV Latvia 302.398 599.543 2,0MT Malta 158.104 350.638 2,2NL Netherlands 10.092.200 17.052.400 1,7PL Poland 9.591.765 17.036.420 1,8PT Portugal 6.188.951 13.242.692 2,1RO Romania 4.663.411 13.932.222 3,0SE Sweden 12.366.504 19.871.384 2,0SI Slovenia 648.112 2.234.372 3,4SK Slovakia 1.333.160 3.427.295 2,6UK United Kingdom 48.278.976 106.116.424 2,2 17.321.289Source: Eurostat
TOURISM

45
ARRIVALS AND NIGHTS SPENT BY RESIDENTS AND NON-RESIDENTS IN HOTELS AND SIMILAR ESTABLISHMENTS. MEMBER STATES. YEAR 2009
Hotels and similar establishmentsNon-residents
Average length of stay Arrivals Nights spent Average length
of stay2,7 15.520.385 57.798.255 3,71,7 5.449.891 10.332.941 1,92,2 1.931.258 9.377.995 4,92,2 1.646.564 11.488.361 7,02,5 5.609.025 16.013.046 2,92,1 20.965.704 43.472.369 2,12,8 1.190.417 4.257.886 3,61,7 1.307.548 2.555.011 2,02,4 32.002.237 141.227.936 4,41,7 1.953.538 4.197.575 2,11,7 28.926.790 63.836.804 2,22,5 8.542.307 45.925.585 5,42,3 2.914.328 7.773.329 2,7
: : : :3,2 32.632.696 106.828.579 3,31,8 684.471 1.322.983 1,9
2,9 651.414 1.192.639 1,8
2,0 697.320 1.587.504 2,32,2 946.756 6.389.661 71,7 7.754.200 14.428.600 1,91,8 3.394.043 7.478.031 2,22,1 5.911.079 23.214.377 3,93,0 1.255.703 2.581.861 2,12,0 3.044.348 6.087.096 2,03,4 1.411.352 3.684.005 2,62,6 1.047.055 2.907.900 2,82,2 17.321.289 59.608.084 3,4

46
ARRIVALS AND NIGHTS SPENT BY RESIDENTS AND NON-RESIDENTS IN HOTELS AND SIMILAR ESTABLISHMENTS. EUROPEAN REGIONS. YEAR 2009
Hotels and similar establishmentsResidents
Arrivals Nights spent Average length of stay
EU27 : 839.715.003EU25 : 821.107.243BE2 Vlaams Gewest 1.895.028 3.400.941 1,8DE1 Baden-Württemberg 9.949.568 20.216.297 2,0DE2 Bayern 16.081.512 39.045.767 2,4DE7 Hessen 6.701.610 12.413.826 1,9DEA Nordrhein-Westfalen 10.774.374 19.169.005 1,8ES3 Comunidad de Madrid 5.185.758 8.655.044 1,7ES51 Cataluña 6.226.090 14.539.018 2,3ES61 Andalucía 9.174.850 23.210.143 2,5FR1 Île de France 17.166.921 29.463.317 1,7FR3 Nord - Pas-de-Calais 2.577.728 4.072.918 1,6FR71 Rhône-Alpes 7.488.598 12.980.238 1,7FR82 Provence - Alpes - Côte d’Azur 6.915.181 12.808.998 1,9ITC1 Piemonte 2.116.932 4.918.605 2,3ITC4 Lombardia 5.636.501 11.350.369 2,0ITD3 Veneto 3.833.760 11.109.149 2,9ITD5 Emilia-Romagna 5.859.373 23.407.886 4,0ITE4 Lazio 3.115.487 7.431.042 2,4NL3 West-Nederland 4.823.100 8.074.100 1,7SE11 Stockholm 3.192.666 5.238.127 1,6UKD North West 6.533.253 13.891.551 2,1UKG West Midlands 3.957.676 6.907.431 1,7UKH Eastern 2.868.296 5.767.551 2,0UKJ South East 6.193.303 13.542.162 2,2Source: Eurostat
TOURISM

47
ARRIVALS AND NIGHTS SPENT BY RESIDENTS AND NON-RESIDENTS IN HOTELS AND SIMILAR ESTABLISHMENTS. EUROPEAN REGIONS. YEAR 2009
Hotels and similar establishmentsResidents Non-residents
Nights spent Average length of stay Arrivals Nights spent Average length
of stay839.715.003 : : : :821.107.243 : : : :
3.400.941 1,8 2.581.340 4.948.775 1,920.216.297 2,0 2.830.036 5.868.238 2,139.045.767 2,4 5.177.313 10.338.600 2,012.413.826 1,9 2.484.974 4.465.068 1,819.169.005 1,8 3.090.468 6.290.142 2,08.655.044 1,7 3.652.834 7.863.756 2,2
14.539.018 2,3 7.805.186 26.203.203 3,423.210.143 2,5 5.030.752 17.471.072 3,529.463.317 1,7 13.016.451 32.815.329 2,54.072.918 1,6 964.759 1.471.654 1,5
12.980.238 1,7 1.952.152 4.148.153 2,112.808.998 1,9 2.971.308 7.156.729 2,44.918.605 2,3 831.321 2.249.095 2,7
11.350.369 2,0 4.691.145 12.030.010 2,611.109.149 2,9 5.642.394 16.639.399 2,923.407.886 4,0 1.698.788 6.767.340 4,07.431.042 2,4 6.056.887 18.151.493 3,08.074.100 1,7 6.368.900 11.983.100 1,95.238.127 1,6 1.250.080 2.685.815 2,1
13.891.551 2,1 1.069.999 2.878.560 2,76.907.431 1,7 592.063 1.797.889 3,05.767.551 2,0 619.110 2.049.672 3,3
13.542.162 2,2 1.614.886 5.260.265 3,3

48 TOURISM
Source: calculation based on Eurostat data
Also in 2009 Emilia Romagna is the region where non-resident tourists recorded the longest stay, withanaverageof4.0nightsspentpertourist.TwoSpanishregions,AndalucíaandCataluña,followedclosely(with,respectively,3.5and3.4nightsspentbyeachtourist).
In Lombardia the average number of nights spent by non-residents was much lower: 2.6, a value verysimilartotheonerecordedinÎledeFrance,inPiemonteandintheEnglishNorthWest.
AVERAGE LENGTH OF STAY OF NON-RESIDENT TOURISTS. YEAR 2009
Average length of stay of non-resident tourists
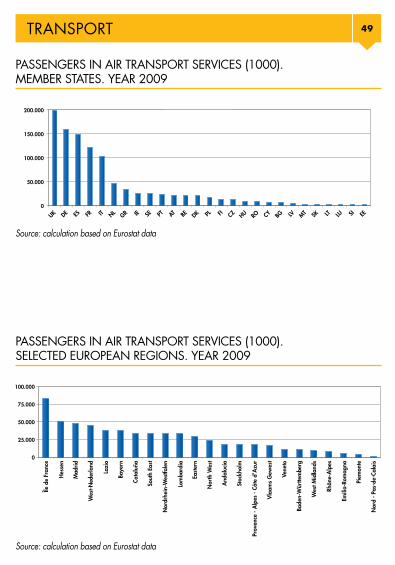
PASSENGERS IN AIR TRANSPORT SERVICES (1000). SELECTED EUROPEAN REGIONS. YEAR 2009
Source: calculation based on Eurostat data
PASSENGERS IN AIR TRANSPORT SERVICES (1000). MEMBER STATES. YEAR 2009
Source: calculation based on Eurostat data
200.000
150.000
100.000
50.000
0
100.000
75.000
50.000
25.000
0
49TRANSPORT
Also in 2009 Emilia Romagna is the region where non-resident tourists recorded the longest stay, andCataluña,
In Lombardia the average number of nights spent by non-residents was much lower: 2.6, a value West.
Fonte: elaborazione su dati Eurostat
Fonte: elaborazione su dati Eurostat
Trasporti
0
50.000
100.000
150.000
200.000
Passeggeri dei trasporti aerei. Stati europei. Anno 2009 (migliaia)
0
25.000
50.000
75.000
100.000
Île d
e Fr
ance
Ass
ia
Mad
rid
Paes
i Bas
si O
ccid
enta
li
Lazi
o
Bav
iera
Cat
alog
na
Sout
h Ea
st
Ren
ania
Set
t. - V
estfa
lia
Lom
bard
ia
East
ern
Nor
th W
est
And
alus
ia
Stoc
colm
a
Prov
enza
-Alp
i-Cos
ta A
zzur
ra
Fian
dre
Vene
to
Bad
en-W
ürtte
mbe
rg
Wes
t Mid
land
s
Rhô
ne-A
lpes
Emili
a-R
omag
na
Piem
onte
Nor
d - P
as-d
e-C
alai
s Passeggeri dei trasporti aerei. Regioni europee. Anno 2009
(migliaia)
PASSENGERS IN AIR TRANSPORT SERVICES (1000). SELECTED EUROPEAN REGIONS. YEAR 2009
Source: calculation based on Eurostat data
Fonte: elaborazione su dati Eurostat
Fonte: elaborazione su dati Eurostat
Trasporti
0
50.000
100.000
150.000
200.000
Passeggeri dei trasporti aerei. Stati europei. Anno 2009 (migliaia)
0
25.000
50.000
75.000
100.000
Île d
e Fr
ance
Ass
ia
Mad
rid
Paes
i Bas
si O
ccid
enta
li
Lazi
o
Bav
iera
Cat
alog
na
Sout
h Ea
st
Ren
ania
Set
t. - V
estfa
lia
Lom
bard
ia
East
ern
Nor
th W
est
And
alus
ia
Stoc
colm
a
Prov
enza
-Alp
i-Cos
ta A
zzur
ra
Fian
dre
Vene
to
Bad
en-W
ürtte
mbe
rg
Wes
t Mid
land
s
Rhô
ne-A
lpes
Emili
a-R
omag
na
Piem
onte
Nor
d - P
as-d
e-C
alai
s
Passeggeri dei trasporti aerei. Regioni europee. Anno 2009 (migliaia)
PASSENGERS IN AIR TRANSPORT SERVICES (1000). MEMBER STATES. YEAR 2009
Source: calculation based on Eurostat data
200.000
150.000
100.000
50.000
0
UK DE ES FR IT NL GR IE SE PT AT BE DK PL FI CZ HU RO CY BG LV MT SK LT LU SI EE
Île d
e Fr
ance
Hes
sen
Mad
rid
Wes
t-Ned
erla
nd
Lazi
o
Baye
rn
Cata
luña
Sout
h Ea
st
Nor
drhe
in-W
estfa
len
Lom
bard
ia
East
ern
Nor
th W
est
And
aluc
ía
Stoc
khol
m
Prov
ence
- A
lpes
- Cô
te d
’Azu
r
Vlaa
ms
Gew
est
Vene
to
Bade
n-W
ürtte
mbe
rg
Wes
t Mid
land
s
Rhôn
e-A
lpes
Nor
d - P
as-d
e-Ca
lais
Piem
onte
Emili
a-Ro
mag
na
100.000
75.000
50.000
25.000
0

50 TRANSPORT
PASSENGERS IN AIR TRANSPORT SERVICES (1000). MEMBER STATES. YEAR 2009
Passengers embarked and disembarkedTotal Embarked Disembarked
2008 2009 2008 2009 2008 2009AT Austria 23.899 21.815 12.323 11.267 12.271 11.232BE Belgium 21.980 21.313 11.018 10.672 10.981 10.660BG Bulgaria 6.418 5.839 3.314 3.030 3.241 2.982CY Cyprus 7.218 6.730 3.609 3.364 3.609 3.366
CZ Czech Republic 13.429 12.367 6.709 6.170 6.720 6.197
DE Germany 165.759 158.166 95.230 90.933 95.376 90.942DK Denmark 24.629 20.860 13.172 11.236 13.205 11.259EE Estonia 1.804 1.341 913 678 892 663ES Spain 161.405 148.322 101.072 92.972 100.764 92.570FI Finland 14.851 13.829 8.829 8.134 8.751 8.095FR France 126.018 120.613 76.348 73.202 76.306 73.219GR Greece 34.391 32.874 20.491 19.901 20.346 19.747HU Hungary 8.429 8.081 4.280 4.106 4.149 3.975IE Ireland 30.017 26.268 15.425 13.429 15.350 13.400IT Italy 105.200 101.774 66.316 64.886 66.270 64.741LT Lithuania 2.552 1.867 1.279 940 1.273 928
LU Luxembourg (Grand-Duché) 1.713 1.535 861 771 853 764
LV Latvia 3.687 4.063 1.850 2.050 1.837 2.012MT Malta 3.110 2.919 1.558 1.462 1.552 1.457NL Netherlands 50.418 46.479 25.242 23.192 25.219 23.288PL Poland 18.726 17.046 9.789 8.900 9.689 8.837PT Portugal 25.178 24.100 13.850 13.432 14.055 13.560RO Romania 8.031 7.984 4.243 4.170 4.140 4.125SE Sweden 27.818 25.219 16.957 15.344 16.944 15.322SI Slovenia 1.649 1.423 823 706 826 717SK Slovakia 2.596 1.948 1.399 1.024 1.391 1.026
UK United Kingdom 213.883 198.533 117.260 108.576 117.701 109.155
Source: Eurostat
PASSENGERS IN AIR TRANSPORT SERVICES (1000). EUROPEAN REGIONS. YEAR 2009
EU27EU25BE2 Vlaams GewestDE1 Baden-WürttembergDE2 BayernDE7 HessenDEA Nordrhein-WestfalenES3 Comunidad de MadridES51 CataluñaES61 AndalucíaFR1 Île de FranceFR3 Nord - Pas-de-CalaisFR71 Rhône-Alpes
FR82 Provence - Alpes - Côte d’Azur
ITC1 PiemonteITC4 LombardiaITD3 VenetoITD5 Emilia-RomagnaITE4 LazioNL3 West-NederlandSE11 StockholmUKD North WestUKG West MidlandsUKH EasternUKJ South EastSource: Eurostat

51TRANSPORT
PASSENGERS IN AIR TRANSPORT SERVICES (1000). MEMBER STATES.
Disembarked2009
11.23210.6602.9823.366
6.197
90.94211.259
66392.5708.095
73.21919.7473.975
13.40064.741
928
764
2.0121.457
23.2888.837
13.5604.125
15.322717
1.026
109.155
PASSENGERS IN AIR TRANSPORT SERVICES (1000). EUROPEAN REGIONS. YEAR 2009
Passengers embarked and disembarkedTotal Embarked Disembarked
2008 2009 2008 2009 2008 2009EU27 1.104.808 1.033.308 634.160 594.547 633.711 594.239EU25 1.090.359 1.019.485 626.603 587.347 626.330 587.132BE2 Vlaams Gewest 18.659 17.058 9.330 8.514 9.332 8.548DE1 Baden-Württemberg 11.691 10.548 5.854 5.292 5.841 5.261DE2 Bayern 39.014 37.225 19.559 18.663 19.553 18.651DE7 Hessen 53.189 50.574 26.537 25.216 26.653 25.358DEA Nordrhein-Westfalen 34.852 33.782 17.434 16.936 17.425 16.853ES3 Comunidad de Madrid 50.366 47.944 25.216 24.006 25.150 23.938ES51 Cataluña 37.117 34.234 18.500 17.121 18.617 17.114ES61 Andalucía 20.752 18.592 10.434 9.328 10.319 9.265FR1 Île de France 86.683 82.776 43.356 41.351 43.327 41.425FR3 Nord - Pas-de-Calais 1.012 1.134 500 564 512 570FR71 Rhône-Alpes 8.617 8.358 4.300 4.174 4.318 4.184
FR82 Provence - Alpes - Côte d’Azur 17.903 17.567 8.942 8.776 8.963 8.793
ITC1 Piemonte 3.397 3.208 1.695 1.604 1.702 1.604ITC4 Lombardia 34.940 32.984 17.391 16.451 17.548 16.533ITD3 Veneto 11.853 11.472 5.922 5.734 5.931 5.738ITD5 Emilia-Romagna 5.828 5.915 2.908 2.958 2.921 2.956ITE4 Lazio 39.558 38.172 19.855 19.165 19.704 19.008NL3 West-Nederland 48.399 44.459 24.198 22.168 24.201 22.291SE11 Stockholm 19.985 18.031 9.996 9.013 9.990 9.019UKD North West 26.832 23.787 13.385 11.858 13.447 11.928UKG West Midlands 9.907 9.092 4.945 4.526 4.963 4.566UKH Eastern 33.141 29.499 16.490 14.671 16.651 14.828UKJ South East 36.121 34.156 18.058 17.059 18.063 17.098Source: Eurostat

52 INFORMATION SOCIETY
HOUSEHOLDS WITH ACCESS TO THE INTERNET AT HOME (AS % OF TOTAL HOUSEHOLDS). EUROPEAN REGIONS. YEARS 2008-2010
EU27EU25BE2 Vlaams GewestDE1 Baden-WürttembergDE2 BayernDE7 HessenDEA Nordrhein-WestfalenES3 Comunidad de MadridES51 CataluñaES61 AndalucíaFR1 Île de FranceFR3 Nord - Pas-de-CalaisFR71 Rhône-AlpesFR82 Provence - Alpes - Côte d’AzurITC1 PiemonteITC4 LombardiaITD3 VenetoITD5 Emilia-RomagnaITE4 LazioNL3 West-NederlandSE11 StockholmUKD North WestUKG West MidlandsUKH EasternUKJ South EastSource: Eurostat
HOUSEHOLDS WITH ACCESS TO THE INTERNET AT HOME (AS % OF TOTAL HOUSEHOLDS). MEMBER STATES. YEARS 2008-2010
2008 2009 2010AT Austria 69 70 73BE Belgium 64 67 73BG Bulgaria 25 30 33CY Cyprus 43 53 54CZ Czech Republic 46 54 61DE Germany 75 79 82DK Denmark 82 83 86EE Estonia 58 63 68ES Spain 51 54 59FI Finland 72 78 81FR France 62 63 74GR Greece 31 38 46HU Hungary 48 55 60IE Ireland 63 67 72IT Italy 47 53 59LT Lithuania 51 60 61LU Luxembourg (Grand-Duché) 80 87 90LV Latvia 53 58 60MT Malta 59 64 70NL Netherlands 86 90 91PL Poland 48 59 63PT Portugal 46 48 54RO Romania 30 38 42SE Sweden 84 86 88SI Slovenia 59 64 68SK Slovakia 58 62 67UK United Kingdom 71 77 80Source: Eurostat

53INFORMATION SOCIETY
HOUSEHOLDS WITH ACCESS TO THE INTERNET AT HOME (AS % OF TOTAL HOUSEHOLDS). EUROPEAN REGIONS. YEARS 2008-2010
2008 2009 2010EU27 : : :EU25 : : :BE2 Vlaams Gewest 69 73 77DE1 Baden-Württemberg 75 78 82DE2 Bayern 77 80 82DE7 Hessen 77 82 85DEA Nordrhein-Westfalen 78 84 85ES3 Comunidad de Madrid 62 64 67ES51 Cataluña 60 63 68ES61 Andalucía 44 48 55FR1 Île de France 68 69 86FR3 Nord - Pas-de-Calais 61 56 74FR71 Rhône-Alpes : : :FR82 Provence - Alpes - Côte d’Azur : : :ITC1 Piemonte 45 52 57ITC4 Lombardia 54 57 64ITD3 Veneto 48 57 61ITD5 Emilia-Romagna 53 57 61ITE4 Lazio 54 58 65NL3 West-Nederland 88 91 92SE11 Stockholm : 90 91UKD North West 62 74 75UKG West Midlands 66 76 78UKH Eastern 78 82 87UKJ South East 80 81 86Source: Eurostat
(AS % OF TOTAL HOUSEHOLDS). MEMBER STATES. YEARS 2008-2010
2010737333546182866859817446607259619060709163544288686780
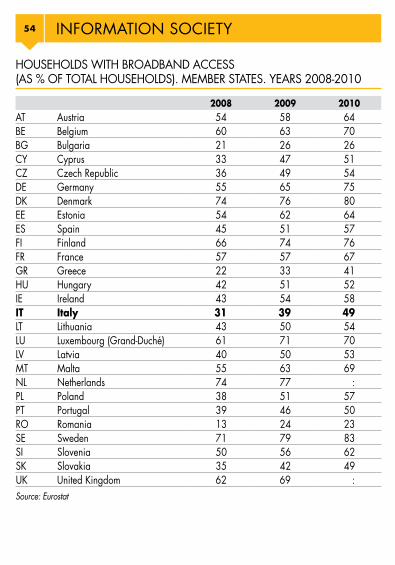
54 INFORMATION SOCIETY
HOUSEHOLDS WITH BROADBAND ACCESS (AS % OF TOTAL HOUSEHOLDS). EUROPEAN REGIONS. YEARS 2008-2010
EU27EU25BE2 Vlaams GewestDE1 Baden-WürttembergDE2 BayernDE7 HessenDEA Nordrhein-WestfalenES3 Comunidad de MadridES51 CataluñaES61 AndalucíaFR1 Île de FranceFR3 Nord - Pas-de-CalaisFR71 Rhône-AlpesFR82 Provence - Alpes - Côte d’AzurITC1 PiemonteITC4 LombardiaITD3 VenetoITD5 Emilia-RomagnaITE4 LazioNL3 West-NederlandSE11 StockholmUKD North WestUKG West MidlandsUKH EasternUKJ South EastSource: Eurostat
HOUSEHOLDS WITH BROADBAND ACCESS (AS % OF TOTAL HOUSEHOLDS). MEMBER STATES. YEARS 2008-2010
2008 2009 2010AT Austria 54 58 64BE Belgium 60 63 70BG Bulgaria 21 26 26CY Cyprus 33 47 51CZ Czech Republic 36 49 54DE Germany 55 65 75DK Denmark 74 76 80EE Estonia 54 62 64ES Spain 45 51 57FI Finland 66 74 76FR France 57 57 67GR Greece 22 33 41HU Hungary 42 51 52IE Ireland 43 54 58IT Italy 31 39 49LT Lithuania 43 50 54LU Luxembourg (Grand-Duché) 61 71 70LV Latvia 40 50 53MT Malta 55 63 69NL Netherlands 74 77 :PL Poland 38 51 57PT Portugal 39 46 50RO Romania 13 24 23SE Sweden 71 79 83SI Slovenia 50 56 62SK Slovakia 35 42 49UK United Kingdom 62 69 :Source: Eurostat

55INFORMATION SOCIETY
HOUSEHOLDS WITH BROADBAND ACCESS (AS % OF TOTAL HOUSEHOLDS). EUROPEAN REGIONS. YEARS 2008-2010
2008 2009 2010EU27 : : :EU25 : : :BE2 Vlaams Gewest 66 69 74DE1 Baden-Württemberg 56 63 75DE2 Bayern 58 66 75DE7 Hessen 55 67 79DEA Nordrhein-Westfalen 60 72 79ES3 Comunidad de Madrid 58 63 66ES51 Cataluña 53 60 67ES61 Andalucía 39 46 53FR1 Île de France 64 64 80FR3 Nord - Pas-de-Calais 52 49 68FR71 Rhône-Alpes : : :FR82 Provence - Alpes - Côte d’Azur : : :ITC1 Piemonte 29 38 48ITC4 Lombardia 36 43 53ITD3 Veneto 32 39 54ITD5 Emilia-Romagna 38 41 51ITE4 Lazio 38 45 53NL3 West-Nederland 76 80 :SE11 Stockholm : 84 87UKD North West 52 66 :UKG West Midlands 60 69 :UKH Eastern 68 73 :UKJ South East 71 75 :Source: Eurostat
(AS % OF TOTAL HOUSEHOLDS). MEMBER STATES. YEARS 2008-2010
201064702651547580645776674152584954705369
:575023836249
:

56

REGIONAL STATISTICAL YEARBOOKLOMBARDIA 2011
WWW.ASR-LOMBARDIA.IT
Éupolis Lombardia Institute for Research, Statistics and Training
Via Copernico 38, 20125 Milan, Italytel. +39-02-67655128 fax +39-02-67655434
e-mail: [email protected] site: www.eupolislombardia.it
Unioncamere LombardiaEconomic Information Office
Via E. Oldofredi 23, 20124 Milan, Italytel. +39-02-607960.1 fax +39-02-607960.235
e-mail: [email protected] site: www.unioncamerelombardia.it
ISTAT, Regional Office for LombardyVia Porlezza 12, 20123 Milan, Italy
tel. +39-02-80613211 fax +39-02-806132.205e-mail: [email protected]
web site: www.istat.it