Regional Partnership Information – Bay Area Transformation ... · Web viewThe PPC model, process...
52
HSCRC Transformation Grant – Performance Year 2 (FY 2018) Report Template - FINAL HSCRC Regional Partnership Transformation Grant Narrative FY 2018 Bay Area Transformation Partnership Anne Arundel Medical Center and University of Maryland Baltimore Washington Medical Center Submitted on: September 14, 2018 Submitted by: Cynthia Gingrich, BATP Project Management Consultant
Transcript of Regional Partnership Information – Bay Area Transformation ... · Web viewThe PPC model, process...
HSCRC Transformation Grant – Performance Year 2 (FY 2018) Report Template - FINAL
HSCRC Regional Partnership Transformation Grant Narrative FY 2018
Bay Area Transformation Partnership
Anne Arundel Medical Center and
University of Maryland Baltimore Washington Medical Center
Submitted on: September 14, 2018
Submitted by: Cynthia Gingrich, BATP Project Management Consultant

HSCRC Transformation Grant – Performance Year 2 (FY 2018) Report Template - FINAL
Table of ContentsHSCRC Transformation Grant FY2018 Report...............................................................................................................................1
Regional Partnership Information – Bay Area Transformation Partnership..........................................................................1
Overall Summary of Regional Partnership Activities in FY 2018............................................................................................3
Total Interventions FY18 (unique per hospital, and non-unique per intervention)...........................................................4
Intervention Program - Community Care Management, The Coordinating Center...............................................................5
Intervention Program – Department of Aging Senior Triage Team (for UMBWMC).............................................................9
Intervention Program – Shared Care Alerts........................................................................................................................11
Intervention Program – One Call Care Management..........................................................................................................13
Intervention Program – Patient Panel Coordinators (AAMC)..............................................................................................16
Intervention Program – Integrated Behavioral Health in Primary Care...............................................................................18
Intervention Program – Behavioral Health Navigators (AAMC)..........................................................................................20
Intervention Program – Skilled Nursing Facility Collaborative............................................................................................22
Intervention Program – Joint Patient and Family Advisory Council.....................................................................................25
Intervention Program – Collaborative Care Network (AAMC).............................................................................................27
Core Measures....................................................................................................................................................................30
Utilization Measures.......................................................................................................................................................30
Quality Indicator Measures.............................................................................................................................................31
CRISP Key Indicators (Optional).......................................................................................................................................32
Self-Reported Process Measures.....................................................................................................................................32
Return on Investment.........................................................................................................................................................33
Conclusion...........................................................................................................................................................................34

HSCRC Transformation Grant – Performance Year 2 (FY 2018) Report Template - FINAL
HSCRC Transformation Grant FY2018 Report
The Health Services Cost Review Commission (HSCRC) is reviewing the following for FY 2018: this Report, the Budget Report, and the Budget Narrative. Whereas the Budget Report distinguishes between each hospital, this Summary Report should describe all hospitals, if more than one, that are in the Regional Partnership.
Regional Partnership Information – Bay Area Transformation Partnership
Regional Partnership (RP) Name Bay Area Transformation Partnership (BATP)
RP Hospital(s) Anne Arundel Medical CenterUniversity of Maryland Baltimore Washington Medical Center
RP POC Cynthia Gingrich, Project Management Consultant
RP Interventions in FY 2018 Total Interventions in FY18: 21,220
AAMC: 3,989 + 13,589 (Patient Panel Coordinators) = 17,578
UM BWMC: 3,642
Total Budget in FY 2018This should equate to total FY 2017 award
FY 2018 Award: $3,831,141
Total FTEs in FY 2018 Employed: 22AAMC: 12UM BWMC: 10
Contracted: 19The Coordinating Center (for AAMC) 7.5The Coordinating Center (for UM BWMC) 6.5Anne Arundel County Dept of Aging Senior Triage Team (for UM BWMC) 4BATP Project Manager (for both AAMC and UMBWMC) 1
Program Partners in FY 2018Please list any community-based organizations or provider groups, contractors, and/or public partners
Anne Arundel County Crisis Response Department of Health Department of Aging and Disabilities Senior Triage Team (community care management) Department of Mental HealthAdfinitas Health (providers in SNF facilities and hospitalist groups)Arundel Lodge CareFirstChesapeake Palliative Medicine
1

HSCRC Transformation Grant – Performance Year 2 (FY 2018) Report Template - FINAL
CRISPEastern Shore Psychological ServicesFire/EMS Prince Georges County Queen Anne’s County (DOH Mobile Integrated Care Unit) Anne Arundel County (FY19)Hospice of the ChesapeakeThe Coordinating Center (community care management)Skilled Nursing Facility Collaborative (Medical Directors, Administrators, Directors of Nursing and Corporate)
Communicare CorporateCommunicare Marley NeckCommunicare South RiverCrofton Care and Rehabilitation CenterFairfield Nursing CenterFutureCare (CorporateFutureCare ChesapeakeFutureCare IrvingtonGenesis CorporateGenesis Corsica HillsGenesis Severna ParkGenesis Spa CreekGenesis Waugh ChapelGlen Burnie Health and RehabSAVA CorporateSAVA Heritage HarbourSAVA North ArundelAdfinitas Hospice of the ChesapeakeOptumGinger CoveSignature Health
Primary Care Practices, AAMC (Collaborative Care Network Practices) Primary Care Practices, UM BWMC, UMCMG and non-UM CMG Practices
2

HSCRC Transformation Grant – Performance Year 2 (FY 2018) Report Template - FINAL
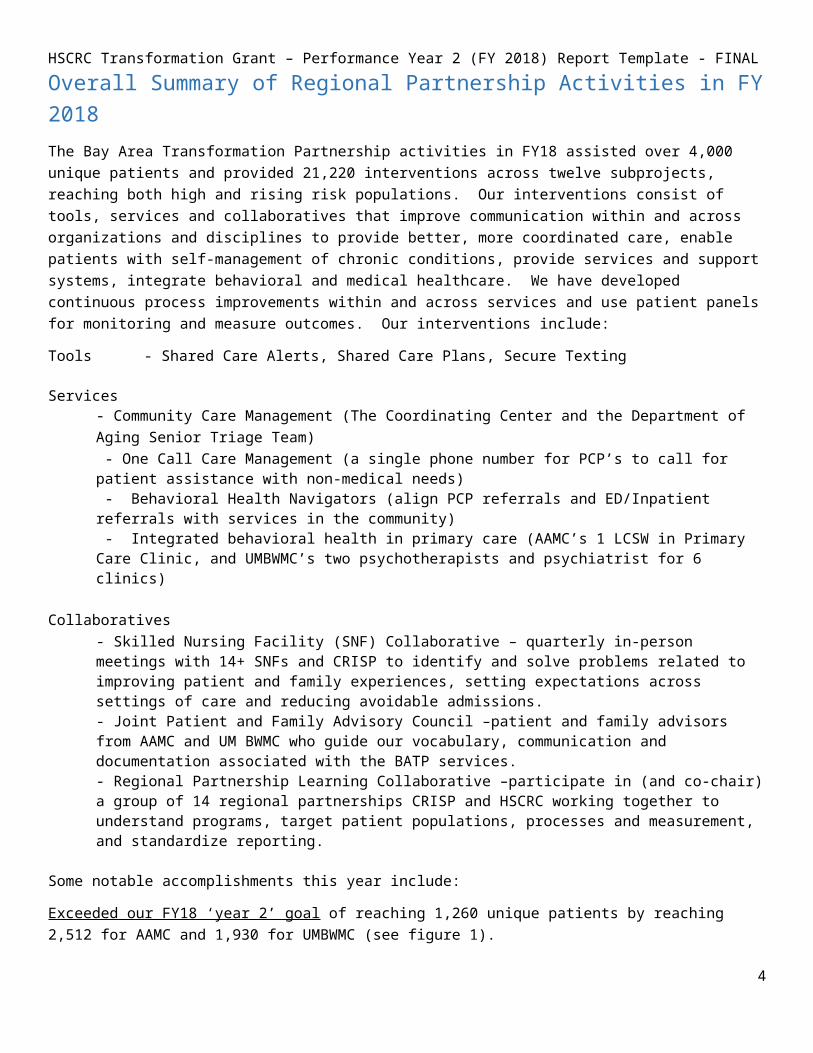
Overall Summary of Regional Partnership Activities in FY 2018
The Bay Area Transformation Partnership activities in FY18 assisted over 4,000 unique patients and provided 21,220 interventions across twelve subprojects, reaching both high and rising risk populations. Our interventions consist of tools, services and collaboratives that improve communication within and across organizations and disciplines to provide better, more coordinated care, enable patients with self-management of chronic conditions, provide services and support systems, integrate behavioral and medical healthcare. We have developed continuous process improvements within and across services and use patient panels for monitoring and measure outcomes. Our interventions include:
Tools - Shared Care Alerts, Shared Care Plans, Secure Texting
Services - Community Care Management (The Coordinating Center and the Department of Aging Senior Triage Team) - One Call Care Management (a single phone number for PCP’s to call for patient assistance with non-medical needs) - Behavioral Health Navigators (align PCP referrals and ED/Inpatient referrals with services in the community) - Integrated behavioral health in primary care (AAMC’s 1 LCSW in Primary Care Clinic, and UMBWMC’s two psychotherapists and psychiatrist for 6 clinics)
Collaboratives- Skilled Nursing Facility (SNF) Collaborative – quarterly in-person meetings with 14+ SNFs and CRISP to identify and solve problems related to improving patient and family experiences, setting expectations across settings of care and reducing avoidable admissions.- Joint Patient and Family Advisory Council –patient and family advisors from AAMC and UM BWMC who guide our vocabulary, communication and documentation associated with the BATP services. - Regional Partnership Learning Collaborative –participate in (and co-chair) a group of 14 regional partnerships CRISP and HSCRC working together to understand programs, target patient populations, processes and measurement, and standardize reporting.
Some notable accomplishments this year include:
Exceeded our FY18 ‘year 2’ goal of reaching 1,260 unique patients by reaching 2,512 for AAMC and 1,930 for UMBWMC (see figure 1).
Advances in data analytics – In FY17, we did not have skilled nursing facility readmission data per SNF, let alone risk-adjusted across all SNFs in the state. BATP worked with CRISP and hMetrix to provide requirements and review draft reports of risk-adjusted SNF utilization/charge/LOS reports, now available and updated monthly under ‘monitoring’ in the MADE CCLF tool.
Real-time admission and discharge information for PCP’s and community partners – Assisted our largest community care management vendor in receiving real-time encounter notifications via secure texting for outreach to patients and care teams. Piloting streamlined encounter notifications via Epic inbasket folders for PCPs, so that primary care office staff have a real-time list of hospital and SNF discharge information. They can use the list to contact patients about their post-discharge needs and to schedule appointments in a timely manner.
Population health maintenance (AAMC) – reached 13,589 patients across 12 clinics with patient panel coordinators (AAMC) to bring diabetes A1c, influenza vaccines, mammogram and colonoscopy screenings in compliance.
Shared Care Alert development and maintenance of 2,074 alerts, and developed workflow to collaborate on shared patients.
3

HSCRC Transformation Grant – Performance Year 2 (FY 2018) Report Template - FINALFacilitated the SNF Collaborative, bringing key representatives from 14 SNFs together to perform problem identification and prioritization of hospital and skilled nursing facility challenges related to patient and family satisfaction and avoidable utilization and readmissions, with workgroups starting in FY19.
Our Behavioral Health interventions primarily serve rising risk and pre-rising risk patients, both in the primary care setting, where we worked with 789 patients, and in the Behavioral Health Navigator service for ED, inpatient and PCP referrals which assisted 558 patients in finding resources for therapy and medication assistance.
Our Community Care Management services assisted over 1,400 patients across three separate programs, and each one showed savings in utilization, per patient charges and per visit charges. Since we measure both FY18 and cumulative results for all patients seen by the services, we can see long-term effects, compare and research differences, and adjust models. Outcome metrics are available in Appendix A for applicable programs.
Total Interventions FY18 (unique per hospital, and non-unique per intervention)
BATP FY18 Interventions
Unique Patients (per hospital) AAMC UMBWMCNon Behavioral Health Interventions 1791 1701Behavioral Health 721 609Total Unique Patients with Any Intervention* 2512 1930
Non-Unique Across Subprojects (Unique within Subproject) TotalShared Care Alerts (active alerts) 1097 1205 2302Shared Care Plans (patient goals) 450 671 1121The Coordinating Center 562 659 1221Senior Triage Team N/A 180 180One Call Care Management 1031 318 1349Behavioral Health in Primary Care 180 609 789Behavioral Health Navigator ED (AAMC) 318 N/A 318Behavioral Health Navigator Community (AAMC) 351 N/A 351# of interventions (non-unique) FY18 3989 3642 7631Patient Panel Coordinators (AAMC) 13589Grand Total # of non-unique interventions FY18 17578 3642 21220
*excludes AAMC Patient Panel Coordinator work
Figure 1 - BATP FY18 Intervention Totals
4
HSCRC Transformation Grant – Performance Year 2 (FY 2018) Report Template - FINAL
Intervention Program - Community Care Management, The Coordinating Center
Intervention Community Care Management, The Coordinating Center
RP Hospitals Participating
Anne Arundel Medical CenterUM Baltimore Washington Medical Center
Brief description of the Intervention2-3 sentences
The hospitals contract with The Coordinating Center to provide community care management and coaching to patients, including in-home assessment, patient-centered goal charting in the Epic Longitudinal Plan of Care, education and coordination of chronic condition management, and placement of non-medical support services.
For AAMC, The Coordinating Center used a nurse/health coach team-based model with a 60-day average LOS. Staff included 3 RN’s, 3 health coaches, .5 Program Manager and an Intake Coordinator. This program was used in FY17 and FY18.
For UMBWMC, The Coordinating Center used a health coach model with a 30-day average LOS, 4 health coaches, .5 Program Manager, and an Intake Coordinator. This program was used in FY17 and FY18.
Participating Program Partners
Other partners to whom The Coordinating Center refer: Hospice of the Chesapeake, Palliative Care, and the Dept of Aging 25 programs and Senior Triage Team (for UMBWMC), home health agencies, and numerous other county and state programs.
Patients Served # of Patients Served as of June 30, 2018: 1,221
AAMC: 2,273 new referrals resulting in 562 patients receiving service UM BWMC: 2,047 new referrals resulting in 659 patients receiving service
5

HSCRC Transformation Grant – Performance Year 2 (FY 2018) Report Template - FINAL
HSCRC Population Denominator of Eligible Population: 66,823Population Category: 3+ IP/Obs>=24 Visits, Medicare FFSUsing the CY2017 RP Analytic File
BATP Denominator of Eligible Patients: 1,207 initial target population, expanding to 2,881 per below.
Referrals to community care management are made by evaluating the hospital census. We assess: 3+ IP/Obs>24 Visits, Medicare FFS, 2 to 6 chronic conditions, 65+ years old (1,207 patients), which is our original target population; then we look at the same criteria but All Payer (1,463), then we refer 2+ IP/Obs Visits, 2 to 6 chronic conditions, Medicare FFS (2,831) then All Payer (2,881). This methodology results in capturing the patient mix from our census who have high utilization and high needs, without being too strict with the original 3+ bedded visit criteria.
Pre-Post Analysis for Intervention
6

HSCRC Transformation Grant – Performance Year 2 (FY 2018) Report Template - FINAL
Below is a summary of the Pre-Post Reports for The Coordinating Center programs. For each hospital, we show the results from the FY18 panel of patients for 3 and 6 months pre and post, followed by the results from cumulative panels (AAMC had a May 2016 start, UMBWMC began service in August 2016). The AAMC FY18 program with 60-day average LOS, nurse / health coach model resulted in a 3-month pre-post (9 months’ worth of data) change in charges for 331 patients of (-$2.03M) and (-8.0) change in the rate of visits per 10 patients. This improved to (-11.0) visits per 10 members in 6-month pre/post. Per figure 3, UMBWMC’s health coach model, 30-day LOS program shows a 3-month change in charges for 356 patients of (-$5.9M) with a decrease of (-8.9) change in the rate of visits per 10 members. The decrease in average charges per patient (-$12,841) and per visit (-$3,998).
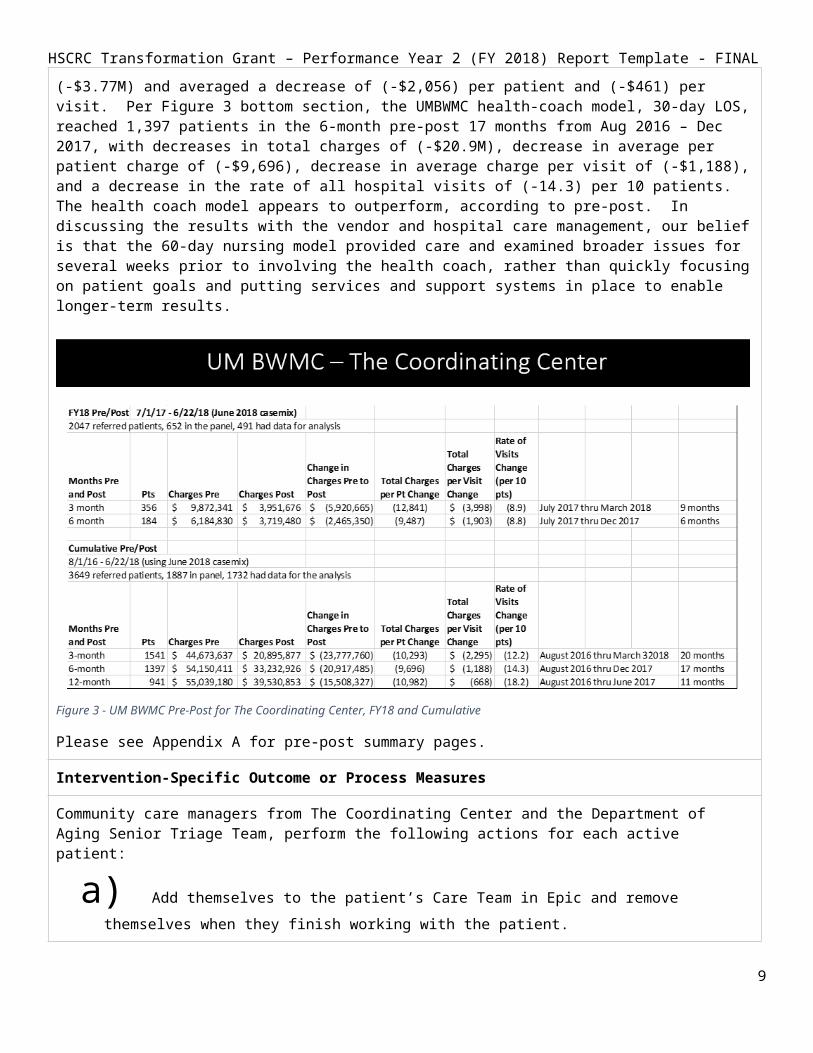
As we examine the longer-term goal to enable patients through education, services and supports to manage medical and non-medical conditions outside of the hospital setting, we look at the cumulative pre-post results, as indicated in the bottom sections of Figure’s 2 and 3. In Figure 2, bottom section, looking 6 months before and after care management was provided; AAMC’s 596 patients decreased visits by (-8.1) per 10 patients, decreased total charges by (-$3.77M) and averaged a decrease of (-$2,056) per patient and (-$461) per visit. Per Figure 3 bottom section, the UMBWMC health-coach model, 30-day LOS, reached 1,397 patients in the 6-month pre-post 17 months from Aug 2016 – Dec 2017, with decreases in total charges of (-$20.9M), decrease in average per patient charge of (-$9,696), decrease in average charge per visit of (-$1,188), and a decrease in the rate of all hospital visits of (-14.3) per 10 patients. The health coach model appears to outperform, according to pre-post. In discussing the results with the vendor and hospital care management, our belief is that the 60-day nursing model provided care and examined broader issues for several weeks prior to involving the health coach, rather than quickly focusing on patient goals and putting services and support systems in place to enable longer-term results.
7
Figure 2 AAMC Pre-Post for The Coordinating Center, FY18 and Cumulative
HSCRC Transformation Grant – Performance Year 2 (FY 2018) Report Template - FINAL
Figure 3 - UM BWMC Pre-Post for The Coordinating Center, FY18 and Cumulative
Please see Appendix A for pre-post summary pages.
Intervention-Specific Outcome or Process Measures
Community care managers from The Coordinating Center and the Department of Aging Senior Triage Team, perform the following actions for each active patient:
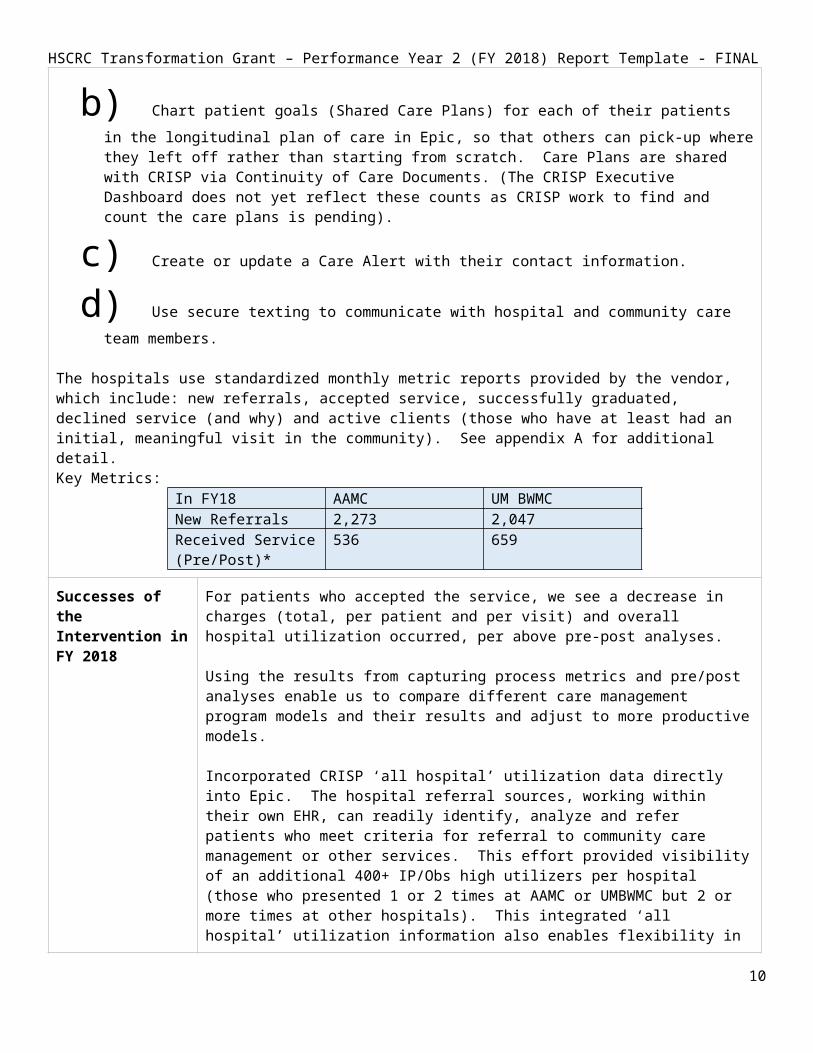
a) Add themselves to the patient’s Care Team in Epic and remove themselves when they finish working with the patient.
b) Chart patient goals (Shared Care Plans) for each of their patients in the longitudinal plan of care in Epic, so that others can pick-up where they left off rather than starting from scratch. Care Plans are shared with CRISP via Continuity of Care Documents. (The CRISP Executive Dashboard does not yet reflect these counts as CRISP work to find and count the care plans is pending).
c) Create or update a Care Alert with their contact information. d) Use secure texting to communicate with hospital and community care team members.
The hospitals use standardized monthly metric reports provided by the vendor, which include: new referrals, accepted service, successfully graduated, declined service (and why) and active clients (those who have at least had an initial, meaningful visit in the community). See appendix A for additional detail.Key Metrics:
In FY18 AAMC UM BWMCNew Referrals 2,273 2,047Received Service (Pre/Post)*
536 659
Successes of the Intervention in FY 2018
For patients who accepted the service, we see a decrease in charges (total, per patient and per visit) and overall hospital utilization occurred, per above pre-post analyses.
8

HSCRC Transformation Grant – Performance Year 2 (FY 2018) Report Template - FINAL
Using the results from capturing process metrics and pre/post analyses enable us to compare different care management program models and their results and adjust to more productive models.
Incorporated CRISP ‘all hospital’ utilization data directly into Epic. The hospital referral sources, working within their own EHR, can readily identify, analyze and refer patients who meet criteria for referral to community care management or other services. This effort provided visibility of an additional 400+ IP/Obs high utilizers per hospital (those who presented 1 or 2 times at AAMC or UMBWMC but 2 or more times at other hospitals). This integrated ‘all hospital’ utilization information also enables flexibility in expanding target patient criteria to find additional referrals as needed.
Both hospitals incorporated feedback from the Joint Patient Family Advisory Council to standardize and simplify vocabulary, improve marketing material, and make conversations at the bedside more engaging.
Lessons Learned from the Intervention in FY 2018
The biggest challenge for this service is converting referred patients to active patients (those who permit at least an initial in-home visit). The Coordinating Center believes that acceptance rates will increase if they are on-site at the hospitals to market their own service and hand off to their team. We are implementing this approach in FY19.
The 30-day health-coach model used by UM BWMC appears to drive immediate action and produces significantly better results than the nurse/health coach 60-day model. We believe this is because it is a time-limited, patient-centric model that focuses on patient-identified goals and providing long-term services and support systems.
Although the hospitals and care management programs have made great strides in standardizing monthly process metrics and definitions, it is currently a manually process which has proven to be error-prone and time consuming. Our goal in FY19 is to incorporate capture of referrals and statusing within Epic at each of the hospitals.
Next Steps for the Intervention in FY 2019Free Response, up to 1 Paragraph
Design and build referrals and statusing in hospital Epic systems, with community care management updating status in real-time.
Strive to improve patient acceptance of the service through motivational engagement by hospital and vendor staff.
Continue to prioritize Medicare FFS patients with high utilization, and expand target patient criteria to include All Payer, 2 or more visits of any type (IP/Obs>24, ED), prioritizing higher utilization first.
Bring community care management to the bedside to represent their own services and streamline hand-off to their peers, to hopefully increase the rate of patients who accept (and follow- through with) the service.
Study regional partnership-wide, statewide and nationwide approaches to and outcomes of community care management services for our target populations. Determine the best strategy moving forward.
9
HSCRC Transformation Grant – Performance Year 2 (FY 2018) Report Template - FINAL
Intervention Program – Department of Aging Senior Triage Team (for UMBWMC)
Intervention/Program Name
Senior Triage Team – Community Care ManagementAnne Arundel County Department of Aging & Disabilities
RP Hospitals Participating in Intervention
UM Baltimore Washington Medical Center
Brief description of the Intervention2-3 sentences
The Department of Aging and Disabilities ‘Senior Triage Team’ is an intensive 60-day community care management program. UM BWMC refers their most complex, high utilizer Medicare FFS patients to this team, comprised of 2 RN’s, 2 social workers, a team lead and administrator. The team was designed around Medicare FFS high utilizers and has been working with BATP since 6/1/16. They have advanced knowledge of all services and supports in Anne Arundel County, and how to streamline requests for and access to services, including financial analysis and housing assistance.
Participating Program Partners
The Senior Triage Team model has a built-in support system called the Silver CRICT Team, an aging/senior population Community Resource Initiative Care Team, comprised of the Department of Social Services, the Housing Commission, Department of Mental Health, Core Service Agency, Crisis Response and others. The team develops a multi-agency action plan to assist with long term connections to support in addition to immediate assessment and care management provided by the Triage Team.
Patients Served # of Patients Served as of June 30, 2018: 180
Denominator of Eligible Population: 66,823
RP Analytic File Denominator of Eligible Patients: 1,514CY2017 RP Analytic File, 3+ IP or Obs>=24 Visits Medicare FFS
BATP Denominator of Eligible Patients: 651This intervention is for UM BWMC patients only (rather than regional partnership). Using the CRISP PaTH report filters to find UM BWMC eligible patients, our target patients for this intervention are IP/Obs high utilizers 3+ bedded stays in the last 12 months, 2 to 6 chronic conditions, Medicare FFS, 65+ years.
Pre-Post Analysis for Intervention (optional)
Please See Appendix A for cumulative pre-post results. Since 6/1/16 (2 years), The Senior Triage Team has, using a 6-month pre-post report, decreased total charges per patient by (-$12,966), (-$824) per visit, -18.4 decrease in rate of visits per 10 patients, and a change in charges of (-$2.76M).
Intervention-Specific Outcome or Process Measures(optional)
# accepted service 77% (high for this population)# assessed and declined 2% # declined service 18% (excellent)# unable to initially contact 5%
Successes of the UM BWMC and the Senior Triage Team have, together, achieved a decline rate of only
10
HSCRC Transformation Grant – Performance Year 2 (FY 2018) Report Template - FINAL
Intervention in FY 2018Free Response, up to 1 Paragraph
18%, down from 31% in FY17. They attribute the success to the hospital targeting appropriate referrals and obtaining patient consent prior to referring to the service, and the community care managers meeting patients at the bedside to introduce themselves and the program, developing a relationship with the patient and caregiver/family, and discussing patient goals and how the service can assist. Normally, the same care manager who meets the patient in the hospital also sees them in the community.
The Senior Triage Team strengthened community partnerships and streamlined communication regarding outreach and service alignment using their Silver CRICT support structure. After working together and learning personnel and processes, the Senior Triage Team reaches out directly to request support, and the formal meetings are no longer necessary.
Lessons Learned from the Intervention in FY 2018Free Response, up to 1 Paragraph
The 60-day LOS is necessary for most patients in this model, as they are our most complex patients, although the team is cognizant of opportunities to assist and close the cases as soon as patients have reached goals or have the services that they need.
Considering the amount of time to apply for and receive services/supports. it would be helpful to have additional telephonic follow-up after discharge from this program, to monitor long-term utilization of the services/supports.
The process of referring patients to a service and having the service providers update the status of the referrals (accepted service, declined service and why) is a manual process currently. Incorporating referrals (by the hospital) and statusing (by the vendors) into our information systems (Epic) is required to improve operational workflows and key process metrics.
Next Steps for the Intervention in FY 2019Free Response, up to 1 Paragraph
Design and build referral tracking and statusing into Epic, and train staff on new charting and workflow.
Continue to educate other community partners, including home health agencies, assisted living facilities, skilled nursing facilities and primary care providers, about the program, the mission and value, and how the patients who are in or who have graduated from the program are trained and supported to manage many conditions by recognizing early warning signs and contacting their PCP, so as to avoid emergency and hospital services when possible.
Continue to improve behavioral health partnerships within the community and streamline workflows for referrals.
Integrate this service with the UM BWMC new Transitional Nurse Navigator model, which is focused on key chronic condition management, to enhance services to patients.
11

HSCRC Transformation Grant – Performance Year 2 (FY 2018) Report Template - FINAL
Intervention Program – Shared Care AlertsIntervention/Program Name Shared Care Alerts
RP Hospitals Participating in Intervention
Anne Arundel Medical CenterUM Baltimore Washington Medical Center
Brief description of the Intervention2-3 sentences
A Care Alert is special cross-encounter, multidisciplinary note, designed to provide a single location to present the most important, patient-centered information (medical and non-medical) for and by the entire Care Team. Care Teams may include clinicians and social workers both within the hospital and in the community, who have a treatment or working relationship with the patient. Shared Care Alerts are meaningful, actionable notes regarding important care and program support information for vulnerable, high risk patient. Care Alerts are shared in real-time from Epic to and via CRISP and are sent and received to/from over 35 hospitals statewide, regardless of EHR vendor.
Participating Program PartnersPlease list the relevant community-based organizations or provider groups, contractors, and/or public partners
- AAMC and UM BWMC Hospital Emergency Departments - Primary Care Providers who are on Epic or who use CRISP- The Coordinating Center- Anne Arundel County Department of Aging Senior Triage Team- Arundel Lodge Behavioral Health Home- Hospice of the Chesapeake- End Stage Renal Disease Seamless Care Organization (ESCO)- Prince George’s and Queen Anne’s County Mobile Integrated Health Units
Patients Served # of Patients Served as of June 30, 2018:
Active Care Alert Counts: AAMC: 1,097 UM BWMC: 1,205
Denominator of Eligible Population: 550,445
Denominator of Eligible Patients: 3,820From CY2017 RP Analytic File: 3+ IP or Obs>=24 (All Payer)
Pre-Post Analysis for Intervention (optional)
Please see Appendix A for cumulative Care Alert pre/post report summaries, both hospitals.
Intervention-Specific Outcome or Process Measures(optional)
Each hospital has a quality improvement and maintenance processes in place for Care Alerts.
12

HSCRC Transformation Grant – Performance Year 2 (FY 2018) Report Template - FINAL
Successes of the Intervention in FY 2018
New processes were developed to maintain alerts across health systems, which strengthens alerts for shared patients and enhances maintenance of the alerts to keep them current.
Created procedures for collaboration on Care Alert development and maintenance for shared high utilizer patients between the AAMC Readmissions Clinical Analyst and the UMBWMC Care Alert authors.
Implemented continuous data improvement processes regarding feedback on the content of Care Alerts, so that they contain useful, actionable data for multi-disciplinary care teams.
Lessons Learned from the Intervention in FY 2018Free Response, up to 1 Paragraph
There is value in linking Care Alert actionable data with Care Team member outreach information (including secure texting) that can positively impact care and provide an opportunity to avoid utilization, if/as appropriate.
Next Steps for the Intervention in FY 2019
The hospitals will continue to create and maintain relevant, high quality Care Alerts for patients who frequently utilize our hospitals or who are at risk to do so.
The number of active Shared Care Alerts will most likely remain close to current volumes given the current staffing models, retiring alerts that are no longer relevant and adding alerts for additional high utilizers.
Ongoing maintenance of Care Alerts is required to ensure that current information is provided to ED, PCP and other care team members. We are piloting the use of Care Team assignment (in Epic) generating an ENS feed to PROMPT, so that as patients go into or out of hospitals or SNFs, the hospital staff who maintain Care Alerts can apply changes/updates based on reasons for admission and other data.
Exploring bringing Payer Care Managers into the partnership care management workflows, including using the Care Alerts, Care Teams and secure texting. Assisting Payers in evaluating latest capabilities for receipt of ENS alerts a) in the field and b) at PCP offices for quick follow-up with discharged patients.
Work with Fire/EMS teams to examine opportunities to use Care Alerts, Care Teams and secure texting to improve care coordination for ED high utilizers.
13

HSCRC Transformation Grant – Performance Year 2 (FY 2018) Report Template - FINAL
Intervention Program – One Call Care ManagementIntervention/Program Name One Call Care Management
RP Hospitals Participating in Intervention
Anne Arundel Medical CenterUM Baltimore Washington Medical Center
Brief description of the Intervention2-3 sentences
A single phone number for Primary Care Providers and their staff to call to refer patients in need of non-medical assistance. Our One Call Care Managers then call the patient to discuss the reason for the referral, discover other needs and assist patients in obtaining the services they need. Some examples of non-medical assistance include transportation, insurance, behavioral health navigation, housing, community care management assistance, hospice or palliative care, dental needs, provider referrals, DME, caregiver support/respite care, support groups. This service fills an important need for patients who may not need a full community care management service but who benefit from la carte services. It also ‘coordinates the coordinators’ (aligns Care Management resources to avoid duplication of services).
Participating Program Partners
Our One Call Care Management services refer to: Anne Arundel County Department of Health (Healthy Start, REACH, Dental Program), house call providers, Hospice of the Chesapeake, Palliative Care, Mobile Integrated Care Unit (MICH), Food Bank, Partners in Care, The Coordinating Center, Behavioral Health Navigators, Pharmacists, Johns Hopkins Home Care, Chronic Condition support programs, etc.
Patients Served # of Patients Served as of June 30, 2018: 1,298AAMC: 1,031 (1.5 FTE’s) UM BWMC: 318 (1.0 FTE)
Denominator of Eligible Population: 550,445CY2017 RP Analytic File: All Payer Population
Denominator of Eligible Patients: 179,772CY2017 RP Analytic File: All Payer Eligible Patients
Pre-Post Analysis for Intervention (optional)
Please see Appendix A for cumulative pre/post (since start of services). One Call Care Management serves about 2/3 of rising risk patients, 1/3 patients with some utilization. Since the referrals come from PCP visits rather than hospital utilization, using pre/post that utilizes start dates (and looks before and after that date) is not necessarily useful until 3 to 6 months after PCP visit.
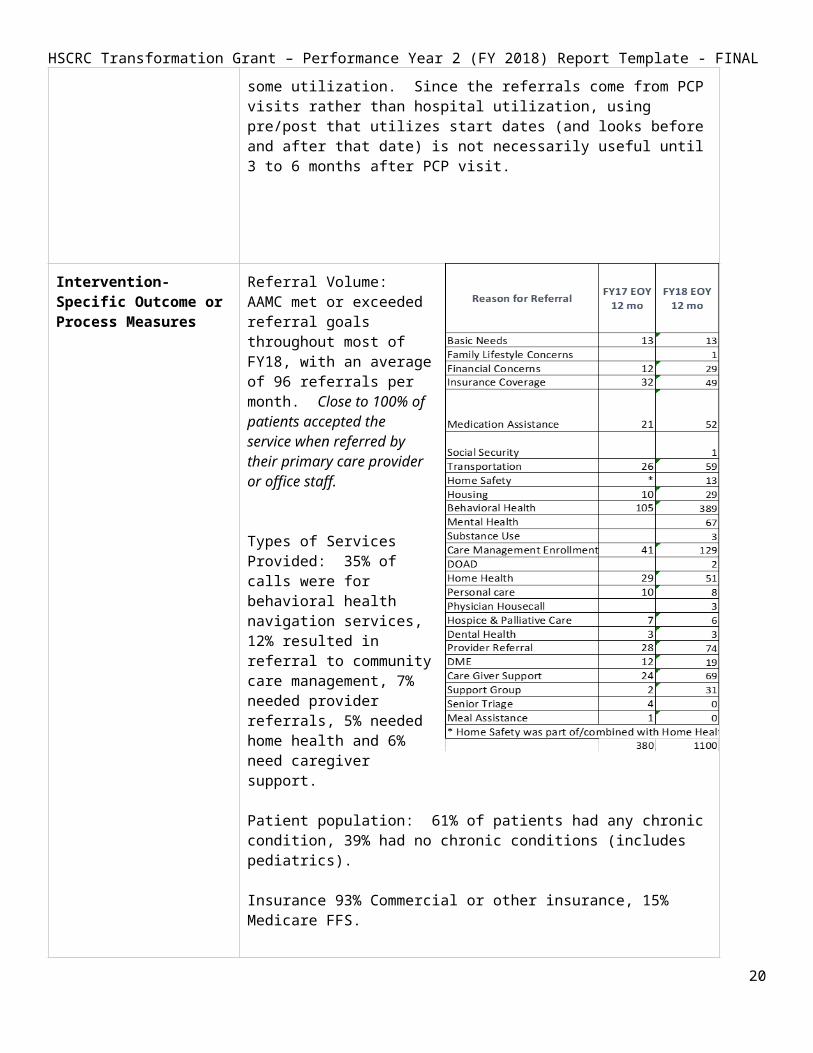
Intervention-Specific Outcome or Process Measures
Referral Volume: AAMC met or exceeded referral goals throughout most of FY18, with
14
HSCRC Transformation Grant – Performance Year 2 (FY 2018) Report Template - FINAL
an average of 96 referrals per month. Close to 100% of patients accepted the service when referred by their primary care provider or office staff.
Types of Services Provided: 35% of calls were for behavioral health navigation services, 12% resulted in referral to community care management, 7% needed provider referrals, 5% needed home health and 6% need caregiver support.
Patient population: 61% of patients had any chronic condition, 39% had no chronic conditions (includes pediatrics).
Insurance 93% Commercial or other insurance, 15% Medicare FFS.
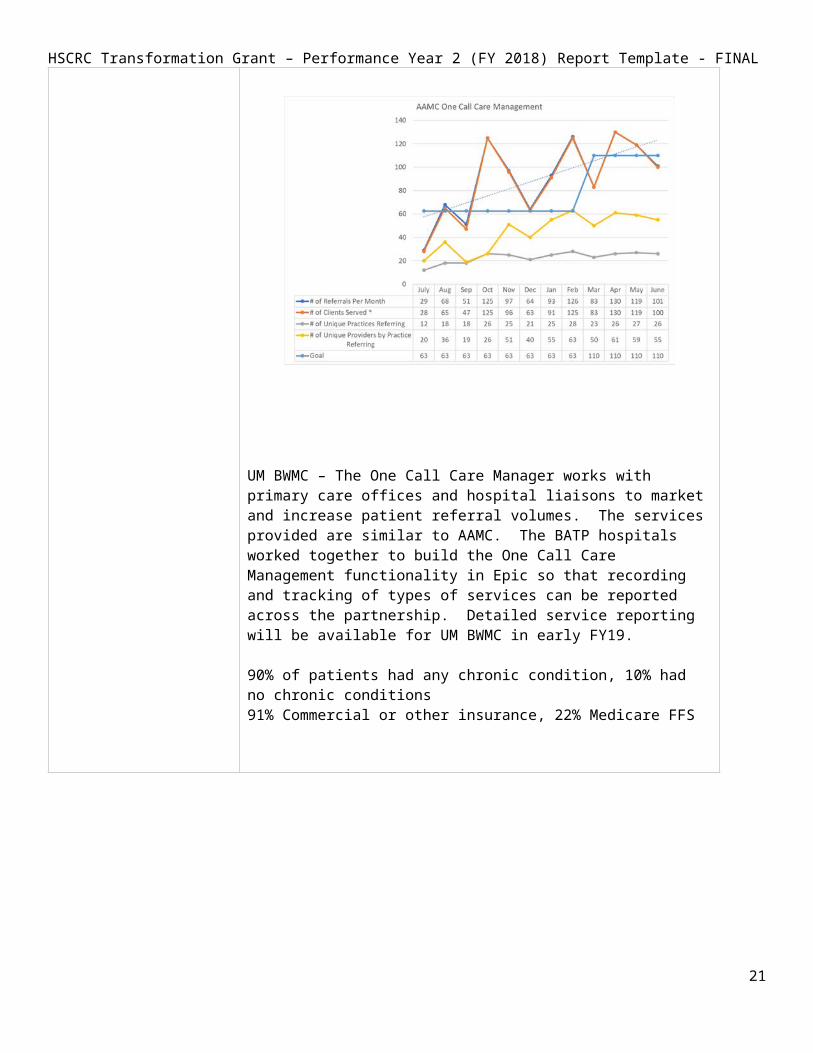
UM BWMC – The One Call Care Manager works with primary care offices and hospital liaisons to market and increase patient referral volumes. The services provided are similar to AAMC. The BATP hospitals worked together to build the One Call Care Management functionality in Epic so that recording and tracking of types of services can be reported across the partnership. Detailed service reporting will be available for UM BWMC in early FY19.
90% of patients had any chronic condition, 10% had no chronic conditions91% Commercial or other insurance, 22% Medicare FFS
15

HSCRC Transformation Grant – Performance Year 2 (FY 2018) Report Template - FINAL
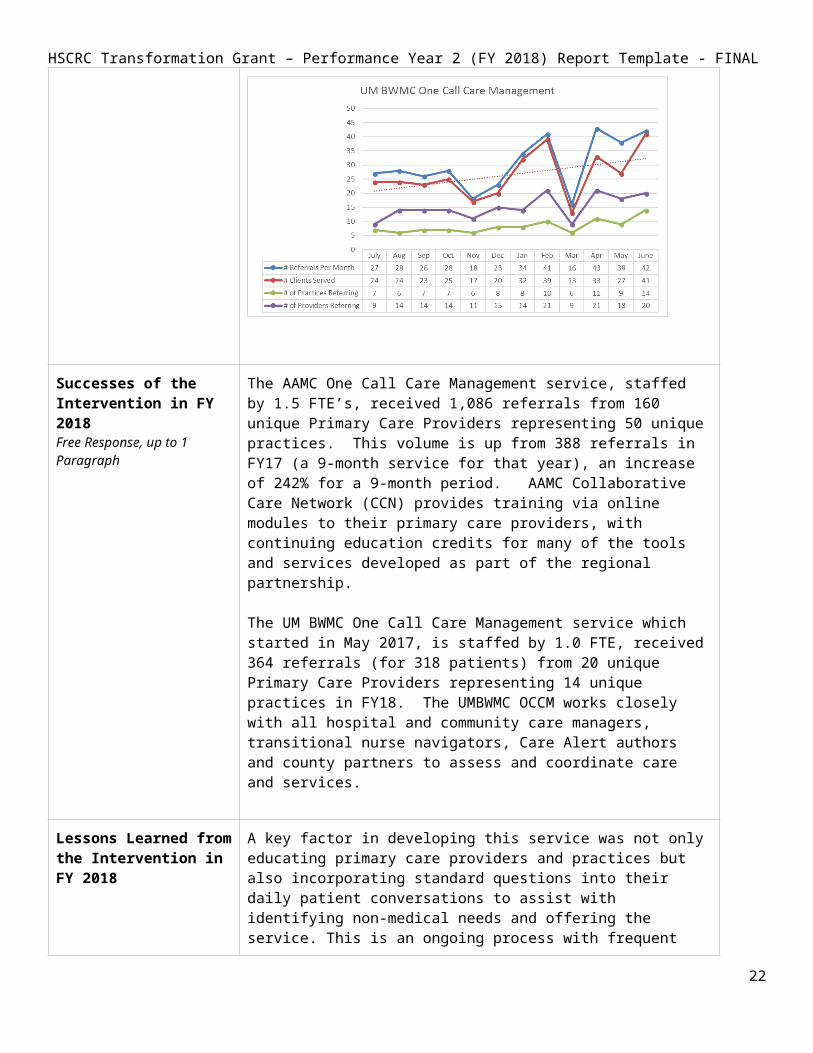
Successes of the Intervention in FY 2018Free Response, up to 1 Paragraph
The AAMC One Call Care Management service, staffed by 1.5 FTE’s, received 1,086 referrals from 160 unique Primary Care Providers representing 50 unique practices. This volume is up from 388 referrals in FY17 (a 9-month service for that year), an increase of 242% for a 9-month period. AAMC Collaborative Care Network (CCN) provides training via online modules to their primary care providers, with continuing education credits for many of the tools and services developed as part of the regional partnership.
The UM BWMC One Call Care Management service which started in May 2017, is staffed by 1.0 FTE, received 364 referrals (for 318 patients) from 20 unique Primary Care Providers representing 14 unique practices in FY18. The UMBWMC OCCM works closely with all hospital and community care managers, transitional nurse navigators, Care Alert authors and county partners to assess and coordinate care and services.
Lessons Learned from the Intervention in FY 2018
A key factor in developing this service was not only educating primary care providers and practices but also incorporating standard questions into their daily patient conversations to assist with identifying non-medical needs and offering the service. This is an ongoing process with frequent reminders and office visits needed. Providers are not accustomed to being able to call a single number for any non-medical need. Once they adopt the behavior, they use the service consistently.
Having hospital and community care managers using the same charting practices (Care Team, Care Alerts, Care Plans) in Epic enables collaboration and assists in avoiding duplication of services. One Call Care Management was designed to ‘coordinate the coordinators’ and is a key factor in avoiding duplication of effort and notifying current care managers if their patients need additional attention.
The One Call Care Management Service has proven engagement rates, provides a la carte services for patients who do not need full community care
16

HSCRC Transformation Grant – Performance Year 2 (FY 2018) Report Template - FINAL
management, and refers to our other regional partnership services as needed.
We need to capture gaps in current services and services that are not available as discrete data, so that we have data to assist in prioritizing patient needs and backing our requests for expanded or new services.
Next Steps for the Intervention in FY 2019
Continually educate PCP’s and staff on the ease of access and benefits of the service.
Configure Epic to capture missing services and gaps in existing services, so that we can quantify and advocate for new or improved services based on patient need.
Intervention Program – Patient Panel Coordinators (AAMC)Intervention/Program Name Patient Panel Coordinators (AAMC)
RP Hospitals Participating in Intervention
Anne Arundel Medical Center
Brief description of the Intervention2-3 sentences
Patient Panel Coordinators (3.5 FTE’s) assisted 12 primary care offices and with 8,861 patients and over 13,000 interventions by using dashboards to identify gaps in care or opportunities to control key health maintenance factors, including Diabetes (A1C and retinopathy screening), mammography screening and influenza vaccines.
Participating Program Partners This service supports primary care providers who belong to the AAMC Collaborative Care Network. The patient panel coordinators also have an opportunity, when speaking with patients, to identify non-medical needs and can refer them to the One Call Care Management service.
Patients Served # of Patients Served as of June 30, 2018: 8,861
Denominator of Eligible Population: 550,445 All Payer Population from CY2017 RP Analytic File
Denominator of Eligible Patients: 179,772 All Payer Patients from CY2017 RP Analytic File
Since this is an AAMC only intervention, the RP Analytic File denominators overstate the population by a significant amount.
BATP denominator of Eligible Patients: 80,000Those attributable to the CCN offices served by the Patient Panel
17

HSCRC Transformation Grant – Performance Year 2 (FY 2018) Report Template - FINAL
Coordinators.
Pre-Post Analysis for Intervention Not applicable
Intervention-Specific Outcome or Process Measures
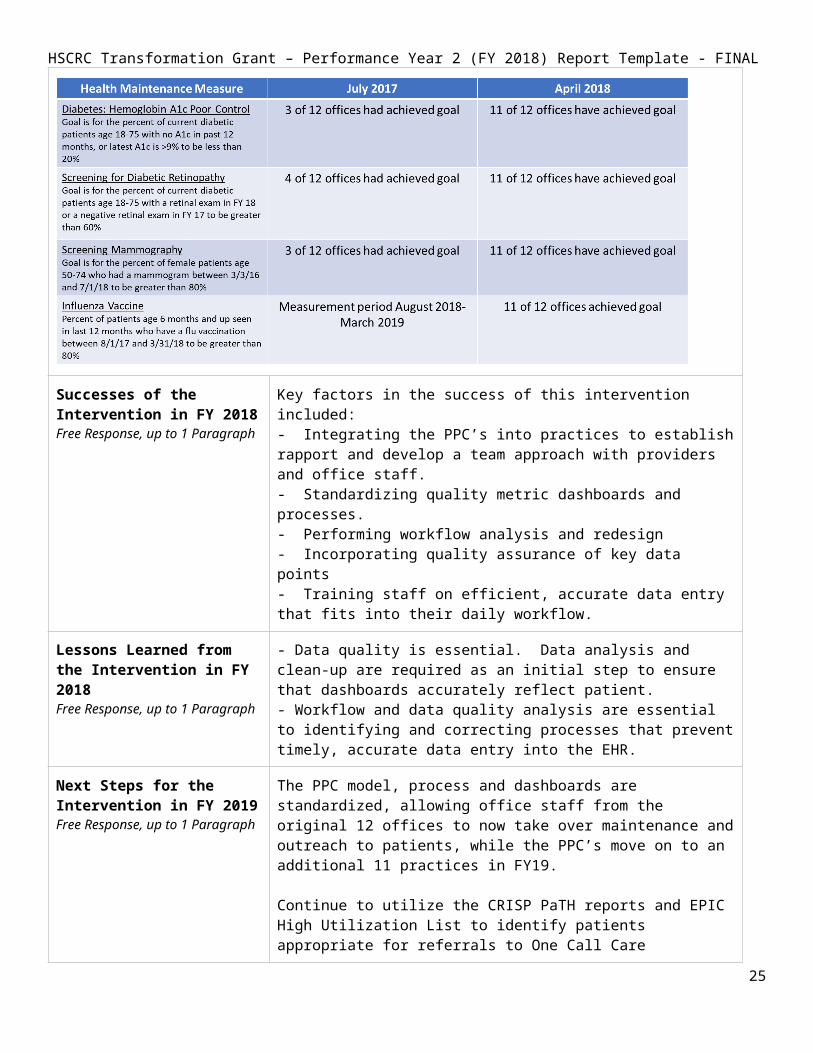
Successes of the Intervention in FY 2018Free Response, up to 1 Paragraph
Key factors in the success of this intervention included: - Integrating the PPC’s into practices to establish rapport and develop a team approach with providers and office staff. - Standardizing quality metric dashboards and processes.- Performing workflow analysis and redesign- Incorporating quality assurance of key data points- Training staff on efficient, accurate data entry that fits into their daily workflow.
Lessons Learned from the Intervention in FY 2018Free Response, up to 1 Paragraph
- Data quality is essential. Data analysis and clean-up are required as an initial step to ensure that dashboards accurately reflect patient. - Workflow and data quality analysis are essential to identifying and correcting processes that prevent timely, accurate data entry into the EHR.
Next Steps for the Intervention in FY 2019Free Response, up to 1 Paragraph
The PPC model, process and dashboards are standardized, allowing office staff from the original 12 offices to now take over maintenance and outreach to patients, while the PPC’s move on to an additional 11 practices in FY19.
Continue to utilize the CRISP PaTH reports and EPIC High Utilization List to identify patients appropriate for referrals to One Call Care Management, Behavioral Health Navigators and community care management services.
Work with the Pulmonary Disease Navigation team to enroll COPD patients in outpatient education to prevent avoidable admissions.
18

HSCRC Transformation Grant – Performance Year 2 (FY 2018) Report Template - FINAL
Intervention Program – Integrated Behavioral Health in Primary Care
Intervention/Program Name
Integrated Behavioral Health in Primary Care
RP Hospitals Participating in Intervention
Anne Arundel Medical CenterUM Baltimore Washington Medical Center
Brief description of the Intervention2-3 sentences
UMBWMC (through UM CMG) has 2 psychotherapists, a psychiatrist and an administrative assistant who provide services to patients from six (6) primary care clinics.
AAMC has built a model for incorporating a 1.0 FTE LCSW into the primary care setting.
Both models receive referrals from primary care providers and provide therapeutic counseling (and med management in the case of UMBWMC).
Participating Program Partners
Our behavioral health resources keep up-to-date lists of community resources and refer to them as part of their services. Resources include everything from additional mental health counseling and psychiatry for med consults, housing, substance abuse support, family support, etc.
Patients Served # of Patients Served as of June 30, 2018: 789
AAMC: 180 (1.0 FTE) UM BWMC: 609 (4.0 FTE’s)
Denominator of Eligible Patients: 550,445CY2017 RP Analytic File All Payer population
The majority of the patients who receive behavioral health therapeutic services within the primary care setting from these programs do not have notable prior utilization of emergency or inpatient services.
Pre-Post Analysis for Intervention (optional)
The patients being referred to this service have little or no prior hospital utilization (rising risk), therefore pre/post is not a meaningful tool.
CRISP is developing a way to track high utilizer pool movement over time (how many patients are moving into and out of the HU pool). If we can compare our panels for rising risk patients to the ever-changing set of high utilizers, we will be able to track whether those who received interventions avoided becoming high utilizers.
Intervention-Specific Outcome or Process Measures(optional)
The AAMC Centreville Clinic, with 1.0 FTE embedded social worker, tracks behavioral health visits per month and unique patients per month. During the last 6 months of FY18 the number of visits increased an average of 51% over the same period in FY17.
19

HSCRC Transformation Grant – Performance Year 2 (FY 2018) Report Template - FINAL
Centreville Family Medicine BH Visits FY17 Visits: 271 Annual Goal: 300 unique patients Unique Patients: 101 FY18 Visits: 1,082 Unique Patients: 226
The UM CMG Behavioral Health staff also track number of encounters and unique patients per month. This fiscal year they reported:
FY18 Visits: 3,348 Unique Patients: 609 No-show rate: 10% (very low)
Successes of the Intervention in FY 2018Free Response, up to 1 Paragraph
AAMC Built a successful, sustainable model for incorporating an LCSW into a primary care setting, with the cost of the service being covered by accounts receivables within 6-8 months. The cost of the service has been absorbed by the clinic, which has enabled an additional LCSW to be hired and expansion of the program to additional clinic(s) in FY19.
Improved access to care on the Eastern Shore for Mental Health and Substance Use.
Established comprehensive treatment plans containing integrated behavioral health and medical components.
UM BWMCPatients and PCPs continue to report satisfaction with the quality and impact of care by both the psychotherapists and psychiatrist.
A low 10% no-show rate
Lessons Learned from the Intervention in FY 2018Free Response, up to 1 Paragraph
Integrated behavioral health in primary care intervention is a valued service by both PCP’s and patients alike, as indicated by the use of the service by providers, and patient satisfaction surveys, which are highly positive. The patient population tends to be patients with no or little prior utilization, making outcome measurement difficult. We are looking forward to the tool CRISP is developing to track the pool of high utilizers over time, so that we can compare patients who have received services, to determine whether we are keeping them from becoming high utilizers.
Next Steps for the Intervention in FY 2019
AAMC- Expand the LCSW in Primary Care pilot to an additional clinic(s).- Implement Primary Care Provider-to-Psychiatrist med consults with behavioral
health prescriber (pilot). - Document reduction of re-admission to ED
- Starting in May 2018, we began administering PHQ-9 and GAD-7 upon admission, again at the 4th visit, and at discharge. We track the results and monitor progress.
20
HSCRC Transformation Grant – Performance Year 2 (FY 2018) Report Template - FINAL
UM BWMC - Continue serving six (6) clinics with the psychotherapists and psychiatrist, with
full schedules.- Discussion has begun to evaluate the sustainability of the integrated behavioral
health model in primary care and reallocate BATP resources to BH Peer Counselors for patients with High Risk Care Plans. Implementation projected for FY20 using FY19 to assess feasibility.
- Examine ED High Utilizer population and integration of behavioral health support models.
- Measure patient satisfaction
Intervention Program – Behavioral Health Navigators (AAMC) Intervention/Program Name Behavioral Health Navigators (Emergency Department)
Behavioral Health Navigator (Community)
RP Hospitals Participating in Intervention
Anne Arundel Medical Center
Brief description of the Intervention
The Community Behavioral Health Navigator receives referrals from PCP’s whose patients have requested or agreed to have a navigator assist them in finding behavioral health services in the community. About 35% of all calls to the One Call Care Management service are for behavioral health assistance.
The ED Behavioral Health Navigator receives referrals from both ED and Inpatient providers.
The behavioral health navigators establish relationships, workflows and referral processes with community partners. They create training material for PCPs, including patient-facing brochures with insurance and referral sources. Their primary role is to speak with patients, evaluate their need and align them with services that match their insurance, timeline, therapy and medication needs.
Participating Program Partners 14 behavioral health counseling and psychiatry centers throughout the BATP service areas.
Patients Served # of Patients Served as of June 30, 2018: 669
Community BHN: 638 referrals with 351 patients served
ED/Inpatient BHN: 607 referrals with 318 patients served
Denominator of Eligible Population: 550,445 CY2017 RP Analytic File, All Payer.
21
HSCRC Transformation Grant – Performance Year 2 (FY 2018) Report Template - FINAL
The RP Analytic File over states the eligible patients here because it includes all zip codes for both AAMC and UMBWMC, and this is an AAMC intervention only.
BATP Denominator For ED BH Navigator: 79,262 CRISP Patient Total Hospitalizations (PaTH) report, filtering on AAMC, All patients, All payer in FY18.
For Community BH Navigator: 179,000 (approximate)Since referrals to the Community BH Navigator come from Collaborative Care Network (AAMC’s integrated care network) PCP offices, the denominator for this population is all patients who see providers who are part of the CCN.
Pre-Post Analysis for Intervention (optional)
Since patients are referred to the Community Behavioral Health Navigator from primary care, the referrals are not related to hospital utilization, and most do not have notable previous utilization. Therefore, pre/post is not an effective tool for measuring efficacy for the Community BH Navigator. Instead, we track # of referrals and provide 30, 60 and 90-day follow-up calls.
Intervention-Specific Outcome or Process Measures
ED/Inpatient Behavioral Health Navigator Metrics FY18
The Community Behavioral Health Navigator assisted 318 patients in FY18, with an average of 65 referrals per month.
Successes of the Intervention in FY 2018Free Response, up to 1 Paragraph
Redesigned the hospital referral process and charting, to ensure appropriate patients were referred and that they had agreed to the service. This change allowed the BH Navigator to spend time with the patients who need and want assistance.
Developed and maintain a behavioral health community resource brochure for providers and patients, with explanations of what a counselor provides and what a psychiatrist provides. The brochure is also a quick-reference, by insurance type (Medicare, Medicaid and Private) with phone numbers and locations. PCPs can use the brochure and patients can reach-out directly to the services, or the BH navigators can assist.
Created training videos explaining both community and ED navigator services, for use in Collaborative Care Network continuing education modules.
22
HSCRC Transformation Grant – Performance Year 2 (FY 2018) Report Template - FINAL
Lessons Learned from the Intervention in FY 2018Free Response, up to 1 Paragraph
One of the most important improvements to the ED/Inpatient Behavioral Health Navigator service in FY18 was to adjust the referral process, adjust the Epic configuration, and reeducate referring clinicians on the process for evaluating patient need, obtaining approval and referring to the service. These changes resulted in more relevant referrals, higher efficiency and better communication between referral source and the service.
The service reaches primarily commercial payer patients, with 65% of them between the ages of 18 and 64. 11% are 65 years or older, 24% (143) were pediatric referrals.
Next Steps for the Intervention in FY 2019Free Response, up to 1 Paragraph
Provide additional education to outpatient providers about outpatient mental health and substance use treatment in the community and mental health assessments in the ED.
Collaborate with AAMG Outpatient Mental Health Clinic and Eastern Shore Psychological Services.
Intervention Program – Skilled Nursing Facility CollaborativeIntervention/Program Name Skilled Nursing Facility Collaborative
RP Hospitals Participating in Intervention
Anne Arundel Medical CenterUM Baltimore Washington Medical Center
Brief description of the Intervention2-3 sentences
The SNF Collaborative, facilitated by the AAMC Post-Acute Care Manager and UMBWMC Transitional Nurse Navigator SNFs, brings all SNF partners, including corporate, medical directors, administrators and directors of nursing and CRISP together for quarterly on-site meetings at the hospitals, to discuss workflow, communication, challenges and opportunities to improve care and reduce avoidable utilization.
23

HSCRC Transformation Grant – Performance Year 2 (FY 2018) Report Template - FINAL
Participating Program Partners
Participants include corporate and facility administrators, directors of nursing, medical directors and hospital liaisons from:
Communicare (Corporate, Marley Neck, South River)Crofton Care & Rehabilitation Fairfield Nursing CenterFutureCare (Corporate, Chesapeake, Irvington)Genesis (Corporate, Corsica Hills, Severna Park, Spa Creek, Waugh Chapel)SAVA (Corporate, Heritage Harbour, North Arundel)Adfinitas Hospice of the ChesapeakeCRISPOptumGinger CoveSignature Health
Additional attendees include:Anne Arundel County Dept of Aging & DisabilitiesThe Coordinating CenterLifespan
Patients Served # of Patients Served as of June 30, 2018:
This intervention is population-based, with AAMC and UM BWMC having discharged approximately 7,360 patients to any SNFs in FY18. We do not measure outcomes on a more granular level but look at reducing PAU for the entire SNF population and use per SNF metrics as well. All SNF patients will benefit from the progress we make in process improvements around care coordination, education and setting expectations, ultimately looking to reduce PAU and improve patient experience.
Denominator of Eligible Patients: 66,961CY2017 RP Analytic File, All Medicare FFS patients
Pre-Post Analysis for Intervention (optional)
Currently not applicable. The scope of work for the collaborative is to improve processes, care coordination, communication between hospitals, Skilled Nursing Facilities, community care management and other community partners, patients and families. If we pilot a specific intervention we may measure it with pre-post.
Intervention-Specific Outcome or Process Measures
SNF Risk-Adjusted Readmissions, LOS and Charges Report (using HEDIS risk measures), available from CRISP MADE CCLF tool.
The reports include:# of patients discharged to each SNFFY16 baseline and FY17 quarterly risk-adjusted 30-day readmissions, Average SNF payment and average length of stay.Star ratings
Successes of the Intervention Hosted quarterly in-person meetings with consistent attendance and
24

HSCRC Transformation Grant – Performance Year 2 (FY 2018) Report Template - FINAL
in FY 2018Free Response, up to 1 Paragraph
participation from 14 SNFs as noted above as Participating Partners.We identified numerous issues between and within the hospital and the skilled nursing facilities that contribute to PAU and are developing workgroups to address as described below in next steps.
Our post-acute and project management resources provided input to CRISP and hMetrix development of risk-adjusted (HEDIS) average SNF readmissions, LOS, and payments. FY16 baseline and FY17 quarterly reports were delivered in 4QFY18. This new capability gives us an apples-to-apples comparison for the first time, which we have shared with each SNF Collaborative participant to help them understand how their performance compares to their peers. With this data we can focus on learning from those with lower relative LOS’s and readmissions. CRISP has also provided these reports on their Medicare CCLF reports under the ‘monitoring’ tab.
Lessons Learned from the Intervention in FY 2018
The initial quarterly meetings focused on identifying educational opportunities (hospital to SNF and SNF to hospital), inviting guest speakers, providing updates on care management and other BATP initiatives. We learned over the past year through break-out sessions and around-the-room discussions that it is most productive to work together on problem identification and prioritization for work that should reduce PAU and increase patient and family education and satisfaction.
Data analytics is key to:a) understanding and comparing SNF performance and learning together from that performance.
b) tracking real-time SNF readmissions to analyze and act on educational opportunities.
We can now do the former, thanks to CRISP and hMetrix. We are awaiting the new PROMPT tool (data and filtering) to be able to do the latter in 2QFY19.
Initially, we spent time on educating SNFs on definitions and calculations for readmissions and LOS, and asked them to provide monthly information to our post-acute contacts at the hospitals. This approach did not work as the calculations were not consistent and it was difficult with the SNF limited resources. Even if they had reported, it would not have been risk-adjusted across SNFs. CRISP, who participates in the SNF Collaborative, developed reports with hMetrix to solve this vitally important problem.
Next Steps for the Intervention in FY 2019
Pilot projects in FY19 to address priorities identified in FY18:
a) Setting and managing patient and family expectations regarding the type and level of care they receive in the hospital versus the appropriate type and level of care they will receive in the SNF, and why that is appropriate as they move from one setting to the other.
b) Improving data and communication during and after transitions of care.
25
HSCRC Transformation Grant – Performance Year 2 (FY 2018) Report Template - FINAL
c) Standardizing our vocabulary and communication with patients and families (deliver the same message regardless of care setting).
d) Identifying the right level of care for the patients and operationalizing those findings.
e) Improve hospital discrete charting of SNF location on admission and discharge. Once this data is accurate and reliable within the ADT messages, we can pilot using ENS PROMPT to see, by SNF, which patients were readmitted to any hospital and why, in real-time, so that our post-acute resources at the hospitals can quickly identify opportunities to reduce PAU and examine process improvement opportunities.
f) Primary Care Offices and Community Care Managers need a streamlined way to track SNF patient movement (hospital and SNF discharges). Our BATP Project Manager and Post-Acute Care leads have worked with CRISP over the past year to provide use cases and PROMPT data/tool analysis to represent this need. CRISP is in development to identify SNF ADT messages and applying LTC/SNF designation to them, which allows us to explicitly filter on SNF messages in our ENS feeds. We plan to evaluate the new ENS PROMPT tool and data in 2QFY19.
Intervention Program – Joint Patient and Family Advisory Council Intervention/Program Name Joint Patient and Family Advisory Council
RP Hospitals Participating in Intervention
Anne Arundel Medical CenterUM Baltimore Washington Medical Center
Brief description of the Intervention A council of patient and family advisors from both hospitals, formed as part of the original planning grant, to whom the hospitals and community partners take their toughest problems regarding how to improve the explanation and acceptance of BATP programs for patients and families.
Participating Program PartnersPlease list the relevant community-based organizations or provider groups, contractors, and/or public partners
AAMC Patient and Family Advisors and PFAC LeadUM BWMC Patient and Family Advisors and PFAC Lead
Patients Served # of Patients Served as of June 30, 2018:
The Joint PFAC ‘enhancements’ to our interventions are not counted separately from the individual intervention results. The benefits of this advisory group reach all patients our interventions touch.
Denominator of Eligible Patients: 550,445CY2017 RP Analytic File, All Payer Population for BATP
26

HSCRC Transformation Grant – Performance Year 2 (FY 2018) Report Template - FINAL
Pre-Post Analysis for Intervention (optional)
Not applicable
Intervention-Specific Outcome or Process Measures(optional)
The Joint Patient and Family Advisory Council feedback influences and improves the delivery and acceptance by patients and families of BATP interventions. Therefore, their work directly impacts the outcome and process measures for each intervention.
Successes of the Intervention in FY 2018Free Response, up to 1 Paragraph
The Joint PFAC Advisory Council evaluated BATP programs, approaches, marketing material, scripts for bedside and care management engagement, and suggested changes to streamline and simplify the message to engage patients and families.
Lessons Learned from the Intervention in FY 2018Free Response, up to 1 Paragraph
Patients who will not permit community care management to go to their homes are often doing so because: a) concern for privacy, b) they are worried that they will be asked to move, c) their home is their only controlled, safe environment from their medical and non-medical challenges, d) they are homeless, e) embarrassed by home environment or family, f) do not believe that the service(s) will help them, g) believe that going to the ED is the right thing to do and normal for their condition h) have PCPs and/or home health who direct them to go to the ED.
Simplification of wording is key to engagement. The hospitals should not review numerous programs as it is confusing to the patient and families. Focus on the patient goals and problem(s) that need to be solved, and how hospital services will help, who will be in touch and when, and make sure that the caregiver is included in the conversation and plans as appropriate.
Next Steps for the Intervention in FY 2019Free Response, up to 1 Paragraph
Reconvene with new PFAC leadership from both hospitals and plan FY19 activities.
27
HSCRC Transformation Grant – Performance Year 2 (FY 2018) Report Template - FINAL
Intervention Program – Collaborative Care Network (AAMC) Intervention/Program Name Collaborative Care Network (CCN)
RP Hospitals Participating in Intervention
Anne Arundel Medical Center
Brief description of the Intervention The Collaborative Care Network is Anne Arundel Medical Center’s integrated care network. As part of the broader scope of a fully integrated care network, the CCN is responsible for planning and implementing the BATP tools and service offerings throughout the network of Primary Care Providers and Specialists, which link them with our community services.
Participating Program PartnersPlease list the relevant community-based organizations or provider groups, contractors, and/or public partners
The CCN works with primary care and specialist offices. In FY18 CCN membership included 89 practices, 729 providers with 103,000 attributed patients.
Patients ServedPlease estimate using the Population category that best applies to the Intervention, from the CY 2017 RP Analytic Files. HSCRC acknowledges that the High Utilizer/Rising Risk or Payer designations may over-state the population, or may not entirely represent this intervention’s targeted population.Feel free to also include your partnership’s denominator.
# of Patients Served as of June 30, 2018: 16,101(2,512 unique patients touched by any AAMC intervention + 13,589 patients assisted by Patient Panel Coordinators)
Since the CCN is responsible for implementing all BATP programs and services, the number of patients served would be ‘all patients’ served by any intervention (regardless of whether the patients had PCPs in the CCN). This numerator represents all patients who received any BATP service for AAMC in FY18.
Denominator of Eligible Patients: 550,445CY2017 RP Analytic File, All Payer Population (over-states the population as RP file is combined hospital zip codes and the CCN is an AAMC only).
BATP (AAMC) Denominator of Eligible Patients: 103,000
This is an AAMC intervention only. This denominator represents the approximate number of patients who are served by providers who are part of the Collaborative Care Network.
Pre-Post Analysis for Intervention (optional)
Not Applicable
Intervention-Specific Outcome or Process Measures(optional)
The CCN work has a direct impact on the number of our patients who have and who are actively engaged with their PCPs through community care management outreach, One Call Care Management outreach, behavioral health navigator and LCSW in primary care outreach and other services.
28
HSCRC Transformation Grant – Performance Year 2 (FY 2018) Report Template - FINAL
The CCN was responsible for the service planning, communication, training and management of Shared Care Alerts content, Patient Panel Coordinator program, Secure Texting for PCP’s. The outcome and process metrics for those services is a direct result of leadership and management of the content and integration of the BATP tools and services by the CCN into the practices. Please see separate interventions for key measures.
Successes of the Intervention in FY 2018Free Response, up to 1 Paragraph
- Developed CE-based training modules and material for PCP’s about BATP services (One Call Care Management, Shared Care Alerts, Shared Care Plans, Secure Texting, Behavioral Health Navigators)
- Developed and implemented six (6) Integrated Care Pathways: New Type 2 Diabetic, Colorectal Cancer Screening, Behavioral Health, Smoking Cessation, Acute Urinary Retention, and Peri-procedural Management of Antithrombotic Agents.
- Achieved 93% quality score in ACO and 100% on MIPS. - Connected 72% of practices on CRISP Tier 3. - Developed dashboard to track performance. - Prepared PCPs for success in the Maryland Primary Care
Program. - Developed and launched Integrated Care Pathway website. - Established population health management competencies at
practice level with Patient Panel Managers. - Met all quality goals through collaboration of Patient Panel
Managers and practices. - Doubled number of practices referring to One Call Care
Management. - Engaged 88% of members in practice transformation. - Launched All Member meetings.- Hosted 3 practice transformation learning collaborative events. - Circulated monthly newsletters and created the CCN website.
Lessons Learned from the Intervention in FY 2018Free Response, up to 1 Paragraph
Involve end-user representatives and BATP intervention/service providers while developing training material.
Regularly update training documentation and communication based on lessons learned from the BATP service providers.
Include both in-scope and out-of-scope information when developing a service offering, to help manage provider and patient expectations.
It is important to include specialists in the delivery of coordinated, collaborative care. Communication between all specialties is necessary to coordinate care and improve patient outcomes.
Next Steps for the Intervention in FY 2019Free Response, up to 1 Paragraph
The CCN is leading the MD Primary Care Program (MD PCP) initiative as a Care Transformation Organization (CTO) through which the
29

HSCRC Transformation Grant – Performance Year 2 (FY 2018) Report Template - FINAL
BATP services (and expansion/additions) will be implemented for Medicare FFS patients.
New use cases for cross-organizational communication (such as Psychiatrist consults for PCPs and others) are developed and tested through the CCN partnerships. This will continue as our providers and community partners identify additional areas of opportunity.
30

HSCRC Transformation Grant – Performance Year 2 (FY 2018) Report Template - FINAL
Core MeasuresPlease fill in this information with the latest available data from the in the CRS Portal Tools for Regional Partnerships. For each measure, specific data sources are suggested for your use– the Executive Dashboard for Regional Partnerships, or the CY 2017 RP Analytic File (please specify which source you are using for each of the outcome measures).
Utilization MeasuresMeasure in RFP(Table 1, Appendix A of the RFP)
Measure for FY 2018 Reporting Outcomes(s)
Total Hospital Cost per capita
Partnership IP Charges per capita
Analytic File:‘Charges’ over ‘Population’(Column E / Column C)
All Payer Total Charges / BATP Population1,479,211,949.89 / 550,445
$ 2,687.30
Total Hospital Discharges per capita
Total Discharges per 1,000
Analytic File:‘IPObs24Visits’ over ‘Population’(Column G / Column C)
110
Total Health Care Cost per person
Partnership TCOC per capita – Medicare
Total Cost of Care (Medicare CCW) Report ‘Regional Partnership Cost of Care’:‘Tab 4. PBPY Costs by Service Type’ – sorted for CY 2017 and Total
$ 2,592
ED Visits per capita
Ambulatory ED Visits per 1,000
Analytic File‘ED Visits’ over ‘Population’(Column H / Column C)
All Payer (ED Visits / Population) * 1000(183,571 / 550,445) * 1000
333
31

HSCRC Transformation Grant – Performance Year 2 (FY 2018) Report Template - FINALQuality Indicator Measures
Measure in RFP(Table 1 in Appendix A of the RFP)
Measure for FY 2018 Reporting Outcomes(s)
Readmissions Unadjusted Readmission rate by Hospital (please be sure to filter to include all hospitals in your RP)
Executive Dashboard:‘[Partnership] Quality Indicators’ – Unadjusted Readmission Rate by Hospital, reported as average 12 months of FY 2018
-or-
Analytic File:‘IP Readmit’ over ‘EligibleforReadmit’(Column J / Column I)
3+ IP or Obs>24 Visits Medicare FFS1463/4527 = 32.31%
Medicare FFS 2064/14434 = 14.3%
All Payer 5229/44859 = 11.65%
PAU Potentially Avoidable UtilizationExecutive Dashboard:‘[Partnership] Quality Indicators’ – Potentially Avoidable Utilization, reported as sum of 12 months of FY 2018-or-Analytic File:‘TotalPAUCharges’(Column K)
3+ IP or Obs Visits Medicare FFS $ 36,352,178.29
Medicare FFS $ 66,620,906.94
All Payer $ 155,866,327.30
CRISP Key Indicators (Optional) These process measures tracked by the CRISP Key Indicators are new, and HSCRC anticipates that these data will become more meaningful in future years.
32
HSCRC Transformation Grant – Performance Year 2 (FY 2018) Report Template - FINAL
Measure in RFP(Table 1 in Appendix A of the RFP)
Measure for FY 2018 Reporting Outcomes(s)
Established Longitudinal Care Plan
% of patients with Care Plan recorded at CRISP
Executive Dashboard:‘High Needs Patients – CRISP Key Indicators’ –% of patients with Care Plan recorded at CRISP, reported as average monthly % for most recent six months of data
May also include Rising Needs Patients, if applicable in Partnership.
BATP community care managers write patient goal(s) (Care Plans) for each patient they provide services to. In FY18 that equates to 1,401 patients.
BATP Care Plans (patient goals) are sent to CRISP via CCDs for patients who have community care managers. However, the work for CRISP to recognize and count the Care Plans in the Executive Dashboard under Key Indicators is pending.
Portion of Target Population with Contact from Assigned Care Manager
% of patients with Contact from Assigned Care Manager
Executive Dashboard:‘High Needs Patients – CRISP Key Indicators’ –% of patients with Case Manager (CM) recorded at CRISP, reported as average monthly % for most recent six months of data
May also include Rising Needs Patients, if applicable in Partnership.
CRISP shows 27.8%, but that is not correct, as the integration work to recognize and count Care Managers and Care Plans (patient goals) from Epic to CRISP is pending.
We know from our intervention process measures and charting practices, that all patients who had at least an initial care management visit, total 1,221 for the hospitals in FY18.
Self-Reported Process Measures Shared Care Plans are being created for all patients with a community care manager. Shared Care Plans are recorded as ‘patient goals’ under the longitudinal plan of care in the hospital Epic systems. The plans are shared in two ways; the hospital and community care managers chart in the same Epic system, and the plans are also sent to CRISP. Although this information is sent in the continuity of care documentation each time a care manager closes an outreach encounter, the work to recognize the goals and count them toward having a care plan in the CRISP Executive Dashboard is pending.
Secure texting is also an important tool for our partnership. We supplement Care Alerts to let care teams know (this is who I am, this is what I do for the patient, you can securely text me for this type of assistance). We track # of providers and staff and # and types of organizations using secure texting, and their use cases.
Return on InvestmentIndicate how the Partnership is working to generate a positive return on investment. Free Response, please include your calculation if applicable.
33
HSCRC Transformation Grant – Performance Year 2 (FY 2018) Report Template - FINAL1. For those interventions where we are targeting referring patients with prior utilization, we use the CRISP
Pre/Post reports to assess the change in utilization and charges prior to and after the date we applied an intervention. For ROI on a per intervention basis, we determine which time period (1,3,6 or 12 months) is most applicable to the panel. Then we take the difference in total charges pre and post divided by 2 (50%) to represent variable cost. We then subtract the cost of the intervention, and divide the result by the cost of the intervention.
((Change in Total Charges divided by 2) - cost of intervention) / (cost of intervention)
2. For behavioral health interventions, if there is billing associated with the intervention, we determine whether the payments received from the intervention exceeded the cost of the intervention. This applies to the Behavioral Health in Primary Care initiatives.
3. For interventions where patients have no or little prior utilization, we do not have a good method of determining return on investment from a utilization perspective. It is our understanding that CRISP is working on a tool to allow us to track our high utilizer pool of patients (and movement of patients into and out of that pool). We could then compare the panels of patients to the high utilizer cumulative pool to determine whether their utilization remained below high utilizer metrics. We are interested in learning how others are showing ROI for this population.
34

HSCRC Transformation Grant – Performance Year 2 (FY 2018) Report Template - FINAL
ConclusionWhen we started our regional partnership journey, we estimated that our programs could reach 800 high utilizer Medicare FFS patients in year 1, 1260 in year 2, increasing to 2,307 high utilizers in year 3 (adding some all payer) and finally reaching 2,953 all payer high utilizers in year 4. We are pleased with the results of year 2, not just in terms of number of all payer unique patients we have assisted (2,512 AAMC, 1,930 UMBWMC), but in terms of the ever-growing relationships and collaboration across interventions and across organizations. Our teams are constantly striving to study and improve their processes and increase efficiencies and documentation. They are learning about the boundaries and constraints of the services available in the communities and will use that knowledge to guide providers and patients, and to request expansions to and additions of new services. For example, transportation (in particular across county lines) and respite care to help caregivers are two of the most highly requested, but difficult to provide, services.
While we continue to adjust how we learn about progress using data analytics for both process and outcome metrics per program and across programs within our own partnership, it would be of great benefit to have statewide, nationwide and regional partnership-wide data and information to learn and compare on a broader scale. HSCRC has guided the partnerships in working toward standardization of reporting, and each year we have better, more meaningful data from CRISP to help in assessing program efficacy. As we move into year three of the grant, our collaboration tools and services are established, and outcome measurement is improving. Moving forward, the following items would be most helpful, as we strive to improve, compare and adjust programs:
HSCRC Consolidated Report: A cross-partnership summary of like services that examines success stories, lessons learned, accomplishments, what’s working, what is not, to inform strategy for adjusting our programs and portfolio. Community care management services are of particular interest.
Regional Partnership work versus overall Population Health: How do we show the value of the programs and then tie that to the overall improvement for total population health and TCOC reductions? Programs = panels. Population Health (full population) = high level metrics.
Help with Control Groups using statewide data and logic: Partnerships struggle with defining control groups, and if we tackle the problem individually it will not be consistent. Could HSCRC and CRISP assist by providing the ability to load a panel of patients for whom our interventions have touched, and generate a control panel?
Growth of High Utilizer Pool and comparison to panels: We need to understand the movement of patients into and out of our high utilizer pools across time (what is the growth rate, how many are new, how many died, how many are no longer high utilizers) and have the ability to compare our intervention-level panels (with start date of intervention) to the pool).
Thank you for giving us this opportunity to build programs that assist our most vulnerable populations, and for constantly working to improve the data analytics and tools that allow us to measure and monitor progress toward our regional partnership goals.
35