Regional and cultivar comparison of Italian single cultivar olive oils according to flavor profiling
15
Research Article Regional and cultivar comparison of Italian single cultivar olive oils according to flavor profiling Debora Tura 1 , Osvaldo Failla 1 , Daniele Bassi 1 , Cristina Attilio 2 and Arnaldo Serraiocco 3 1 Dipartimento di Scienze Agrarie e Ambientali (DiSAA), Universita ` degli Studi di Milano, Milano, Italy 2 CNR, IVALSA – Istituto per la valorizzazione del legno e delle specie arboree, Sesto Fiorentino (FI), Italy 3 CRA-OLI – Consiglio per la ricerca e la sperimentazione in agricoltura, Centro di ricerca per l’olivicoltura e l’industria olearia, Citta ` S. Angelo section, Citta ` S. Angelo (PE), Italy Geographical origin, cultivar, and olive ripening stage are important factors which affect the typical flavor profile of extra virgin olive oils. Aromatic compounds and sensorial profiles of ‘‘Casaliva’’, ‘‘Frantoio’’, and ‘‘Leccino’’ olive oils from three different Italian production regions Abruzzo (eastern-central Italy), Lombardy (northern Italy), and Tuscany (western-central Italy) were assessed in two cropping years and at three olive ripening stages (green, veraison, and ripe). The chemical aromatic compounds were more effective in discriminating the oils than their sensorial attributes. Oils showed peculiar aromatic and sensorial profiles according to their region of origin. Genetically similar ‘‘Casaliva’’ and ‘‘Frantoio’’ showed also analogous profiles, but distinct from ‘‘Leccino’’. The interaction between regions of cultivation and cultivars significantly affected the flavor profiling. Practical applications: This research provides a sound proof that geographical origin, cultivar, and fruit ripening stage, could play an important interactive role in shaping the flavor profiling of extra virgin olive oils. This represents a scientific basis of the ‘‘typicality’’ concept, which should address the marketing strategies for exploiting of the PDO products. Keywords: Aroma / Olea europaea L. / Panel test / Phenol / Volatile Received: March 10, 2012 / Revised: September 5, 2012 / Accepted: October 19, 2012 DOI: 10.1002/ejlt.201200104 1 Introduction It is a common knowledge that a correct nutrition is the basis for a good health. Already Hippocrates, father of modern Medicine, claimed that ‘‘good health implies an awareness of the powers of natural or processed food’’ (460–377 BC), and also Leonardo da Vinci (1452–1519 AD) believed that ‘‘a man’s life depends on what he eats’’. Lipids are important in nutrition and extra virgin olive oil plays a predominant role in the Mediterranean diet, recognized for its high qualitative composition (i.e., mono- and poly-unsaturated fatty acid, phenols, tocopherols, etc.) and its nutraceutic proprieties (i.e., reduction of coronary heart disease risk factor, preven- tion of several types of cancer, modification of immune and inflammatory responses, etc.), so it has been regarded for a long time between a food and a drug [1]. In Europe, other than standard virgin and extra virgin olive oils differing for anonymous cultivars blend (and region of origin), following the EU legislation, the olive oils can be further characterized by different production protocols where also cultivars (e.g., for Protected Designation of Origin and Protected Geographical Indication) or specific cultivation procedures (i.e., for ‘‘organic’’ agriculture) are regulated. In addition to well-grounded reasons for consid- ering olive oil one of the best nutritional tool for improving good health [2], it could be characterized by flavor profiles, i.e., either light and delicate or with intense fruity notes, slightly or intensely bitter and/or pungent, etc., which are appreciated and considered for an adequate and better associ- ation in foods preparation. Also, the volatile compounds in Correspondence: Dr. Debora Tura, Universita ` degli Studi di Milano, Dipartimento di Scienze Agrarie e Ambientali (DiSAA), via Celoria 2, 20133 Milano, Italy E-mail: [email protected] Fax: þ39 02 5031 6553 Abbreviations: C, olive cultivar; C T S, olive cultivar per ripening stage interaction; LA, linoleic acid; LnA, linolenic acid; LOX, lipoxygenase pathway; R, region of cultivation; R T C, region of cultivation per olive cultivar interaction; R T S, region of cultivation per ripening stage interaction; S, ripening stage; , p 0.05 (5%); , p 0.01 (1%); , p 0.001 (0.1%) 196 Eur. J. Lipid Sci. Technol. 2013, 115, 196–210 ß 2012 WILEY-VCH Verlag GmbH & Co. KGaA, Weinheim www.ejlst.com
Transcript of Regional and cultivar comparison of Italian single cultivar olive oils according to flavor profiling
Research Article
Regional and cultivar comparison of Italian single cultivarolive oils according to flavor profiling
Debora Tura1, Osvaldo Failla1, Daniele Bassi1, Cristina Attilio2 and Arnaldo Serraiocco3
1 Dipartimento di Scienze Agrarie e Ambientali (DiSAA), Universita degli Studi di Milano, Milano, Italy2 CNR, IVALSA – Istituto per la valorizzazione del legno e delle specie arboree, Sesto Fiorentino (FI), Italy3 CRA-OLI – Consiglio per la ricerca e la sperimentazione in agricoltura, Centro di ricerca per l’olivicoltura e
l’industria olearia, Citta S. Angelo section, Citta S. Angelo (PE), Italy
Geographical origin, cultivar, and olive ripening stage are important factors which affect the typical flavor
profile of extra virgin olive oils. Aromatic compounds and sensorial profiles of ‘‘Casaliva’’, ‘‘Frantoio’’,
and ‘‘Leccino’’ olive oils from three different Italian production regions Abruzzo (eastern-central Italy),
Lombardy (northern Italy), and Tuscany (western-central Italy) were assessed in two cropping years and
at three olive ripening stages (green, veraison, and ripe). The chemical aromatic compounds were more
effective in discriminating the oils than their sensorial attributes. Oils showed peculiar aromatic and
sensorial profiles according to their region of origin. Genetically similar ‘‘Casaliva’’ and ‘‘Frantoio’’
showed also analogous profiles, but distinct from ‘‘Leccino’’. The interaction between regions of
cultivation and cultivars significantly affected the flavor profiling.
Practical applications: This research provides a sound proof that geographical origin, cultivar, and
fruit ripening stage, could play an important interactive role in shaping the flavor profiling of extra virgin
olive oils. This represents a scientific basis of the ‘‘typicality’’ concept, which should address the
marketing strategies for exploiting of the PDO products.
Keywords: Aroma / Olea europaea L. / Panel test / Phenol / Volatile
Received: March 10, 2012 / Revised: September 5, 2012 / Accepted: October 19, 2012
DOI: 10.1002/ejlt.201200104
1 Introduction
It is a common knowledge that a correct nutrition is the basis
for a good health. Already Hippocrates, father of modern
Medicine, claimed that ‘‘good health implies an awareness of
the powers of natural or processed food’’ (460–377 BC), and
also Leonardo da Vinci (1452–1519 AD) believed that
‘‘a man’s life depends on what he eats’’. Lipids are important
in nutrition and extra virgin olive oil plays a predominant role
in the Mediterranean diet, recognized for its high qualitative
composition (i.e., mono- and poly-unsaturated fatty acid,
phenols, tocopherols, etc.) and its nutraceutic proprieties
(i.e., reduction of coronary heart disease risk factor, preven-
tion of several types of cancer, modification of immune and
inflammatory responses, etc.), so it has been regarded for a
long time between a food and a drug [1].
In Europe, other than standard virgin and extra virgin
olive oils differing for anonymous cultivars blend (and region
of origin), following the EU legislation, the olive oils can be
further characterized by different production protocols
where also cultivars (e.g., for Protected Designation of
Origin and Protected Geographical Indication) or specific
cultivation procedures (i.e., for ‘‘organic’’ agriculture) are
regulated. In addition to well-grounded reasons for consid-
ering olive oil one of the best nutritional tool for improving
good health [2], it could be characterized by flavor profiles,
i.e., either light and delicate or with intense fruity notes,
slightly or intensely bitter and/or pungent, etc., which are
appreciated and considered for an adequate and better associ-
ation in foods preparation. Also, the volatile compounds in
Correspondence: Dr. Debora Tura, Universita degli Studi di Milano,
Dipartimento di Scienze Agrarie e Ambientali (DiSAA), via Celoria 2, 20133
Milano, Italy
E-mail: [email protected]
Fax: þ39 02 5031 6553
Abbreviations: C, olive cultivar; C T S, olive cultivar per ripening stage
interaction; LA, linoleic acid; LnA, linolenic acid; LOX, lipoxygenase
pathway; R, region of cultivation; R T C, region of cultivation per olive
cultivar interaction; R T S, region of cultivation per ripening stage
interaction; S, ripening stage; �, p � 0.05 (5%); ��, p � 0.01 (1%); ���,
p � 0.001 (0.1%)
196 Eur. J. Lipid Sci. Technol. 2013, 115, 196–210
� 2012 WILEY-VCH Verlag GmbH & Co. KGaA, Weinheim www.ejlst.com
extra virgin olive oil play an important role not only for their
contribution to flavor, but also for place of production trace-
ability. To this end, the work of Zunin et al. [3] found that
three volatile terpenoid hydrocarbons (a-copaene, a-muur-
olene, a-farnesene) were fundamental for distinguishing
commercial oils of Liguria (northern Italy) from those pro-
duced in different Mediterranean regions, confirming the
important role of volatile compounds in olive oil character-
ization, although without taking into account the diverse
cultivar blend of the oils.
Environmental (climatic and soil) conditions, horticul-
tural practices, fruit ripening stage, and oil extraction pro-
cedures affect both the chemical composition and the
sensorial profile of monovarietal virgin olive oils [4].
Aguilera et al. [5], characterized two Italian cultivars,
‘‘Frantoio’’ and ‘‘Leccino’’, grown in two different areas in
Andalusia (Spain). The oils from the hilly location showed a
greater content of oleic acid and higher stability, while those
from the valley were characterized by higher tocopherols and
linoleic acid content. Moreover, the oils from Andalusia
showed higher concentration in antioxidants, greater oxi-
dative stability, and more marked sensorial characters than
oils of the same cultivars from Italy. Oils from three Italian
regions (Lombardy, Tuscany, and Abruzzo) were distin-
guished by composition of fatty acids, triacylglicerols, sterols,
phenols, tocopherols, and oxidative stability regardless the
four cultivars evaluated: ‘‘Casaliva’’, ‘‘Frantoio’’, ‘‘Leccino’’,
and ‘‘Pendolino’’ [6, 7]. Also Koprivnjak et al. [8] found
that five volatile compounds, hexanal among those, proved
to be useful to distinguish the oils from the three most
important cultivars in Istria (Croatia): ‘‘Leccino’’, ‘‘Buza’’,
and ‘‘Bjelica’’, although the influence of the year was also
highly significant.
In relation to the composition of the volatile fraction in
virgin olive oils and the activity of the enzymes involved in the
metabolic pathways, while the amount of enzymes strictly
depends on the genetic factor (cultivar), their activity is
mostly affected by the processing conditions [9].
Many analytical methods are available for the determi-
nation of the geographical origin of foods [10]. An unam-
biguous determination of the geographical origin seems
feasible when various parameters are measured in a food
product. Combining different analytical techniques and
applying chemometric procedure is possible to detect even
light difference between food samples. Many techniques are
available for assessing the geographical origin of oils, in
particular GC–MS for volatile compounds [11–13] and
sensory analysis for overall flavor.
Analyzing the oil headspace by direct MS without any
chromatographic separation, it was possible to classify the oils
in different commercial classes with an acceptable correlation
with the result an expert panel assessment [14]. Additionally,
it was possible to distinguish the different aromas of com-
mercial extra virgin oils from various cultivars harvested in
several areas (Liguria and Puglia in Italy, Spain, Greece, and
Tunisia) with a mean prediction ability of 80% [15]. The
accuracy of prediction was influenced both by region and
cultivar.
Another method assessed to discriminate the oil quality is
the electronic nose. By this technique it was possible not
only to distinguish among oils of different quality, but also
the cultivar and even the production area [16]. Furthermore,
applying a classification method based on a mathematic
model (CAIMAN) by chemical data from electronic tongue
and nose, several oil samples were characterized according to
their geographical origin, typicality, authenticity, and unique-
ness [17].
The combination of 1H NMR fingerprinting with chemo-
metric analysis provides an original approach to study the
identity of commercial oils from different cultivars in relation
to the country of origin (Italy, Tunisia, Turkey, Greece, and
Spain), to the different regions in the same country (Puglia,
Sicily, Lazio, Tuscany, Liguria, and Lombardy in Italy), or to
the year [18, 19].
Furthermore, several works classified extra virgin olive
oils according to their geographical origin by means of IR
spectroscopy. For example, Sinelli et al. [20] achieved highly
correct classification rates of olive oil samples from different
regions (Lombardy, Tuscany, and Calabria) by near-infrared
and mid-infrared spectroscopy combined with chemometric
analysis. In particular, it was possible to better classify about
90% of commercial oils (cultivar blends) on the basis of the
geographical origin by near-infrated, while by mid-ifrared it
was possible to classify both monovarietal (‘‘Casaliva’’,
‘‘Leccino’’, and ‘‘Frantoio’’) and commercial oils, allowing
a correct classification of more than 95% of the samples.
However, in both experiments the cultivar was not taken into
consideration for the classification of geographical origin.
Finally, it should be noted that in most of the above
studies aimed at oils discrimination by their geographical
origin, it is not possible to separate the environmental to
the genetic (cultivar) effect, since oils from different regions
most often derive from blend of local cultivars. Moreover,
differences in olive orchard management as well as the ripen-
ing stages of harvested fruit, and the processing techniques
for oil extraction may strongly affect the differences detected
in the oils.
Overall, there is a scant availability in the literature of
sound data related to the possibility to discriminate between
cultivar and environmental effect on olive oil quality, where
the specific contribution of both factors and their possible
interaction can be unambiguously ascertained.
The scientific aims of this work were: first, to estimate the
relative role of cultivar (C), region of cultivation (R), fruit
ripening stage (S), and their interactions (C � R, C � S, and
R � S) on the virgin oil flavor profile, expressed in term of
volatile compounds concentration and sensorial descriptors;
second, to examine which volatile compounds and sensorial
attributes have a major role in discriminating the different
sources of variation found in the experiment. From the
Eur. J. Lipid Sci. Technol. 2013, 115, 196–210 Regional olive oil cultivars comparison 197
� 2012 WILEY-VCH Verlag GmbH & Co. KGaA, Weinheim www.ejlst.com
practical point of view, it should be underlined that the
Protected Designation of Origin market policy is based on
a speculative assumption that the typicality of an agricultural
product is just based on irreproducible specific factors of
production. In the case of virgin olive oil, site of cultivation,
cultivars, and their interactions are presumed to play a major
role. Following the scientific literature, experiments to dem-
onstrate this assumption are not available. To fill this gap, the
present work has been carried out.
2 Materials and methods
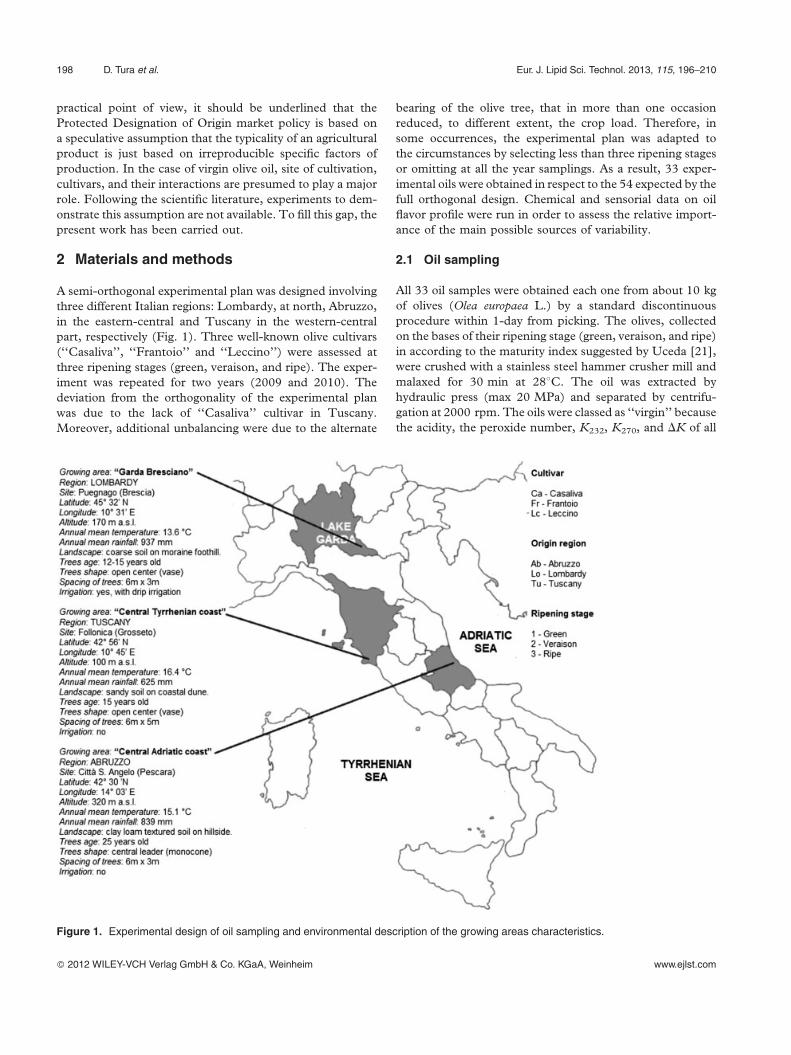
A semi-orthogonal experimental plan was designed involving
three different Italian regions: Lombardy, at north, Abruzzo,
in the eastern-central and Tuscany in the western-central
part, respectively (Fig. 1). Three well-known olive cultivars
(‘‘Casaliva’’, ‘‘Frantoio’’ and ‘‘Leccino’’) were assessed at
three ripening stages (green, veraison, and ripe). The exper-
iment was repeated for two years (2009 and 2010). The
deviation from the orthogonality of the experimental plan
was due to the lack of ‘‘Casaliva’’ cultivar in Tuscany.
Moreover, additional unbalancing were due to the alternate
bearing of the olive tree, that in more than one occasion
reduced, to different extent, the crop load. Therefore, in
some occurrences, the experimental plan was adapted to
the circumstances by selecting less than three ripening stages
or omitting at all the year samplings. As a result, 33 exper-
imental oils were obtained in respect to the 54 expected by the
full orthogonal design. Chemical and sensorial data on oil
flavor profile were run in order to assess the relative import-
ance of the main possible sources of variability.
2.1 Oil sampling
All 33 oil samples were obtained each one from about 10 kg
of olives (Olea europaea L.) by a standard discontinuous
procedure within 1-day from picking. The olives, collected
on the bases of their ripening stage (green, veraison, and ripe)
in according to the maturity index suggested by Uceda [21],
were crushed with a stainless steel hammer crusher mill and
malaxed for 30 min at 288C. The oil was extracted by
hydraulic press (max 20 MPa) and separated by centrifu-
gation at 2000 rpm. The oils were classed as ‘‘virgin’’ because
the acidity, the peroxide number, K232, K270, and DK of all
Figure 1. Experimental design of oil sampling and environmental description of the growing areas characteristics.
198 D. Tura et al. Eur. J. Lipid Sci. Technol. 2013, 115, 196–210
� 2012 WILEY-VCH Verlag GmbH & Co. KGaA, Weinheim www.ejlst.com
oils were under the limits of the Commission Regulation
(UE) no. 1989/2003 [22].
2.2 Volatile compounds analysis
The volatile composition was determined following the
extraction procedure and GC analysis described in
Angerosa et al. [23].
2.2.1 Volatile compounds extraction
Fifty grams of oil was put into a 120 mL Drechsel gas
washing bottle with a porous distributor together with
10 mg of 1-nonanol (Sigma–Aldrich) as internal standard.
Volatile were stripped with nitrogen (1.2 L/min at 378C) for
2 h, trapped on 50 mg of activated charcoal and eluted with
1 mL of diethyl ether.
2.2.2 GC-flame ionisation detector analysis
0.5 mL of diethyl ether solution was injected on-column into
GC (HRGC 5160 Mega Series, Carlo Erba) fitted with a
fused silica capillary column (Supelcowax 10, Supelco; 60 m
length, 0.32 mm inner diameter, 0.5 mm film thickness) and
a CO2 cryogenic accessory to hold the oven at 258C. The
oven temperature program was: 258C for 6 min, increase of
18C/min until 468C for 0 min, increase of 4.28C/min until
708C for 0 min, increase of 3.38C/min until 2008C for 5 min.
The pressure of H2 carrier gas was at 30 kPa and the
flame ionisation detector detector was held at 2208C. The
volatile compounds were quantified by peak area integration
(Mega Series Integrator, Carlo Erba) and the results were
expressed in mg of 1-nonanol on kg of oil. Also, the aromatic
composition was summarized by chemical affinity (alcohols,
aldehydes, and ketons) and similar biosynthetic pathway
from lipoxygenase (LOX) of linoleic (LA) or linolenic acid
(LnA). As it is known, C5 compounds (1-penten-3-one,
trans-2-pentenal, 1-penten-3-ol and cis-2-penten-1-ol)
originate from LOX of LnA, whereas C6 compounds derive
both from LOX of LA (hexanal and hexan-1-ol) and from
LOX of LnA (trans-2-hexenal, cis-3-hexen-1-ol and trans-2-
hexen-1-ol).
2.3 Phenols analysis
The phenols composition was determined by modifying the
HPLC procedures described in Tura et al. [7].
2.3.1 Phenolic compounds extraction
Ten grams oil plus 5 mL hexane plus 6.25 mL methanol/
water solution (60:40) plus 0.5 mL 0.01% syringic acid as
internal standard (Fluka) in methanol were shaken for
15 min, then the mixture was centrifuged at 3000 rpm for
10 min. The methanol–water phase was recuperated in a
separator funnel, whereas the hexane-oil phase was extracted
again two times. The three united methanol–water phases
were washed two times with 7.5 mL hexane and 10 mL were
evaporated under vacuum at 358C and the residue was dis-
solved with 1 mL methanol–water solution before HPLC
injection.
2.3.2 HPLC analysis
Twenty microliters of dissolved residue was injected in
HPLC (CM 4000 – Milton Roy) with Spherisorb RP-18
column (25 cm � 4.6 mm, i.d. 5 mm – Merck), using a
mobile phase gradient of (A) acetonitrile/methanol solution
(50:50) and (B) 2% acetic acid in water (2% A at 0 min, 17%
A at 20 min, 30% A at 25 min, 30% A at 30 min, 35% A at
40 min, 52% A at 45 min, 52% A at 50 min, 75% A at
60 min, 100% A at 63 min, 100% A at 68 min, 2% A
at 70 min). The flow rate was 1 mL/min and the detector
was a photodiode spectrophotometer (DAD – Waters) at
270 nm. The results were expressed in mg of tyrosol on kg
of oil. For the purpose of the present work the phenols were
reported as a total, then the single compounds were not
considered.
2.4 Sensory analysis
The sensory evaluation was carried out following the pro-
cedures described in the enclosure XII of the Commission
Regulation (EC) no. 796/2002 [24], but modifying the sen-
sorial profile sheet according to a parametric non-structured
assessment based on many olfactory, gustatory, and tactile
descriptors. About 15–20 mL of oil were put in blue glasses
warmed at 28–308C. Eight trained tasters from three different
panel groups evaluated the sensory notes of all samples.
Data was expressed in arbitrary units (A.U.). ‘‘Green’’
notes include the following descriptors: ‘‘lawn’’, ‘‘leaf’’,
‘‘artichoke’’, ‘‘walnut’’, and ‘‘hay’’. ‘‘Floral’’ notes include
‘‘flowers’’ and ‘‘butter’’ descriptors. ‘‘Fruity’’ notes include
‘‘olives’’, ‘‘banana’’, ‘‘tomato’’, ‘‘almond’’, and ‘‘apple’’
descriptors. ‘‘Taste’’ notes include ‘‘bitter’’, ‘‘pungent’’
and ‘‘astringency’’. ‘‘Satisfaction’’ is the overall hedonistic
score considering all together the attributes of aroma, taste,
and flavor.
2.5 Statistical analysis
Normal distribution of chemical and sensory variables was
checked by the Kolmogorov–Smirnov test. When distri-
bution was not normal, the SD was not reported in tables.
In order to test the significance of the differences among
chemical and sensory variables in relation to geographical
origin, cultivar, and ripening stage, data were processed by
ANOVA, following the general linear model (GLM) pro-
cedure, which included these factors and their interaction
as sources of variation. To achieve more robust results,
Eur. J. Lipid Sci. Technol. 2013, 115, 196–210 Regional olive oil cultivars comparison 199
� 2012 WILEY-VCH Verlag GmbH & Co. KGaA, Weinheim www.ejlst.com
according to the aim of this study, year was not included in
the model. To test the significance of the other source of
variation, the year effect was considered in the residual
variability. General linear model procedure was adopted
for its suitability to process unbalanced experimental designs.
Means were separated according to Duncan’s multiple com-
parison test. The magnitude of variability in oil composition
and sensory notes, attributable to the different sources of
variability (region, cultivar, ripening stage, and their inter-
actions) was quantified in terms of the expected components
of the variance. In order to evaluate the importance of the
chemical and sensory variables to distinguish oils from differ-
ent regions, cultivars, ripening stages and ‘‘region per culti-
var’’ interaction, discriminant analyses were performed by
step-wise method, separately for the two set of chemical and
sensory data, respectively.
Data were processed by an SPSS statistical package (version
14.0 for Windows – SPSS, Chicago, Illinois, 2006).
3 Results
3.1 Chemical aromatic profile
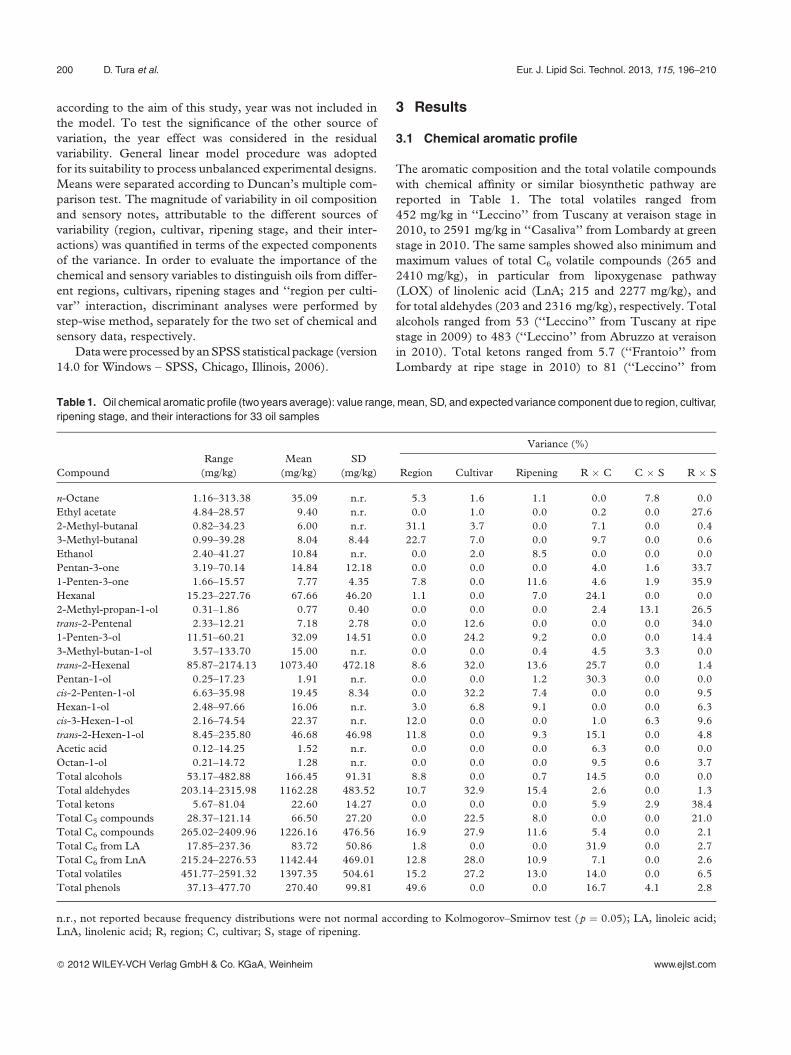
The aromatic composition and the total volatile compounds
with chemical affinity or similar biosynthetic pathway are
reported in Table 1. The total volatiles ranged from
452 mg/kg in ‘‘Leccino’’ from Tuscany at veraison stage in
2010, to 2591 mg/kg in ‘‘Casaliva’’ from Lombardy at green
stage in 2010. The same samples showed also minimum and
maximum values of total C6 volatile compounds (265 and
2410 mg/kg), in particular from lipoxygenase pathway
(LOX) of linolenic acid (LnA; 215 and 2277 mg/kg), and
for total aldehydes (203 and 2316 mg/kg), respectively. Total
alcohols ranged from 53 (‘‘Leccino’’ from Tuscany at ripe
stage in 2009) to 483 (‘‘Leccino’’ from Abruzzo at veraison
in 2010). Total ketons ranged from 5.7 (‘‘Frantoio’’ from
Lombardy at ripe stage in 2010) to 81 (‘‘Leccino’’ from
Table 1. Oil chemical aromatic profile (two years average): value range, mean, SD, and expected variance component due to region, cultivar,
ripening stage, and their interactions for 33 oil samples
Compound
Range
(mg/kg)
Mean
(mg/kg)
SD
(mg/kg)
Variance (%)
Region Cultivar Ripening R � C C � S R � S
n-Octane 1.16–313.38 35.09 n.r. 5.3 1.6 1.1 0.0 7.8 0.0
Ethyl acetate 4.84–28.57 9.40 n.r. 0.0 1.0 0.0 0.2 0.0 27.6
2-Methyl-butanal 0.82–34.23 6.00 n.r. 31.1 3.7 0.0 7.1 0.0 0.4
3-Methyl-butanal 0.99–39.28 8.04 8.44 22.7 7.0 0.0 9.7 0.0 0.6
Ethanol 2.40–41.27 10.84 n.r. 0.0 2.0 8.5 0.0 0.0 0.0
Pentan-3-one 3.19–70.14 14.84 12.18 0.0 0.0 0.0 4.0 1.6 33.7
1-Penten-3-one 1.66–15.57 7.77 4.35 7.8 0.0 11.6 4.6 1.9 35.9
Hexanal 15.23–227.76 67.66 46.20 1.1 0.0 7.0 24.1 0.0 0.0
2-Methyl-propan-1-ol 0.31–1.86 0.77 0.40 0.0 0.0 0.0 2.4 13.1 26.5
trans-2-Pentenal 2.33–12.21 7.18 2.78 0.0 12.6 0.0 0.0 0.0 34.0
1-Penten-3-ol 11.51–60.21 32.09 14.51 0.0 24.2 9.2 0.0 0.0 14.4
3-Methyl-butan-1-ol 3.57–133.70 15.00 n.r. 0.0 0.0 0.4 4.5 3.3 0.0
trans-2-Hexenal 85.87–2174.13 1073.40 472.18 8.6 32.0 13.6 25.7 0.0 1.4
Pentan-1-ol 0.25–17.23 1.91 n.r. 0.0 0.0 1.2 30.3 0.0 0.0
cis-2-Penten-1-ol 6.63–35.98 19.45 8.34 0.0 32.2 7.4 0.0 0.0 9.5
Hexan-1-ol 2.48–97.66 16.06 n.r. 3.0 6.8 9.1 0.0 0.0 6.3
cis-3-Hexen-1-ol 2.16–74.54 22.37 n.r. 12.0 0.0 0.0 1.0 6.3 9.6
trans-2-Hexen-1-ol 8.45–235.80 46.68 46.98 11.8 0.0 9.3 15.1 0.0 4.8
Acetic acid 0.12–14.25 1.52 n.r. 0.0 0.0 0.0 6.3 0.0 0.0
Octan-1-ol 0.21–14.72 1.28 n.r. 0.0 0.0 0.0 9.5 0.6 3.7
Total alcohols 53.17–482.88 166.45 91.31 8.8 0.0 0.7 14.5 0.0 0.0
Total aldehydes 203.14–2315.98 1162.28 483.52 10.7 32.9 15.4 2.6 0.0 1.3
Total ketons 5.67–81.04 22.60 14.27 0.0 0.0 0.0 5.9 2.9 38.4
Total C5 compounds 28.37–121.14 66.50 27.20 0.0 22.5 8.0 0.0 0.0 21.0
Total C6 compounds 265.02–2409.96 1226.16 476.56 16.9 27.9 11.6 5.4 0.0 2.1
Total C6 from LA 17.85–237.36 83.72 50.86 1.8 0.0 0.0 31.9 0.0 2.7
Total C6 from LnA 215.24–2276.53 1142.44 469.01 12.8 28.0 10.9 7.1 0.0 2.6
Total volatiles 451.77–2591.32 1397.35 504.61 15.2 27.2 13.0 14.0 0.0 6.5
Total phenols 37.13–477.70 270.40 99.81 49.6 0.0 0.0 16.7 4.1 2.8
n.r., not reported because frequency distributions were not normal according to Kolmogorov–Smirnov test (p ¼ 0.05); LA, linoleic acid;
LnA, linolenic acid; R, region; C, cultivar; S, stage of ripening.
200 D. Tura et al. Eur. J. Lipid Sci. Technol. 2013, 115, 196–210
� 2012 WILEY-VCH Verlag GmbH & Co. KGaA, Weinheim www.ejlst.com
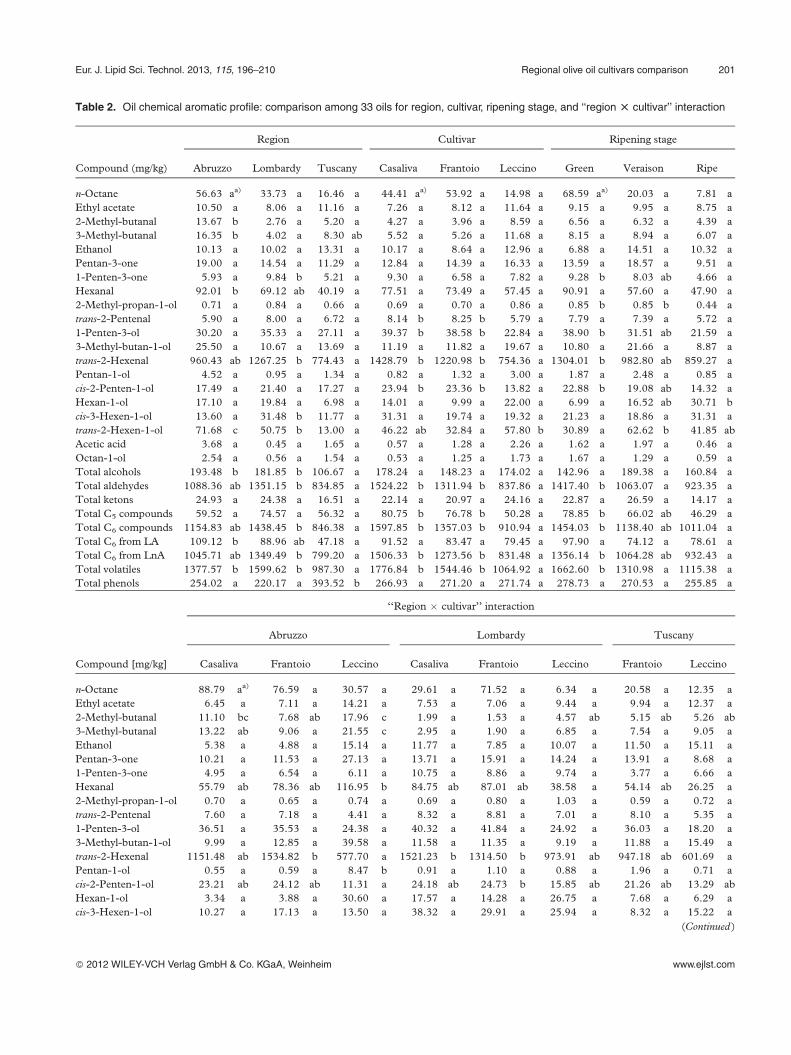
Table 2. Oil chemical aromatic profile: comparison among 33 oils for region, cultivar, ripening stage, and ‘‘region T cultivar’’ interaction
Compound (mg/kg)
Region Cultivar Ripening stage
Abruzzo Lombardy Tuscany Casaliva Frantoio Leccino Green Veraison Ripe
n-Octane 56.63 aa) 33.73 a 16.46 a 44.41 aa) 53.92 a 14.98 a 68.59 aa) 20.03 a 7.81 a
Ethyl acetate 10.50 a 8.06 a 11.16 a 7.26 a 8.12 a 11.64 a 9.15 a 9.95 a 8.75 a
2-Methyl-butanal 13.67 b 2.76 a 5.20 a 4.27 a 3.96 a 8.59 a 6.56 a 6.32 a 4.39 a
3-Methyl-butanal 16.35 b 4.02 a 8.30 ab 5.52 a 5.26 a 11.68 a 8.15 a 8.94 a 6.07 a
Ethanol 10.13 a 10.02 a 13.31 a 10.17 a 8.64 a 12.96 a 6.88 a 14.51 a 10.32 a
Pentan-3-one 19.00 a 14.54 a 11.29 a 12.84 a 14.39 a 16.33 a 13.59 a 18.57 a 9.51 a
1-Penten-3-one 5.93 a 9.84 b 5.21 a 9.30 a 6.58 a 7.82 a 9.28 b 8.03 ab 4.66 a
Hexanal 92.01 b 69.12 ab 40.19 a 77.51 a 73.49 a 57.45 a 90.91 a 57.60 a 47.90 a
2-Methyl-propan-1-ol 0.71 a 0.84 a 0.66 a 0.69 a 0.70 a 0.86 a 0.85 b 0.85 b 0.44 a
trans-2-Pentenal 5.90 a 8.00 a 6.72 a 8.14 b 8.25 b 5.79 a 7.79 a 7.39 a 5.72 a
1-Penten-3-ol 30.20 a 35.33 a 27.11 a 39.37 b 38.58 b 22.84 a 38.90 b 31.51 ab 21.59 a
3-Methyl-butan-1-ol 25.50 a 10.67 a 13.69 a 11.19 a 11.82 a 19.67 a 10.80 a 21.66 a 8.87 a
trans-2-Hexenal 960.43 ab 1267.25 b 774.43 a 1428.79 b 1220.98 b 754.36 a 1304.01 b 982.80 ab 859.27 a
Pentan-1-ol 4.52 a 0.95 a 1.34 a 0.82 a 1.32 a 3.00 a 1.87 a 2.48 a 0.85 a
cis-2-Penten-1-ol 17.49 a 21.40 a 17.27 a 23.94 b 23.36 b 13.82 a 22.88 b 19.08 ab 14.32 a
Hexan-1-ol 17.10 a 19.84 a 6.98 a 14.01 a 9.99 a 22.00 a 6.99 a 16.52 ab 30.71 b
cis-3-Hexen-1-ol 13.60 a 31.48 b 11.77 a 31.31 a 19.74 a 19.32 a 21.23 a 18.86 a 31.31 a
trans-2-Hexen-1-ol 71.68 c 50.75 b 13.00 a 46.22 ab 32.84 a 57.80 b 30.89 a 62.62 b 41.85 ab
Acetic acid 3.68 a 0.45 a 1.65 a 0.57 a 1.28 a 2.26 a 1.62 a 1.97 a 0.46 a
Octan-1-ol 2.54 a 0.56 a 1.54 a 0.53 a 1.25 a 1.73 a 1.67 a 1.29 a 0.59 a
Total alcohols 193.48 b 181.85 b 106.67 a 178.24 a 148.23 a 174.02 a 142.96 a 189.38 a 160.84 a
Total aldehydes 1088.36 ab 1351.15 b 834.85 a 1524.22 b 1311.94 b 837.86 a 1417.40 b 1063.07 a 923.35 a
Total ketons 24.93 a 24.38 a 16.51 a 22.14 a 20.97 a 24.16 a 22.87 a 26.59 a 14.17 a
Total C5 compounds 59.52 a 74.57 a 56.32 a 80.75 b 76.78 b 50.28 a 78.85 b 66.02 ab 46.29 a
Total C6 compounds 1154.83 ab 1438.45 b 846.38 a 1597.85 b 1357.03 b 910.94 a 1454.03 b 1138.40 ab 1011.04 a
Total C6 from LA 109.12 b 88.96 ab 47.18 a 91.52 a 83.47 a 79.45 a 97.90 a 74.12 a 78.61 a
Total C6 from LnA 1045.71 ab 1349.49 b 799.20 a 1506.33 b 1273.56 b 831.48 a 1356.14 b 1064.28 ab 932.43 a
Total volatiles 1377.57 b 1599.62 b 987.30 a 1776.84 b 1544.46 b 1064.92 a 1662.60 b 1310.98 a 1115.38 a
Total phenols 254.02 a 220.17 a 393.52 b 266.93 a 271.20 a 271.74 a 278.73 a 270.53 a 255.85 a
Compound [mg/kg]
‘‘Region � cultivar’’ interaction
Abruzzo Lombardy Tuscany
Casaliva Frantoio Leccino Casaliva Frantoio Leccino Frantoio Leccino
n-Octane 88.79 aa) 76.59 a 30.57 a 29.61 a 71.52 a 6.34 a 20.58 a 12.35 a
Ethyl acetate 6.45 a 7.11 a 14.21 a 7.53 a 7.06 a 9.44 a 9.94 a 12.37 a
2-Methyl-butanal 11.10 bc 7.68 ab 17.96 c 1.99 a 1.53 a 4.57 ab 5.15 ab 5.26 ab
3-Methyl-butanal 13.22 ab 9.06 a 21.55 c 2.95 a 1.90 a 6.85 a 7.54 a 9.05 a
Ethanol 5.38 a 4.88 a 15.14 a 11.77 a 7.85 a 10.07 a 11.50 a 15.11 a
Pentan-3-one 10.21 a 11.53 a 27.13 a 13.71 a 15.91 a 14.24 a 13.91 a 8.68 a
1-Penten-3-one 4.95 a 6.54 a 6.11 a 10.75 a 8.86 a 9.74 a 3.77 a 6.66 a
Hexanal 55.79 ab 78.36 ab 116.95 b 84.75 ab 87.01 ab 38.58 a 54.14 ab 26.25 a
2-Methyl-propan-1-ol 0.70 a 0.65 a 0.74 a 0.69 a 0.80 a 1.03 a 0.59 a 0.72 a
trans-2-Pentenal 7.60 a 7.18 a 4.41 a 8.32 a 8.81 a 7.01 a 8.10 a 5.35 a
1-Penten-3-ol 36.51 a 35.53 a 24.38 a 40.32 a 41.84 a 24.92 a 36.03 a 18.20 a
3-Methyl-butan-1-ol 9.99 a 12.85 a 39.58 a 11.58 a 11.35 a 9.19 a 11.88 a 15.49 a
trans-2-Hexenal 1151.48 ab 1534.82 b 577.70 a 1521.23 b 1314.50 b 973.91 ab 947.18 ab 601.69 a
Pentan-1-ol 0.55 a 0.59 a 8.47 b 0.91 a 1.10 a 0.88 a 1.96 a 0.71 a
cis-2-Penten-1-ol 23.21 ab 24.12 ab 11.31 a 24.18 ab 24.73 b 15.85 ab 21.26 ab 13.29 ab
Hexan-1-ol 3.34 a 3.88 a 30.60 a 17.57 a 14.28 a 26.75 a 7.68 a 6.29 a
cis-3-Hexen-1-ol 10.27 a 17.13 a 13.50 a 38.32 a 29.91 a 25.94 a 8.32 a 15.22 a
(Continued )
Eur. J. Lipid Sci. Technol. 2013, 115, 196–210 Regional olive oil cultivars comparison 201
� 2012 WILEY-VCH Verlag GmbH & Co. KGaA, Weinheim www.ejlst.com
Abruzzo at veraison stage in 2000). Total C5 volatile com-
pounds ranged from 28 (‘‘Leccino’’ from Abruzzo at green
stage in 2010) to 121 (‘‘Casaliva’’ from Lombardy at green
stage in 2010). C6 compounds from LOX of linoleic acid
(LA) ranged between 18 (‘‘Leccino’’ from Tuscany at ripe
stage in 2009) and 237 (‘‘Leccino’’ from Abruzzo at green
stage in 2010).
In general, as main of source of variability on chemical
composition, region of cultivation (R), and olive cultivar (C)
were more important than the ripening stage (S), while in
term of interaction, C � S showed no effect. Moreover, the
aromatic composition of the oil was affected by R, C, S, and
R � C interaction (Table 2). The following compounds were
peculiar in characterizing the region of origin: 2- and 3-
methyl-butanal (variance explained by R of 31.1%�� and
22.7%�, both higher in Abruzzo), 1-penten-3-one (7.8%�,
higher in Lombardy), trans-2-hexenal (8.6%�, higher in
Lombardy and low in Tuscany), cis-3-hexen-1-ol (12.0%�,
higher in Lombardy), trans-2-hexen-1-ol (11.8%���, lower in
Tuscany and higher in Abruzzo), total alcohols (8.8%�, lower
in Tuscany), aldehydes (10.7%�, higher in Lombardy and
lower in Tuscany), C6 compounds and C6 volatiles from
LnA (16.9%� and 12.8%�, lower in Tuscany and higher
in Lombardy), total volatiles and phenols (15.2%� and
49.6%���, respectively lower and higher in Tuscany).
The compounds affected by cultivar were: trans-2-pentenal,
1-penten-3-ol, trans-2-hexenal, cis-2-penten-1-ol, total
aldehydes, C5 and C6 compounds, total and from LOX of
LnA, and total volatiles (respectively 12.6%�, 24.2%�,
32.0%��, 32.2%��, 32.9%��, 22.5%�, 27.9%��, and
28.0%��, 27.2%��, all lower in ‘‘Leccino’’). The ripening
stage influence effected 1-penten-3-one, 1-penten-3-ol,
trans-2-hexenal and cis-2-penten-1-ol, total aldehydes, C5
and C6 compounds, both total and from LOX of LnA,
and on total volatiles as well (respectively 11.6%�, 9.2%�,
13.6%�, 7.4%�, 15.4%�, 8.0%�, 11.6%�, 10.9%�, and
13.0%�, all higher in ‘‘green’’ and lower in ‘‘ripe’’ stage)
which decreased during ripening. An opposite trend for
hexan-1-ol (9.1%�, lower in ‘‘green’’ and higher in ‘‘ripe’’
stage) and trans-2-hexen-1-ol (9.3%�, higher in ‘‘veraison’’
stage) were detected: the first one increased with olive
ripening while the second showed a bell-shaped trend, with
a maximum at ‘‘veraison’’ stage.
‘‘Region � cultivar’’ interaction affected: 2- and 3-
methyl-butanal, pentan-1-ol and trans-2-hexen-1-ol
(7.1%�, 9.7%�, 30.3%�, and 15.1%�, higher in ‘‘Leccino’’
from Abruzzo), hexanal (24.1%�, higher in ‘‘Leccino’’ from
Abruzzo and lower in ‘‘Leccino’’ from Lombardy and
Tuscany), trans-2-hexenal (25.7%�, lower in ‘‘Leccino’’ from
Abruzzo and Tuscany), total alcohols and C6 compounds
from LOX of LA (14.5%� and 31.9%�, higher in ‘‘Leccino’’
from Abruzzo and lower in ‘‘Leccino’’ from Tuscany), total
volatiles (14.0%�, higher in ‘‘Frantoio’’ from Abruzzo and
‘‘Casaliva’’ from Lombardy and lower in ‘‘Leccino’’ from
Tuscany) and total phenols (16.7%�, higher in ‘‘Leccino’’
from Tuscany). ‘‘Cultivar � stage of ripening’’ interaction
did not affect any compound in particular, whereas
‘‘region � stage of ripening’’ interaction was influenced
by ethyl acetate (27.6%�), pentan-3-one (33.7%�), 1-
penten-3-one (35.9%�), 2-methyl-propan-1-ol (26.5%�),
trans-2-pentenal (34.0%�), total ketons, and C5 compounds
(38.4%� and 21.0%�).
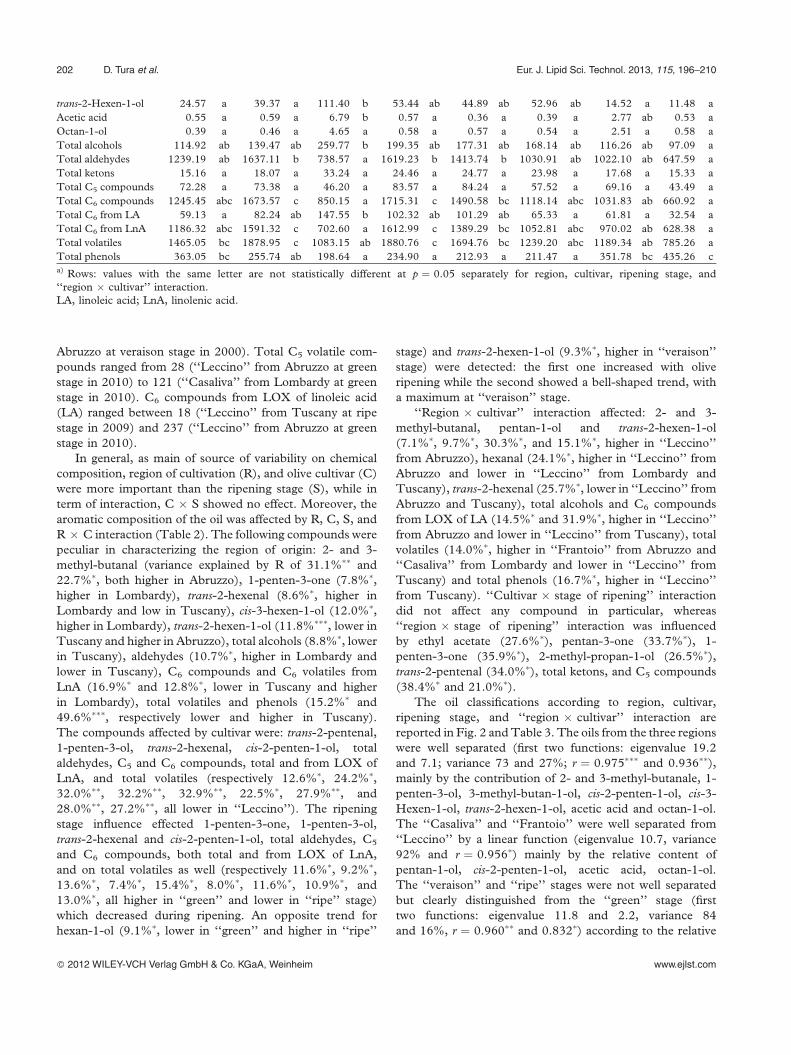
The oil classifications according to region, cultivar,
ripening stage, and ‘‘region � cultivar’’ interaction are
reported in Fig. 2 and Table 3. The oils from the three regions
were well separated (first two functions: eigenvalue 19.2
and 7.1; variance 73 and 27%; r ¼ 0.975��� and 0.936��),
mainly by the contribution of 2- and 3-methyl-butanale, 1-
penten-3-ol, 3-methyl-butan-1-ol, cis-2-penten-1-ol, cis-3-
Hexen-1-ol, trans-2-hexen-1-ol, acetic acid and octan-1-ol.
The ‘‘Casaliva’’ and ‘‘Frantoio’’ were well separated from
‘‘Leccino’’ by a linear function (eigenvalue 10.7, variance
92% and r ¼ 0.956�) mainly by the relative content of
pentan-1-ol, cis-2-penten-1-ol, acetic acid, octan-1-ol.
The ‘‘veraison’’ and ‘‘ripe’’ stages were not well separated
but clearly distinguished from the ‘‘green’’ stage (first
two functions: eigenvalue 11.8 and 2.2, variance 84
and 16%, r ¼ 0.960�� and 0.832�) according to the relative
trans-2-Hexen-1-ol 24.57 a 39.37 a 111.40 b 53.44 ab 44.89 ab 52.96 ab 14.52 a 11.48 a
Acetic acid 0.55 a 0.59 a 6.79 b 0.57 a 0.36 a 0.39 a 2.77 ab 0.53 a
Octan-1-ol 0.39 a 0.46 a 4.65 a 0.58 a 0.57 a 0.54 a 2.51 a 0.58 a
Total alcohols 114.92 ab 139.47 ab 259.77 b 199.35 ab 177.31 ab 168.14 ab 116.26 ab 97.09 a
Total aldehydes 1239.19 ab 1637.11 b 738.57 a 1619.23 b 1413.74 b 1030.91 ab 1022.10 ab 647.59 a
Total ketons 15.16 a 18.07 a 33.24 a 24.46 a 24.77 a 23.98 a 17.68 a 15.33 a
Total C5 compounds 72.28 a 73.38 a 46.20 a 83.57 a 84.24 a 57.52 a 69.16 a 43.49 a
Total C6 compounds 1245.45 abc 1673.57 c 850.15 a 1715.31 c 1490.58 bc 1118.14 abc 1031.83 ab 660.92 a
Total C6 from LA 59.13 a 82.24 ab 147.55 b 102.32 ab 101.29 ab 65.33 a 61.81 a 32.54 a
Total C6 from LnA 1186.32 abc 1591.32 c 702.60 a 1612.99 c 1389.29 bc 1052.81 abc 970.02 ab 628.38 a
Total volatiles 1465.05 bc 1878.95 c 1083.15 ab 1880.76 c 1694.76 bc 1239.20 abc 1189.34 ab 785.26 a
Total phenols 363.05 bc 255.74 ab 198.64 a 234.90 a 212.93 a 211.47 a 351.78 bc 435.26 c
a) Rows: values with the same letter are not statistically different at p ¼ 0.05 separately for region, cultivar, ripening stage, and
‘‘region � cultivar’’ interaction.
LA, linoleic acid; LnA, linolenic acid.
202 D. Tura et al. Eur. J. Lipid Sci. Technol. 2013, 115, 196–210
� 2012 WILEY-VCH Verlag GmbH & Co. KGaA, Weinheim www.ejlst.com
content of trans-2-pentenal, 1-penten-3-ol, 3-methyl-butan-
1-ol, pentan-1-ol, trans-2-hexen-1-ol, acetic acid and
octan-1-ol. ‘‘Casaliva’’ and ‘‘Frantoio’’ from Lombardy
and Abruzzo were well distinguished from ‘‘Leccino’’ from
all regions (first two functions: eigenvalue 112 and 62.4,
variance 55 and 31%, r ¼ 0.996��� and 0.992���) due to
the relative content of 2- and 3-methyl-butanal, 1-penten-
3-ol, 3-methyl-butan-1-ol, pentan-1-ol, cis-2-penten-1-ol,
cis-3-Hexen-1-ol, trans-2-hexen-1-ol, acetic acid and
octan-1-ol. Moreover, ‘‘Frantoio’’ from Tuscany was
more similar to ‘‘Leccino’’ from Lombardy and Tuscany
than from Abruzzo, the latter well distinguished from all
other oils.
3.2 Sensorial profile
The descriptors assessed for the sensorial profile, the sensory
notes, and the overall hedonistic ‘‘satisfaction’’ of oils are
shown in Table 4, expressed in arbitrary unites (A.U.). The
odor of ‘‘green’’, ‘‘floral’’, and ‘‘fruity’’ notes ranged from
17.4, 7.8, 19.3 (in ‘‘Leccino’’ from Abruzzo at veraison stage
in 2010) to 31.7 (in ‘‘Casaliva’’ from Abruzzo at green stage
in 2009), 16.9 (in ‘‘Leccino’’ from Lombardy at ripe stage in
2010), and 36.1 (in ‘‘Frantoio’’ from Lombardy at veraison
stage in 2010), respectively. The ‘‘taste’’ notes varied from
6.5 (in ‘‘Frantoio’’ from Lombardy at green stage in 2009)
to 25.3 (in ‘‘Leccino’’ from Tuscany at green stage in 2009),
Figure 2. Oil chemical aromatic profile: plots of the first two canonical functions for region, cultivar, ripening stage, and ‘‘region T cultivar’’
interaction (within brackets: percent of variance explained by function). See Table 3 for values and coefficients of functions. ^, centroid;
Ab, Abruzzo; Lo, Lombardy; Tu, Tuscany; Ca, Casaliva; Fr, Frantoio; Lc, Leccino; 1, green; 2, veraison; 3, ripe.
Eur. J. Lipid Sci. Technol. 2013, 115, 196–210 Regional olive oil cultivars comparison 203
� 2012 WILEY-VCH Verlag GmbH & Co. KGaA, Weinheim www.ejlst.com

and the total sensorial satisfaction, from 0.8 (in ‘‘Leccino’’
from Tuscany at green stage in 2009) to 30.1 (in ‘‘Casaliva’’
from Lombardy at green stage in 2009).
Low levels in explained variability was found for the
majority of the assessed descriptors among regions, cultivars,
ripening stages, and among cultivar in each region (Table 5).
About the peculiarity among regions, worthy to be mentioned
are the flavors of ‘‘banana’’ (24.9%� of expected variance,
higher in Lombardy), ‘‘walnut’’ (14.3%�, lower in Abruzzo),
bitter and ‘‘astringency’’ (37.3%��� and 20.7%��, higher in
Tuscany), and the notes ‘‘fruity’’ (22.4%�, lower in Abruzzo
and higher in Lombardy) and ‘‘taste’’ (30.6%��, higher in
Tuscany). For the differences among cultivars, ‘‘lawn’’
(24.5%��) was higher in ‘‘Casaliva’’ and lower in ‘‘Leccino’’
and ‘‘green’’ notes (20.6%�) higher in ‘‘Casaliva’’. For the
ripening stages, ‘‘leaf ’’ (11.3%�) was higher in ‘‘green’’ stage,
‘‘hay’’ (11.5%�) scored higher in the ‘‘ripe’’ stage, ‘‘bitter’’
(11.0%�) was higher in ‘‘green’’ and lower in ‘‘veraison’’,
‘‘astringency’’ (11.8%�) was lower in ‘‘veraison’’ and higher
in ‘‘ripe’’ stage; finally, ‘‘satisfaction’’ (14.0%�) scored lower in
‘‘green’’ stage.
Five sensorial descriptors were significant in characterizing
each oil in each region: ‘‘lawn’’ (18.3%�, higher in ‘‘Casaliva’’
from Abruzzo), ‘‘olives’’ (8.0%�, lower in ‘‘Leccino’’ from
Tuscany), ‘‘bitter’’ (8.1%�, higher in ‘‘Leccino’’ from
Tuscany), ‘‘astringency’’ (25.0%�, higher in ‘‘Leccino’’ from
Tuscany) and ‘‘taste’’ notes (11.4%�, higher in ‘‘Leccino’’
from Tuscany). The other interactions affected the expected
variance for several descriptors: ‘‘olive’’ and ‘‘hay’’ (14.5%�
and 21.6%�) by ‘‘cultivar � stage of ripening’’; ‘‘apple’’,
Table 3. Oil chemical aromatic profile: function coefficients for region, cultivar, ripening stage, and ‘‘region T cultivar’’ interaction of plots in
Fig. 2
Model Function Eigenvalues % Variance % Cumulative Correlation l Wilks x2 df Sig.
Region 1 19.227 73.0 73.0 0.975 0.006 102 42 0.000
2 7.127 27.0 100.0 0.936 0.123 42 20 0.003
Cultivar 1 10.729 92.4 92.4 0.956 0.045 62 42 0.025
2 0.880 7.6 100.0 0.684 0.532 13 20 0.893
Ripening 1 11.845 84.1 84.1 0.960 0.024 75 42 0.001
2 2.244 15.9 100.0 0.832 0.308 24 20 0.050
Region � cultivar 1 112.055 55.4 55.4 0.996 0.000 284 147 0.000
2 62.357 30.8 86.3 0.992 0.000 202 120 0.000
3 16.645 8.2 94.5 0.971 0.001 129 95 0.012
Compound
Region Cultivar Ripening Region � cultivar
Fx 1 Fx 2 Fx 1 Fx 2 Fx 1 Fx 2 Fx 1 Fx 2 Fx 3
n-Octane �0.339 �0.041 �0.334 �1.605 0.530 �0.532 0.651 �0.242 0.293
Ethyl acetate �0.223 �.609 0.289 �1.320 1.422 1.283 1.729 1.997 �2.329
2-Methyl-butanal 5.164 6.343 0.217 1.055 0.378 0.129 �5.737 �9.859 3.185
3-Methyl-butanal �3.628 �7.611 .849 �.988 0.059 �0.005 12.472 11.171 �4.147
Ethanol �2.445 �0.537 �1.128 �0.084 �2.206 0.121 2.010 0.004 �1.560
Pentan-3-one �2.562 �2.363 0.234 �1.230 �0.016 �2.353 3.904 6.684 �3.881
1-Penten-3-one �1.030 1.179 1.446 0.912 2.299 0.330 �2.170 �0.727 3.683
Hexanal 1.058 0.238 �1.571 3.165 1.480 0.347 �0.153 �5.329 2.658
2-Methyl-propan-1-ol 0.559 0.044 2.257 0.975 1.529 0.076 0.570 4.070 �0.677
trans-2-Pentenal �1.375 0.099 �1.306 �1.137 �5.055 1.418 �1.775 �0.269 �1.528
1-Penten-3-ol �4.977 �1.195 1.437 �0.887 3.791 �0.726 0.096 5.272 2.926
3-Methyl-butan-1-ol 4.461 1.454 2.044 0.392 �3.465 3.863 �8.868 �6.165 11.819
trans-2-Hexenal 2.289 �0.062 0.916 0.386 �1.137 �0.283 0.767 1.465 �2.825
Pentan-1-ol 0.755 1.381 4.290 �2.448 0.189 �3.033 7.995 1.678 1.958
cis-2-Penten-1-ol 6.320 1.465 �3.114 1.123 0.855 1.760 0.318 �8.961 �3.261
Hexan-1-ol 1.916 0.539 1.971 2.126 1.663 �0.650 �1.161 1.543 �.148
cis-3-Hexen-1-ol �3.409 �1.510 0.879 �0.840 0.123 �2.085 0.622 6.250 0.006
trans-2-Hexen-1-ol 4.189 3.679 �2.224 1.010 �3.877 3.971 �5.805 �11.347 4.079
Acetic acid �5.764 �7.530 �6.512 3.654 7.972 �6.192 10.983 13.795 �22.143
Octan-1-ol 4.674 5.230 3.860 �3.596 �6.791 7.409 �12.052 �9.984 15.441
Total phenols 1.928 �0.167 1.573 2.422 0.498 0.140 �1.588 0.223 2.761
Fx, function.
204 D. Tura et al. Eur. J. Lipid Sci. Technol. 2013, 115, 196–210
� 2012 WILEY-VCH Verlag GmbH & Co. KGaA, Weinheim www.ejlst.com
‘‘walnut’’, and ‘‘bitter’’ (29.9%�, 57.3%�� and 23.3%�,
respectively) by ‘‘region � stage of ripening’’.
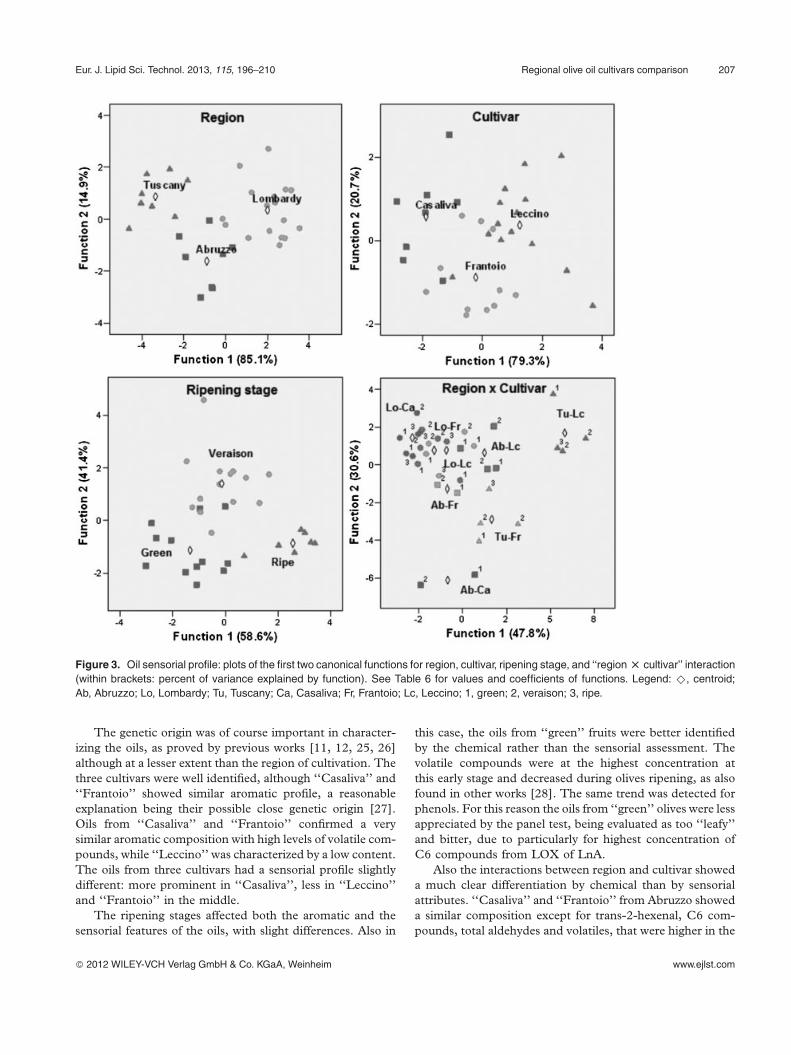
The sensorial assessment was not very efficient in dis-
criminating among regions, cultivars, ripening stages, and
‘‘region � cultivar’’ interactions (Fig. 3 and Table 6).
Lombardy and Tuscany were well separated while
Abruzzo was in between, according to correlations based
on ‘‘walnut’’, ‘‘butter’’, and ‘‘bitter’’ (eigenvalue 5.5,
variance 85% and r ¼ 0.920��). ‘‘Casaliva’’ was distinctively
separated from ‘‘Leccino’’, with ‘‘Frantoio’’ in between
according to ‘‘almond’’, ‘‘walnut’’, and ‘‘bitter’’ descriptors
(eigenvalue 1.7, variance 79% and r ¼ 0.792�). ‘‘Ripe’’ and
‘‘veraison’’ ripening stages were separated while ‘‘green’’ was
in between, mainly by ‘‘bitter’’, ‘‘pungent’’, ‘‘astringency’’
and ‘‘satisfaction’’ notes (eigenvalue 2.3, variance 59% and
r ¼ 0.833�).
About the interaction ‘‘region � cultivar’’, in Lombardy
there was not clear separation among cultivars according
to ‘‘apple’’, ‘‘walnut’’, ‘‘bitter’’, and ‘‘satisfaction’’ for
the first function (eigenvalue 9, variance 48% and
r ¼ 0.948��), and by ‘‘lawn’’, ‘‘banana’’, and ‘‘tomato’’ for
the second function (eigenvalue 5.7, variance 31% and
r ¼ 0.923�), while in Abruzzo and Tuscany the cultivars
were uniquely identified. However, there was no clear
distinction for ‘‘Frantoio’’ and ‘‘Leccino’’ between
Abruzzo and Lombardy.
4 Discussion
As a general overview, region of production, cultivars, fruit
ripening stage, and interaction between region and cultivar
were better characterized by the aromatic chemical compo-
sition then by the sensorial profile, showing that even for very
well trained panel the discrimination between samples needs
very large variability.
The ‘‘region’’ was the most important discriminating
factor: oils from Abruzzo, Lombardy, and Tuscany showed
peculiar aromatic and sensorial profiles. The chemical aro-
matic compounds and sensorial attributes, separately or in
relationship, were effective in characterizing the geographic
origin of oils, confirming a large body of findings so far based
on assessment were region and cultivar were confounded.
The oils from Lombardy were distinguished by the high
values of aldehydes and C6 compounds which give a good
‘‘fruity’’, light note, while those from Tuscany were differ-
entiated by a low volatile composition and a high content of
phenols conferred high sensation of strong taste notes. Oils
from Abruzzo scored in between.
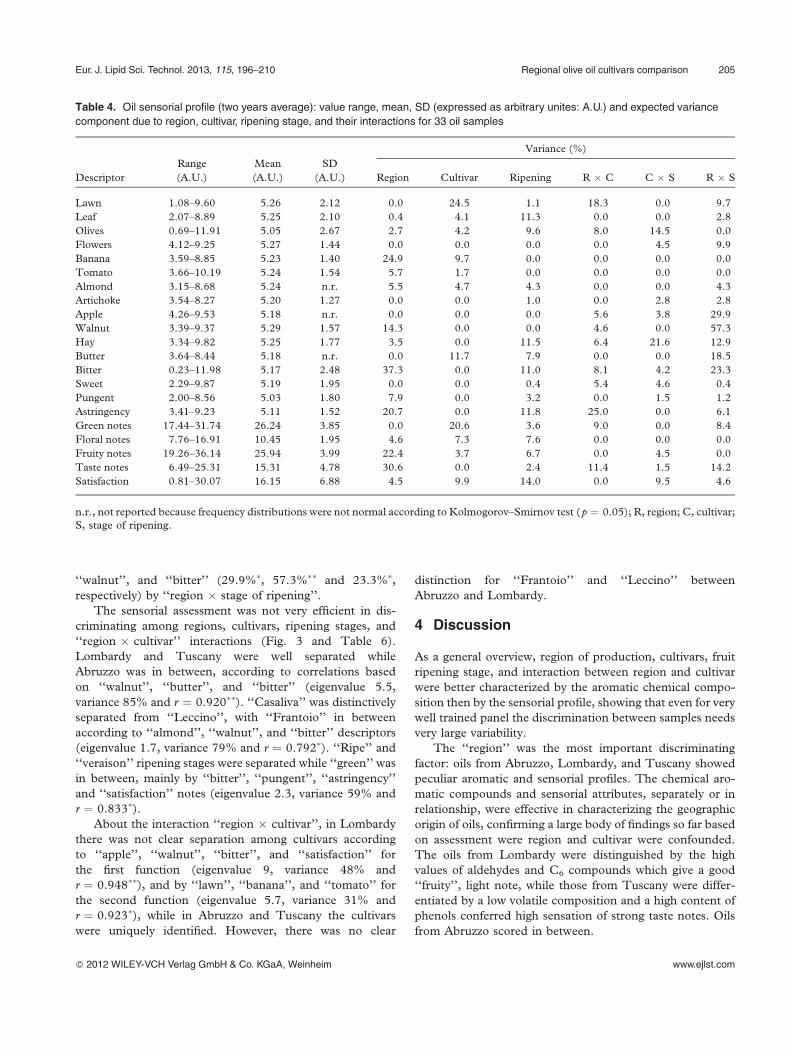
Table 4. Oil sensorial profile (two years average): value range, mean, SD (expressed as arbitrary unites: A.U.) and expected variance
component due to region, cultivar, ripening stage, and their interactions for 33 oil samples
Descriptor
Range
(A.U.)
Mean
(A.U.)
SD
(A.U.)
Variance (%)
Region Cultivar Ripening R � C C � S R � S
Lawn 1.08–9.60 5.26 2.12 0.0 24.5 1.1 18.3 0.0 9.7
Leaf 2.07–8.89 5.25 2.10 0.4 4.1 11.3 0.0 0.0 2.8
Olives 0.69–11.91 5.05 2.67 2.7 4.2 9.6 8.0 14.5 0.0
Flowers 4.12–9.25 5.27 1.44 0.0 0.0 0.0 0.0 4.5 9.9
Banana 3.59–8.85 5.23 1.40 24.9 9.7 0.0 0.0 0.0 0.0
Tomato 3.66–10.19 5.24 1.54 5.7 1.7 0.0 0.0 0.0 0.0
Almond 3.15–8.68 5.24 n.r. 5.5 4.7 4.3 0.0 0.0 4.3
Artichoke 3.54–8.27 5.20 1.27 0.0 0.0 1.0 0.0 2.8 2.8
Apple 4.26–9.53 5.18 n.r. 0.0 0.0 0.0 5.6 3.8 29.9
Walnut 3.39–9.37 5.29 1.57 14.3 0.0 0.0 4.6 0.0 57.3
Hay 3.34–9.82 5.25 1.77 3.5 0.0 11.5 6.4 21.6 12.9
Butter 3.64–8.44 5.18 n.r. 0.0 11.7 7.9 0.0 0.0 18.5
Bitter 0.23–11.98 5.17 2.48 37.3 0.0 11.0 8.1 4.2 23.3
Sweet 2.29–9.87 5.19 1.95 0.0 0.0 0.4 5.4 4.6 0.4
Pungent 2.00–8.56 5.03 1.80 7.9 0.0 3.2 0.0 1.5 1.2
Astringency 3.41–9.23 5.11 1.52 20.7 0.0 11.8 25.0 0.0 6.1
Green notes 17.44–31.74 26.24 3.85 0.0 20.6 3.6 9.0 0.0 8.4
Floral notes 7.76–16.91 10.45 1.95 4.6 7.3 7.6 0.0 0.0 0.0
Fruity notes 19.26–36.14 25.94 3.99 22.4 3.7 6.7 0.0 4.5 0.0
Taste notes 6.49–25.31 15.31 4.78 30.6 0.0 2.4 11.4 1.5 14.2
Satisfaction 0.81–30.07 16.15 6.88 4.5 9.9 14.0 0.0 9.5 4.6
n.r., not reported because frequency distributions were not normal according to Kolmogorov–Smirnov test (p ¼ 0.05); R, region; C, cultivar;
S, stage of ripening.
Eur. J. Lipid Sci. Technol. 2013, 115, 196–210 Regional olive oil cultivars comparison 205
� 2012 WILEY-VCH Verlag GmbH & Co. KGaA, Weinheim www.ejlst.com
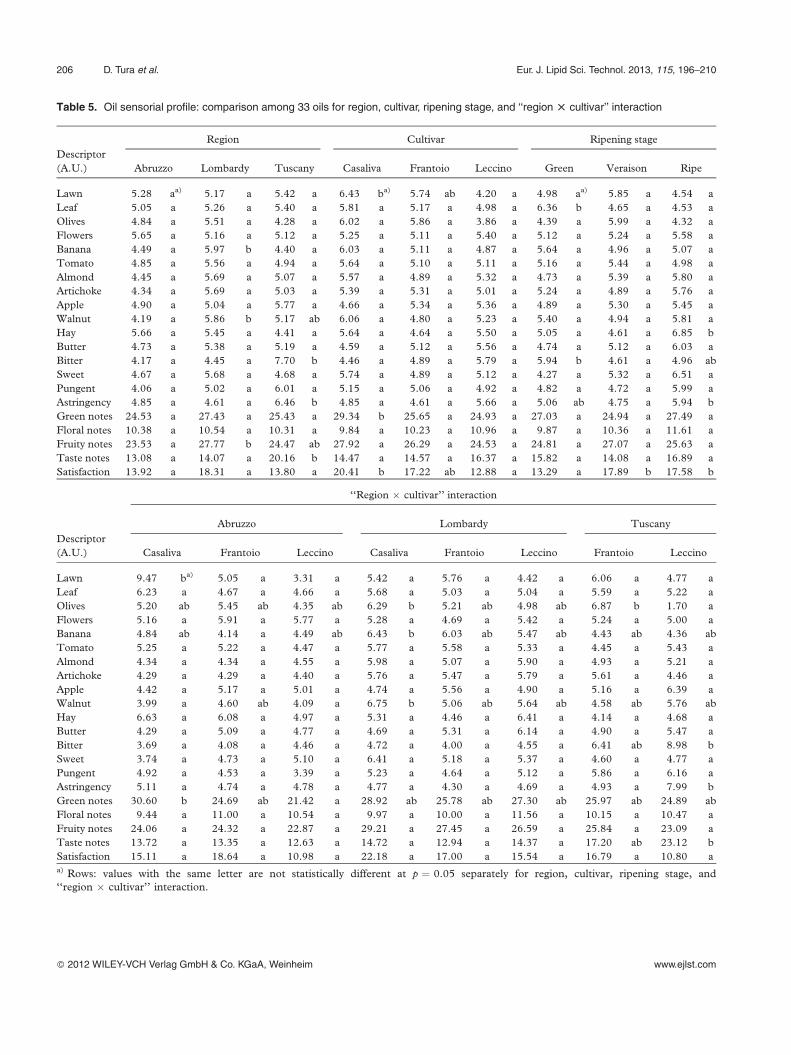
Table 5. Oil sensorial profile: comparison among 33 oils for region, cultivar, ripening stage, and ‘‘region T cultivar’’ interaction
Descriptor
(A.U.)
Region Cultivar Ripening stage
Abruzzo Lombardy Tuscany Casaliva Frantoio Leccino Green Veraison Ripe
Lawn 5.28 aa) 5.17 a 5.42 a 6.43 ba) 5.74 ab 4.20 a 4.98 aa) 5.85 a 4.54 a
Leaf 5.05 a 5.26 a 5.40 a 5.81 a 5.17 a 4.98 a 6.36 b 4.65 a 4.53 a
Olives 4.84 a 5.51 a 4.28 a 6.02 a 5.86 a 3.86 a 4.39 a 5.99 a 4.32 a
Flowers 5.65 a 5.16 a 5.12 a 5.25 a 5.11 a 5.40 a 5.12 a 5.24 a 5.58 a
Banana 4.49 a 5.97 b 4.40 a 6.03 a 5.11 a 4.87 a 5.64 a 4.96 a 5.07 a
Tomato 4.85 a 5.56 a 4.94 a 5.64 a 5.10 a 5.11 a 5.16 a 5.44 a 4.98 a
Almond 4.45 a 5.69 a 5.07 a 5.57 a 4.89 a 5.32 a 4.73 a 5.39 a 5.80 a
Artichoke 4.34 a 5.69 a 5.03 a 5.39 a 5.31 a 5.01 a 5.24 a 4.89 a 5.76 a
Apple 4.90 a 5.04 a 5.77 a 4.66 a 5.34 a 5.36 a 4.89 a 5.30 a 5.45 a
Walnut 4.19 a 5.86 b 5.17 ab 6.06 a 4.80 a 5.23 a 5.40 a 4.94 a 5.81 a
Hay 5.66 a 5.45 a 4.41 a 5.64 a 4.64 a 5.50 a 5.05 a 4.61 a 6.85 b
Butter 4.73 a 5.38 a 5.19 a 4.59 a 5.12 a 5.56 a 4.74 a 5.12 a 6.03 a
Bitter 4.17 a 4.45 a 7.70 b 4.46 a 4.89 a 5.79 a 5.94 b 4.61 a 4.96 ab
Sweet 4.67 a 5.68 a 4.68 a 5.74 a 4.89 a 5.12 a 4.27 a 5.32 a 6.51 a
Pungent 4.06 a 5.02 a 6.01 a 5.15 a 5.06 a 4.92 a 4.82 a 4.72 a 5.99 a
Astringency 4.85 a 4.61 a 6.46 b 4.85 a 4.61 a 5.66 a 5.06 ab 4.75 a 5.94 b
Green notes 24.53 a 27.43 a 25.43 a 29.34 b 25.65 a 24.93 a 27.03 a 24.94 a 27.49 a
Floral notes 10.38 a 10.54 a 10.31 a 9.84 a 10.23 a 10.96 a 9.87 a 10.36 a 11.61 a
Fruity notes 23.53 a 27.77 b 24.47 ab 27.92 a 26.29 a 24.53 a 24.81 a 27.07 a 25.63 a
Taste notes 13.08 a 14.07 a 20.16 b 14.47 a 14.57 a 16.37 a 15.82 a 14.08 a 16.89 a
Satisfaction 13.92 a 18.31 a 13.80 a 20.41 b 17.22 ab 12.88 a 13.29 a 17.89 b 17.58 b
Descriptor
(A.U.)
‘‘Region � cultivar’’ interaction
Abruzzo Lombardy Tuscany
Casaliva Frantoio Leccino Casaliva Frantoio Leccino Frantoio Leccino
Lawn 9.47 ba) 5.05 a 3.31 a 5.42 a 5.76 a 4.42 a 6.06 a 4.77 a
Leaf 6.23 a 4.67 a 4.66 a 5.68 a 5.03 a 5.04 a 5.59 a 5.22 a
Olives 5.20 ab 5.45 ab 4.35 ab 6.29 b 5.21 ab 4.98 ab 6.87 b 1.70 a
Flowers 5.16 a 5.91 a 5.77 a 5.28 a 4.69 a 5.42 a 5.24 a 5.00 a
Banana 4.84 ab 4.14 a 4.49 ab 6.43 b 6.03 ab 5.47 ab 4.43 ab 4.36 ab
Tomato 5.25 a 5.22 a 4.47 a 5.77 a 5.58 a 5.33 a 4.45 a 5.43 a
Almond 4.34 a 4.34 a 4.55 a 5.98 a 5.07 a 5.90 a 4.93 a 5.21 a
Artichoke 4.29 a 4.29 a 4.40 a 5.76 a 5.47 a 5.79 a 5.61 a 4.46 a
Apple 4.42 a 5.17 a 5.01 a 4.74 a 5.56 a 4.90 a 5.16 a 6.39 a
Walnut 3.99 a 4.60 ab 4.09 a 6.75 b 5.06 ab 5.64 ab 4.58 ab 5.76 ab
Hay 6.63 a 6.08 a 4.97 a 5.31 a 4.46 a 6.41 a 4.14 a 4.68 a
Butter 4.29 a 5.09 a 4.77 a 4.69 a 5.31 a 6.14 a 4.90 a 5.47 a
Bitter 3.69 a 4.08 a 4.46 a 4.72 a 4.00 a 4.55 a 6.41 ab 8.98 b
Sweet 3.74 a 4.73 a 5.10 a 6.41 a 5.18 a 5.37 a 4.60 a 4.77 a
Pungent 4.92 a 4.53 a 3.39 a 5.23 a 4.64 a 5.12 a 5.86 a 6.16 a
Astringency 5.11 a 4.74 a 4.78 a 4.77 a 4.30 a 4.69 a 4.93 a 7.99 b
Green notes 30.60 b 24.69 ab 21.42 a 28.92 ab 25.78 ab 27.30 ab 25.97 ab 24.89 ab
Floral notes 9.44 a 11.00 a 10.54 a 9.97 a 10.00 a 11.56 a 10.15 a 10.47 a
Fruity notes 24.06 a 24.32 a 22.87 a 29.21 a 27.45 a 26.59 a 25.84 a 23.09 a
Taste notes 13.72 a 13.35 a 12.63 a 14.72 a 12.94 a 14.37 a 17.20 ab 23.12 b
Satisfaction 15.11 a 18.64 a 10.98 a 22.18 a 17.00 a 15.54 a 16.79 a 10.80 a
a) Rows: values with the same letter are not statistically different at p ¼ 0.05 separately for region, cultivar, ripening stage, and
‘‘region � cultivar’’ interaction.
206 D. Tura et al. Eur. J. Lipid Sci. Technol. 2013, 115, 196–210
� 2012 WILEY-VCH Verlag GmbH & Co. KGaA, Weinheim www.ejlst.com
The genetic origin was of course important in character-
izing the oils, as proved by previous works [11, 12, 25, 26]
although at a lesser extent than the region of cultivation. The
three cultivars were well identified, although ‘‘Casaliva’’ and
‘‘Frantoio’’ showed similar aromatic profile, a reasonable
explanation being their possible close genetic origin [27].
Oils from ‘‘Casaliva’’ and ‘‘Frantoio’’ confirmed a very
similar aromatic composition with high levels of volatile com-
pounds, while ‘‘Leccino’’ was characterized by a low content.
The oils from three cultivars had a sensorial profile slightly
different: more prominent in ‘‘Casaliva’’, less in ‘‘Leccino’’
and ‘‘Frantoio’’ in the middle.
The ripening stages affected both the aromatic and the
sensorial features of the oils, with slight differences. Also in
this case, the oils from ‘‘green’’ fruits were better identified
by the chemical rather than the sensorial assessment. The
volatile compounds were at the highest concentration at
this early stage and decreased during olives ripening, as also
found in other works [28]. The same trend was detected for
phenols. For this reason the oils from ‘‘green’’ olives were less
appreciated by the panel test, being evaluated as too ‘‘leafy’’
and bitter, due to particularly for highest concentration of
C6 compounds from LOX of LnA.
Also the interactions between region and cultivar showed
a much clear differentiation by chemical than by sensorial
attributes. ‘‘Casaliva’’ and ‘‘Frantoio’’ from Abruzzo showed
a similar composition except for trans-2-hexenal, C6 com-
pounds, total aldehydes and volatiles, that were higher in the
Figure 3. Oil sensorial profile: plots of the first two canonical functions for region, cultivar, ripening stage, and ‘‘region T cultivar’’ interaction
(within brackets: percent of variance explained by function). See Table 6 for values and coefficients of functions. Legend: ^, centroid;
Ab, Abruzzo; Lo, Lombardy; Tu, Tuscany; Ca, Casaliva; Fr, Frantoio; Lc, Leccino; 1, green; 2, veraison; 3, ripe.
Eur. J. Lipid Sci. Technol. 2013, 115, 196–210 Regional olive oil cultivars comparison 207
� 2012 WILEY-VCH Verlag GmbH & Co. KGaA, Weinheim www.ejlst.com
second cultivar, while ‘‘Casaliva’’ scored high for ‘‘lawn’’ and
‘‘green’’ notes. A similar behavior was shown in Lombardy,
but in this case the above aromatic compounds were higher in
‘‘Casaliva’’. ‘‘Frantoio’’ from Tuscany, with high ‘‘olives’’
flavor, showed an ambiguous trend because for some volatiles
it was similar to ‘‘Casaliva’’ from Abruzzo, while for other it
was more similar to ‘‘Leccino’’ from Lombardy. ‘‘Leccino’’
from Abruzzo was quite different compared to the two other
regions, that were more comparable for low content of some
volatile compounds, particularly in ‘‘Leccino’’ from Tuscany.
The latter showed also a low flavor of ‘‘olives’’ and scored
high for strong sensorial notes, given its high content in total
phenols.
Overall, even if the place of production resulted as the
main discriminating factor for oil (chemical) characteriz-
ation, the influence of the cultivar, and the fruit ripening
stage should not be underestimated and a case by case assess-
ment should be regarded to the aim of a sound evaluation of
the overall quality of a virgin olive oil.
5 Conclusions
This study, carried out for two years on three olive cultivars
grown in three Italian regions at three different ripening
stages has clearly shown that the flavor profiles of oils depend
mainly from their geographical origin (environmental influ-
ence), than from cultivar (genetic influence) and finally from
fruit maturation at harvest (influence of the ripening stage).
Moreover, this research has confirmed that the chemical
aromatic composition is more effective in characterizing
the geographical origin of olive oil, the cultivar, the fruit
ripening stage, and the ‘‘region � cultivar’’ interactions than
the sensorial evaluation by a trained panel. Furthermore, the
oils from the three regions were well characterized by aro-
matic chemical and sensorial profiles. This brought out the
strong influence of macroclimatic environments on extra
virgin olive oil attributes.
The oils from ‘‘Casaliva’’ and ‘‘Frantoio’’, showed similar
aromatic and sensorial profile but were well differentiated
Table 6. Oil sensorial profile: function coefficients for region, cultivar, ripening stage, and ‘‘region T cultivar’’ interaction of plots in Fig. 3
Model Function Eigenvalues % Variance % Cumulative Correlation l Wilks x2 df Sig.
Region 1 5.511 85.1 85.1 0.920 0.078 56 34 0.010
2 0.964 14.9 100.0 0.701 0.509 15 16 0.535
Cultivar 1 1.684 79.3 79.3 0.792 0.259 30 34 0.050
2 0.438 20.7 100.0 0.552 0.695 8 16 0.949
Ripening 1 2.261 58.6 58.6 0.833 0.118 47 34 0.036
2 0.599 41.4 100.0 0.784 0.385 21 16 0.178
Region � cultivar 1 8.962 47.8 47.8 0.948 0.001 136 119 0.013
2 5.737 30.6 78.5 0.923 0.009 91 96 0.049
3 1.812 9.7 88.1 0.803 0.064 54 75 0.630
Descriptor
Region Cultivar Ripening Region � cultivar
Fx 1 Fx 2 Fx 1 Fx 2 Fx 1 Fx 2 Fx 1 Fx 2 Fx 3
Lawn �0.897 0.224 �0.854 �0.351 �0.515 0.091 0.296 �2.084 0.963
Leaf 0.772 0.186 �0.455 �0.509 �0.520 �0.761 �0.924 0.172 0.177
Olives 0.231 0.324 0.423 0.478 0.402 1.333 �0.050 0.633 �0.633
Flowers �0.939 0.216 0.299 �0.247 �0.019 �0.332 0.483 �0.958 �0.768
Banana 0.961 0.172 0.026 0.572 0.207 �0.131 �0.343 1.073 0.557
Tomato 0.569 0.611 0.787 0.306 �0.524 0.988 0.534 1.909 0.099
Almond �0.464 0.486 0.991 0.490 0.050 0.937 0.939 0.418 �0.525
Artichoke �0.289 0.708 0.021 �0.249 �0.315 �0.832 0.004 �0.868 �0.281
Apple �0.479 0.616 0.254 �0.353 0.180 0.291 1.203 0.182 0.759
Walnut 1.305 0.063 �1.205 0.318 0.084 �0.640 �1.658 0.011 0.639
Hay 0.033 �0.546 �0.210 0.790 0.557 �0.597 �0.478 �0.812 0.160
Butter 1.121 0.308 0.457 �0.209 0.435 �0.058 �0.655 0.877 �0.009
Bitter �1.965 0.526 0.905 0.016 �1.311 �0.038 1.877 �0.437 �0.926
Sweet �0.047 0.498 �0.080 �0.262 �0.081 0.524 0.544 0.846 0.102
Pungent �0.190 0.131 �0.229 �0.874 0.719 �0.214 �0.146 �0.450 �0.259
Astringency 0.210 �0.056 0.161 1.192 1.581 0.304 0.448 0.990 0.735
Satisfaction 0.255 �0.828 �0.855 0.041 0.750 �0.798 �1.004 �0.020 0.126
Fx, function.
208 D. Tura et al. Eur. J. Lipid Sci. Technol. 2013, 115, 196–210
� 2012 WILEY-VCH Verlag GmbH & Co. KGaA, Weinheim www.ejlst.com
from the more genetically distant ‘‘Leccino’’. Also the olive
ripening stage heavily affected the aromatic quality, the
‘‘green’’ stage being better characterized by the chemical
aromatic profile, while the ‘‘ripe’’ stage was better charac-
terized by the sensorial assessment. However, it has to be
taken in account that the influence of olive ripening on oil
quality is also related to seasonal conditions which could
affect minor compounds, e.g., volatiles, phenols, and toco-
pherols [28, 29]. Finally, the interactions ‘‘region � cultivar’’
and also ‘‘cultivar � year’’ [30] were significant in differen-
tiating the oils, particularly by chemical composition. By
these peculiar aromatic and sensorial profiles it was possible
to distinguish the oils based on their geographical and genetic
origin, and their possible interactions, confirming some
results by not-destructive methods, e.g., electronic nose,
NMR, IR [16, 19, 20] or by traditional analysis, e.g., anti-
oxidant compounds [7].
Therefore the differences induced by geographical origin,
cultivar, year (seasonal conditions), olive ripening stage at
harvest, and their interactions, could be effective factors in
addressing marketing of extra virgin olive oils, since they can
influence the inner quality and thus the consumer appreci-
ation in turn.
Furthermore, the growing information available on
monovarietal olive oils increase our knowledge in order to
get a better characterization of the commercial product,
either monovarietal or from a varietal blend. These findings,
that are also related to authentication and characterization,
are all possible tools for protecting olive oils against mislab-
eling and adulteration. This is also particularly relevant for a
better exploitation of the typicality of the products in the form
of Protected Designation of Origin protocols.
The research was funded by the EU Commission, Regulation EC
No. 528/99, in co-operation with the Agriculture Department of
Lombardy Region, Italy. The authors wish to thank the panel
groups of Pescara (CRA – Centro di ricerca per l’olivicoltura e
l’industria olearia), of Savona (O.N.A.O.O.) and Brescia
(A.I.P.O.L.).
Authors contribution:
� Experiment design and manuscript revision: all authors
� Oil analysis: Tura and Serraiocco
� Data processing: Tura and Failla
� Manuscript writing: Tura and Bassi
� English language revision: English native speaker and
professional proofreading
The authors have declared no conflict of interest.
References
[1] Caramia, G., Virgin olive oil. From legend to scientificknowledge of the nutraceutical aspects. Ped. Med. Chir.2004, 26, 433–447 (in Italian).
[2] Caporale, G., Policastro, S., Carlucci, A., Monteleone, E.,Consumer expectations for sensory properties in virgin oliveoils. Food Qual. Prefer. 2006, 17, 116–125.
[3] Zunin, P., Boggia, R., Salvadeo, P., Evangelisti, F.,Geographical traceability of West Liguria extra virgin oliveoils by the analysis of volatile terpenoid hydrocarbons.J. Chromatogr. A 2005, 1089, 243–249.
[4] Aparicio, R., Luna, G., Characterisation of monovarietalvirgin olive oils. Eur. J. Lipid Sci. Technol. 2002, 104, 614–627.
[5] Aguilera, M. P., Beltran, G., Ortega, D., Fernandez, A. et al.,Characterisation of virgin olive oil of Italian olive cultivars:‘Frantoio’ and ‘Leccino’, grown in Andalusia. Food Chem.2005, 89, 387–391.
[6] Gigliotti, C., Tura, D., Pedo, S., Typical elements of mono-varietal oils from Garda lake area. In: Proceeding of theNational Conference on Olive Germplasm and Oil Typicality,5 December 2003, pp. 235–239 (in Italian).
[7] Tura, D., Gigliotti, C., Pedo, S., Failla, O. et al., Influence ofcultivar and site of cultivation on levels of lipophilic andhydrophilic antioxidants in virgin olive oils (Olea europaeaL.) and correlations with oxidative stability. Sci. Hortic. 2007,112, 108–119.
[8] Koprivnjak, O., Conte, L. S., Bencic, D., Totis, N.,Application of solid-phase microextraction of olive oil vola-tiles on varieties characterization. Riv. Ital. Sostanze Grasse.2003, 80, 35–40.
[9] Angerosa, F., Influence of volatile compounds on virgin oliveoil quality evaluated by analytical approaches and sensorpanels. Eur. J. Lipid Sci. Technol. 2002, 104, 639–660.
[10] Luykx, D. M. A. M., van Ruth, S. M., An overview ofanalytical methods for determining the geographical originof food products. Food Chem. 2008, 107, 897–911.
[11] Reboredo-Rodriguez, P., Gonzalez-Barreiro, C., Cancho-Grande, B., Simal-Gandara, J., Dunamic headspace/GC–MS to control the aroma fingerprinting of extra-virgin oliveoil from the same and different olive varieties. Food Control2012, 25, 684–695.
[12] Benincasa, C., De Nino, A., Lombardo, N., Perri, E., et al.,Assay of aroma active components of virgin olive oils fromsouthern Italian regions by SPME-GC/ion trap mass spec-trometry. J. Agric. Food Chem. 2003, 51, 733–741.
[13] Cavaliere, B., De Nino, A., Fourati, H., Lazez, A., et al.,A metabolomic approach to the evaluation of the origin ofextra virgin olive oil: A convenient statistical treatment ofmass spectrometric analytical data. J. Agric. Food Chem.2007, 55, 1454–1462.
[14] Loperz-Feria, S., Cardenas, S., Garcia-Mesa, J. A.,Valcarcel, M., Usefulness of the direct coupling head-space-mass spectrometry for sensory quality characterizationof virgin olive oil samples. Anal. Chim. Acta 2007, 583, 411–417.
[15] Cerrato Oliveros, C., Boggia, R., Casale, M., Armanino, C.,Forina, M., Optimisation of a new headspace massspectrometry instrument – Discrimination of differentgeographical origin olive oils. J. Chromatogr. A 2005, 1076,7–15.
[16] Guadarrama, A., Rodriguez-Mendez, M. L., Sanz, C., Rios,J. L., de Saia, J. A., Electronic nose based on conductingpolymers for the quality control of the olive oil aroma –Discrimination of quality, variety of olive and geographicorigin. Anal. Chim. Acta 2001, 432, 283–292.
Eur. J. Lipid Sci. Technol. 2013, 115, 196–210 Regional olive oil cultivars comparison 209
� 2012 WILEY-VCH Verlag GmbH & Co. KGaA, Weinheim www.ejlst.com
[17] Ballabio, D., Mauri, A., Todeschini, R., Buratti, S.,Geographical classification of wine and olive oil by meansof classification and influence matrix analysis (CAIMAN).Anal. Chim. Acta 2006, 570, 249–258.
[18] Rezzi, S., Axelson, D. E., Heberger, K., Reniero, F., et al.,Classification of olive oils using high throughput flow1H NMR fingerprinting with principal component analysis,linear discriminant analysis and probabilistic neural net-works. Anal. Chim. Acta 2005, 552, 13–24.
[19] Mannina, L., Patumi, M., Proietti, N., Bassi, D., Segre,A. L., Geographical characterization of Italian extra virginolive oils using high-field 1H NMR spectroscopy. J. Agric.Food Chem. 2001, 49, 2687–2696.
[20] Sinelli, N., Casiraghi, E., Tura, D., Downey, G.,Characterisation and classification of Italian virgin olive oilsby near- and mid-infrared spectroscopy. JNIRS 2008, 16,335–342.
[21] Uceda, M., Factores que influyen en la calidad del aceitede oliva. In: Proc. Symp. ‘‘Expoliva 1983’’, Jaen, Spain(in Spanish).
[22] Commission Regulation (EC) no. 1989/2003, AmendingRegulation (EEC) no. 2568/91 on the characteristics of oliveoil and olive-pomace oil and on the relevant methods ofanalysis. Off. J. Eur. Union 2003, L295, 57–77.
[23] Angerosa, F., Di Giacinto, L., d’Alessandro, N.,Quantitation of some flavor components responsible forthe ‘‘green’’ attributes in virgin olive oils. J. High Resolut.Chromatogr. 1997, 20, 507–510.
[24] Commission Regulation (EC) no. 796/2002, AmendingRegulation (EEC) no. 2568/91 on the characteristics of olive
oil and olive-pomace oil and on the relevant methods ofanalysis and the additional notes in the Annex to CouncilRegulation (EEC) no. 2658/87 on the tariff and statisticalnomenclature and on the Common Customs Tariff. Off. J.Eur. Union 2002, L128, 8–28.
[25] Bononi, M., Tura, D., Bassi, D., Tateo, F., Solid-phasemicroextraction in the analysis of the volatile fractionof extra-virgin olive oil from fourteen cultivars grown inthe lake Garda region (Italy). Ital. J. Food Sci. 2008, 20,119–126.
[26] Tura, D., Failla, O., Bassi, D., Pedo, S., Serraiocco, A.,Cultivar influence on virgin olive (Olea europaea L.) oil flavorbased on aromatic compounds and sensorial profile. Sci.Hortic. 2008, 118, 139–148.
[27] Bassi, D., Tura, D., Geuna, F., Failla, O., Pedo, S.,Characterisation of local olive (Olea europaea L.) accessionsby oil composition, morphological and molecular markersmethods. Acta Hortic. 2002, 586, 57–60.
[28] Tura, D., Failla, O., Pedo, S., Gigliotti, C., et al., Effect ofseasonal weather variability on olive oil composition in north-ern Italy. Acta Hort. 2008, 791, 769–776.
[29] Pannelli, G., Servili, M., Selvaggini, R., Baldioli, M.,Montedoro, G. F., Effect of agronomic and seasonalfactors on olive (Olea europaea L.) production and on thequalitative characteristics of the oil. Acta Hort. 1994, 356,239–244.
[30] Tura, D., Failla, O., Bassi, D., Pedo, S., Serraiocco, A.,Environmental and seasonal influence on virgin olive (Oleaeuropaea L.) oil volatiles in northern Italy. Sci. Hortic. 2009,122, 385–392.
210 D. Tura et al. Eur. J. Lipid Sci. Technol. 2013, 115, 196–210
� 2012 WILEY-VCH Verlag GmbH & Co. KGaA, Weinheim www.ejlst.com


![digital.csic.esdigital.csic.es/bitstream/10261/40849/1/ARTICULOS290266[1].pdf · north from the city All olive orchards composed hy negrinha cultivar and were similar in age 40 and](https://static.fdocuments.in/doc/165x107/5c24e94209d3f2ae178b6a48/1pdf-north-from-the-city-all-olive-orchards-composed-hy-negrinha-cultivar.jpg)