Regional Air Quality & Airport Impacts
39
Regional Air Regional Air Quality Quality & & Airport Impacts Airport Impacts Larry Greene Larry Greene Executive Director/ Executive Director/ Air Pollution Control Officer Air Pollution Control Officer Association of California Airports Association of California Airports Annual Conference Annual Conference September 16-18, 2009 September 16-18, 2009
-
Upload
fennella-peppard -
Category
Documents
-
view
41 -
download
1
description
Regional Air Quality & Airport Impacts. Association of California Airports Annual Conference September 16-18, 2009. Larry Greene Executive Director/ Air Pollution Control Officer. Our District Mission. - PowerPoint PPT Presentation
Transcript of Regional Air Quality & Airport Impacts
Regional Air Quality Regional Air Quality & &
Airport ImpactsAirport Impacts
Regional Air Quality Regional Air Quality & &
Airport ImpactsAirport Impacts
Larry GreeneLarry GreeneExecutive Director/Executive Director/Air Pollution Control OfficerAir Pollution Control Officer
Larry GreeneLarry GreeneExecutive Director/Executive Director/Air Pollution Control OfficerAir Pollution Control Officer
Association of California AirportsAssociation of California Airports
Annual ConferenceAnnual Conference
September 16-18, 2009September 16-18, 2009

Our District MissionOur District MissionOur District MissionOur District Mission
““Achieve clean air goals Achieve clean air goals by leading the region in by leading the region in protecting public health protecting public health
and the environment and the environment through innovative and through innovative and
effective programs, effective programs, dedicated staff, dedicated staff,
community involvement community involvement and public education.”and public education.”

Health Effects – We Health Effects – We knowknow
Health Effects – We Health Effects – We knowknow
• Air pollution kills people
• Lung Disease/Toxic effects/Heart attacks
•Air pollution hurts the most vulnerable
• Asthma (children)
• Shortens the life of the elderly
•Air pollution effects our economy
• Secondary effects and quality of life
• Air pollution kills people
• Lung Disease/Toxic effects/Heart attacks
•Air pollution hurts the most vulnerable
• Asthma (children)
• Shortens the life of the elderly
•Air pollution effects our economy
• Secondary effects and quality of life

Air Pollutants of Air Pollutants of ConcernConcern
Air Pollutants of Air Pollutants of ConcernConcern
Ozone
(ROG + NOx)
Particulates
(NOx, SOx, ROG, Ammonia)
Greenhouse
Gases – (CO2, Methane)
Toxics
Diesel particles,
Benzene, Chromium, Asbestos
Haze

Federal/State/LocalFederal/State/LocalFederal/State/LocalFederal/State/Local
- Federal EPA - planes, trains, automobiles, large industrial sources, national standards. Federal Clean Air Act
-California Air Resources Board - vehicles, fuels, consumer products, area sources, air toxic control measures. California Clean Air Act.
- Local districts – permit industrial sources, inspect, respond to complaints, agricultural burning, asbestos, CEQA review, public education. District rules/Board resolutions resolutions/Policies

District BackgroundDistrict Background District BackgroundDistrict Background

35 Local Air Agencies
Work for local Boards of Directors
Unique focus on local air quality and issues

FederalFederal
OzoneOzone
Non-attainmentNon-attainment
AreaArea120 m
iles

We’re Geographically-We’re Geographically-ChallengedChallenged
We’re Geographically-We’re Geographically-ChallengedChallenged
Summer Ground-level Ozone (smog) Summer Ground-level Ozone (smog)
NOX + VOC+Sunlight = 0zoneNOX + VOC+Sunlight = 0zone
+

We’re Geographically-We’re Geographically-ChallengedChallenged
We’re Geographically-We’re Geographically-ChallengedChallenged
Winter Particulate Pollution Winter Particulate Pollution
Emissions + low wind + cold temperatures = High Particulate levelsEmissions + low wind + cold temperatures = High Particulate levels

Air Quality Trends - OzoneAir Quality Trends - OzoneConcentrations, 1980 - 2008Concentrations, 1980 - 2008
1 hour*1 hour* 35% 35%
improvementimprovement
8 hour8 hour16% 16%
improvementimprovement
0.000
0.020
0.040
0.060
0.080
0.100
0.120
0.140
0.160
0.180
0.200
1980 1982 1984 1986 1988 1990 1992 1994 1996 1998 2000 2002 2004 2006 2008
Years
Pa
rts
pe
r m
illi
on
1Hr 3Yr 4th High
8Hr 3Yr 4th Hi Avg
Fed 1Hr Standard(revoked)
CA 1Hr Standard
Fed 8Hr Avg Std(1997)
Fed 8Hr Avg Std(2008)
*2008 data adjusted for proposed exceptional events due to wildfires.*2008 data adjusted for proposed exceptional events due to wildfires.

Regional EmissionsRegional EmissionsRegional EmissionsRegional Emissions

Current Sacramento Regional NOx – Current Sacramento Regional NOx – 167 TPD167 TPD
Other6%
Trains5%
Other4%
FarmEquip
6%Constr&Mining+
Comm&Ind Equip.
11%Boats/Ships
5%
Automobiles6%
Lt/Med Duty Trucks
11%
Heavy Duty Diesel Trucks
35%
Boilers/Heaters/
Ag Pumps9%
Other Mobile32%
On-Road Mobile
57%
Stationary9%
Area-Wide 2%(Residential Comb &
Ag Burn)

Current Sacramento Regional VOC Current Sacramento Regional VOC – 136 TPD– 136 TPD
ConsumerProducts
10%
Arch Coatings5%
Other6%
Other6%
Other11%
Solvent/Coatings
5%
Off-RoadEquipment
10%
Rec Boats13%
Other9%
Automobiles12%
Lt./MedDuty Trucks
13%
Other Mobile30%
On-Road Mobile
33%
Stationary16%
Area-Wide 21%

Emission Source Equivalents Emission Source Equivalents 1 TPD of VOC and NOx (Year 2019)1 TPD of VOC and NOx (Year 2019)
18,000 HD trucks18,000 HD trucks
200,000 cars*200,000 cars*
72 Locomotives72 Locomotives(NOx only)(NOx only)
310 Gas Stations**310 Gas Stations**(VOC only)(VOC only)
* Base on average vehicle fleet mix** No additional controls after 2005
135 Commercial Jet LTOs135 Commercial Jet LTOs

Regional AirportsRegional Airports
Sacramento International Sacramento International Airport (SMF)Airport (SMF)– > 72,000 LTOs> 72,000 LTOs
McClellan Airfield (MCC)McClellan Airfield (MCC)– > 5000 LTOs> 5000 LTOs
Mather Airport (MHR)Mather Airport (MHR)– > 50,000 LTOs> 50,000 LTOs
Sacramento Executive Sacramento Executive Airport (SAC)Airport (SAC)– > 67,000 LTOS> 67,000 LTOS
Franklin Field (F72)Franklin Field (F72)– > 18,000 LTOs> 18,000 LTOs

Airport Operations (LTOs)Airport Operations (LTOs)Number of LTO Operations
0
20000
40000
60000
80000
100000
120000
140000
160000
180000
200000
SacExec SMF MHR SFO OAK LAX
# L
TO
s
Commercial
AirTaxi
General
Military
Source: FAA 5010 report (downloaded Aug 27, 2009).

Airport Emissions (VOC & NOx)Airport Emissions (VOC & NOx)
Aircraft & Ground Support Equipment at AirportsVOC & NOx Emissions, Tons/Year
0
500
1000
1500
2000
2500
3000
3500
4000
4500
5000
SacExec SMF MHR SFO OAK LAX
To
ns/
Yea
r
VOC
NOx
Source: CARB 2009 Almanac (2008 Emissions) for aircraft & GSE by county and using ratio of LTOs from FAA 5010 report (downloaded Aug 27, 2009)

Airport Emissions (Particulate)Airport Emissions (Particulate)Aircraft & Ground Support Equipment at Airports
PM Emissions, Tons/Year
0
10
20
30
40
50
60
70
80
SacExec SMF MHR SFO OAK LAX
PM
T
on
s/Y
ear
Source: CARB 2009 Almanac (2008 Emissions) for aircraft & GSE by county and using ratio of LTOs from FAA 5010 report (downloaded Aug 27, 2009)

Airport Emissions (COAirport Emissions (CO22))
Aircraft & Ground Support Equipment at AirportsCO2 Emissions, Tons/Year
0
200000
400000
600000
800000
1000000
1200000
1400000
1600000
SacExec SMF MHR SFO OAK LAX
To
ns/
Yea
r
Source: Estimated using BAAQMD 2007 GHG CO2 estimates for Aircraft in San Mateo & Alameda Counties (Source of Inventory of Bay Area Greenhouse Gas Emissions, Dec 2008)

Airport Emissions (CO)Airport Emissions (CO)Aircraft & Ground Support Equipment at Airports
CO Emissions, Tons/Year
0
1000
2000
3000
4000
5000
6000
7000
8000
9000
SacExec SMF MHR SFO OAK LAX
To
ns/
Yea
r
Source: CARB 2009 Almanac (2008 Emissions) for aircraft & GSE by county and using ratio of LTOs from FAA 5010 report (downloaded Aug 27, 2009)

Airport Pb (Lead) EmissionsAirport Pb (Lead) Emissions Major sourcesMajor sources
– Industrial sourcesIndustrial sources SmeltersSmelters BoilersBoilers Waste incineratorsWaste incinerators Glass & cement manufacturingGlass & cement manufacturing
– General aviation (45 % national lead General aviation (45 % national lead emissions) emissions) Gasoline (Avgas)Gasoline (Avgas)
Source: http://www.epa.gov/otaq/aviation.htm, Lead Emissions from the Use of Leaded Aviation Gasoline in the United States (PDF) (82 pp, 2.5MB, October 2008, EPA-420-R-08-020)

Aircraft Only at AirportsLead Emissions, Pounds/Year
0
200
400
600
800
1000
1200
1400
SacExec SMF MHR SFO OAK LAX
Lea
d
Po
un
ds/
Yea
r

Pb (Lead) StandardPb (Lead) Standard EPA strengthens NAAQS – October 15, 2008EPA strengthens NAAQS – October 15, 2008
– Reduced from 1.5 ug/m3 to 0.15 ug/m3Reduced from 1.5 ug/m3 to 0.15 ug/m3 Scientific evidence expanded dramatically since Scientific evidence expanded dramatically since
the 1970sthe 1970s– Over 6000 new studies on lead health effectsOver 6000 new studies on lead health effects– Children highly vulnerable to effects from leadChildren highly vulnerable to effects from lead– Exposure linked to effects on IQ, learning, Exposure linked to effects on IQ, learning,
memory and behaviormemory and behavior Revision will yield substantial benefitsRevision will yield substantial benefits
– $3.7 – $6.9 billion expected increase in lifetime $3.7 – $6.9 billion expected increase in lifetime earnings as a result of avoiding IQ lossearnings as a result of avoiding IQ loss

Pb (Lead) StandardPb (Lead) Standard
Improve existing monitoring networkImprove existing monitoring network– Require monitoring in areas with sources that emit > Require monitoring in areas with sources that emit >
1tpy1tpy– Urban areas with populations greater more than 500,000Urban areas with populations greater more than 500,000
EPA reconsiders ambient monitoring requirements – July EPA reconsiders ambient monitoring requirements – July 22, 200922, 2009– Additional monitoring near sourcesAdditional monitoring near sources
– Review monitoring Review monitoring requirementsrequirements for urban areas for urban areas
– Revised monitoring requirements expected late summer Revised monitoring requirements expected late summer 2009 will discuss general aviation airports 2009 will discuss general aviation airports
EPA expects to issue final rule Oct 2009EPA expects to issue final rule Oct 2009

ToxicsToxics Airports provide multiple sources of pollutionAirports provide multiple sources of pollution
– Aircraft, ground equipment, facilities, vehicle trafficAircraft, ground equipment, facilities, vehicle traffic Studies raise concern about air toxics from airportsStudies raise concern about air toxics from airports
– Chicago O’Hare (2000)Chicago O’Hare (2000)– TF Green Airport, Warwick, RI (2005-2006)TF Green Airport, Warwick, RI (2005-2006)– Teterboro Airport, New Jersey (2006)Teterboro Airport, New Jersey (2006)– LAX Study by UCLA/CARB (2005-2006)LAX Study by UCLA/CARB (2005-2006)
Pollutants of concernPollutants of concern– OrganicsOrganics
Acetaldehyde, Acrolein, Benzene, Toluene, Acetaldehyde, Acrolein, Benzene, Toluene, Formaldehyde, Naphthalene, 1,3 Butadiene, PAHsFormaldehyde, Naphthalene, 1,3 Butadiene, PAHs
– In-organics & MetalsIn-organics & Metals Arsenic, Beryllium, Cadmium, Chromium, Copper, Arsenic, Beryllium, Cadmium, Chromium, Copper,
Manganese, Nickel, and ZincManganese, Nickel, and Zinc More research neededMore research needed
– Ongoing efforts to identify, evaluate and reduce riskOngoing efforts to identify, evaluate and reduce risk

Major ProjectsMajor ProjectsMajor ProjectsMajor Projects
Sacramento International Master PlanSacramento International Master PlanMather Field Master PlanMather Field Master Plan
Sacramento International Master PlanSacramento International Master PlanMather Field Master PlanMather Field Master Plan

Sacramento International AirportSacramento International Airport Environmental Impact Report Environmental Impact Report
– California Environmental Quality Act California Environmental Quality Act (CEQA)(CEQA)
Assessment of Air Quality ImpactsAssessment of Air Quality Impacts– Individual technical analysesIndividual technical analyses
emissions inventoriesemissions inventories dispersion modelingdispersion modeling analysis of potential CO “hot spots”analysis of potential CO “hot spots” human health risk assessmenthuman health risk assessment Applicability analysesApplicability analyses
NOx emission were predicted to exceed NOx emission were predicted to exceed the CEQA significance threshold and the CEQA significance threshold and required mitigationrequired mitigation

General ConformityGeneral Conformity Clean Air Act - federal departments may not engage, Clean Air Act - federal departments may not engage,
support, fund, or approve any activity that does not support, fund, or approve any activity that does not conform to an approved SIP.conform to an approved SIP.
Applies to non-attainment area pollutantsApplies to non-attainment area pollutants– Ozone (NOx, VOC), PM10 Ozone (NOx, VOC), PM10 – PM2.5 (under new standard)PM2.5 (under new standard)
Examples:Examples:– leasing of federal land,leasing of federal land,– private construction on federal land,private construction on federal land,– airport construction and expansions,airport construction and expansions,– reuse of military bases, andreuse of military bases, and– construction of federal office buildingsconstruction of federal office buildings
Airport emissions inventory included in SIPs.Airport emissions inventory included in SIPs.

Aircraft Operations + Ground Support Equipment Aircraft Operations + Ground Support Equipment EmissionsEmissions
Year of OperationsYear of Operations VOCVOC(tons/day)(tons/day)
NOxNOx(tons/day)(tons/day)
2011 Projected Emissions Inventory2011 Projected Emissions Inventory Aircraft OperationsAircraft Operations Ground Support EquipmentGround Support Equipment
0.60.60.060.06
2.22.20.290.29
2014 Projected Emissions Inventory2014 Projected Emissions Inventory Aircraft OperationsAircraft Operations Ground Support EquipmentGround Support Equipment
0.60.60.050.05
2. 42. 40.250.25
2017 Projected Emissions Inventory2017 Projected Emissions Inventory Aircraft OperationsAircraft Operations Ground Support EquipmentGround Support Equipment
0.60.60.050.05
2.72.70.220.22
2018 Projected Emissions Inventory2018 Projected Emissions Inventory Aircraft OperationsAircraft Operations Ground Support EquipmentGround Support Equipment
0.60.60.050.05
2.82.80.220.22

Master Plan MitigationMaster Plan Mitigation Construction EmissionsConstruction Emissions
– Standard Construction Mitigation:Standard Construction Mitigation: Construction must meet a 20% Construction must meet a 20%
NOx and 45% PM10 emissions NOx and 45% PM10 emissions reduction compared to the reduction compared to the CARB fleet average.CARB fleet average.
Exhaust cannot exceed 40% Exhaust cannot exceed 40% opacity for more than 3 opacity for more than 3 minutes 1 hour period.minutes 1 hour period.
– Off-site mitigation fee paid for Off-site mitigation fee paid for NOx emissions that exceeded 85 NOx emissions that exceeded 85 pounds/day threshold:pounds/day threshold: Received credit for Received credit for
implementing Standard implementing Standard Construction Mitigation. Construction Mitigation.
ERCs used to offset a portion ERCs used to offset a portion of the off-site mitigation fee.of the off-site mitigation fee.

Master Plan MitigationMaster Plan Mitigation Operational Emissions Operational Emissions
- Expand use of low emissionExpand use of low emission
technologies when purchasing technologies when purchasing
new mobile equipment andnew mobile equipment and
constructing terminal facilitiesconstructing terminal facilities Specific Examples in the Mitigation Monitoring and Specific Examples in the Mitigation Monitoring and
Reporting Plan:Reporting Plan: Electric charging stations for Ground Service Electric charging stations for Ground Service
Equipment (GSE)Equipment (GSE) Gate furnished A/C and power for aircraftGate furnished A/C and power for aircraft Low emitting buses for on-site travelLow emitting buses for on-site travel Solar-energy cells for electricitySolar-energy cells for electricity Hydrant fueling system to reduce fuel truck tripsHydrant fueling system to reduce fuel truck trips

Sacramento County Airport Systems Sacramento County Airport Systems
Emission Reduction Credits (ERCs)Emission Reduction Credits (ERCs) Four past ERC applications:Four past ERC applications:
– Modification to jet fueling delivery Modification to jet fueling delivery system (2005)system (2005)
– Modernization of shuttle bus fleet Modernization of shuttle bus fleet (2006)(2006)
– Modification to air bridges to reduce Modification to air bridges to reduce the use of APUs on aircraft (2007)the use of APUs on aircraft (2007)
– Electrification of some ground Electrification of some ground support equipment (2006)support equipment (2006)

Jet Fuel Delivery SystemJet Fuel Delivery System Jet fuel pipeline eliminated the need to truck jet fuelJet fuel pipeline eliminated the need to truck jet fuel
– 3.96 tons/year of NOx ERCs were generated for years 3.96 tons/year of NOx ERCs were generated for years 2006 - 20102006 - 2010
ERCs were issued for a 10 – year life per SCAS requestERCs were issued for a 10 – year life per SCAS request ERCs are adjusted down over the credit life to reflect ERCs are adjusted down over the credit life to reflect
new lower state and federal emission standards for new lower state and federal emission standards for trucks:trucks:– 1.7 tons/year of NOx ERCs were generated for years 1.7 tons/year of NOx ERCs were generated for years
2011 - 20152011 - 2015 ERCs enforced through permit conditions in the Permit ERCs enforced through permit conditions in the Permit
to Operate for the new fueling terminalto Operate for the new fueling terminal– SCAS and company supplying fuel jointly hold SCAS and company supplying fuel jointly hold
permit permit ERCs have been surrendered for CEQA mitigationERCs have been surrendered for CEQA mitigation

Shuttle Bus ModernizationShuttle Bus Modernization
Replaced 12 diesel and 12 natural gas shuttle busesReplaced 12 diesel and 12 natural gas shuttle buses ERC issued for a 10 – year life per SCAS requestERC issued for a 10 – year life per SCAS request
– 0.5 tons/year of NOx and 0.1 tons/year of PM10 0.5 tons/year of NOx and 0.1 tons/year of PM10 emissions credits generated (years 2007 – 2015)emissions credits generated (years 2007 – 2015)
ERCs adjusted down over the credit life to reflect new ERCs adjusted down over the credit life to reflect new lower state and federal emission standards for trucks:lower state and federal emission standards for trucks:– 0.4 tons/year of NOx and 0.06 tons/year of PM10 0.4 tons/year of NOx and 0.06 tons/year of PM10
emissions credits were generated (year 2016)emissions credits were generated (year 2016)– 0.2 tons/year of NOx and 0.03 tons/year of PM10 0.2 tons/year of NOx and 0.03 tons/year of PM10
emissions credits were generated (year 2017)emissions credits were generated (year 2017) ERCs enforced by conditions in the ERC certificateERCs enforced by conditions in the ERC certificate ERCs surrendered for CEQA mitigationERCs surrendered for CEQA mitigation

Both ERC applications were withdrawn by SCASBoth ERC applications were withdrawn by SCAS– Electrification of Air Bridges ERC application did not Electrification of Air Bridges ERC application did not
meet the enforceability requirementsmeet the enforceability requirements Did not agree to require that airlines use the Did not agree to require that airlines use the
electrification at all timeselectrification at all times– Airlines did not want to take conditions to use Airlines did not want to take conditions to use
electrified equipment at all timeselectrified equipment at all times– Emission reductions from ground support equipment Emission reductions from ground support equipment
could not be quantified due to lack of recordscould not be quantified due to lack of records
Electrification of Air BridgesElectrification of Air Bridges&Ground Support Equipment&Ground Support Equipment

Mather Field Master PlanMather Field Master Plan Environmental Review and Assessment
– Sacramento County Department of Environmental Review and Assessment (DERA) Received approval from BOS, June 2007 Entered agreement with Camp Dresser & McKee
Inc. (CDM) for preparation of the Mather Airport Master Plan Environmental Assessment and California Environmental Quality Act technical studies
Environmental Assessment (EA)– Will be prepared to meet federal NEPA requirements
Environmental Impact Report (EIR)– Will be prepared to meet State CEQA requirements
Reports expected to be published in the Summer 2010
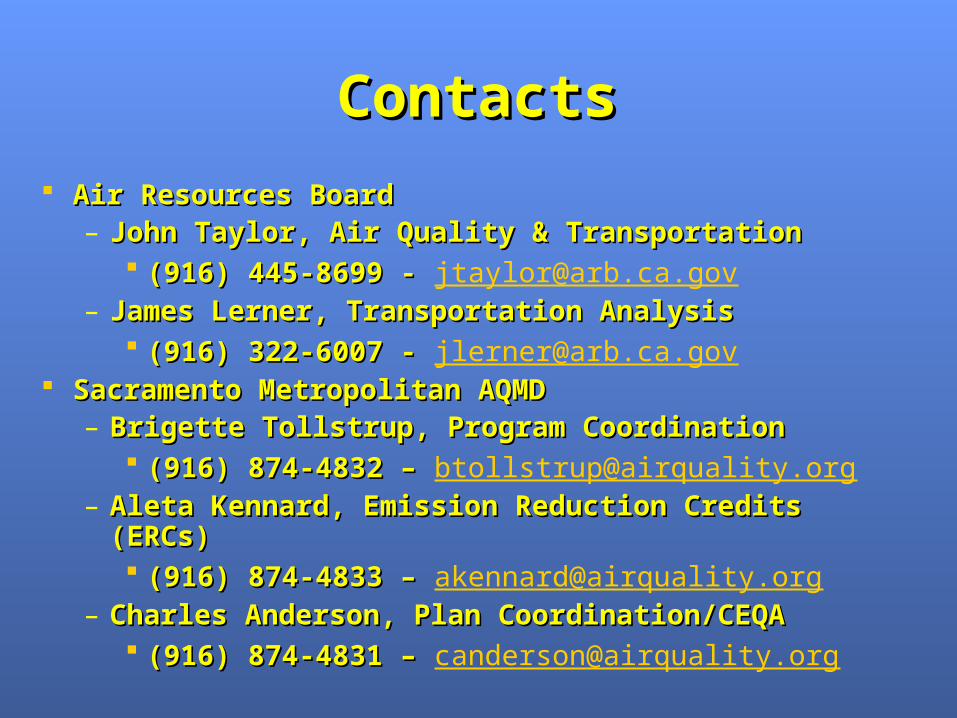
ContactsContacts
Air Resources BoardAir Resources Board– John Taylor, Air Quality & TransportationJohn Taylor, Air Quality & Transportation
(916) 445-8699 - (916) 445-8699 - [email protected]– James Lerner, Transportation AnalysisJames Lerner, Transportation Analysis
(916) 322-6007 - (916) 322-6007 - [email protected] Sacramento Metropolitan AQMDSacramento Metropolitan AQMD
– Brigette Tollstrup, Program CoordinationBrigette Tollstrup, Program Coordination (916) 874-4832 – (916) 874-4832 – [email protected]
– Aleta Kennard, Emission Reduction Credits (ERCs)Aleta Kennard, Emission Reduction Credits (ERCs) (916) 874-4833 – (916) 874-4833 – [email protected]
– Charles Anderson, Plan Coordination/CEQACharles Anderson, Plan Coordination/CEQA (916) 874-4831 – (916) 874-4831 – [email protected]

Questions?Questions?