Reframing Climate and Competitiveness: Is there a … · Reframing Climate and Competitiveness: Is...
43
Reframing Climate and Competitiveness: Is there a Need for Cooperation on National Climate Change Policies? Background paper for the 31 st Round Table on Sustainable Development 2-3 February 2015 OECD Headquarters, Paris Thomas Spencer Richard Baron Michel Colombier Oliver Sartor This paper was prepared under the authority of the Chair of the Round Table on Sustainable Development at the Organisation for Economic Co-operation and Development (OECD). The reasoning and opinions expressed herein do not necessarily reflect the official views of the OECD or the governments of Member countries.
-
Upload
truongdang -
Category
Documents
-
view
215 -
download
0
Transcript of Reframing Climate and Competitiveness: Is there a … · Reframing Climate and Competitiveness: Is...

Reframing Climate and Competitiveness:
Is there a Need for Cooperation
on National Climate Change Policies?
Background paper for the 31st Round Table on Sustainable Development
2-3 February 2015 OECD Headquarters, Paris
Thomas Spencer
Richard Baron
Michel Colombier
Oliver Sartor
This paper was prepared under the authority of the Chair of the Round Table on Sustainable Development at the
Organisation for Economic Co-operation and Development (OECD). The reasoning and opinions expressed herein do
not necessarily reflect the official views of the OECD or the governments of Member countries.

ACKNOWLEDGEMENTS
The authors would like to thank Laurence Tubiana (former Director, IDDRI), who helped to shape
the topic of this Round Table during her tenure, Teresa Ribera (current director, IDDRI), Mathilde Mathieu
and Xin Wang. Simon Upton and Simon Buckle (OECD) provided useful suggestions. The paper also
benefited from interviews with: Maria Mendiluce (WBCSD), Ingrid Barnsley, David Elzinga and Araceli
Fernandez-Pales (IEA) as well as other anonymous experts. Amelia Smith provided editorial advice.
This Round Table event is supported by the European Climate Foundation.

2
TABLE OF CONTENTS
ACKNOWLEDGEMENTS ............................................................................................................................ 1
EXECUTIVE SUMMARY AND ISSUES FOR DISCUSSION .................................................................... 3
INTRODUCTION ........................................................................................................................................... 5
1. CLIMATE POLICY IN THE CONTEXT OF GLOBALISATION ........................................................ 8
1.1 Market Deployment of Low Carbon Technologies:
are more transparent market signals needed? ................................................................................... 8
1.1.1 Fragmented policies and markets ......................................................................................... 10
1.1.2 The fine balance between domestic-oriented policies and gains from international trade .. 11
1.1.3 The risk of multiple standards ............................................................................................. 12
1.2 Transformation and Competitiveness in Energy-Intensive, Trade-Exposed Industries .................. 13
1.3 Research and Development ............................................................................................................. 17
1.4 Summary ......................................................................................................................................... 20
2. THE GLOBAL POLICY LANDSCAPE FOR COOPERATION ON CLIMATE CHANGE .............. 22
2.1 Role of the UNFCCC ...................................................................................................................... 22
2.2 ‘Sectoral Approaches’ Before Copenhagen .................................................................................... 24
2.3 Recent International Cooperative Policy Initiatives ........................................................................ 25
SUMMARY .................................................................................................................................................. 29
REFERENCES .............................................................................................................................................. 31
ANNEX 1: SOLAR PHOTOVOLTAIC SUPPORT POLICIES IN THE EU .............................................. 36
ANNEX 2: SOLAR PHOTOVOLTAIC SUPPORT POLICIES IN CHINA ............................................... 38
ANNEX 3: A TYPOLOGY OF COOPERATION MODES
IN INTERNATIONAL INITIATIVES ON CLIMATE CHANGE ........................................... 42

3
EXECUTIVE SUMMARY AND ISSUES FOR DISCUSSION
In response to the threat of climate change, countries have begun putting in place national policies
to curb their greenhouse gas emissions. These policies will need to be scaled up significantly if the increase
in global average temperature is to be limited to 2°C.
National climate policy efforts are taking place in a global economy increasingly integrated via
flows of goods, capital, ideas and people. Technologies that contribute to the reduction of greenhouse
gases are also increasingly globalised. This interconnectedness means that national climate policies have
international spill-overs, some of which are positive, for instance when investments in low-carbon
technologies in a region deliver cost reductions from which other countries benefit. However, it is also
important to underscore that spill-overs sometimes risk undermining not just the efficiency, but also indeed
the effectiveness of national climate policies.
The international spill-overs of national policies point to three coordination issues, all three critical
for the global transition to a low-carbon economy:
Incoherent market signals. Shared policy and market expectations could be an important
tool to drive strategic decision-making in globalised sectors. There are, however, examples of
deployment policies for low-carbon technologies that suffered greatly from unexpected
international market responses (e.g. photovoltaic panels), resulting in unhelpful trade frictions
and less robust incentives for firms operating in this global sector.
Effectiveness of carbon constraints. Fragmented policies create concerns for policymakers
and firms about trade distortions and ‘emissions leakage’ in energy intensive, trade exposed
sectors. The ‘protective’ measures adopted in response to these concerns hamper the
effectiveness of the constraints placed on carbon emissions in these important sectors.
Effectiveness of public-private R&D in breakthrough technologies. Much R&D effort is
required to develop and demonstrate the breakthrough technologies needed for a deep
decarbonisation of our economies in this century. International support for public-private
R&D efforts could achieve progress in this area, at lower cost, with many positive
externalities. There have been relatively few international policy efforts in this regard to date.
These issues make a case for the potential usefulness of international collaboration on domestic
climate policy efforts, and raise the question of what kinds of collaboration would be most fruitful.
The United Nations Framework Convention on Climate Change (UNFCCC) provides the
framework for state action on mitigation at an aggregate level (i.e. nationally-determined contributions).
The Paris agreement on emissions after 2020 will be crucial in aligning broad expectations among
policymakers and the private sector on the future direction of climate policy. Although the UNFCCC
Parties have not been favourable to discussions of coordinated action on domestic policies, the UNFCCC
could still facilitate the sharing of information on how countries progress in the implementation of their
policy instruments, which may spur separate, more structured discussions on policy cooperation. Parallel
4
supporting action in bilateral and multilateral settings, such as the recent US-China agreement, will be
important in making progress.
A number of international initiatives have sprung up in recent years, maybe in part as a response to
the above mentioned spill-overs. These initiatives often aim at enhancing dialogue, transparency and
learning on national sectoral policies. Examples of deeper policy cooperation are rare. There is a
continuum of collaborative activities that domestic policymakers and private sector stakeholders could
undertake, from increased transparency on domestic actions, to coordinated adoption of different
nationally-determined policies or standards, to fully coordinated policy efforts in specific areas.
Round Table participants are asked to consider the following questions:
1. How serious are the international spill-overs in the markets affected by domestic climate
policies? What practical concerns do they raise among policymakers and private sector
stakeholders?
2. In what policy areas or sectors could transparency and potentially cooperation be most
beneficial?
3. What would be the general conditions for a fruitful public-private effort in R&D on
breakthrough low-carbon technologies?
4. An effective response to climate change will come through policy-driven markets, with an
essential role for the private sector. How to structure possible discussions between
policymakers and the private sector internationally?

5
INTRODUCTION
1. Countries have agreed to negotiate a new climate agreement under the United Nations Framework
Convention on Climate Change (UNFCCC) by 2015. Many countries are also putting in place ever more
significant national policy frameworks to reduce greenhouse-gas (GHG) emissions, as evidenced by recent
announcements by the United States, China and the European Union (Climate Action Tracker, 2014).
These often aim at pricing greenhouse gas (GHG) emissions and driving the innovation and market
deployment of new low-carbon technologies in both production and consumption activities.
2. These domestic policies do not exist within an international vacuum: the world’s economy is more
interconnected than ever before. Over the last two decades, growth in the cross-border exchange of goods,
capital and ideas has been extremely rapid (Figure 1). In 1960 the trade share of GDP in an average OECD
country was 12.5%; by 2010 it had doubled to 25%. This evolution has been even faster in a number of
developing countries, such as China, whose trade share of GDP rose from virtually zero in 1978 to 24% in
2010 (OECD, 2012).
Figure 1. Evolution of world real GDP
and the volume of trade in goods and services since 1979
Source: Authors, IMF data.
3. Low carbon technologies are also increasingly globalised, particularly in terms of manufacturing
and market deployment (OECD, 2013). These technologies are often composed of thousands of
sub-components1 and draw on technologies from a range of scientific fields and economic sectors (OECD,
2013). Thus, low-carbon technologies will inevitably be built upon global value chains as much as any
1 The average wind turbine is composed of around 8 000 separately produced components (US Congressional
Research Service, 2012).
0
100
200
300
400
500
600
700
19
79
19
82
19
85
19
88
19
91
19
94
19
97
20
00
20
03
20
06
20
09
20
12
Ind
ex
(19
79
=10
0)
Gross domestic product,constant prices
Trade volume of goodsand services

6
other complex manufactured product. Indeed, it is important that they are, if they are to be competitively
priced for consumers and thus effectively diffused globally.
4. The globalisation of low-carbon technologies also poses a number of challenges. Markets for these
technologies are shaped by national policies and support schemes which will have to increase in stringency
if low-carbon technologies are to be successfully scaled-up in the coming years. At the same time,
uncoordinated national support policies risk creating fragmented global markets – raising transaction costs,
risking rent seeking from the most generous national support schemes, and potentially creating boom-and-
bust cycles through unstable or contradictory policies in different parts of the global market.
5. A recent example is the evolution of the solar photovoltaic (PV) market. As a result of generous
subsidies in Europe and support for manufacturing capacity in China, the European market was flooded
with Chinese solar panels that out-competed European manufacturers. Although this competition led to
important cost reductions – good news for climate mitigation – it also led to a retrenchment of European
support schemes and a collapse of the international market, which threatened Chinese manufacturers (see
Section 1.1.1 for more detail). In hindsight, this was an unhelpful combination of poorly designed policy
instruments and unrealistic market expectations.
6. The low-carbon transition will require the emergence of many markets, created by a multitude of
domestic policies that may have regional or even global dimensions, as the PV example illustrates. The
absence of a shared vision of what these policies aim to achieve may create ongoing disruptive turbulences
in these markets.
7. Policymakers are also concerned about the impacts of domestic climate policy on the
competitiveness of certain energy-intensive, trade-exposed (EITE) industries. The risk that the policy-
driven costs of energy may lead firms to offshore the most energy- or carbon-intensive parts of their value
chains has been a preoccupation of policymakers since the beginning of the UNFCCC process. From a
domestic policy perspective, arguments that industry will lose international competitiveness and that
emissions and jobs will ‘leak’ overseas have proved to be a major stumbling block to implementing and
reinforcing policies to reduce emissions in these sectors (Sartor et al., 2013). Interestingly, this line of
argument, first stated in Europe, the US, Japan and Australia, is now part of the industry discourse on
climate policy in emerging economies as well.
8. Driving the decarbonisation of global value chains is therefore particularly challenging in the
context of a largely bottom-up, nationally-driven approach to climate policy. Among others, the following
questions present themselves:
How can a range of national technology deployment policies be coordinated to send coherent
and dynamic signals to the private sector in a way that supports a smooth scaling up of
manufacturing capacity and investment in innovation?
How can countries seek to capture the benefits of new activities that contribute to low-
emissions growth, while ensuring their effective global diffusion?

7
What policies can create confidence in strong collective action within a bottom-up framework
so that policymakers feel more confident in increasing the stringency of national policies in
EITE sectors?
How can the transparency of and cooperation on of these national policies be increased?
Should the public and private sectors join forces internationally to generate the breakthrough
technologies that are crucial for the low-carbon transition?
9. A new global agreement under the UNFCCC is a cornerstone of the global climate governance
regime and a key enabler of domestic policy. By itself, however, the UNFCCC may not be able to facilitate
greater transparency and cooperation of sector-specific policies. This is further discussed in Section 2.1.
10. This paper aims to address three questions:
1. What challenges are raised by the decarbonisation of global value chains, beyond the basic
collective action challenge of climate change as a global externality?
2. Do these challenges imply a need for greater sector-specific policy transparency and
cooperation?
3. Does the current international climate policy regime, broadly conceived, contain the
institutions necessary to provide for this transparency and cooperation?
The purpose of developing answers to these questions would be, in turn, to provide for more
effective national policies from the perspective of the public and private sectors.
11. One further point should be clarified concerning the terminology used in this paper. Conceptually,
we can consider the following degrees of cooperation on national climate policies:
Non-cooperation: in this framework, countries implement bottom-up, nationally-determined
policies to implement their emissions objectives, without regard for the international spill-
overs of national policies. In a worst-case scenario, this could amount to ‘free-riding’ in
sectoral policies.
Transparency: countries share information, lessons learned and future intentions concerning
their national climate policies to enable a degree of ad hoc convergence of expectations,
policy design and stringency.
Cooperation: countries’ nationally-determined policies are implemented with a degree of
international cooperation, i.e. towards broadly defined common objectives.
Coordination: countries’ policies are defined with a high degree of coordination, e.g. with
common standards etc.
12. This paper concentrates mainly on the potential for transparency and cooperation, i.e. the second
and third bullet points above.

8
1. CLIMATE POLICY IN THE CONTEXT OF GLOBALISATION
13. Domestic climate policy, to be effective, will have to re-direct investment, technology choices and
behaviours towards low-GHG options. The resulting domestic policy-driven markets will have
international spill-overs. In turn, these spill-overs may point to benefits from various forms of cooperation
on national policies. It is important to underscore that such spill-overs risk undermining not just the
efficiency (i.e. cost), but also indeed the effectiveness (i.e. ambition) of national policies.
1.1 Market Deployment of Low Carbon Technologies: are more transparent market signals
needed?
14. The manufacturing and deployment of low-carbon technologies has grown dramatically over the
past decade. To give one indication, between 1996 and 2013 the global production of CO2-free electricity2
grew by 47% (Table 2). The production of renewable electricity grew by 86% in the same timeframe. The
growth in the deployment of low carbon technologies has been driven by national policies and resulting
improvements in their competitiveness. These policies have multiple objectives including health benefits,
energy security, and reducing GHGs. One additional objective revolves around promoting technology
learning and reducing costs, another around developing national innovation and manufacturing capabilities
in emerging low-carbon activities. A corollary of these policies has been a dramatic growth in the trade of
climate-related manufactured goods. Between 1996 and 2013, global exports of selected climate-related
goods grew more than six-fold (Figure 2).
Figure 2. Global deployment of renewable electricity (left)
and trade in climate-related manufactured goods, 1996-2013 (right)
Source: authors based on Enerdata. Source: authors based on COMTRADE.
2 Nuclear and renewable electricity.
0
1,000,000
2,000,000
3,000,000
4,000,000
5,000,000
6,000,000
7,000,000
8,000,000
19
96
20
00
20
04
20
08
20
12
GW
h
OECD
BRICS
World
0
20
40
60
80
100
120
19
96
19
98
20
00
20
02
20
04
20
06
20
08
20
10
20
12
bln
USD

9
15. The importance of global flows of low-carbon technologies, knowledge and investment is also
illustrated by Table 1, which highlights three important channels for the transfer of low-carbon
technologies to large emerging economies in 2011:
Patent inward flows: this indicator represents the import of low-carbon technologies via
patenting. It measures a country’s ‘imports’ of foreign low-carbon patents as a share of global
low-carbon patent ‘imports’. For example, foreign low-carbon patents registered in China as a
share of global low-carbon patents registered outside their country of origin was 15.5.%. The
figure in parentheses represents a country’s foreign patents for all technologies as a share of
global patents registered outside their country of origin.
Import of low-carbon equipment: the indicator represents the physical import of low-carbon
goods. It measures a country’s imported low-carbon goods as a share of global imports of
low-carbon goods. The figure in parenthesis represents a country’s imports of all goods as a
share of global imports of all goods.
Inward FDI links: this indicator represents the import of low-carbon technologies via foreign
direct investment (FDI). It measures the number of transactions of FDI flowing into a country
from companies with at least one low-carbon patent as a share of total global FDI inflows
from companies owning at least one low-carbon patent. Due to data constraints it represents
thus the number of FDI links rather than the investment volume in monetary terms.
16. In general, these figures show that low-carbon technology transfers are occurring more or less in
line with the share of a country in the world economy, with the exception of India and Brazil. Thus, while
the figures appear low in absolute terms, they are actually quite large and important to global efforts to
decarbonise large emerging economies.
Table 1. Low carbon patent inflows, imports of capital goods, and foreign direct investments,
in selected emerging economies as a share of the world total
Country Patent inward flows a Import of low-carbon
equipment b
Inward FDI links c Economy size
(2009 GDP)
China 15.5%
(12.2%)
8.3%
(15.3%)
7.1% 11.1%
Mexico 2.2%
(1.6%)
1.7%
(3.0%)
2.5% 2.2%
Russia 1.3%
(0.9%)
1.4%
(1.8%)
2.2% 3.3%
South Africa 1.2%
(0.8%)
0.4%
(0.6%)
0.9% 0.7%
India n.a.
(n.a.)
1.5%
(1.5%)
1.6% 4.9%
Brazil 0.7%
(0.5%)
0.7%
(1.1%)
2.5% 2.9%
Source: Glachant et al. (2013), based on PATSTAT, COMTRADE and ORBIS data.

10
Notes: Results for all technologies and equipment good appears in parentheses. a Average of patent flows covering 23 technology
classes except agriculture and forestry (2007-2009). b Average of low-carbon equipment from 18 products/sectors: hydro, wind, solar
photovoltaic and thermal, nuclear, energy storage, electric and hybrid vehicles, rail locomotives, cement, insulation, lighting,
economizers, super-heaters, soot removers, gas recoverers (2007-2009). c Count of capital links between a source company owning
at least one low-carbon patent and a foreign company in 2011.
17. Table 1 illustrates the emergence of significant policy-driven markets for low-carbon technologies.
If climate change is to be adequately mitigated, these markets will have to scale up dramatically and
broaden to encompass a large group of different technologies.
1.1.1 Fragmented policies and markets
18. Firms whose products are exported internationally face different national policies. For them,
strategic incentives to innovate and deploy new technologies depend importantly on the direction of the
sector as a whole at the global level. Gallagher (2014), in her recent comprehensive study of the
globalisation of low-carbon technologies in China, notes:
“…there is little coordination among countries on these [low-emissions] policies and few
attempts at formal harmonization. The global policy landscape is thus a mosaic of many
different types of policies that cumulatively affect the global marketplace for clean energy.
The heterogeneity in the policies has created a somewhat haphazard global market for
producers, but it has also allowed for considerable policy experimentation as well.”
(Gallagher, 2014)
19. While this “haphazard global market” may allow for experimentation, it risks creating
unnecessary, costly barriers to standardisation, trade and economies of scale. Perhaps more importantly, it
could lead to market fragmentation and instability. At its worst, it may lead to a boom-and-bust cycle of
unstable or conflicting policy signals in different markets.
20. The case of solar PV is an interesting example. Since the mid-2000s Europe has implemented
significant market-pull policies for solar PV such as feed-in tariffs or quota systems for low-carbon
electricity. These are shown in Annex 1. Meanwhile, China started to put in place significant policies to
support solar PV manufacturing capacity. These are shown in Annex 2.
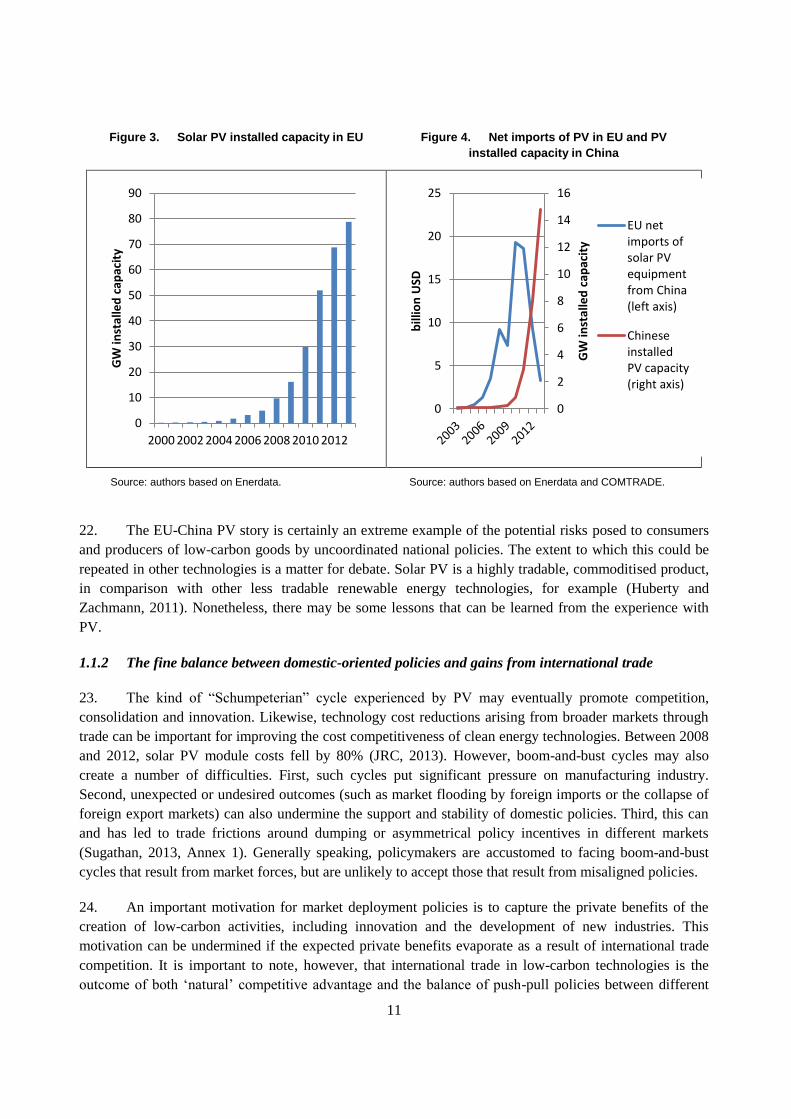
21. As a result, EU installed capacity of solar PV grew quickly from 0.19 GW in 2000 to 79 GW in
2013 (Figure 3). At the same time, EU imports of solar panels from China exploded from
USD 1.77 million in 1996 to a peak of USD 19.3 billion in 2010 before a significant drop off in 2012 and
2013 (Figure 4). As EU policymakers scaled back support and the EU market shrank, China progressively
implemented more attractive incentive policies for domestic installation of PV capacity. For example, in
2013 the Chinese State Council increased the 12th Five-Year Plan target for solar PV from 5 to 35 GW by
2015. This resulted in rapid growth of Chinese installed capacity (Figure 4). China’s Energy Development
Strategy Action Plan (2014-2020), released in November 2014, sets a target of 100 GW of solar PV by
2020 (State Council, 2014). This did not prevent, however, significant and still ongoing turmoil and
consolidation amongst Chinese solar PV manufacturers, including the bond default and eventual delisting
of Suntech – once the world’s largest solar PV manufacturer – from the NY Stock Exchange in 2012.
11
Figure 3. Solar PV installed capacity in EU Figure 4. Net imports of PV in EU and PV
installed capacity in China
Source: authors based on Enerdata. Source: authors based on Enerdata and COMTRADE.
22. The EU-China PV story is certainly an extreme example of the potential risks posed to consumers
and producers of low-carbon goods by uncoordinated national policies. The extent to which this could be
repeated in other technologies is a matter for debate. Solar PV is a highly tradable, commoditised product,
in comparison with other less tradable renewable energy technologies, for example (Huberty and
Zachmann, 2011). Nonetheless, there may be some lessons that can be learned from the experience with
PV.
1.1.2 The fine balance between domestic-oriented policies and gains from international trade
23. The kind of “Schumpeterian” cycle experienced by PV may eventually promote competition,
consolidation and innovation. Likewise, technology cost reductions arising from broader markets through
trade can be important for improving the cost competitiveness of clean energy technologies. Between 2008
and 2012, solar PV module costs fell by 80% (JRC, 2013). However, boom-and-bust cycles may also
create a number of difficulties. First, such cycles put significant pressure on manufacturing industry.
Second, unexpected or undesired outcomes (such as market flooding by foreign imports or the collapse of
foreign export markets) can also undermine the support and stability of domestic policies. Third, this can
and has led to trade frictions around dumping or asymmetrical policy incentives in different markets
(Sugathan, 2013, Annex 1). Generally speaking, policymakers are accustomed to facing boom-and-bust
cycles that result from market forces, but are unlikely to accept those that result from misaligned policies.
24. An important motivation for market deployment policies is to capture the private benefits of the
creation of low-carbon activities, including innovation and the development of new industries. This
motivation can be undermined if the expected private benefits evaporate as a result of international trade
competition. It is important to note, however, that international trade in low-carbon technologies is the
outcome of both ‘natural’ competitive advantage and the balance of push-pull policies between different
0
10
20
30
40
50
60
70
80
90
2000 2002 2004 2006 2008 2010 2012
GW
inst
alle
d c
apac
ity
0
2
4
6
8
10
12
14
16
0
5
10
15
20
25
GW
inst
alle
d c
apac
ity
bill
ion
USD
EU netimports ofsolar PVequipmentfrom China(left axis)
ChineseinstalledPV capacity(right axis)

12
markets. Moreover, international trade can be an important contributor to reducing the cost to consumers of
low-carbon technologies. There is a fine balance between maintaining incentives for national policymakers
to implement deployment policies and reaping the benefits of international trade.
1.1.3 The risk of multiple standards
25. Apart from the highly visible example provided by solar PV, there are other potential negative
consequences to the predominantly bottom-up development of market deployment policies for low-
emissions technologies. As noted by Grübler et al. (2012), “shared or collective expectations are an
important means of reducing uncertainty and stimulating entrepreneurial activity”, thus stimulating
innovation. Fragmented global markets could thus potentially act as a brake on innovation efforts in low-
emissions technologies. In addition, divergent standards or policies may raise transaction costs, restrict the
benefits of economies of scale and raise the costs of compliance to industry and of policy-making to
national authorities.
26. Perhaps the clearest example of this risk relates to the emergence of multiple standards for fast-
charging infrastructure for electric vehicles. Three standards are currently in operation: 1) the SEA-Combo
standard developed by a coalition of US and German manufacturers; 2) the CHAdeMO developed by
Japanese manufacturers; and 3) Tesla Motors’ Supercharger. A more prosaic example relates to
refrigerators, highly traded products subject to energy efficiency standards in 60 different countries using
at least ten different test methodologies to assess performance against them (Ellis and Rozite, 2013). As
noted by the International Standards Organisation, “International Standards can also be the vehicle for the
dissemination of innovative technologies, particularly for alternative and renewable sources, by reducing
time to market, creating global interest and developing a critical mass of support to ensure the economic
success of such technologies.” (ISO, 2008) International standard-setting bodies such as the ISO and the
International Electrical Commission (IEC) have begun to be more active in the area of climate-related
performance of energy-using equipment. This policy challenge is further discussed in Box 1, taking the
G20 Energy Efficiency Action Plan as an example.
Box 1. The G20 Energy Efficiency Action Plan
In 2014, the G20 developed and adopted a voluntary collaboration on energy efficiency: the Energy
Efficiency Action Plan. In a number of respects, this could be an interesting case study of approaches to the
challenge of coordination of national policies, particularly with regard to internationally-traded products. This
being said, having just been adopted in November 2014, it remains to be seen how this initiative will be
implemented. Importantly, the Action Plan was given high-level political endorsement by heads of state in
their communiqué (G20, 2014, §18).
The central deliverable for the Action Plan is the promotion of more stringent domestic vehicle
efficiency standards, particularly for heavy duty vehicles hitherto unregulated in the majority of G20 countries.
Heavy duty vehicles could provide significant fuel and emissions savings: according to the IEA, trucks are
responsible for 40% of incremental demand for oil (in a business-as-usual scenario) but fuel efficiency in trucks
could be improved by 30 to 50% (IEA, 2012, p. 91). The Action Plan notes that such standards will be applied
domestically, but underscores that “… international work can accelerate technical development of standards
13
and testing regimes and facilitate voluntary harmonisation. Harmonisation of national standards helps reduce
development costs for new vehicles and lessens the regulatory burden. This work will include collaboration
and exchange of experiences and best practices on relevant national standards”. (G20, 2014b, §2.3, emphasis
added) The work will provide recommendations to the G20 in terms of “strengthened domestic standards in
G20 countries in as many areas as possible related to clean fuels, vehicle emissions and vehicle fuel efficiency”.
(G20, 2014b, §2.1) Other areas of work include exploring standards and goals for networked devices which are
“widely traded internationally”. (G20, 2014b, §2.1)
The Energy Efficiency Action Plan will be coordinated by the International Partnership for Energy
Efficiency Cooperation (IPEEC), in collaboration with other international organisations such as the IEA. It will
report results to the Energy Sustainability Working Group of the G20.
27. A number of factors point to the need for some level of international transparency and cooperation
as a means of facilitating market deployment of low-carbon technologies. There are a number of barriers to
such cooperation as well, including transaction costs, international distributional consequences of
regulation and divergent national circumstances. Nonetheless, policy spill-overs already appear to be
pushing an ad hoc emergence of cooperation efforts (Box 1. ). Efforts in this area could improve the
alignment and robustness of market expectations in key globalised low-carbon sectors through a common
understanding of policy-driven market developments of low-carbon and related technologies. The
establishment of cooperative frameworks for the adoption of national policies affecting highly-traded
products could also be explored.
1.2 Transformation and Competitiveness in Energy-Intensive, Trade-Exposed Industries
28. A few industrial sectors are energy-intensive and trade-exposed (EITE). Policymakers are often
concerned that divergent policy-related costs of energy could lead to the offshoring of economic activity in
EITE sectors to jurisdictions with more favourable energy input costs (IEA, 2013). Most studies find that
EITE sectors can effectively be reduced to a handful of very energy- or carbon-intensive basic
manufacturing sectors: aluminium, cement, clinker and lime, steel, refining, certain chemicals, and
nitrogenous fertilisers; glass, pulp and paper, and ceramics are sometimes added to the list (Droege et al.,
2009). Sustained input cost disparities are not uncommon in these sectors: locational, production and
investment decisions in EITE sectors are made on numerous criteria, of which the policy-related cost of
energy is just one, albeit an important one.
29. However, energy-intensive industries are major emitters of CO2 and other greenhouse gases, and
account for two-thirds of industrial energy use globally. In 2011, emissions from five broad energy
intensive sectors made up 10% of global CO2 emissions from fuel combustion; 15% in BRICS countries
and 7% in OECD countries.3 In the long-term, therefore, these industries will need to decarbonise
dramatically as part of a trajectory to keep warming below 2°C. According to the IEA’s Energy
Technology Perspectives 2014 (IEA, 2014a), the following emissions reductions will be needed by 2050 in
3 These sectors are steel production, non-ferrous metals production, non-metalic minerals production,
chemicals production, and paper production.

14
a 2°C-compatible scenario, compared to a business-as usual scenario: steel (44%); chemicals (46%);
cement (35%); pulp and paper (52%); and aluminium (11%).
30. These levels of GHG reduction will result from a range of measures, from the use of new
breakthrough technologies such as carbon capture and storage (CCS), to product substitution, materials
recycling and reductions in the throughput of these products through dematerialisation. Incentivising this
degree of change throughout the value chain will require significant policy stringency (CEFIC, 2013;
Neuhoff et al., 2014a and 2014b).
31. CCS provides a useful example of challenges ahead for industry when it comes to the
decarbonisation agenda. CCS costs for industry remain uncertain, but are likely to be on the order of
USD 50/tCO2 or more (IEA, 2014). Carbon pricing on this level would have a significant impact on the
production cost of the primary product in EITE sectors. Figure 5 shows the impact of a USD 50 carbon
price on the most carbon-intensive industries in Europe, expressed in terms of CO2 cost as a share of
sectoral gross value added. This indicator reaches a level of roughly 70-15% for the most impacted sectors.
Carbon costs of this level would have significant impacts on product price, downstream markets and
international competitiveness. However, in the absence of cheaper low-carbon technologies, this is the
level of policy stringency required in order to transform some of these sectors.
Figure 5. Comparison of a USD 50/CO2 with
sectoral gross value added in the most affected industries
Source: Authors’ calculations based on EC, 2014 To date, there is very little empirical evidence of trade distortions in EITE
sectors due to divergent stringency of climate policies, although this may change as these policies are tightened (Bolscher et

15
al., 2013). However, so far climate policies have not reached the level of stringency that would be required to incentivize
significant transformation in EITE sectors. Moreover, where GHG mitigation policies have been introduced in industry, they
have almost universally been accompanied with measures to mitigate the signal of the carbon constrain in EITE sectors, such
as free allocation to these sectors under emissions trading schemes (cf. Hood, 2010).4 These policies aim at removing or
mitigating the carbon price pass-through into primary products in EITE sectors, so that producers in these sectors do not risk
losing market share to international competitors who are not under carbon constraints. In turn, this effectively removes or
reduces the cost of the carbon constraint throughout the value chain for EITE sectors. Incentives for a less intensive use of
these products and innovation into low-carbon substitutes are also hindered by these protective measures.
32. The carbon leakage threat is not uniquely the concern of industrialised countries. The Chinese
State Information Centre, an internal economic think tank at the Chinese National Development and
Reform Commission (NDRC), is now exploring the potential impacts of Chinese carbon pricing policies
for the electricity sector on its industries (Ji et al., 2014). The Chinese government has pledged to
introduce a national carbon trading scheme by 2020, which will most probably include heavy industry. As
the scope and level of carbon pricing rises in China over the coming decade, the same issues of carbon
leakage and competitiveness are beginning to arise in the Chinese climate policy debate.
33. Protecting EITE industries from carbon constraints may be a justifiable objective in the short-term,
in the context of fragmented global policies. However, as noted above, these are major sectors that will
need to be decarbonised everywhere if the 2˚C objective is to be met. Theoretically, firms should integrate
the price of carbon into their investment and operational decisions, thereby reducing emissions where
doing so is profitable given the opportunity cost of free allowances. However, on exactly the same logic,
firms may substitute domestic production for imports in order to sell allowances (operational leakage), if
allocation is based on historical production levels.
34. Firms may also not act as fully rational cost-optimal agents. There is empirical evidence from
behavioural economics that real costs, such as buying allowances at auction or paying a carbon tax, may be
more salient for management than the opportunity costs of, for example, free allowances (Abrell et al.,
2011). Real costs may thus create a stronger incentive for firms to implement carbon abatement policies.
Perhaps even more importantly, future levels and values of free allocation may be too uncertain for firms
to justify large scale investments such as in CCS, the profitability of which depends on the ability to sell
surplus allowances at an appropriate price (Neuhoff et al., 2014a and 2014b).
35. There are different ways to protect EITE sectors from carbon leakage in the transition, all of which
have drawbacks. Table 2 summarises three anti-leakage measures against four different policy objectives.
As can be seen, free allocation, either ex-ante or ex-post, does not score well on its capacity to incentivise
mitigation, innovation and substitution in the EITE value chain. Border adjustments do score well here, but
they are currently likely to be seen as a non-cooperative move by implementing countries’ trading partners.
4 Examples include: the EU ETS (2005); the US Waxman Markey Bill of 2009; the Californian Emissions
Trading Scheme (2013); the Australian CPRS Proposal (2008); The New Zealand Emissions Trading
Scheme (2009); the Tokyo Emissions Trading Scheme (2007); the Norwegian Emissions Trading Scheme
(now linked to the EU ETS); the Kazakhstan Emissions Trading Scheme (2013); and the Republic of
Korea’s Emissions Trading Scheme (2015).

16
Table 2. Summary of pros and cons of different anti-leakage measures
Prevents carbon
leakage?
Creates incentives for mitigation and breakthrough
technologies upstream?
Incentives for mitigation
downstream?
Does not require international cooperation?
Ex-ante free allocation based
on historical production
+ - - + +++
Ex-post free allocation based
on annual production
+++ - - - - - +++
Border Adjustment
+++ +++ +++ - - -
Source: authors.
36. There is therefore a fundamental trade-off between protection and the low-carbon transformation
in EITE sectors in the context of solely national policies. This raises the question of how governments can
create sufficiently strong incentives to significantly transform these sectors, given fragmented national
policies and concerns arising from asymmetrical policy and distortions of competition. Of course, concerns
of fragmented global policy could be mitigated by a global agreement; however, this paper argues that
even under a global agreement, countries will continue to implement diverse policies reflecting their
national circumstances. So even if a global agreement is struck, concerns about carbon leakage are unlikely
to disappear completely.
37. Unilateral policy efforts lead to less efficient approaches and ultimately to policies that are
inadequate to transform EITE sectors in the long term. As more countries embark on the low-carbon
transition, they will inevitably face similar resistance to ambitious emissions reduction goals in sectors
with high carbon intensity. The question is whether an enhanced dialogue between policymakers from
global trading partners could facilitate domestic policy efforts while ensuring free trade in the context of
industrial decarbonisation.
38. An appropriate forum for the discussion on the free trade-climate policy nexus would need to bring
together expertise on both climate and trade aspects. It would also need to include, at a minimum,
representatives of major trading countries in energy-intensive goods, countries that either have developed,
or are in the process of developing, carbon emissions regulations for industrial sectors, and the private
sector. A possible model for such a forum could be the World Bank’s Partnership for Market Readiness
(PMR) (Box 2). As noted below, the PMR creates a neutral platform for technical discussion between both
developed and developing countries on the implementation of carbon pricing and related policies.

17
Box 2. The Partnership for Market Readiness (PMR)
The Partnership for Market Readiness (PMR) is a World Bank-led initiative that brings together
31 countries and two regional (so-called ‘technical’) partners (California and Quebec). The initiative includes
Contributing Participants who provide financial support to the PMR trust fund, and Implementing Country
Partners who receive PMR funding for implementation activities. Contributing Partners include the United
States, European Commission, Japan, and Norway, among others. Implementing Country Partners include
Brazil, China, India, Indonesia, South Africa, Vietnam, Colombia, Peru, Costa Rica, Morocco, Tunisia, as well as
Chile, Mexico and Turkey.
The goal of the PMR is to help countries pursue more effective greenhouse gas mitigation efforts
through the use of innovative policy instruments to increase financial flows for mitigation, including through
the use of carbon market-based policy instruments. It therefore provides grant-based funds as well as
technical assistance to Implementing Country Partners. However, it also provides a platform for discussion and
knowledge sharing and engages in technical discussions related to market-based instruments. These can
include North-South or South-South exchanges on policy challenges encountered and experiences gained in
other countries.
The PMR is country-led and focuses on building up Implementing Countries’ capacities to design, test,
and implement mitigation policies. It could be seen as an interesting template for a forum in which domestic
policymakers could exchange policy experience on how to address competitiveness issues arising from
countries progressively strengthening their carbon pricing or equivalent policy efforts. It would contribute to
improved transparency – e.g. answer the questions: what are partner countries doing in the following sectors?
How does this compare with other countries’ efforts? – and possibly cooperation (countries pushing in the
same direction and seeking to learn from each other what is the best way forward).
1.3 Research and Development
39. Investment in research and development (R&D) will need to increase to ensure the necessary
technological innovation to meet the 2°C. The IPCC cites estimates for the required increase in energy-
related R&D ranging from USD 4.5-78 billion per year between 2010-2029, for example (IPCC, 2014).
40. Numerical assessments of current R&D expenditure on energy technologies are fraught with
uncertainty. Nonetheless, they can be used to garner broad trends and implications. Currently, about
USD 50 billion is spent globally on energy-related R&D (Grübler et al., 2012). Of this, about
USD 35 billion is invested by the private sector. This strong role for the private sector is also reflected in
studies focused on the European Union: Weisenthal et al. (2009) estimated that EUR 2.38 billion were
allocated to R&D in low-carbon technologies in the EU in 2007, of which EUR 1.66 billion came from the
private sector.
41. At the same time, it is important to highlight that R&D spending is not the only driver of improved
performance of low-carbon technologies. As well as ‘learning-by-researching’, ‘learning-by-doing’
through deployment is an important driver of cost reductions in low-carbon technologies. Indeed, it is
important to carefully articulate push policies such as R&D and pull policies such as deployment of low-

18
carbon technologies. Estimates of market deployment5 investments for pre-commercial low-carbon
technologies place these at around USD 150 billion per year. Investments in the diffusion of commercial
technologies place them at more than USD 1 000 billion per year. These figures give a sense of the scale of
the deployment and diffusion incentives on which technology researchers and producers base their
strategic decisions. Policymakers need to effectively combine incentives across the innovation chain, from
R&D to market formation and diffusion, in order to promote innovation and improved performance of low-
carbon technologies.
42. There is evidence that energy-related R&D efforts are increasingly globalised, as suggested by the
significant share of emerging countries in the above estimate of global energy-related R&D spending.
Grübler et al. (2014) estimate energy-related R&D in BRIMCS countries (Brazil, Russia, India, Mexico,
China, South Africa) at USD 15 billion, which is roughly equivalent to the entire public expenditure on
energy R&D of IEA countries (USD 13 billion). Whether such R&D is predominantly going into fossil
fuel technologies or into low-carbon is another question.
43. Estimates reveal a discrepancy between relatively lower R&D investment in demand-side
technologies and their importance in achieving environmental and economic objectives. Table 3
summarises historical data of public R&D in IEA countries in demand and supply technologies, compared
to their relative importance in reducing GHG emissions in long-term mitigation scenarios. This leads the
authors to argue that there is a “significant bias in past and current R&D portfolios … [to] the detriment of
energy efficiency and conservation”. (Grübler et al., 2014)
Table 3. Cumulative public R&D expenditure in IEA countries
in supply and demand-side technologies
compared to their role in GHG emissions reductions
% share in emissions
reductions 2000-2100,
mean all scenarios
Cumulative R&D
expenditures, 1974-2008,
billion USD2008
% share in
total
2008 R&D
Energy efficiency 59.2 38 9.1
Fossil fuels 6.2 54 12.8
Renewables 18.2 36 8.7
Nuclear 8.5 225 53.8
Others 8.0 65 15.5
Total 100.0 417 100.0
Source: Grübler and Riahi (2010)
5 i.e. deployment of new energy technologies in specific ‘niche markets’ before full commercial diffusion.

19
44. Analysts place increasing importance on the entire ecosystem for energy-related innovation,
leading to the development of the Energy Technology Innovation System (ETIS). The components of this
system can be analysed individually. They include knowledge, resources, actors and institutions, and
conditions for the adoption and use of new technologies (see in particular Grübler and Wilson, 2014, for
more details). There is not room here for a detailed exposition of these concepts and their interactions,
though two points should be highlighted:
The emphasis on multi-component systems for energy innovation stresses the need for
comprehensive and coherent incentives and policies across the innovation system and the
energy value chain.
Energy innovation is inherently a long-term endeavour, with large inertias, sunk costs and
barriers to entry. Change in the energy sector is measured in decades, not years. Actors can be
durably discouraged by innovation failures. This reinforces the importance of structural,
sustained and long-term incentives and policies.
45. The above discussion has underscored a few salient aspects of the current state of the art of energy
innovation, in particular as it is relevant to the national policy debate. However, the focus of this paper is
on international policy cooperation. As noted earlier, innovation, manufacturing and deployment of low-
emissions technologies are increasingly globalised into an international energy technology innovation
system comprising a patchwork of national policies, international policy collaboration, the activities of
multinational firms, global networks of research institutions, and international trade. The operation of this
international energy technology innovation system is relatively understudied.
46. From the perspective of a national policymaker, cooperation on R&D within a ‘club’ of countries
with similar sectoral interest may be attractive for a number of reasons:
Firms and researchers have strategic perceptions about the future direction of the technologies
and sectors in which they work. These anticipations are important drivers of R&D efforts and
can be influenced by credible policy. As noted in the Global Energy Assessment: “shared or
collective expectations are an important means of reducing uncertainty and stimulating
entrepreneurial activity”. (Grübler et al., 2012) In the context of globalised clean energy
innovation, such anticipations are in part influenced by expectations on policies in other
countries – another argument in favour of reliable, transparent information sharing on policy
efforts.
International R&D cooperation may improve the efficiency of R&D activities by reducing
duplications of efforts.
Knowledge is cumulative and combinatorial and is therefore subject to high spill-overs. These
features can generate high rates of social return from knowledge access. Increased scientific
exchange and collaboration can therefore accelerate the growth rate of the overall stock of
knowledge from which national policymakers can benefit. Ultimately, participants must also
organise in order to allow capture of the benefits, without which joined efforts and pooling
resources would be pointless.

20
Technology diffusion is largely dependent on the absorptive capacity of the country in
question. Participation in global knowledge networks can help to improve domestic capacities
to adopt, adapt and generate new technologies. There is evidence, for example, that
participation in international knowledge networks by Chinese scientists, engineers and
entrepreneurs was a crucial factor in the rapid growth of the Chinese solar PV industry
(Gallagher, 2014).
47. Evidently, there are multiple factors which get in the way of international R&D cooperation. These
include transaction costs, commercial sensitivities, divergent preferences and research capacities. In the
case of pre-commercial R&D, commercial sensitivities may be reduced; there is indeed evidence that R&D
collaboration is more significant in pre-commercial technologies (De Coninck et al., 2008). There is too
little research on the scale, modalities and results of international energy-related R&D collaboration. The
survey of international initiatives provided in Section 2.3 does suggest that there is relatively little concrete
cooperation on energy-related R&D, although such cooperation may be more prevalent at the regional (e.g.
EU) or bilateral (e.g. US and China) level. Nonetheless, a recent comprehensive assessment of energy-
related innovation at the global level argued that the global potential for cooperation on R&D was not
being sufficiently tapped: “International knowledge spill-overs through government-sponsored
collaboration efforts seem weak compared to what is needed to foster a significant global energy
transition.” (Grübler et al., 2012)
1.4 Summary
48. The previous sub-sections illustrated three issues related to negative and positive potential spill-
overs of national policies on climate change.
Incoherent market signals. There are examples of deployment policies for low-carbon
technologies that suffered greatly from unexpected international market responses (e.g. solar
photovoltaic panels), resulting in unhelpful trade frictions and less robust incentives for firms
operating in this global sector. It seems worth asking whether the large-scale, policy-driven
deployment of many low-GHG technologies globally could benefit from international sharing
of information on market expectations and enhanced transparency on domestic policy.
Effectiveness of carbon constraints. Fragmented policies create concerns for policymakers
and firms about trade distortions and ‘emissions leakage’ in energy-intensive and trade-
exposed industries. The ‘protective’ measures adopted in response to these concerns hamper
the effectiveness and ambition of the emission constraints placed on these important sectors.
They also slow down the innovative capacity of value chains towards low-greenhouse gas
practices. As other countries seek to set those activities on a low-carbon path, an exchange
among like-minded domestic policymakers could prove useful.
Public-private R&D. Related to the previous point is the inadequate level of expenditures
allocated to researching and developing breakthrough low-carbon technologies: additional
effort is required. Here again, the question is whether policymakers and the productive sector
could benefit from joining forces, as it seems that international support for public-private

21
R&D efforts could achieve progress in this area, at lower cost, with many positive
externalities.
49. The following section surveys the emerging policy response to these challenges, beginning with
the UNFCCC.

22
2. THE GLOBAL POLICY LANDSCAPE FOR COOPERATION ON CLIMATE CHANGE
2.1 Role of the UNFCCC
50. The previous section highlighted some of the challenges to national policy-making on climate
change, given the globalised context in which such policies are developed. It is worth inquiring what the
UNFCCC, as the main forum for cooperation on the global response to climate change, may offer as an
avenue for international cooperation on domestic policy efforts.
51. The UNFCCC, as an international treaty with 195 Parties consisting of sovereign nation states, is
centrally focused on the negotiation of state-to-state agreements such as the Kyoto Protocol (1997), the
Copenhagen Accord (2009) and the Cancun Agreements (2010). Negotiations are currently focused on
developing a new global agreement by 2015 under the auspices of the Durban Mandate (UNFCCC, 2011).
This negotiation aims to achieve “a protocol, another legal instrument or an agreed outcome with legal
force under the Convention applicable to all Parties”. (UNFCCC, 2011, §2) This universal legal agreement
should address mitigation, adaptation, finance, technology development and transfer, transparency of
action and support, and capacity-building.
52. The cornerstone of this new agreement will be state action. All Parties have agreed to submit
so-called ‘nationally-determined contributions’ (NDCs) during 2015 to be included in the new agreement.
The centrepiece of these contributions will be greenhouse gas mitigation, although it is expected that
Parties will continue to strengthen action on the other pillars of the agreement. The 2014 Lima Conference
of the Parties (COP20) negotiated loose, voluntary rules concerning the content of these NDCs in order to
ensure their ex-ante transparency and credibility. The Lima decision merely stated:
“Agrees that the information to be provided by Parties communicating their intended
nationally determined contributions, in order to facilitate clarity, transparency and
understanding, may include, as appropriate, inter alia, quantifiable information on the
reference point (including, as appropriate, a base year), time frames and/or periods for
implementation, scope and coverage, planning processes, assumptions and methodological
approaches including those for estimating and accounting for anthropogenic greenhouse
gas emissions and, as appropriate, removals …” (UNFCCC, 2014, §14)
53. In addition to the above paragraph, the Lima decision also concluded the discussion on the ex-ante
examination of proposed NDCs. Many Parties had hoped for a robust process in order to ensure the their
transparency and clarity, but in the final outcome this was watered down to a synthesis report by the
Secretariat on the aggregate effect of the contributions (UNFCCC, 2014, §16b).
54. The above-quoted decision has several implications for this discussion. First, mitigation
contributions will probably remain complex and diverse documents, albeit an improvement on the
Copenhagen pledges in terms of ex-ante transparency (Maljean-Dubois et al., 2014). NDCs will contain
multiple elements, from aggregate, economy-wide absolute targets to relative targets to sectoral policies
and measures. Countries have a wide degree of latitude to choose which of these elements they place in
their NDC (Spencer et al., 2014). Second, the inability to agree to a robust mechanism for the ex-ante

23
examination of NDCs suggests the difficulty of developing a stronger element of policy transparency, let
alone coordination, under the UNFCCC.
55. There are a number of reasons why this may be the case:
Parties may be reluctant to develop stronger mechanisms toward policy transparency under a
formal legal regime such as the UNFCCC. The connotations of legal obligation may be a
deterrent in this regard.
Action under the UNFCCC has been characterised since the mid-1990s by a lack of interest in
policies and instruments as such. Indeed countries have actively rejected the idea of
discussions on national policies and instruments, largely out of concern that this would
impinge on national sovereignty. The focus has been on negotiating new rounds of
international pledges, leaving it up to countries to achieve their pledges as they wish.
The large number and diversity of countries under the UNFCCC may preclude the kind of
detailed, technical exchanges that would be needed within a mechanism to increase the
transparency of and cooperation on national policies. The necessary sectoral technical
expertise may also be missing in the context of the UNFCCC.
56. Another aspect of the UNFCCC regime merits attention. The UNFCCC Conference of the Parties
established a further work stream in 2011 focused on increasing the ambition of state action before 2020.
Workstream 2 has begun to focus on sectoral policy opportunities or ‘international cooperative initiatives’
(ICIs), and has tried to involve expertise from the private sector as well as actors from civil society,
research and domestic policy-making in its workshops. It consists largely of in-session workshops, an
online portal summarising existing ICIs6 and a series of UNFCCC secretariat papers summarising
opportunities to enhance mitigation and develop ICIs (UNFCCC, 2014b). Additionally, the UNFCCC has
established the Climate Technology Centre and Network (CTCN), with the aim of facilitating the diffusion
of technology to developing countries.
57. Nonetheless, the UNFCCC remains largely focused on negotiating new rounds of state
contributions on climate change, with also a crucial role on the transparency of aggregate country-level
actions. This is arguably its core added value, as a treaty-based, structured, universal platform for
intergovernmental climate cooperation. A state-to-state agreement is, however, also of the utmost interest
to the private sector, in the sense that it makes national policies more credible and robust. Thus the
UNFCCC has an important role in aligning the expectations of the private sector behind the low-carbon
transition, even if policy details are elaborated at the national level.
58. In addition, the UNFCCC has an important role in gathering data and ensuring the transparency of
the achievement of contributions through the transparency regime developed since Cancun. This regime
does not operate at a high level of policy granularity, however. Further developed, these arrangements
under the UNFCCC could also facilitate the sharing of information on Parties’ actual policy efforts (e.g.,
6 http://unfccc.int/focus/mitigation/items/7907.php.

24
implementation, policy goals), which would improve the private sector’s visibility on actual markets
internationally and, perhaps, the coherence of national-level policies. This could also open the possibility
of more detailed and structured discussion elsewhere on the issues of market signals, the effectiveness of
carbon constraints and joint R&D efforts.
59. This paper has argued that there are international spill-overs from national climate policy which
could, if appropriately addressed, enhance countries’ ability to adopt lower-GHG economic paths.
However, in the foreseeable future it seems unlikely that the UNFCCC will develop significant further
capacities to create greater transparency, convergent expectations and cooperation at the level of specific
national policies in order to manage these spill-overs. The core value-added of the UNFCCC appears to be
its role as a locus for state-to-state agreements, which can nonetheless send important signals to the private
sector. The agreement can help to generalise long-term expectations about the broad direction of markets
and innovation (low- versus high-carbon) thus helping to support the broad strategic orientations of the
private sector (Haščič et al., 2011). However, a global agreement on climate change will need to be
subsequently implemented with ever-more stringent, yet still diverse, national policies. In consequence, the
policy cooperation challenges posed in this paper may not be significantly allayed solely by the negotiation
of a new global agreement on climate change.
2.2 ‘Sectoral Approaches’ Before Copenhagen
60. Before Copenhagen, much interest and ink were expended in developing the concept of ‘sectoral
approaches’ (Baron, 2007). This was motivated by similar considerations highlighted in this paper, namely
concerns about the distortion of trade and mitigation efforts in largely globalised sectors. The policy
discussion was focused in particular on three large GHG-emitting industrial sectors: cement, aluminium,
and steel. Each of these sectors was and still is organised under the auspices of an industry association
which played a role in the policy discussion: the Cement Sustainability Initiative; the International Iron and
Steel Institute (now Worldsteel); and the International Aluminium Institute. Much of the work was on
sharing best practice targeted to lowering GHGs, but industry, mostly in developed countries, also called
for a more universal approach, at a time where ambitious climate policy was implemented in some regions
(e.g. the EU ETS), but not in others.
61. At the same time, the UNFCCC expert community focused particularly on the development of
so-called sectoral market mechanisms. Developed countries were interested to see the Clean Development
Mechanism evolve into a more efficient mechanism which would cover entire sectors with a carbon price –
albeit with a view that developing countries might initially receive credits for their GHG reduction efforts
in these sectors. Moreover, policymakers in developed countries were likewise concerned about the
competitiveness impacts of divergent policy incentives in major EITE sectors. Sectoral approaches were
thus seen as a way towards a more level playing field, with similar incentives applied via the carbon
market. A more pragmatic route was followed by the Asia Pacific Partnership on Clean Development and
Climate (APP), who brought together government and private sector actors from Australia, Canada, China,
India, Japan, Korea and the United States. The APP sectoral task forces, which included cement, steel and
aluminium, focused on technical exchanges of policy experience and technological best practices, as well
as specific project implementation. APP stopped in 2011 after the change in the US administration.

25
62. The experience of sectoral approaches brings a number of lessons. First, although the pre-
Copenhagen discussion of sectoral approaches has largely disappeared, the motivations that drove the
discussion have not. Policymakers and global sectors continue to be concerned with international spill-
overs from national climate policies. Second, many developing countries saw sectoral approaches as
contradicting the principle of common but differentiated responsibilities, as some proposed that
international sectors be treated equally regardless of their country location. Third, analysts have
highlighted the lack of an institutional or legal basis for major cooperative initiatives in many sectors and
the lack of an anchor point for these initiatives in the legal apparatus of the UNFCCC (Baron et al., 2007).
Fourth, the objective of establishing global carbon markets in certain sectors was overly ambitious in the
face of countries’ different national circumstances, resources, policy capacities and preferences, even in
major globalised sectors.7 Common policy (such as cap setting) requires a degree of institutional
cooperation that is beyond the scope of the relationship between many jurisdictions. Some believe that
regional approaches are more promising, given the high degree of regional trade in many major sectors (for
example at the level of NAFTA, or the EU). At a global level or between very different jurisdictions, more
pragmatic approaches aiming at the exchange of best practice, implementation of pilot projects and ‘softer’
policy cooperation may be more promising.
63. We now turn to recent efforts that resemble this kind of policy dialogue and cooperation.
2.3 Recent International Cooperative Policy Initiatives
64. There is today a plethora of intergovernmental policy initiatives and dialogues taking place outside
the UNFCCC. Numerous examples can be cited from the last five or so years: the Clean Energy Ministerial
(CEM), Sustainable Energy For All (SE4ALL), the International Renewable Energy Agency (IRENA), the
International Partnership for Energy Efficiency Cooperation (IPEEC), the Technology Action Plans of the
Major Economies Forum in 2009, the G20, the Global CCS Institute, the Climate and Clean Air Coalition,
the World Bank Partnership for Market Readiness, etc. Figure 6 presents a non-comprehensive overview of
the growth of multilateral climate and energy related initiatives. This trend of new initiatives is matched by
existing structures working increasingly on energy, too. This growth has led to concerns of ‘overcrowding’
of international initiatives. There seems, however, to be a significant degree of organic cooperation
between initiatives to benefit from synergies and avoid duplication (Barnsley and Ahn, 2014). Against this,
however, some observers have also complained of a lack of political direction and political follow-up (see
Box 3 for how co-operation has been organised in the area of financial sector regulation).
65. Many of these initiatives, in particular those created recently, tend to be informal cooperation
platforms, as opposed to formal international organisations. In this regard, there seems to be a preference
for the flexibility and expediency given by less formal modes of cooperation. A downside is the potential
lack of resources and political buy-in from which some informal structures may suffer. A further
characteristic that can be noted is the high degree of participation of emerging countries, including in the
creation of recent initiatives. This indicates their high degree of interest and importance in international
7 The development of a more global carbon market than exists today remains worth pursuing. The
announcement that China may have a national emissions trading system in place by 2020, based on its
current pilot experiments, is a good sign in this direction, together with the launch of the Korea ETS this
year.

26
energy and climate issues. In comparison, smaller developing countries tend to be much less well-
represented. This is a gap which the CTCN under UNFCCC is trying to fill, as are many regional UN
bodies, and SE4ALL through their increasing work on energy and climate issues.
Figure 6. Growth of energy and climate related multilateral policy initiatives
Source: Barnsley and Ahn (2014). ASEAN: Association of Southeast Asian Nations, APEC: Asia-Pacific Economic Cooperation, APP:
Asia-Pacific Partnership on Clean Development and Climate, AU: African Union, CEM: Clean Energy Ministerial, CSLF: Carbon
Sequestration Leadership Forum, EU: European Union, G6/7/8 : Group of 6/7/8, G20: Group of 20, GBEP: Global Bioenergy
Partnership, GGGI: Global Green Growth Institute, IEA: International Energy Agency, IPEEC: International Partnership for Energy
Efficiency Cooperation, IRENA International Renewable Energy Agency, LAS: League of Arab States, OAS: Organization of
American States, OLADE: Organización Latinoamericana de Energía (Latin American Energy Organization), UNDP: United Nations
Development Programme, UN-Energy: United Nations-Energy, UNEP: United Nations Environment Program, UNIDO: United Nations
Industrial Development Organisation, UNFCCC: United Nations Framework Convention on Climate Change, SE4All: Sustainable
Energy for All, UfM: Union for the Mediterranean, MEF: Major Economies Forum, RCREEE Regional Center for Renewable Energy
and Energy Efficiency, REEEP: Renewable Energy and Energy Efficiency Partnership, REN21: Renewable Energy Policy Network for
the 21st Century, 3GF: Global Green Growth Forum.
66. An important aspect to highlight is the continuum that exists in terms of the modes of cooperation
undertaken by these initiatives. It has already been noted that international sectoral initiatives pre-
Copenhagen may have been too ambitious, often aiming at full regulatory harmonisation (e.g. an
international cap and trade scheme for entire industrial sectors). While not pretending to
comprehensiveness, Annex 3 tries to construct a first classification of the different modes of cooperation
and provide examples thereof.
67. The growth of new initiatives in this domain has been spectacular, and they certainly bring
interesting ideas to the table with the modalities of cooperation that they pursue. Several points for
discussion can be highlighted.
27
Analysts underscore the importance of the alignment of domestic policies and international
initiatives in order to create the right enabling environment for the uptake of low-emissions
technologies. Many initiatives pursue a soft approach, focusing more on policy dialogue,
knowledge generation and capacity-building or interventions at the project rather than policy
level. There may be scope to improve the link between domestic policy efforts and multilateral
initiatives to promote what could be termed ‘internationally-coordinated adoption’ of domestic
policies.
The proliferation of initiatives has led to concerns of overcrowding. While studies suggest that
there is a degree of coordination taking place between initiatives (Barnsley and Ahn, 2014), some
also point to a lack of high-level political engagement that would give initiatives stronger
mandates, direction and follow-up (Box 3).
Many initiatives focus on ‘soft cooperation’. Undoubtedly, there is a value added from this.
Nonetheless, it is an open question whether more action-oriented cooperation modalities could be
developed, focusing on joint R&D, practical discussions on domestic policy implementation and
possibly greater international cooperation on domestic policies.
Box 3. The Policy Coordination Challenge in Financial Governance
Subsequent to the financial crisis, policymakers enacted swift and far reaching reforms (although more
remains to be done). This was achieved through the high-level coordination of a diverse range of policy fora,
followed by national implementation of agreed regulations. In this, the G20 Leaders’ Forum played an
important role providing political guidance and direction to the reforms which were delivered in other, often
sectoral, fora (for example the Basel Committee for Banking Stability). Some commentators presented the G20
as a global “Executive Committee”, coordinating post-crisis reforms. Accordingly, some commentators have
argued that there has been a falling off of the activism of the G20 as the crisis abated.
The crisis also led to the creation of the Financial Stability Board (FSB), which grew out of the Financial
Stability Forum (FSF). Compared to the FSF, the FSB enlarged participation to include all G20 countries, and a
number of smaller financial markets such as Singapore and Switzerland. Each member is represented by
Treasury, Central Bank, and securities regulator. The key international institutions are also members: the IMF,
OECD, Bank of International Settlements, World Bank, International Accounting Standards Board, International
Organisation of Securities Commissions, International Association of Insurance Supervisors, etc. A noteworthy
innovation is the formality of the FSB, which is incorporated under Swiss civil code; members subscribe to a
charter and broad articles of agreement. The FSB cannot issue binding regulation: its articles of association
state that the FSB’s activities “shall not be binding or give rise to any legal rights or obligations”. Its main
function is to ensure the coordination and monitoring of the implementation of international standards, to
keep the stability of the financial sector under strategic review, and to liaise directly with the leaders’ level
under the auspices of the G20.
While the climate change issue benefits from a dedicated intergovernmental process, the UNFCCC, which
was not the case for finance regulation, there are couple of interesting lessons to draw from this example,
including on potential gaps in today’s international climate governance. The first relates to the importance of
creating a structural link to political leadership at the highest level. The FSB reports directly to the G20.

28
Secondly, the combination of national governments and policy organisations from multiple domains allows the
FSB to play the role of agenda setter and watchdog, and to understand the spill-overs from one regulatory
area to another. In a similar way, coordinating multiple sectoral organisations and fora presents a challenge for
climate governance, as do the spill-overs between regulatory areas (such as climate and trade, or climate and
investment). Thirdly, the FSB is endowed with a strong institutional and technical capacity. While many climate
initiatives are informal, the existence of institutional and analytical capacity is a plus. Fourthly, the FSB includes
major emerging countries as equal partners. This is not the case in some energy or climate related fora or
organisations, and indeed the G20 principles on energy set the objective of increasing participation of
emerging countries in global energy governance (cf. G20, 2014c).
Source : Spencer and Hipwell, (2013).

29
SUMMARY
68. This paper has surveyed the global policy landscape for climate change cooperation in the light of
the challenges outlined in Section 1. Section 2 argued that the UNFCCC has a crucial role to play in
formulating state-to-state agreements that can make national policies more robust and credible, thus
helping to align the expectations of the private sector behind the low-carbon transition. Beyond, the
UNFCCC could also generate transparency on domestic policy implementation and design, although there
may be questions about the level of granularity with which it could do this. If done well, it could improve
the private sector’s visibility on low-carbon technologies and markets internationally and ideally improve
the coherence of national-level policies.
69. Section 2.3 highlighted other cooperation initiatives on climate change. We can reflect on these in
terms of the three policy challenges laid out in Section 1. In the area of market deployment (Section 1.1.1),
a number of initiatives do focus on increasing the transparency and learning of different national policies.
Few efforts have been made to move into deeper cooperation, such as the adoption of internationally
coordinated standards or targets in global markets for low-carbon technologies. The G20’s recent initiative
on performance standards for trucks is an interesting innovation in this regard.
70. In the area of transformation and competitiveness of EITE sectors, there are a number of examples
that can be discussed. These include efforts at regional harmonisation under the EU ETS and the carbon
market link between California and Quebec. These are interesting examples, particularly given the strong
regionalisation of EITE sectors (IEA, 2014b). However, on the one hand, the example of the EU ETS
shows that even very tight regional cooperation has not completely removed concerns about carbon
leakage; indeed, the global picture is that the majority of GHG-intensive facilities are not yet subject to a
direct constraint on their emissions. On the other hand, as more countries take on GHG mitigation
objectives, the question of how to best address these large emitters will quickly arise. Will countries seize
the opportunity to exchange information, or even policy approaches? The World Bank Partnership for
Market Readiness provides the precedent of a forum in which domestic policymakers could exchange
experience on how to address competitiveness issues arising from countries progressively strengthening
their GHG constraints, for instance.
71. There are few examples of concrete international collaboration on R&D in low carbon
technologies that would have delivered significant breakthroughs. Structures for such collaboration exist,
of course (e.g. the IEA Implementing Agreements; IEA, 2011). The R&D effort for the transition to a low-
carbon economy needs to occur in a range of technologies, and should be driven significantly by broad
incentives (carbon pricing, standards, etc.).
72. However, ‘breakthrough’ technologies (e.g. carbon capture and storage for electricity and industry,
electricity storage, to name just a few) may warrant special attention from the international community, as
they are in need of a significant technology push to demonstrate commercial viability and to improve their
competitiveness.
73. The urgency of addressing climate change is at odds with an incremental approach to making the
transition to a low carbon economy. As a result, more stringent national policies can be expected to be
30
imposed over the next ten years if the 2°C target is to remain achievable. Such policies will necessarily
reflect the circumstances and preferences of individual countries, including their contribution to global
mitigation. However, they are not implemented in a vacuum. Climate change is obviously a collective
action challenge, so each country has good reason to be concerned about the action of its partners, all the
more so as international spill-overs of domestic action will be ubiquitous if and when countries take
serious climate action at home.
74. While this is nothing new, the required technical and infrastructure transformation required by a
global response to climate change implies the very rapid transmission of such spill-overs. The issue raised
here is how to ensure that this development will be harmonious rather than disruptive – notwithstanding
the fact that some activities and technologies will win and others will lose in the transition.
75. From the perspective of a national policymaker, the speed and scale of the necessary
transformation are likely to raise concerns which may not be addressed solely via UNFCCC negotiations.
These include issues of competitive distortion caused by different regulations, the effectiveness of solely
national R&D programmes and the coherence, effectiveness and stability of different national policies to
deploy clean energy technologies.
76. A global agreement under the UNFCCC would play a crucial role in this regard, sending a strong
signal to align long-term expectations towards a low-carbon global economy, and giving confidence to
national policymakers and the private sector. In order to do so, it is important that it contains credible long-
term collective and individual goals to guide action. However, by itself it seems unlikely that the UNFCCC
will have the capacity to initiate sector-specific activities involving domestic policymakers.
77. This may explain why in recent years a number of initiatives in the area of climate and energy have
developed outside the UNFCCC. These cover a wide variety of sectors, institutional settings, geometries of
participation, and modalities of cooperation. Generally speaking, they appear to be more focused on soft
cooperation and dialogue than on concrete R&D efforts, let alone regulatory harmonisation.
78. There may be reasons why countries may be reluctant to engage more internationally on their
domestic actions to fight climate change. However, to be effective in a globalised economy, policymakers
will have to take into account the international dimensions of domestic actions. The central interrogation of
this paper is on the value of international discussions on domestic climate policy actions as a means to
enhance their efficiency, effectiveness, and bring about a harmonious, if not fully harmonised, transition to
a low-carbon economy. The recently agreed G20 Energy Efficiency Action Plan indicates that countries
are ready to collaborate, and even to coordinate some elements of their domestic policies in order to drive
global market transformations. If successful, this type of initiative should also facilitate the private sector
response. It would also set an important precedent for broader international collaboration on domestic
climate policies.

31
REFERENCES
Abrell, J. et al. (2011), “Assessing the Impact of the EU ETS Using Firm Level Data”, Brussels: Bruegel.
www.bruegel.org/publications/publication-detail/publication/579-assessing-the-impact-of-the-eu-
ets-using-firm-level-data/.
Baron, R. et al. (2007), “Sectoral Approaches to Greenhouse Gas Mitigation: Exploring Issues for Heavy
Industry”, International Energy Agency. Paris: OECD/IEA.
Barnsley, I. and S. Ahn (2014), “Mapping Multilateral Collaboration on Low-Carbon Energy
Technologies”, IEA Insights Series 2014. International Energy Agency. Paris: OECD/IEA.
Bolscher H. et al. (2013), Carbon Leakage Evidence Project: Factsheet for selected sectors, commissioned
for DG Clima, European Commission, Brussels. Rotterdam: Ecorys.
http://ec.europa.eu/clima/policies/ets/cap/leakage/docs/cl_evidence_factsheets_en.pdf.
Branger F. and P. Quirion (2014), “Reaping the Carbon Rent : Abatement and Overallocation Profits in the
European Cement Industry, Insights from an LMDI Decomposition Analysis”, FEEM Working
Paper 2014-077. http://papers.ssrn.com/sol3/papers.cfm?abstract_id=2497474.
CEFIC & Ecorys (2013), “European Chemistry for Growth: Unlocking a competitive, low carbon and
energy efficient future”, CEFIC www.cefic.org/Documents/PolicyCentre/Energy-Roadmap-
The%20Report-European-chemistry-for-growth.pdf.
Climate Action Tracker (2014), China, US and EU post-2020 Plans Reduce Projected Warming, Climate
Action Tracker policy brief.
http://climateactiontracker.org/assets/publications/briefing_papers/CAT_Briefing_10122014.pdf.
De Coninck, H. et al (2008), “International Technology-Oriented Agreements to Address Climate
Change”, Energy Policy, Vol. 36, No. 1, pp. 335–356.
Dröge, S.et al., (2009), “Tackling Leakage in a World of Unequal Carbon Prices”, Climate Strategies, July,
Cambridge. www.centre-cired.fr/IMG/pdf/cs_tackling_leakage_report_final.pdf.
Ellis, M. and V. Rozite (2013), “A Spanner in the Works? Are ambitious energy efficiency policy
objectives frustrated by the standardisation processes or can ambitious technical standards accelerate
progress?”, ECEEE (European Council for an Energy Efficient Economy) 2013 Summer Study
Proceedings, ECEEE, Stockholm, pp. 195-204.
http://proceedings.eceee.org/visabstrakt.php?event=3&doc=1-367-13, accessed 28 February 2014.
European Commission (2014), Results of Carbon Leakage Assessments for 2015-19 List (based on NACE
Rev.2), as sent to the Climate Change Committee on 5 May 2014.
http://ec.europa.eu/clima/policies/ets/cap/leakage/docs/carbon_leakage_detailed_info_en.pdf.

32
G20 (2014), G20 Leaders’ Communiqué, Brisbane Summit, 15-16 November 2014. https://g20.org/wp-
content/uploads/2014/12/brisbane_g20_leaders_summit_communique1.pdf.
G20 (2014b), G20 Energy Efficiency Action Plan: Voluntary Collaboration on Energy Efficiency.
www.g20.org/sites/default/files/g20_resources/library/g20_energy_efficiency_action_plan.pdf.
G20 (2014c), G20 Principles on Energy Collaboration.
https://g20.org/wp-content/uploads/2014/12/g20_principles_energy_collaboration.pdf.
Gallagher, Kelly Sims (2014). The Globalization of Clean Energy Technology: Lessons from China, MIT
Press.
Grübler and Riahi (2010), “Do Governments Have the Right Mix in their Energy R&D Portfolios?”,
Carbon Management, Vol. 1, No. 1, pp. 79-87.
Grübler, A. et al. (2012), “Policies for the Energy Technology System”, In Global Energy Assessment -
Toward a Sustainable Future, pp. 1665-1744. New York: Cambridge University Press.
Grübler, A. et al (2014), “Global R&D, Market Formation, and Diffusion Investments in Energy
Technology Innovation”, in Grübler and Wilson (eds.), Energy Technology Innovation: Learning
from Historical Successes and Failures, pp. 292-308. New York: Cambridge University Press.
Grübler, A. et al (2014b), “Technology Portfolios: Modelling Technology Uncertainty and Innovation
Risks”, in Grübler and Wilson (eds.), Energy Technology Innovation: Learning From Historical
Successes and Failures, New York: Cambridge University Press.
Hascic, I., N. Johnstone and O. Trigui (2011), "Environmental Policy, Multilateral Environmental
Agreements and International Markets for Innovation", in OECD, Invention and Transfer of
Environmental Technologies, OECD Publishing, Paris.
DOI: http://dx.doi.org/10.1787/9789264115620-4-en.
Hood, C. (2010), “Reviewing Existing and Proposed Emissions Trading Systems”, IEA Information Paper,
IEA/OECD, Paris. www.iea.org/publications/freepublications/publication/ets_paper2010.pdf.
Huberty, M. and G. Zachmann (2011), “Green Exports and the Global Product Space: Prospects for EU
Industrial Policy”, Bruegel.
http://aei.pitt.edu/32003/1/Green_exports_and_the_global_product_space__Prospects_for_EU_indu
strial_policy_%28English%29[1].pdf.
IMF (n.d.), IMF World Economic Outlook Database, October 2014, International Monetary Fund,
Washington D.C. http://www.imf.org/external/pubs/ft/weo/2014/02/weodata/index.aspx.
IPCC (2014), “Cross Cutting Investment and Finance Issues”, Climate Change 2014: Mitigation of
Climate Change, contribution of Working Group III to the Fifth Assessment Report of the
Intergovernmental Panel on Climate Change.
www.ipcc.ch/pdf/assessment-report/ar5/wg3/ipcc_wg3_ar5_chapter16.pdf.

33
IEA (2011), Energy Technology Initiatives. International Energy Agency, Paris: OECD/IEA.
IEA (2012), World Energy Outlook 2012, International Energy Agency, Paris: OECD/IEA.
IEA (2013), “Energy and Competitiveness”, World Energy Outlook 2013, International Energy Agency,
Paris: OECD/IEA.
IEA (2014a), Energy Technology Perspectives 2014, International Energy Agency, Paris: OECD/IEA.
IEA (2014b), CCS 2014: What Lies in Store for CCS, IEA Insights Series, International Energy Agency,
Paris: OECD/IEA. www.iea.org/publications/insights/insightpublications/ccs-2014---what-lies-in-
store-for-ccs.html.
International Standards Organisation (2008), Practical Tools for Addressing Climate Change.
www.iso.org/iso/home/store/publication_item.htm?pid=PUB100067.
Ji, L.F. et al. (2014), “The Economic Impact of Carbon Pricing with Regulated Electricity Prices in
China—An application of a computable general equilibrium “, Energy Policy, Vol. 75, December,
pp. 46–56. www.sciencedirect.com/science/article/pii/S0301421514004492.
Krugman P., (1995) “Growing World Trade: Causes and Consequences”, Brookings Papers on Economic
Activity, Brookings Institute.
www.brookings.edu/~/media/Projects/BPEA/1995%201/1995a_bpea_krugman_cooper_srinivasan.P
DF.
Maljean-Dubois, S., Wemaëre, M. and Spencer, T. (2014), “A Comprehensive Assessment of Options for
the Legal Form of the Paris Climate Agreement”, Working Papers N°15/14 IDDRI, Paris, France.
Nachmany, M. et al (2014), “The GLOBE Climate Legislation Study: A Review of Climate Change
Legislation in 66 Countries. Fourth Edition.” London: GLOBE International and the Grantham
Research Institute, London School of Economics.
Neuhoff, K. 2011, Climate Policy after Copenhagen, The Role of Carbon Pricing, Cambridge: Cambridge
University Press.
Neuhoff, K et al. (2014a), “Carbon Control and Competitiveness Post 2020: The Cement Report”, Climate
Strategies, University College London. www.iddri.org/Publications/Carbon-Control-and-
Competitiveness-Post-2020-The-Cement-Report.
Neuhoff, K et al. (2014b), “Carbon Control and Competitiveness Post-2020: The Steel Report”, Climate
Strategies, University College London.
http://climatestrategies.org/wp-content/uploads/2014/10/20141014-steel-report---final-formatted-
4.3.pdf.
OECD (2012), OECD Factbook 2011-2012: Economic, Environmental and Social Statistics, OECD
Publishing, Paris.

34
www.oecd-ilibrary.org/sites/factbook-2011-
en/04/01/01/index.html?itemId=/content/chapter/factbook-2011-33-en
OECD (2013), “Greening Global Value Chains: Innovation and the International Diffusion of
Technologies and Knowledge”, OECD Green Growth Papers, No. 2013/05, OECD Publishing,
Paris. DOI: http://dx.doi.org/10.1787/5k483jn87hnv-en.
Platzer, M.D., 2012, “U.S. Wind Turbine Manufacturing: Federal Support for an Emerging Industry”, US
Congressional Research Service, United States Congress.
Sartor, O., T. Spencer, (2013), “An Empirical Assessment of Carbon Leakage Risks in Poland”, IDDRI
Working Papers, N°08/2013, Paris: IDDRI. www.iddri.org/Publications/An-Empirical-Assessment-
of-the-Risk-of-Carbon-Leakage-in-Poland.
Sartor, O., et al (2014), “Addressing industrial competitiveness concerns in the 2030 EU Climate and
Energy Package”, IDDRI Policy Briefs N°03/2014, IDDRI, Paris.
Spencer, T. et al (2012), “The Political Economy of Australia’s Climate Change and Clean Energy
Legislation: lessons learned”, IDDRI Working Papers, N°21/2012, Paris: IDDRI.
www.iddri.org/Publications/The-political-economy-of-Australia-s-climate-change-and-clean-
energy-legislation-lessons-learned.
Spencer, T. and E. Hipwell (2013), “Coordinating, Mandating, Monitoring: What Can the Post-2015
Climate Regime Learn From Global Financial Governance?”, Carbon Climate Law Review, Issue
4/2013, pp. 293-305. www.iddri.org/Publications/Coordinating,Mandating,Monitoring-What-Can-
the-Post-2015-Climate-Regime-Learn-from-Financial-Governance.
Spencer, T. et al., (2014), “The Mitigation Framework in the 2015 Climate Change Agreement: from
targets to pathways”, IDDRI Working Papers, N°07/2014, Paris: IDDRI.
www.iddri.org/Publications/The-mitigation-framework-in-the-2015-climate-change-agreement-
from-targets-to-pathways.
State Council, People’s Republic of China (2014), “Energy Development Strategy Action Plan (2014-
2020)”, Beijing.
Sugathan, M (2013), “Winds of Change and Rays of Hope: How Can the Multilateral Trading System
Facilitate Trade in Clean Energy Technologies and Services?”, TheE15Initiative.
http://e15initiative.org/publications/winds-of-change-and-rays-of-hope-how-can-the-multilateral-
trading-system-facilitate-trade-in-clean-energy-technologies-and-services/.
UNFCCC (2011), Establishment of an Ad Hoc Working Group on the Durban Platform for Enhanced
Action, Decision 1/CP.17. http://unfccc.int/resource/docs/2011/cop17/eng/09a01.pdf#page=2.
UNFCCC (2014), Lima Call for Climate Action, Decision 1/CP.20.
https://unfccc.int/files/meetings/lima_dec_2014/application/pdf/auv_cop20_lima_call_for_climate_a
ction.pdf.

35
UNFCCC (2014b), “Updated Compilation of Information on the Mitigation Benefits of Actions, Initiatives
and Options to Enhance Mitigation Ambition”, technical paper, FCCC/TP/2014/13.
http://unfccc.int/resource/docs/2013/tp/08.pdf.
Wang X. J.F. Li and Y.X. Zhang (2010), “Can an Export Tax be Genuine Climate Policy? An analysis of
China’s export tax and export VAT refund rebate policies”, IDDRI Working Papers, N° 08/2010,
Paris: IDDRI. www.iddri.org/Publications/Collections/Idees-pour-le-debat/IPD%201008%20-
%20wang,%20li,%20zhang.pdf.
Wiesenthal, T. et al. (2009), R&D Investment in the Priority Technologies of the European Strategic
Energy Technology Plan, JRC Reference Reports, Joint Research Centre and the European
Commission. http://ftp.jrc.es/EURdoc/RD%20Investment%20Carbon%20(web).pdf.
Wilson, C. and A. Grübler (2014), “The Energy Technology Innovation System”, in Grübler and Wilson
(eds.), Energy Technology Innovation: Learning From Historical Successes and Failures, New
York: Cambridge University Press.

36
ANNEX 1: SOLAR PHOTOVOLTAIC SUPPORT POLICIES IN THE EU
Current national support schemes, PV, EU27
Country Type Start year Comments
GR Feed-in tariffs before 1997
ES Premium tariffs/
Feed-in tariffs
1998 (currently suspended). Plant operators may choose between a feed-in tariff and a bonus on the top of the market price.
DK Premium tariffs before 1997
AT Feed-in tariffs 1998
PL Green certificates 2000
FR Feed-in tariffs 2001 A Premium tariff scheme is currently under discussion.
LV Feed-in tariffs 2001
BE Green certificates 2002
LT Feed-in tariffs
awarded by
tenders
2002
CZ Feed-in tariffs 2002
SE Green certificates 2002
BG Feed-in tariffs 2003
EE Feed-in tariffs 2003
MT Feed-in tariffs 2003
RO Green certificates 2004
SI Feed-in tariffs 2004
IT Feed-in tariffs 2005
SK Feed-in tariffs 2005
CY Feed-in tariffs 2006
IE Feed-in tariffs 2006
NL Premium tariffs/
Investment grants
2009

37
FI Feed-in tariffs 2011
GB Premium tariffs
(with Contract for
Difference)
2014 The Contract for Difference works by stabilising revenues for generators at a fixed price level known as the ‘strike price’. Generators will receive revenue from selling their electricity into the market as usual. However, when the market reference price is below the strike price they will also receive a top-up payment from suppliers for the additional amount. Conversely if the reference price is above the strike price, the generator must pay back the difference.
Green certificates 2004 - 2014
DE Premium tariffs 2014 Market premium. Plant operators of RES plants exceeding an installed capacity of 500 kW are supported by a market premium for electricity they sell directly. The amount of the market premium shall be calculated each month.
Source: www.res-legal.eu/compare-support-schemes/.

38
ANNEX 2: SOLAR PHOTOVOLTAIC SUPPORT POLICIES IN CHINA
Date of implementation
Policy name Policy description
Jan. 2006 Notice of income tax deduction for enterprises engaged in R&D activities (Cai Shui (2006) No.88)
R&D costs can be deduced at the rate of 150% from income tax.
Costs related to the training of own employees for R&D activities will be deduced from income tax as long as the sum is less than 2.5% of total base taxable.
Accelerated discounting rate for R&D equipment.
Jan 2008 State Council Order No.512 on the Implementation Regulations of Corporate Income Tax Law
0% income tax for first three years, and 50% reduction of income tax rates for years 4 to 6 for PV production firms. (standard corporate income tax rate in China: 25%).
Mar. 2009 Provisional Regulations on subsidies for building-integrated photovoltaics (Cai Jian (2009) No.129)
Benchmark subsidy level: 20 Yuan/Wp to building-integrated PV projects.
Jul. 2009 Notice of the Implementation of the Golden Sun Project (Cai Jian (2009)
Grants of 50% of the funding needed for PV power projects (with grid connection); and grants of 70% for PV power investment in remote regions (no grid connection).
Jul. 2011 NDRC Notice of PV electricity grid price (Fa Gai Jia Ge (2011) No.1594)
PV electricity grid price is fixed at 1 Yuan/Kwh (and 1.15 Yuan/kwh for Tibet).
Sept. 2011 Notice for Strengthening the Management of the Golden Sun and building-integrated PV projects (Cai Jian (2010) No. 662)
Subsidies for project installation and other costs (excluding purchasing costs): 4, 6 or 10 Yuan/W. 50% subsidies for the cost of panels (silicon), inverters and electricity storage facilities, paid directly to production firms.
Feb. 2012 PV Industry 12th FYP (2011-2015), MIIT
By 2015:
Polysilicon capacity of leading firms to reach 50kt; PV cells at 5GW.
Efficiency of mono-silicon cells to reach 21%, poly-silicon cells to reach 19% and thin-films 12%.
To increase the industrial scale of new general thin-film production.
Costs of PV cells to reach 7k Yuan/Kw, PV systems to reach 13k Yuan/Kw and PV electricity generation costs to reach 0.8 Yuan/Kwh.
Mar. 2012 PV electricity technology 12th FYP (2011-2015), MOST
Ensure the economy of scale of PV technology.
Continue R&D into new and emerging PV technologies.

39
Mar. 2012 Provisional Regulation of the Renewable Energy Electricity Price Added Subsidy Fund (Cai Jian (2012) No. 102)
Subsidies for PV power grid connection, construction and maintenance, to project developers, based on the distance of the connection: 0.01, 0.02 and 0.03 Yuan/kwh for <50km, 50km-100km and >100km respectively.
Sept 2012 China Development Bank, NDRC Guidelines to ensure that the necessary loans are provided to 12 PV firms in China.
By 2015, PV electricity installation to reach 21 GW and annual electricity generation to reach 25 billion Kwh.
Total Distributed PV electricity capacity in Eastern regions to reach 10 GW.
To establish 100 renewable energy pilot cities and 1,000 parks/districts.
Sept 2012 PV Electricity 12th FYP (2011-2015)
Sept 2012 Notice of applications for large scale Distributed PV Electricity Power pilot projects (National Energy Administration)
To support 3 pilot projects for each province with a unit capacity of less than 500 MW.
Oct 2012 Guidance for Distributed PV Electricity Power Pilots Implementation Plan (National Energy Administration)
Provision of formalised procedures to implement such projects.
Oct 2012 State Grid’s Notice on strengthening PV electricity grid connection
Grid connection work will be started within 20 days of a request from PV firms.
Free connection for PV installations with less than 6MW and below 10kV.
Grid will purchase PV electricity surplus.
[zero cost for project implementers]
15 July 2013
Suggestions on promoting the healthy development of PV industry
(关于促进光伏产业健康发展的若干
意见)
PV sector is strategic and emerging sector that will grand China continuous competitiveness at global level.
35GW of installed PV power by 2015, with an annual growth rate of 10GW for 2013-2015.
Priority is distributed PV power.
General guidance on PV sector restructuring and policies areas is given.
18 July 2013 Provisional Regulations of distributed power generation
(分布式发电管理暂行办法)
Grid should provide facility and takes the charge of the connection of distributed power (including PV power).
Major electricity generated from distributed power is for own use. The rest can be sold to the grid.
Subsidies are given whether to the construction or the unit electricity price
24 July 2013 Notice on subsidies of distributed PV power generation
(关于分布式光伏发电实行按照电量
Subsidies based on unit of electricity generated.
Subsidies will be given by MOF through the grid to PV power installers.

40
补贴政策等有关问题的通知) Other RENs, such as PV power station, wind power station, etc. continue to receive subsidies previously defined by other policies.
Notice on the development of pilot distributed PV power projects
(关于开展分布式光伏发电应用示范
区建设的通知)
Identify 18 pilot projects to be conducted at different regions in China.
Major use of electricity from distributed PV power is own use.
The rest of electricity is purchased by the grid.
22 August 2014 Notice of supporting financial services of distributed PV power generation
(关于支持分布式光伏发电金融服务
的意见)
CDB provides loan facilities to distributed PV power projects.
In particular, in association with national and local pilot projects of low-carbon cities and distributed PV power generation.
CDB provides facilities and flexibilities on third-party insurance and guarantee systems for distributed PV power projects.
26 August 2014 Notice on the use of pricing policies to stimulate the development of PV sector
(关于发挥价格杠杆作用促进光伏产
业健康发展的通知)
FIT at 1, 0.95 and 0.90Yuan/kwh based on regions for PV power generation station. Difference with conventional electricity grid price is covered by REN Development Fund.
Unit subsidies of 0.42Yuan/kwh for distributed PV power. This is paid by REN Development Fund via the grid.
27 August 2014 Notice on the adjustment of additive fees of renewable energy and environmental protection electricity price.
(关于调整可再生能源电价附加标准
与环保电价的有关事项的通知)
Increase the REN additive fee from 0.008Yuan/kwh to 0.015Yuan/kwh for electricity use except for agricultural and households.
16 September 2013
Standards of PV manufacturing
sectors (光伏制造行业规范条件) Strictly limit pure expansion of PV production
capacity, own capital rate of total investment of new expansion/installation of PV production capacity should be higher than 20%.
PV production firms must possess R&D activities: for each year, at least 3% (and more less than 10Mn Yuan) of total sale revenue of the firm should be used to conduct R&D and production process improvement activities.
Minimal annual production capacity is set: 3000ton for polycilicon, 1000ton for silicon ingot and rod, 50Mn pieces for silicon wafers (pellet), 200MWp for PV cells and panels, 50MWp for thin film PV panels.
Minimum technical standard of products, energy intensity, water consumption standards for existing PV production firms.
More stringent minimum technical standard for new installations of PV production capacity.

41
24 September 2013
Provisional regulation of PV power station
Requirement of good planning of PV power station installation.
Detailed administrative plan of PV power station installation.
29 September 2013
Notice on the VAT of PV power generation
(关于光伏发电增值税政策的通知)
From 1 Oct. 2013 to 31 Dec. 2015, 50% reduction of VAT of PV power electricity sold from generator.
11 October 2013 Provisional regulation of Standards of PV manufacturing sectors
(光伏制造行业规范公告管理暂行办
法)
Implementation plan of assessing the compliance of PV production firms to standards
published in “Standards of PV manufacturing
sectors”.
29 October 2013 Letter for consultation of distributed PV power generation activities and scales in 2013 and 2014
(关于征求2013、2014年光伏发电建
设规模的函)
NEA requires local governments to provide 2013 distributed PV power generation development report and provide suggestions for 2014 targets.
18 November 2013
Notice of the publication of Provisional regulation of distributed PV power generation projects
(关于印发分布式光伏发电项目管理
暂行办法的通知).
Provide regulations for distributed PV power projects.
19 November 2013
Notice of the exemption of governmental funds added fees of own use redistributd PV power
(关于对分布式光伏发电自发自用电
量免征政府性基金有关问题的通知).
REN electricity price added fees, National key hydro power fund added fees, Supportive Fund for migration due to key hydro power installation added fees, Agricultural loans Fund added fees are usually collected from electricity price in China. This notice exempts these four fees from own use electricity generated by distributed PV power.
Source: IDDRI, based on online documentation.

42
ANNEX 3: A TYPOLOGY OF COOPERATION MODES
IN INTERNATIONAL INITIATIVES ON CLIMATE CHANGE
Mode of cooperation Example
Regulatory harmonisation Regulations for the energy efficiency of ships adopted by the International Maritime Organisation (IMO) in 2011 under the MARPOL treaty, and entering into force on January 1 2013.
Voluntary regulatory standards or international voluntary benchmarks
The development by the US, EU, Australia and China of energy efficiency standards for external power supplies using a standardised testing methodologies, and a flexible ‘tiered’ system of energy performance standards. The US, Australia, Europe, China, Korea and Canada have introduced domestic policy measures based on the performance standards developed (cf Ellis and Rozite, 2013)
‘Soft’ cooperation through capacity building, knowledge and best practice exchange, creation of new knowledge networks
Many initiatives focus on policy dialogue and capacity building activities. Indeed, this kind of activity seems to predominate in multilateral initiatives on energy and climate. While often seen as less ‘action-oriented’, such capacity building initiatives can have important, albeit perhaps less visible, benefits (Baker and McKenzie, 2009).
Knowledge production and dissemination
Some initiatives focus on the production and dissemination of new knowledge, as a policy support to government authorities and other stakeholders such as the private sector. Examples include the technology roadmaps produced by the IEA, or the Global Atlas for Renewable Energy undertaken by the Multilateral Solar and Wind Working Group of the Clean Energy Ministerial.
Tracking progress on implementation Some initiatives also include a component of tracking progress on policy adoption, and the implementation and achievement of policy pledges.
Source: authors.