Reduction of Active Pharmaceutical Ingredients - VA-teknik, LTH
76
Water and Environmental Engineering Department of Chemical Engineering Reduction of Active Pharmaceutical Ingredients and Oestrogens in Wastewater - using Powdered Activated Carbon Master Thesis by Caroline Säfström May 2008
Transcript of Reduction of Active Pharmaceutical Ingredients - VA-teknik, LTH
Water and Environmental Engineering Department of Chemical Engineering
Reduction of Active Pharmaceutical Ingredients and Oestrogens in Wastewater - using Powdered Activated Carbon
Master Thesis by
Caroline Säfström
May 2008


VattenförInstitutionLunds Un
Re
Postal adP.O. BoxSE-221 0Sweden
rsörjnings- ochnen för Kemitniversitet
eduction
Supervisor
Examiner:
Picture
1. W
2. LaEn
3. Ph
4. MEn
ddress: x 124 00 Lund
h Avloppsteknteknik
n of AcOe
- us
W
: Pro
Pro
es on front pag
Water (Photo: C
aboratory set ngineering, LT
harmaceuticals
easurements ngineering, LT
nik
ctive Phestrogen
sing Powd
Master The
Caro
Water and EnDepartment
ofessor Jes la
ofessor Ann-
ge:
Caroline Säfstr
up at WateTH, Lund Uni
s (Photo: Caro
at Water aTH, Lund Uni
Visiting adGetingeväg
WDLu
harmacns in W
dered Acti
esis number:
oline Säfs
nvironmentaof Chemical
May 2008
a Cour Jansen
Sofi Jönsson
röm)
r and Enviroiversity, Swed
oline Säfström
and Environmiversity, Swed
ddress: gen 60
Water and Enviepartment of Cund University
ceuticalWastewa
ivated Car
2008-05 by
tröm
al Engineerinl Engineering
n
n
onmental Engden (Photo: Th
m)
mental Enginden (Photo: Ca
ironmental EnChemical Engy, Sweden
l Ingredater
rbon
ng g
gineering, Deheres Söderbe
neering, Deparoline Säfströ
T++T+Ww
ngineering gineering
dients a
epartment of erg)
partment of öm)
Telephone: + 46 46-222 8+46 46-222 00Telefax: +46 46-222 45Web address:www.vateknik
and
Chemical
Chemical
2 85 0 00
5 26 : k.lth.se


“Half the modern drugs could well be thrown out the window except that the birds might eat them.”
Martin H. Fischer

i
ABSTRACTPharmaceuticals in the effluent from wastewater treatment plants are today released to recipients and thus could constitute a possible threat for the environment. There is no specific treatment process used in wastewater treatment plants in Sweden today in order to remove pharmaceuticals. In this study Powdered Activated Carbon (PAC) has been investigated as a method to increase removal of Active Pharmaceutical Ingredients (APIs) and oestrogens in the biological part of wastewater treatment plants. This has been done through laboratory experiments scaled to correspond to the biological wastewater treatment process at Källby wastewater treatment plant, situated in Lund, in the south of Sweden.
It was found that, depending on the amount of PAC added and the reaction time, up to 100 percent of the APIs and oestrogens could be removed from the wastewater. An addition of 0.05 g PAC per litre artificial wastewater lead to an increased removal efficiency of diclofenac (83 compared to 21 percent), ketoprofen (85 compared to 51 percent), naproxen (92 compared to 65 percent), clofibric acid (63 compared to 43 percent), and ethinyl oestradiol (99 compared to 75 percent), whereas ibuprofen and oestradiol were completely removed in the ordinary biological treatment process. For the substances carbamazepine and oestrone no conclusion could be drawn due to that it was not possible to analyse carbamazepine with the method used and oestrone was only successfully analysed in one experiment.
A batch experiment lead to the conclusion that the reaction between PAC and dissolved APIs and oestrogens is rapid and already after five minutes 92 to 99 percent of the added amount APIs (100 μg per litre) and oestrogens (25 μg per litre) had been removed.
The addition of PAC to the biological treatment process has in the laboratory experiments proven to be a method that can be used in order to increase removal of APIs and oestrogens. To add 0.05 g PAC per litre artificial wastewater would lead to an increase in wastewater treatment costs of 1 SEK (0.11 EUR1) per m3 treated wastewater, which can be compared to the average cost to treat wastewater of 1.9 to 9.3 SEK (0.2 to 1 EUR) per m3 and also to the fee which households, connected to Källby wastewater treatment plant, pay today for wastewater treatment of 6.50 SEK (0.70 EUR).
Keywords: Pharmaceuticals; Oestrogens; Activated carbon; Ibuprofen; Diclofenac; Ketoprofen; Naproxen; Clofibric acid; Carbamazepine; Oestrone; Oestradiol; Ethinyl oestradiol; Wastewater treatment
1 1 EUR = 9.28 EUR (Finansportalen, 2008)

ii

iii
PREFACE This master thesis has been performed at Water and Environmental Engineering at the Department of Chemical Engineering, LTH, Lund University together with the Technical University of Denmark (DTU) and is the final part of my Master in Environmental Engineering at LTH, Lund University.
The project has been supervised by Jes la Cour Jansen and Ann‐Sofi Jönsson, both professors at the Department of Chemical Engineering. The thesis has been a part of the research programme MistraPharma and focused on the reduction of APIs and oestrogens using PAC. All of the laboratory parts have been planned and performed together with Theres Söderberg, also working on her master thesis.
Throughout the work the following persons have shown great interest as well as giving good advice and therefore merit a sincere thank you for their patience and willingness to share their knowledge.
First of all I would like to thank my supervisor Jes la Cour Jansen for good advice, feedback on the thesis as well as sharing his knowledge within water treatment. I would also like to thank Ann‐Sofi Jönsson for perspective and motivation as well as good feedback throughout the project. The laboratory parts would not have been possible without the great assistance from the laboratory personnel; Gertrud Persson and Ylva Persson – thank you. I would also like to thank Henrik Andersen and Kamilla Hansen at DTU, whom have shown great patience and knowledge in the analysis part of the project. All the personnel from Källby wastewater treatment plant have been very helpful, especially Michael Petersson – thank you. My gratitude also goes to Theres Söderberg for her patience and good companionship throughout the project.
Finally I would like to thank my family and friends for the support and interest they have shown throughout my studies.
Lund 20 May 2008 Caroline Säfström

iv
v
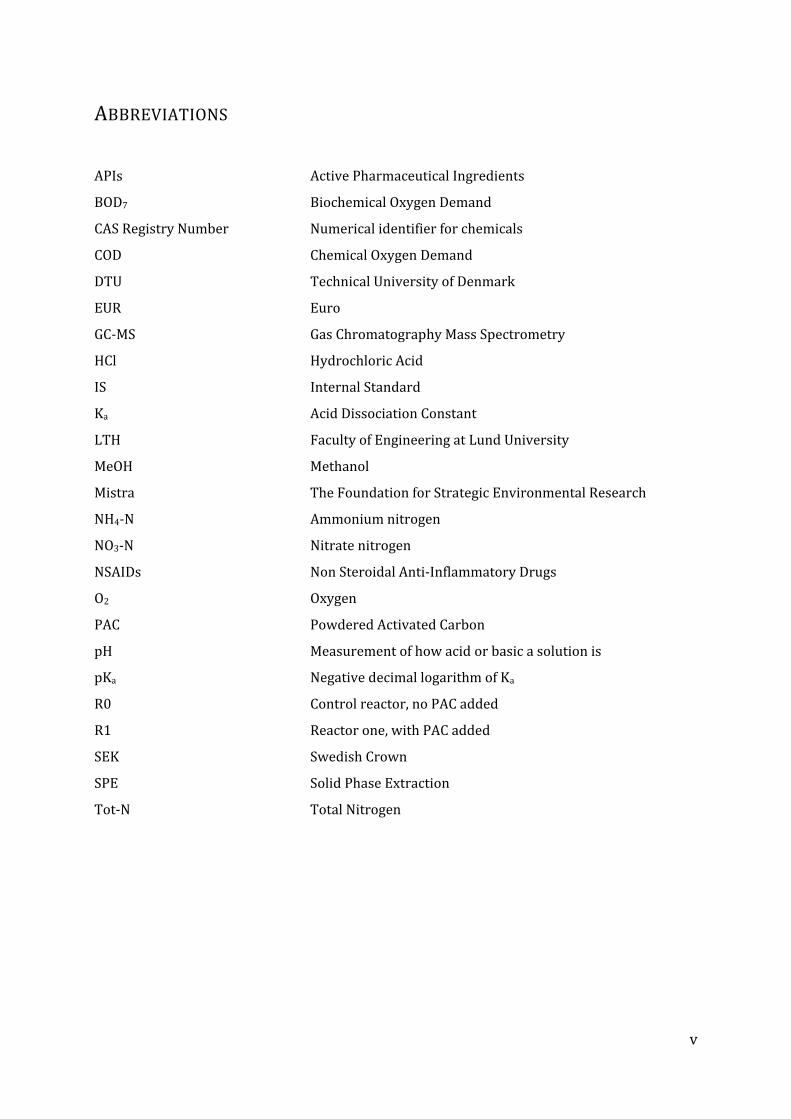
ABBREVIATIONS
APIs Active Pharmaceutical Ingredients
BOD7 Biochemical Oxygen Demand
CAS Registry Number Numerical identifier for chemicals
COD Chemical Oxygen Demand
DTU Technical University of Denmark
EUR Euro
GC‐MS Gas Chromatography Mass Spectrometry
HCl Hydrochloric Acid
IS Internal Standard
Ka Acid Dissociation Constant
LTH Faculty of Engineering at Lund University
MeOH Methanol
Mistra The Foundation for Strategic Environmental Research
NH4‐N Ammonium nitrogen
NO3‐N Nitrate nitrogen
NSAIDs Non Steroidal Anti‐Inflammatory Drugs
O2 Oxygen
PAC Powdered Activated Carbon
pH Measurement of how acid or basic a solution is
pKa Negative decimal logarithm of Ka
R0 Control reactor, no PAC added
R1 Reactor one, with PAC added
SEK Swedish Crown
SPE Solid Phase Extraction
Tot‐N Total Nitrogen

vi

CONTENTS 1 INTRODUCTION ...................................................................................................................................................... 1
1.1 AIM ................................................................................................................................................................................................ 1 1.2 PROBLEM FORMULATION .......................................................................................................................................................... 1 1.3 LIMITATIONS ............................................................................................................................................................................... 2
2 BACKGROUND WASTEWATER, PHARMACEUTICALS, OESTROGENS AND POWDERED ACTIVATED CARBON ..................................................................................................................................................... 3
2.1 WASTEWATER ............................................................................................................................................................................. 3 2.2 KÄLLBY WASTEWATER TREATMENT PLANT ........................................................................................................................... 3 2.2.1 Biological treatment ....................................................................................................................................................... 3
2.3 ACTIVE PHARMACEUTICAL INGREDIENTS (APIS) AND OESTROGENS ................................................................................ 4 2.3.1 APIs used in the experiment......................................................................................................................................... 4 2.3.2 Oestrogens used in the experiment........................................................................................................................... 5 2.3.3 Effects in the environment from the release of APIs and oestrogens ........................................................ 5 2.3.4 APIs and oestrogens in wastewater treatment plants today ....................................................................... 6
2.4 POWDERED ACTIVATED CARBON ............................................................................................................................................ 7 2.4.1 Property ................................................................................................................................................................................ 7 2.4.2 Production of PAC ............................................................................................................................................................ 8 2.4.3 Previous experiments with PAC ................................................................................................................................. 8
3 METHODOLOGY ................................................................................................................................................... 11
3.1 THEORY ..................................................................................................................................................................................... 11
4 LABORATORY EXPERIMENTS .......................................................................................................................... 13
4.1 PURPOSE OF THE EXPERIMENTS ............................................................................................................................................ 13 4.2 EXPERIMENTAL ........................................................................................................................................................................ 13 4.2.1 Chemicals ........................................................................................................................................................................... 13 4.2.2 Artificial wastewater .................................................................................................................................................... 14 4.2.3 Pharmaceutical and oestrogen solution .............................................................................................................. 14 4.2.4 Sludge .................................................................................................................................................................................. 15 4.2.5 Laboratory set up ........................................................................................................................................................... 16 4.2.6 Advice for future running the reactor experiments ........................................................................................ 20 4.2.7 Sampling ............................................................................................................................................................................. 21 4.2.8 Solid phase extraction .................................................................................................................................................. 23 4.2.9 Gas chromatographymass spectrometry ........................................................................................................... 24
5 RESULTS ................................................................................................................................................................. 25
5.1 BATCH 1 .................................................................................................................................................................................... 25 5.2 BATCH 2 .................................................................................................................................................................................... 25 5.2.1 PAC concentration ......................................................................................................................................................... 26 5.2.2 Reaction time ................................................................................................................................................................... 27 5.2.3 Oestrogens ......................................................................................................................................................................... 28 5.2.4 Batch 2 in total ................................................................................................................................................................ 29
5.3 EXPERIMENT 1 – 0.1 G PAC PER LITRE ARTIFICIAL WASTEWATER ............................................................................... 29 5.3.1 APIs – experiment 1 ....................................................................................................................................................... 30 5.3.2 Oestrogens – experiment 1 ......................................................................................................................................... 32 5.3.3 Experiment 1 in total .................................................................................................................................................... 33
5.4 EXPERIMENT 2 – 0.05 G PAC PER LITRE ARTIFICIAL WASTEWATER ............................................................................. 33 5.4.1 APIs – experiment 2 ....................................................................................................................................................... 33
Contents
5.4.2 Oestrogens – experiment 2 ......................................................................................................................................... 35 5.4.3 Experiment 2 in total .................................................................................................................................................... 36
5.5 EXPERIMENT 3 – 0.05 G PAC PER LITRE ARTIFICIAL WASTEWATER ............................................................................. 36 5.5.1 APIs – experiment 3 ....................................................................................................................................................... 37 5.5.2 Oestrogens – experiment 3 ......................................................................................................................................... 38 5.5.3 Experiment 3 in total .................................................................................................................................................... 39
5.6 REAL WASTEWATER EXPERIMENT – 0.05 G PAC PER LITRE WASTEWATER ................................................................ 39 5.6.1 APIs – real wastewater experiment ....................................................................................................................... 39 5.6.2 Oestrogens – real wastewater experiment ......................................................................................................... 40 5.6.3 Real wastewater experiment in total .................................................................................................................... 41
5.7 APIS AND OESTROGENS IN THE INFLUENT AND EFFLUENT TO KÄLLBY BIOLOGICAL TREATMENT PART .................. 41 5.8 IN TOTAL ................................................................................................................................................................................... 41
6 DISCUSSION ........................................................................................................................................................... 43
6.1 FUTURE APPLICATIONS ........................................................................................................................................................... 43 6.1.1 Cost of PAC ......................................................................................................................................................................... 44 6.1.2 The time aspect ............................................................................................................................................................... 45
6.2 SOURCE OF ERRORS ................................................................................................................................................................. 45 6.3 APIS AND OESTROGENS IN SLUDGE INSTEAD ...................................................................................................................... 45 6.4 OTHER METHODS ..................................................................................................................................................................... 46
7 CONCLUSIONS ....................................................................................................................................................... 47
8 REFERENCES ......................................................................................................................................................... 49
9 APPENDICES .......................................................................................................................................................... 52
A. PARAMETERS FOR THE EXPERIMENTS....................................................................................................................................... 52 B. BUFFERS USED IN THE EXPERIMENTS ........................................................................................................................................ 54 C. INCREASE IN COD FROM PAC AND METHANOL ...................................................................................................................... 55 D. SCIENTIFIC PAPER ......................................................................................................................................................................... 56

1 Introduction
1
1 INTRODUCTION In 2007 over 32 800 million SEK (3 508 million EUR2) were spent on pharmaceuticals for human use in Sweden (Apoteket, 2008). These pharmaceuticals help maintain human health but also constitute a possible environmental threat when spread in, for example, the aquatic environment. A recognized example of this is that male fish have become feminized when exposed to oestrogens distributed in domestic wastewater (Larsson, et al., 1999).
To identify and reduce the spread of pharmaceuticals, Mistra (The Foundation for Strategic Environmental Research) in Sweden started the research programme MistraPharma with the purpose of “identification and reduction of environmental risks caused by the use of human pharmaceuticals”. The aim of the programme is to evaluate the risks that APIs pose to the aquatic environment and, from this analysis, make recommendations regarding “pre‐marketing identification of future APIs of environmental concern, environmentally cautious prescription and use of pharmaceuticals, and improved wastewater treatment technologies” (Mistra, 2007).
The MistraPharma programme is a cooperation between seven partners of which Lund University and the DTU represent one. Furthermore the work is organized in five different work‐packages and this master thesis is a part of the package “Evaluate wastewater treatment technologies”. This package will investigate different physical, chemical and biological methods to reduce APIs.
This master thesis has focused on the potential of reducing APIs and oestrogens by the use of PAC. PAC is a sorbent to which substances, like APIs and oestrogens, can adsorb and as a result the concentrations of the substances in the water solution are reduced.
1.1 AIM This master thesis is aimed to investigate the possibility to remove APIs and oestrogens from wastewater, through a method that could be used in Swedish wastewater treatment plants with similar conditions as the treatment plant, for which the experiments have been scaled.
The main purpose is to present the findings and evaluations of how effective the method of using PAC is at removing the selected APIs and oestrogens in wastewater. The method is based on a laboratory set up resembling the biological part of a wastewater treatment plant process. APIs and oestrogens have been added to the standard wastewater treatment process as well as dosage of PAC before the sedimentation part. A post treatment to remove residues of PAC from the effluent through filtration was also included.
1.2 PROBLEM FORMULATION The set out has been to be able to answer the following questions;
• Does addition of PAC to the biological wastewater treatment process, at a laboratory scale, increase the removal of APIs and oestrogens compared to ordinary biological treatment with activated sludge?
• Which dosage of PAC, based on effectiveness and cost, should be used?
2 1 EUR = 9.28 SEK (Finansportalen, 2008)

Reduction of Active Pharmaceutical Ingredients in Wastewater
2
• At what time in the treatment cycle should PAC be added in order to have enough time to react with the substances present?
1.3 LIMITATIONS Concentrations and substances used in the experiments were chosen due to the ability to analyse them at DTU. The concentration of APIs (100 μg per litre) used in the experiments is 14 to 630 times higher than concentrations that were found in a study of the influent to wastewater treatment plants (Westerlund, 2007). Since a high concentration of pharmaceuticals has been used, due to the detection limit in the analysis, a larger amount of PAC has been needed in the laboratory experiments compared to real wastewater concentrations.
Continuous experiments with the addition of PAC were conducted at the longest for one week at a time and therefore no knowledge has been gained of how the PAC behaves, e.g. if there is a risk of leakage of APIs and oestrogens from the PAC, in the sludge over a longer time period.
2 Background
3
2 BACKGROUND ‐ WASTEWATER, PHARMACEUTICALS, OESTROGENS AND POWDERED ACTIVATED CARBON
This chapter will briefly describe today’s wastewater treatment, with focus on the biological treatment and the pharmaceutical and oestrogen reduction that take place in this biological part. Källby wastewater treatment plant, to which the experiments have been scaled to, is also further described. The APIs and oestrogens used in this master thesis are presented further as well as their potential threat to the environment. The section about PAC describes the production of PAC, its property used in the experiment and some previous results gained by the use of PAC in connection with wastewater treatment.
2.1 WASTEWATER In Sweden 7.7 million people are connected to the wastewater disposal system and 1.5 km3 wastewater is processed each year. The 2 000 wastewater treatment plants together produce 240 000 tons sludge (dry substance) annually. Altogether in Sweden 2003 the cost for producing drinking water and processing wastewater was 14.3 billion SEK (1.52 billion EUR3), of which the part for processing wastewater is somewhat larger than for that for drinking water (Svenskt Vatten, 2005).
2.2 KÄLLBY WASTEWATER TREATMENT PLANT Källby wastewater treatment plant situated southwest of Lund, county Skåne in the south of Sweden, has 79 000 people connected and every twenty‐four hours 30 000 m3 of wastewater is processed. The incoming water contains approximately 4 900 kg organic material (BOD7), 200 kg phosphorus and 1 000 kg nitrogen per day (Tekniska Förvaltningen, VA‐verket, 2004).
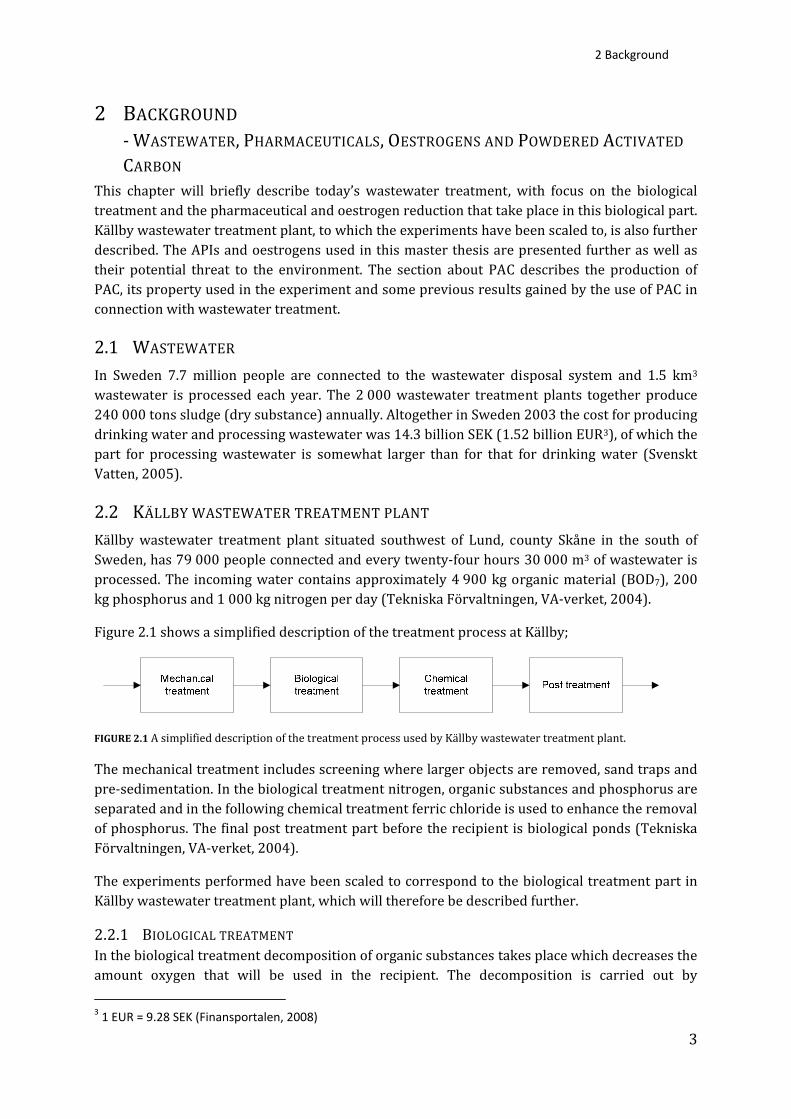
Figure 2.1 shows a simplified description of the treatment process at Källby;
FIGURE 2.1 A simplified description of the treatment process used by Källby wastewater treatment plant.
The mechanical treatment includes screening where larger objects are removed, sand traps and pre‐sedimentation. In the biological treatment nitrogen, organic substances and phosphorus are separated and in the following chemical treatment ferric chloride is used to enhance the removal of phosphorus. The final post treatment part before the recipient is biological ponds (Tekniska Förvaltningen, VA‐verket, 2004).
The experiments performed have been scaled to correspond to the biological treatment part in Källby wastewater treatment plant, which will therefore be described further.
2.2.1 BIOLOGICAL TREATMENT In the biological treatment decomposition of organic substances takes place which decreases the amount oxygen that will be used in the recipient. The decomposition is carried out by 3 1 EUR = 9.28 SEK (Finansportalen, 2008)
Reduction of Active Pharmaceutical Ingredients in Wastewater
4
microorganisms which uses the organic material to grow. Nitrification (oxidation of ammonium to nitrate) and denitrification (reduction of nitrate to nitrogen gas), see below, also take place in the biological treatment part (Tekniska Förvaltningen, VA‐verket, 2004).
Nitrification: NH O2 NO 2H H O
NO O2 NO
NH 2O2 NO 2H H O
Denitrification: 2NO H organic matter N HCO
Oxygen is added to the process of decomposing the organic substances and also to the nitrification, which both takes place in the aerobic tank, whereas denitrification takes place in an anoxic zone. In the anoxic zone bacteria uses oxygen from nitrate compared to from oxygen in the aerobic zone (Kemira Kemwater, 2003).
In Källby wastewater treatment plant one anaerobic zone is followed by four anoxic zones and three aerobic zones in that order. The average COD concentration in the influent to the biological part varies between 380 to 480 mg per litre (average 430 mg per litre) and the inflow to the biological part varies between 230 and 340 L/s (year average 310 L/s) (M. Petersson, Källby wastewater treatment plant, personal communication, February 18, 2008).
The charge per m3 treated wastewater is approximately 6.50 SEK (0.7 EUR4), including wastewater network and pump fee. The process cost per m3 was estimated to 2 SEK (0.2 EUR) according to M. Petersson at Källby wastewater treatment plant (personal communication, May 7, 2008).
2.3 ACTIVE PHARMACEUTICAL INGREDIENTS (APIS) AND OESTROGENS A number of APIs and oestrogens considered of special interest were selected for the first part of the MistraPharma programme. Six pharmaceuticals and three oestrogens, some that had been focused on in the first part of the MistraPharma programme but also others, were selected to be used in the laboratory experiments based on that they behave in the same way as the internal standard (IS) used. The substance mecoprop, a weak acid (pKa=3.11 at 25°C) (University of Hertfordshire & FOOTPRINT, 2008), was used as IS in the analysis and APIs and oestrogens were thus chosen based on their alikeness in pKa value to mecoprop. Concentrations were also chosen due to the ability to analyse them (K. Hansen, DTU, personal communication, March 14, 2008).
2.3.1 APIS USED IN THE EXPERIMENT The APIs found in Figure 2.2 were selected to be used in the laboratory experiments.
4 1 EUR = 9.28 SEK (Finansportalen, 2008)

FIGURE 2.2
Ibuprofegroup osubstanto a diLäkemeto patieregulatoacid is tKarolins
2.3.2 The follo
O
FIGURE 2.3
Oestronassist inmembradevelopoestroge(FASS, 2
2.3.3 Medicalthreat tospread Paxéus,
Ibuprofen
Naproxen
2 APIs used in
en, diclofenaof pharmacces reducesiminished pdelsverket, ents sufferinors, is used the metaboliska Institute
OESTROGENowing three
Oestrone1
3 Oestrogens u
ne and oestrn controllinanes. Due tped syntheticens is ethin2008; Nation
EFFECTS IN substanceso the enviroin the enviGinn, & Log
n
n
the experimen
ac, ketoprofceuticals cas pain and inproduction 2008). Carbng from epias an antiliite that is uset, 2008; Ald
NS USED IN THe oestrogens
used in the exp
adiol are nang the mento their effecally and usnyl oestradinalencyklop
THE ENVIROs are designonment and ronment thge, 2005; Bes
D
Clo
nts (FASS, 200
fen and napralled Non Snflammationof pain elbamazepineilepsies, whipemic, meased in lipid der, et al., 20
HE EXPERIMs were selec
Oestr
periments (FAS
atural oestrostruation cyect on reprsed in contraiol, used inpedin, 2008)
ONMENT FROned to have it has been hey act as csse & Garric
Diclofenac
ofibric acid1
8; 1Wikipedia,
roxen are thSteroidal Ann by inhibitilicitation sue is used as hereas clofibaning it helpregulators (006).
ENT ted for the l
adiol
SS, 2008; 1Wik
ogens produycle in womoduction inaceptive pilln several co.
OM THE RELEa biologicalrecognisedcontaminantc, 2008).
2008).
he active subnti‐Inflammng the enzyubstances (active subsbric acid, thps reducing(Sjukvårdsrå
laboratory e
kipedia, 2008).
uced by the men througn the humanls. One of thontraceptive
EASE OF APIl effect whic that when pts (Halling‐
Ketop
Carbama
bstances in dmatory Drugme cyclooxy(Sjukvårdsrtance in phhe active mg lipid levelådgivningen
experiments
Ethiny
human bodgh their effn body, oeshese synthete pills on th
S AND OESTRch also makpharmaceutSørensen, e
2 Backgro
profen
azepine
drugs belongs (NSAIDs)ygenase whrådgivningenarmaceuticaetabolite frs in blood. n, 2008; FAS
s, Figure 2.3;
yl oestradiol
dy. These oefect on the strogens hatically manuhe Swedish
ROGENS kes them a ptical compoet. al., 1998
ound
5
nging to a ). These ich leads n, 2008; als given om lipid Clofibric SS, 2008;
;
strogens mucous
ave been ufactured h market
potential unds are 8; Bendz,

Reduction of Active Pharmaceutical Ingredients in Wastewater
6
It has been indicated that ibuprofen has an antimicrobial effect and also inhibits growth of gram‐positive bacteria (Sanyal, et. al., 1993; Elvers & Wright, 1995). The marine amphipod Amphitoe valida has been shown to have a lower survival rate and reduced fertility when exposed to dumped pharmaceutical waste (Lee & Arnold, 1983). Also synthetic hormones have been found to effect the endocrine systems of fish exposed to hormones from effluent wastewater (Larsson, et al., 1999). Some endocrine disrupting pharmaceuticals, e.g. oestrogens, impact aquatic organisms at trace concentrations, i.e. ng per litre (Snyder, et al., 2007).
The different substances’ environmental effects, as known today, are found in Table 2.1 (FASS, 2008).
TABLE 2.1 The environmental risks for five of the nine substances used in the experiments can be found below.
Substance Environmental risk Decomposition Bioaccumulation
Ibuprofen Low risk Is decomposed No potential to be stored in waterliving organisms
Diclofenac Negligible risk Slow decomposition No potential to be stored in waterliving organisms
Ketoprofen Risk can not be excluded
It can not be excluded that the substance is persistent since no data exists
It can not be excluded that the substance is stored since no data exists
Naproxen Low risk Slow decomposition No potential to be stored in waterliving organisms
Ethinyl oestradiol High risk Slow decomposition Potential to be stored in waterliving organisms
For the substances ketoprofen, clofibric acid, carbamazepin, oestrone and oestradiol no data was available and it can therefore not be excluded that these substances may pose a possible environmental threat, have a slow decomposition or may bioaccumulate.
2.3.4 APIS AND OESTROGENS IN WASTEWATER TREATMENT PLANTS TODAY In the experiments performed, a high concentration of APIs and oestrogens were used. However concentrations found in the influent are much lower. The concentrations in the influent to Swedish wastewater treatment plants for four of the APIs in this master thesis have been measured by Länsstyrelsen, county Skåne,Table 2.2A (Westerlund, 2007). Another study has measured concentrations in the influent and removal efficiency for the six APIs for Källby wastewater treatment plant. The results from that study are found in Table 2.2B (Bendz, Paxéus, Ginn, & Loge, 2005). A third study has investigated the reduction in percent for four of the APIs and two of the oestrogens included in this master thesis, in 13 municipal wastewater treatment plants in Canada. These results can be found in Table 2.2C (Lishman, et al., 2006).

2 Background
7
TABLE 2.2 Concentrations in the influent to wastewater treatment plants and removal efficiencies of APIs in Sweden (A and B) and Canada (C) (A. Westerlund, 2007; B. Bendz, Paxéus, Ginn, & Loge, 2005; C. Lishman, et al., 2006). (n.f.) – not found (#) – measurable in the influent and non‐quantifiable in the effluent
A. Substance
Conc. (μg/L)
B. Substance
Conc. (μg/L)
Removal efficiency (%)
C. Substance
Removal efficiency (%)
Ibuprofen 7.4 Ibuprofen 3.6 90 Ibuprofen 95 Naproxen 4.8 Naproxen 3.7 66 Naproxen 93
Ketoprofen 2.7 Ketoprofen 0.94 69 Ketoprofen 44
Diclofenac 0.3 Diclofenac 0.16 17‐69 Diclofenac ‐34
Clofibric acid n.f. Oestrone 80
Carbamazepine 1.7 7 Oestradiol # A high reduction of ibuprofen (Canada and Sweden), naproxen (in Canada) as well as oestrone (Canada) was observed in the wastewater treatment plants. Ketoprofen and diclofenac however was not reduced to the same extent in the treatment process in neither country. The negative value of diclofenac, thus indicating production of diclofenac, could in the Canadian study not be regarded as an extraneous event since several negative values were suggesting a trend (Lishman, et al., 2006).
The high removal of ibuprofen (> 90 percent) has also been observed at wastewater treatment plants in Tokyo. Compared to the Canadian and Swedish studies however the reduction of naproxen in wastewater treatment plants in Tokyo was lower (< 50 percent) (Nakada, Tanishima, Shinohara, Kiri, & Takada, 2006).
2.4 POWDERED ACTIVATED CARBON 2.4.1 PROPERTY The property used in water treatment from activated carbon is its adsorption capacity, which is a result of a large surface area made up by different sized pores; macro‐ (diameter: > 25 nm), meso‐ (diameter: 2‐25 nm) and micro‐pores (diameter: < 2 nm). The internal surface is large for activated carbon, normally between 400 to 1 600 m2 per g, as is the pore volume, 30 cm3 per 100 g. (Kemira Kemwater, 2003; Henning & Degel, n.d.).
The adsorption capacity diminishes when a lower concentration of adsorbent is used as well as when temperature increases (Henning & Degel, n.d.). This can be described for activated carbon by the Freundlich isotherm equation below (Nowotny, Epp, Sonntag, & Fahlenkamp, 2007).
q = equilibrium loading c = concentration in the liquid phase K and n = Freundlich constants describing adsorption characteristics
The hydrophobic surface property of activated carbon has been taken advantage of in the experiments in order to gain a reduction the pharmaceutical substances (Henning & Degel, n.d.).
Powder and granules are the most commonly occurring types of active carbon, used in connection to water treatment. Granules are used in filters whereas powdered activated carbon is added directly into the water (Kemira Kemwater, 2003; Snyder, et al., 2007). Since an addition

Reduction of Active Pharmaceutical Ingredients in Wastewater
8
of activated carbon was wanted directly to the reactor volume in order to minimise reconstructions needed in wastewater treatment plants, PAC was used throughout all of the experiments. Figure 2.4 and Figure 2.5 show photos of the PAC that has been used in the experiments.
FIGURE 2.4 Picture of the PAC used in the experiments. (Photo: Caroline Säfström)
FIGURE 2.5 Photo of PAC when diluted in distilled water in e‐flask. (Photo: Caroline Säfström)
2.4.2 PRODUCTION OF PAC Activated carbon is produced by different materials, such as wood, peat, lignite, hardcoal, charcoal and coconut shells. A simplified production flow chart of the production of activated carbon can be seen in Figure 2.6.
FIGURE 2.6 Flow chart for the production of activated carbon. (Henning & Degel, n.d.)
The first part is grinding of the hardcoal feed followed by oxidation and mixing of the coal dust with a binder which enables extrusion to the diameter desired. In the carbonisation part, the extrudates are heated to 900°C where they transform to activated coke to finally be activated by steam activation. Each year approximately 350 000 ton activated carbon is produced worldwide, of which 150 000 ton is powdered activated carbon (Henning & Degel, n.d.).
2.4.3 PREVIOUS EXPERIMENTS WITH PAC Previously it has been shown that PAC can be used to remove oestrone from an aqueous phase. The reduction of oestrone is dependent on PAC dosage and retention time in the system as shown by Snyder et. al. (2007) and Chang et. al. (2004). The factors limiting the adsorption of oestrone on PAC are film diffusion and internal surface diffusion. A maximum removal of 95‐96 percent oestrone has been achieved, whereas the last three percent are residuals that PAC is not capable to remove (Chang, Waite, Ong, Schäfer, & Fane, 2004).
Since PAC provides a limited number of surface sites there is a competitive adsorption between the oestrone and other dissolved constituents, where a lower PAC dosage means increased competitive adsorption (Chang, Waite, Ong, Schäfer, & Fane, 2004; Nowotny, Epp, Sonntag, & Fahlenkamp, 2007).

2 Background
9
The following mass transfer processes are included when PAC is used to remove oestrone; bulk solution transport, external (film) transport, internal (pore) transport and adsorption (Chang, Waite, Ong, Schäfer, & Fane, 2004).
It has also been shown that the percentage removal of endocrine‐disrupting compounds, such as oestrogens, and pharmaceuticals is independent of the initial compound concentration and that high PAC dosage increase the removal (Westerhoff, Yoon, Snyder, & Wert, 2005).
The following removal percentage, Table 2.3, can be expected when using a PAC concentration of 5 mg per litre wastewater according to Snyder et. al. (2007).
TABLE 2.3 Removal, in percentage, when using 5 mg PAC/L according to Snyder et. al. (2007).
API Removal (%) Oestrogen Removal (%)
Ibuprofen 17 Oestrone 69 Diclofenac 39 Ethinyl oestradiol 79
Naproxen 52 Oestradiol 84
Carbamazepine 74 In another study a concentration of 10 mg PAC per litre wastewater was used, which resulted in that pharmaceuticals were reduced to a concentration lower than 0.1 μg per litre (Nowotny, Epp, Sonntag, & Fahlenkamp, 2007). Natural organic matter can however to a great extent reduce the efficiency of PAC, since it competes with the pharmaceuticals for the binding sites and might also block the pores (Snyder, et al., 2007; Nowotny, Epp, Sonntag, & Fahlenkamp, 2007).

Reduction of Active Pharmaceutical Ingredients in Wastewater
10
3 Methodology
11
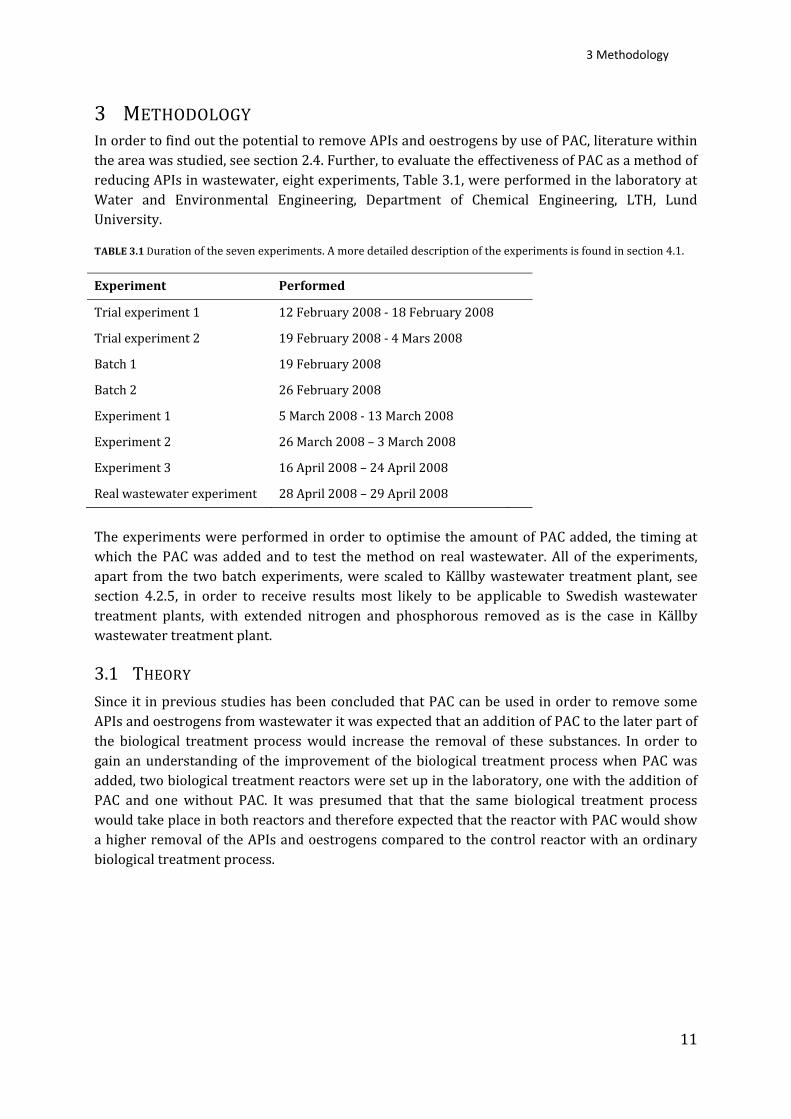
3 METHODOLOGY In order to find out the potential to remove APIs and oestrogens by use of PAC, literature within the area was studied, see section 2.4. Further, to evaluate the effectiveness of PAC as a method of reducing APIs in wastewater, eight experiments, Table 3.1, were performed in the laboratory at Water and Environmental Engineering, Department of Chemical Engineering, LTH, Lund University.
TABLE 3.1 Duration of the seven experiments. A more detailed description of the experiments is found in section 4.1.
Experiment Performed
Trial experiment 1 12 February 2008 ‐ 18 February 2008
Trial experiment 2 19 February 2008 ‐ 4 Mars 2008
Batch 1 19 February 2008
Batch 2 26 February 2008
Experiment 1 5 March 2008 ‐ 13 March 2008
Experiment 2 26 March 2008 – 3 March 2008
Experiment 3 16 April 2008 – 24 April 2008
Real wastewater experiment 28 April 2008 – 29 April 2008
The experiments were performed in order to optimise the amount of PAC added, the timing at which the PAC was added and to test the method on real wastewater. All of the experiments, apart from the two batch experiments, were scaled to Källby wastewater treatment plant, see section 4.2.5, in order to receive results most likely to be applicable to Swedish wastewater treatment plants, with extended nitrogen and phosphorous removed as is the case in Källby wastewater treatment plant.
3.1 THEORY Since it in previous studies has been concluded that PAC can be used in order to remove some APIs and oestrogens from wastewater it was expected that an addition of PAC to the later part of the biological treatment process would increase the removal of these substances. In order to gain an understanding of the improvement of the biological treatment process when PAC was added, two biological treatment reactors were set up in the laboratory, one with the addition of PAC and one without PAC. It was presumed that that the same biological treatment process would take place in both reactors and therefore expected that the reactor with PAC would show a higher removal of the APIs and oestrogens compared to the control reactor with an ordinary biological treatment process.

Reduction of Active Pharmaceutical Ingredients in Wastewater
12
4 Laboratory experiments
13
4 LABORATORY EXPERIMENTS All of the laboratory experiments have taken place in laboratories at Water and Environmental Engineering, Department of Chemical Engineering, LTH, Lund University whereas the GC‐MS analysis have been performed by DTU in Denmark.
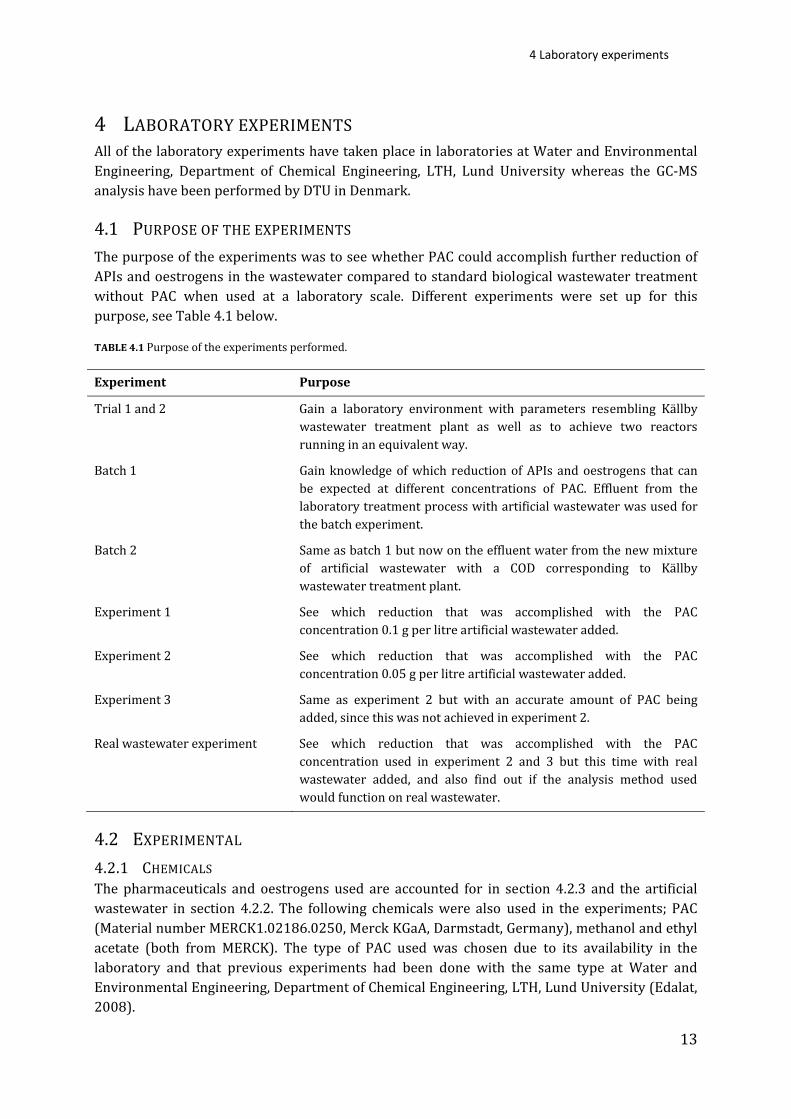
4.1 PURPOSE OF THE EXPERIMENTS The purpose of the experiments was to see whether PAC could accomplish further reduction of APIs and oestrogens in the wastewater compared to standard biological wastewater treatment without PAC when used at a laboratory scale. Different experiments were set up for this purpose, see Table 4.1 below.
TABLE 4.1 Purpose of the experiments performed.
Experiment Purpose
Trial 1 and 2 Gain a laboratory environment with parameters resembling Källby wastewater treatment plant as well as to achieve two reactors running in an equivalent way.
Batch 1 Gain knowledge of which reduction of APIs and oestrogens that can be expected at different concentrations of PAC. Effluent from the laboratory treatment process with artificial wastewater was used for the batch experiment.
Batch 2 Same as batch 1 but now on the effluent water from the new mixture of artificial wastewater with a COD corresponding to Källby wastewater treatment plant.
Experiment 1 See which reduction that was accomplished with the PAC concentration 0.1 g per litre artificial wastewater added.
Experiment 2 See which reduction that was accomplished with the PAC concentration 0.05 g per litre artificial wastewater added.
Experiment 3 Same as experiment 2 but with an accurate amount of PAC being added, since this was not achieved in experiment 2.
Real wastewater experiment See which reduction that was accomplished with the PAC concentration used in experiment 2 and 3 but this time with real wastewater added, and also find out if the analysis method used would function on real wastewater.
4.2 EXPERIMENTAL 4.2.1 CHEMICALS The pharmaceuticals and oestrogens used are accounted for in section 4.2.3 and the artificial wastewater in section 4.2.2. The following chemicals were also used in the experiments; PAC (Material number MERCK1.02186.0250, Merck KGaA, Darmstadt, Germany), methanol and ethyl acetate (both from MERCK). The type of PAC used was chosen due to its availability in the laboratory and that previous experiments had been done with the same type at Water and Environmental Engineering, Department of Chemical Engineering, LTH, Lund University (Edalat, 2008).

Reduction of Active Pharmaceutical Ingredients in Wastewater
14
4.2.2 ARTIFICIAL WASTEWATER In order to resemble the wastewater treatment plant, artificial wastewater with the same COD concentration as Källby wastewater treatment plant, was used in the experiments. A stock solution was prepared according to the formula in Table 4.2 and then corrected to a pH in the interval 7.0 to 7.2 by the addition of the buffer solution in Table 4.3 (Nyholm, Berg, & Ingerslev, 1996). In order to prevent growth in the artificial wastewater, peptone and meat extract was not added until the stock solution was to be used. The stock solution has a COD of 1 088 mg per litre and it was therefore diluted to a concentration of COD at 430 mg per litre since this was the average concentration of COD in the influent to the biological part at Källby wastewater treatment plant (M. Petersson, Källby wastewater treatment plant, personal communication, February 18, 2008). Both stock solution and diluted artificial wastewater, apart from the amount being used, were stored in a fridge (6°C) until used, however no longer than four days, in order to avoid growth in the wastewater. Peptone (order number 22089) was supplied by Fluka Sigma‐Aldrich, as was the meat extract (order number 70164). All other chemicals in Table 4.2 to Table 4.4 were supplied by MERCK.
TABLE 4.2 Chemicals used for the artificial wastewater (Nyholm, Berg, & Ingerslev, 1996).
Chemical Amount (g/L)
Peptone 8
Meat extract 5.5
Urea 1.5
NaCl 0.35
CaCl2 ∙ 2 H2O 0.2
MgSO4 ∙ 7 H2O 0.1
TABLE 4.3 Formula for the buffer solution used to lower pH in the artificial wastewater. 1NaH2PO4 ∙ H2O was used in the article but due to availability in the laboratory NaH2PO4 ∙ 2 H2O was used instead, after the amount had been adjusted (Nyholm, Berg, & Ingerslev, 1996).
Chemical Amount (g/L)
NaH2PO4 ∙ 2 H2O1 84.21
KH2PO4 27.2
K2HPO4 80.1
An additional buffer solution was added to the artificial wastewater in order to gain an alkalinity corresponding to the nitrogen added from the artificial wastewater. The two chemicals in Table 4.4 were dissolved in distilled water in order to prepare the buffer. 2.5 mL of this buffer solution was added per litre artificial wastewater.
TABLE 4.4 Chemicals dissolved in distilled water for buffer solution to increase alkalinity.
Chemical Amount (g/L)
NaHCO3 67.2
KH2PO4 4.4
4.2.3 PHARMACEUTICAL AND OESTROGEN SOLUTION The pharmaceutical oestrogen solution used in the experiments was mixed at DTU which in their turn ordered the substances from Sigma‐Aldrich. The following substances were mixed into the pharmaceutical and oestrogen solution, see Table 4.5.

4 Laboratory experiments
15
TABLE 4.5 Pharmaceuticals and oestrogens used in the experiments. CAS, obtained from Ternes & Joss (2006), is a registry number used to identify individual chemicals and pKa is the logarithmic measurement of the acid dissociation constant. All of the substances used were obtained by DTU from Sigma‐Aldrich.
Pharmaceuticals CAS pKa Oestrogens CAS pKa
Ibuprofen 15687‐27‐1 4.5‐5.2 Oestrone 53‐16‐7 10.71
Diclofenac 15307‐86‐5 4.15 Oestradiol 50‐28‐2 10.71
Ketoprofen 22071‐15‐4 4.5 Ethinyl oestradiol 57‐63‐6 10.4‐10.5
Naproxen 22204‐53‐1 4.2
Clofibric acid 882‐09‐7 3.0
Carbamazepine 298‐46‐4 13.9
As previously mentioned, section 1.3, the IS functions best for substances that are alike in pKa. Since carbamazepine has pKa much higher than mecoprop, 13.9 compared to 3.11, the analysis for carbamazepine will not be as accurate for this API (K. Hansen, DTU, personal communication, March 14, 2008). This can also be seen further on in the results, found in chapter 5.
The pharmaceuticals and oestrogens were diluted by DTU in methanol. 0.1 mL of the solution added to one litre of artificial wastewater resulted in a concentration of 100 μg of the individual pharmaceuticals per litre artificial wastewater. For the oestrogens 0.1 mL added solution per litre artificial wastewater resulted in a concentration of 25 μg of the individual oestrogens per litre artificial wastewater.
Concentrations of APIs and oestrogens were chosen, as mentioned earlier in section 1.3, with regard to the analysis method. That a lower concentration can be used for the oestrogens is explained by that the analysis for the oestrogens is more sensitive compared to the analysis method used for the APIs. Due to the methanol, used to dilute the substrates in, an increase in COD concentration in the artificial wastewater occurs when the API oestrogen solution is added. To counteract this, the dilution of the stock solution was altered in order to maintain approximately the same COD concentration in the influent water as before the addition of API oestrogen solution. The API and oestrogen solution was stored in a freezer (‐19°C) throughout all of the experiments.
4.2.4 SLUDGE Sludge from Källby wastewater treatment plant was used in all of the experiments to gain a biological wastewater treatment process. This particular wastewater treatment plant represents a typical wastewater treatment plant in the south of Sweden with a high nitrogen and phosphorus reduction, with reservation for that their anoxic part is slightly bigger than standard (J. la Cour Jansen, LTH, personal communication, February 18, 2008).
The sludge was collected in the mornings the 12, 19 February, 5, 26 March, 16 and 28 April, from basin B9:3, which is included in the aerobic part of the biological part at Källby wastewater treatment plant, see Figure 4.1.

Reduction of Active Pharmaceutical Ingredients in Wastewater
16
FIGURE 4.1 Flow chart for Källby wastewater treatment, based on figure in Källby environmental report 2004 (Tekniska förvaltningen, 2005).
Two litres of sludge were used in each reactor and, to illustrate the composition of the sludge used, the properties of the sludge gathered on the 19 February can be found in Table 4.6.
TABLE 4.6 Properties of the sludge used in trial experiment 2. (NF) – non‐filtered, (F) ‐ filtered
NH4N
mg/L NO3N mg/L
CODNF mg/L
CODF mg/L
O2
mg/L pH Conductivity
μS/cm Alkalinity mmolHCO3/L
23 2.7 340 38 0.56 7.0 700 2.8
In order to gain a sludge age of 30 days, which is most common in Sweden (J. la Cour Jansen, LTH, personal communication, February 18, 2008); 150 mL of the reactor volume was removed daily Monday to Thursday and 100 mL was removed on Fridays. The removal was performed during aeration and stirring in order to get a mixed sample. This removal does not mean that the reactor volume is continuously diminishing since there is an inflow of artificial wastewater and a volume of two litres always is maintained after the decantation phase.
4.2.5 LABORATORY SET UP This section will present how the experiments were scaled to correspond to the biological treatment process at Källby wastewater treatment plant and also the set up of the different experiments.
Scale related to Källby The experiments were all scaled to correspond to Källby wastewater treatment plant, from which the sludge and wastewater was collected. All information used in the scaling has been obtained from M. Petersson at Källby wastewater treatment plant (personal communication, February 18, 2008).
The biological part in Källby contains one anaerobic, four anoxic and three aerobic parts in that order. Due to that it is problematic to get nitrate away in the anaerobic part; only the anoxic and aerobics parts were included in the laboratory experiments. The eight hours cycle time (minus
4 Laboratory experiments
17
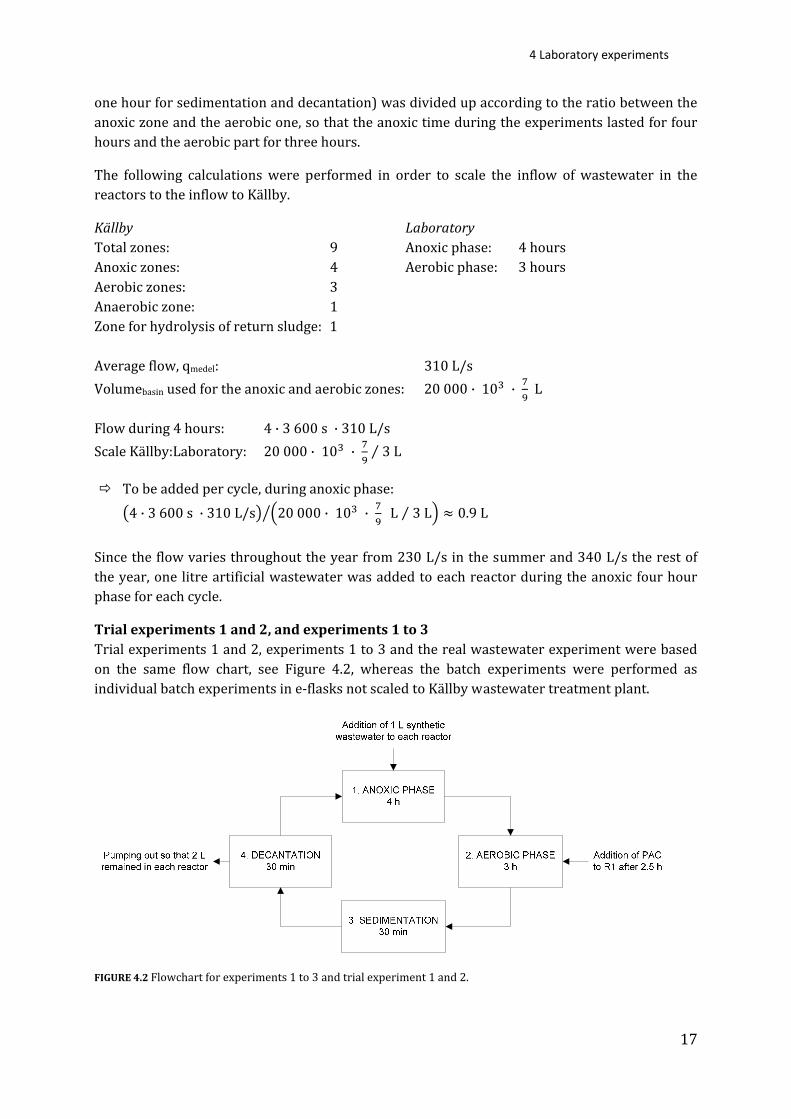
one hour for sedimentation and decantation) was divided up according to the ratio between the anoxic zone and the aerobic one, so that the anoxic time during the experiments lasted for four hours and the aerobic part for three hours.
The following calculations were performed in order to scale the inflow of wastewater in the reactors to the inflow to Källby.
Källby Total zones: 9 Anoxic zones: 4 Aerobic zones: 3 Anaerobic zone: 1 Zone for hydrolysis of return sludge: 1
Laboratory Anoxic phase: 4 hours Aerobic phase: 3 hours
Average flow, qmedel: 310 L/s Volumebasin used for the anoxic and aerobic zones: 20 000 · 10 · L
Flow during 4 hours: 4 · 3 600 s · 310 L/s Scale Källby:Laboratory: 20 000 · 10 · 3 L⁄
To be added per cycle, during anoxic phase: 4 · 3 600 s · 310 L/s 20 000 · 10 · L 3 L⁄ 0.9 L
Since the flow varies throughout the year from 230 L/s in the summer and 340 L/s the rest of the year, one litre artificial wastewater was added to each reactor during the anoxic four hour phase for each cycle.
Trial experiments 1 and 2, and experiments 1 to 3 Trial experiments 1 and 2, experiments 1 to 3 and the real wastewater experiment were based on the same flow chart, see Figure 4.2, whereas the batch experiments were performed as individual batch experiments in e‐flasks not scaled to Källby wastewater treatment plant.
FIGURE 4.2 Flowchart for experiments 1 to 3 and trial experiment 1 and 2.

Reduction of Active Pharmaceutical Ingredients in Wastewater
18
In the experiments two reactors, R1 and R0, were used. The total volume of each reactor was three litres when two litres of activated sludge and one litre of artificial wastewater had been added. Both reactors cycles were set up in the same way according to the flow chart and the starting and stopping of the different parts were controlled by timers.
To reactor R1 PAC was added, whereas R0 had no addition of PAC and served as a control reactor to provide information of how much reduction of the APIs and oestrogens could be expected through the normal biological wastewater treatment process.
Start The experiments were started by adding two litres of activated sludge, secondary sludge collected from the biological treatment at Källby wastewater treatment plant, to each reactor. A three day initial running without dosage of PAC was performed in order to let the activated sludge adjust to the artificial wastewater added. 1. Anoxic phase The anoxic phase was set to four hours based on Källby wastewater treatment plant. Stirring (with IKA Labortechnik speed 1 agitators) was continuous throughout this part.
Addition of wastewater Wastewater was supplied from the same container to both reactors by the use of two pumps (ISMATEC Labinett R1: 46 rpm, R0: 47 rpm) through two separate hoses (inner diameter 2 mm). This drop speed gave an inflow of one litre of artificial wastewater over the four hours that the pumps were set to run for. The wastewater was added throughout the anoxic phase in order to simulate continuous operation.
2. Aerobic phase The three hour aerobic phase also took place under stirring. In order to achieve an aerobic reactor, aeration was added by a flow of air into the reactors. It was not possible to measure the flow of air, however measurements of the oxygen concentration in the two reactors can be found in Table 9.2 and Table 9.3. It is important that there is oxygen present in the reactors for the nitrification to take place.
Addition of PAC To R1 PAC was added during the aerobic phase. When 30 minutes remained of phase 2 the PAC was added. The PAC was stored in an e‐flask, 500 mL, standing on a magnetic stirrer during the experiments, in order to prevent sedimentation of PAC and covered with parafilm to avoid evaporation. PAC was dissolved in distilled water into a concentration 100 times stronger than the one desired in one litre of the artificial wastewater since the maximum flow of PAC from the e‐flask was limited by the pump used (Alitea 999 rpm). The dosage of PAC was decided to be as immediate as possible and the pump had the capacity to pump 10 mL of PAC over the time of 4 minutes (with a hose, inner diameter 3 mm), hence the used concentration.
To R0 no PAC was added. Since PAC is a carbon source added to R1, methanol should have been added to R0 in order to gain the same increase of COD in this reactor as well. This was not done in the experiments due to that this aspect was not observed until after the experiments had been performed. The added amount of 0.05 g PAC per litre artificial wastewater in R1, can be corresponded by an addition of 0.17 mL methanol per litre wastewater in R0, resulting in an increase in COD with 200 mg per litre, see Appendix C for calculations.

4 Laboratory experiments
19
3. Sedimentation During sedimentation no stirring or aeration was on in order to let the sludge settle.
4. Decantation Decantation was performed by two pumps that were connected to glass pipettes fastened at a set level so that a volume of two litres always was maintained in the reactors after the decantation. The effluent from each reactor was collected in two separate containers and these containers were used to gather samples from for the daily parameters as well as for the analysis. The two containers also served as a simple version of flow controllers to ensure that R1 and R0 had the same addition of artificial wastewater. The time it took to pump out one litre, not counting the volume taken out for measurement of sludge suspension, was approximately 10 minutes.
Figure 4.3, below, shows the laboratory set up during the decantation phase when the trial experiments were performed, i.e. no PAC addition.
FIGURE 4.3 Laboratory set up of the reactors. The photo was taken during decantation phase (Photo: Caroline Säfström).
The first six cycles in experiment 1 to 3 were carried out with no addition of APIs or oestrogens to the artificial wastewater in order to wash the activated sludge from the real wastewater and to adapt the sludge to the artificial wastewater used. For the next following eight cycles, APIs and oestrogens were added to both reactors, from the spiked artificial wastewater, and PAC to R1. This was done before sampling commenced since an accumulation of PAC in the sludge was expected and also in order to reach an API and oestrogen concentration of 100 μg per litre in the reactors. Samples were taken out as 24‐hours collection samples, i.e. sample one from cycle 15 to 17, sample two from cycle 18 to20 and so on.
Batch 1 and 2 The two batch experiments were performed as one day experiments. The first batch experiment was performed on treated artificial wastewater from trial experiment 1. It was established that the artificial wastewater used in batch experiment 1 had a too high COD concentration. Therefore a second batch experiment, with treated wastewater that had an adjusted COD concentration corresponding to Källby wastewater treatment plant, was performed. This second batch experiment was done in order to get results on the treated wastewater from the process with the parameters that would be used in the following experiments. In batch experiment 2

Reduction of Active Pharmaceutical Ingredients in Wastewater
20
testing was also done for different reaction times, i.e. the PAC was allowed to react with the dissolved constituents during different long time periods, in order to gain an understanding of what time is needed for PAC to react with the substances present.
All of the batch experiments were performed according to the description below, Table 4.7.
TABLE 4.7 Step by step description of the batch experiments.
1. Different PAC concentrations [0.05 0.1 0.2 0.4 0.6 g/L] were added to e‐flasks.
2. Treated artificial wastewater from R1 and R0 was spiked with the API and oestrogen solution to the concentration of 100 μg APIs per litre and 25 μg oestrogens per litre.
3. 500 mL of the treated artificial wastewater was added to each e‐flask containing PAC.
4. The e‐flasks were placed in magnetic stirrers and covered with parafilm to prevent evaporation.
5. After 2 hours (for the e‐flasks with different PAC concentrations) respective [0 15 30 60 120] min (for the e‐flasks testing the time intervals in batch 2), the samples were filtrated.
6. The filtration was done through a first filtration in coarse filters (with a flow of 450 mL/min) so that the PAC would not block the finer glass filters and then a following double filtration in glass filters (Whatman GF/C, 1.2 μm).
7. After filtration the samples were preserved using a buffer prepared by DTU (contents for this buffer solution for preservation can be found in Appendix B).
8. IS was added to the samples just before the Solid Phase Extraction (SPE) was performed and the cartridges were then sent to DTU for analysis in GC‐MS.
The set up for the batch experiments can be seen in Figure 4.4. The different reaction times and amounts of PAC that was used can be found in Table 4.8.
FIGURE 4.4 Set up of the batch experiments where treated artificial wastewater was added to a PAC concentration in e‐flasks on magnetic stirrers.
TABLE 4.8 Reaction time and amount PAC that was used in the 10 different samples in the e‐flasks in batch 2.
Sample Reaction time (min)
Sample Amount PAC (g/L)
0.6 g PAC concentration 120 min reaction time
1 0 6 0.05
2 15 7 0.1
3 30 8 0.2
4 60 9 0.4
5 120 10 0.6
4.2.6 ADVICE FOR FUTURE RUNNING THE REACTOR EXPERIMENTS Artificial wastewater When the experiments were started it was expected that the artificial wastewater would be able to stand out in room temperature for four days without growth and odour occurring. During the

4 Laboratory experiments
21
first trial experiment however an odour was noticed from the artificial wastewater already after two days and when left out in room temperature, 22°C, from Friday through Monday a yeasty odour had spread in the laboratory. The problem with growth in the artificial wastewater was solved by making a solution of all ingredients but for peptone and meat extract in the stock‐solution. The peptone and meat extract, which was thought to be the main cause of the growth and smell, was then just added when the solution was to be used. Throughout the rest of the experiments no further odour or growth was noticed.
Sludge When the experiment was planned it was feared that the texture and volume and thereby the sedimentation of the sludge might become affected by the added APIs, oestrogens and PAC. However the sedimentation did not seem to be affected in the experiments and there was no problem at any time with sludge in the effluent in the decantation.
PAC The addition of PAC was done from an e‐flask through a hose by a pump, as previous mentioned. This proved to be a less reliable method. The first issue was that an instant dosage of the PAC was desired whereas the pump, which was slow, needed four minutes in order to add the decided amount of PAC. This was considered to be of minor importance though.
In experiment 1 there were problems with the inflow of PAC, diluted in distilled water, due to clogging in the hose (inner diameter 3 mm). The problems were experienced with PAC at a concentration of 10 g PAC per litre in the e‐flask. To counteract this, the PAC solution was diluted two times with a corresponding doubling of the volume, 20 mL instead of 10 mL, of the PAC solution added. Also, the PAC‐hose was rinsed each morning and refilled with PAC solution. With a concentration of 5 g PAC per litre in the e‐flask and the rinsing of the hose, the clogging diminished and approximately 0.1 g PAC was added per cycle as intended.
Since problems occurred with the PAC dosage and in order to know the exact amount PAC added, the e‐flask containing PAC was weighed each morning and an average dosage of PAC was calculated for the collected three cycle sample.
Clogging of PAC in the hose also occurred in experiment 2, resulting in that not enough PAC was supplied. The concentration used in the e‐flask was 5 g per litre and rinsing was performed daily. The clogging probably occurs due to a too high concentration of PAC in the e‐flask and that there are only three inflows per 24 hours. In the time between the cycles, the PAC clogs up in the hose. A possible solution is to use a hose with a greater diameter and to dilute the PAC even more.
In experiment 3, a concentration of 1.25 g PAC per litre was used in the e‐flask. 40 mL of the e‐flask PAC solution was added to R1 and a hose of larger inner diameter (inner diameter 5 mm instead of the 3 mm one in the previous experiments) was used. This resulted in a more stable and close to 0.05 g PAC dosage per litre wastewater.
4.2.7 SAMPLING Effluent samples were taken once a day, i.e. the reduction of PAC and oestrogens were analysed on a three cycle average sample.

Reduction of Active Pharmaceutical Ingredients in Wastewater
22
In order to control that the treatment process in the two rectors, R1 and R0, was similar, the following measurements, Table 4.9, were taken Monday to Friday.
TABLE 4.9 Measurements and methods used, in order to control the running of the two reactors, R1 and R0. 1Nonfiltered/Filtered
Measurements Method
COD (N/F)1 Samples from the effluent were analysed with Dr Lange LCK 114. Since the concentration of COD was below the normal measurement interval Dr Lange 814 was used.
NH ‐N Ammonium was analysed with Dr Lange LCK 303 on the effluent water.
NO ‐N Nitrate was analysed with Dr Lange LCK 339 on the effluent water.
Tot‐N Total nitrogen was analysed with Dr Lange LCK 138 on the effluent water.
O The oxygen level was measured approximately 10 minutes after aeration had started with WTW Oxi 197‐S.
pH pH was measured in the reactors with a WTW pH 320 meter in the beginning of the aerobic phase.
Conductivity The conductivity was measured in the reactors during aeration with a WTW Cond 340i Meter.
Alkalinity Alkalinity was measured by titration (according to Swedish standard SS‐EN 9963‐1) of effluent samples with hydrochloric acid (HCl) at a concentration of 0.05 M.
Temperature Temperature was taken during the aerobic part in the reactors.
Sludge suspension
A 10 mL sample from each of the reactors was collected during aeration. The sample was filtrated through a glass filter (VWR Glass Microfilter 691 5.5 cm, 1.6 μm equal to GF/A) that had been weighed, and then dried for 1 hour at 100°C according to Swedish standard SS‐EN 872. This gives the sludge suspension in g/L.
Preparation of sample for analysis The samples taken out were filtered twice through glass filters (Whatman GF/C, 1.2 μm) in order to remove as much as possible of the PAC that might be present, since still present PAC could disrupt the GC‐MS analysis. The decision to filter the solution twice, with change of the glass filter in between, was based on a try out where PAC was dissolved in distilled water and then filtered. In the second filtration no grey colour could be observed on the filter and it was considered that the PAC had been successfully removed.
Since the samples were going to be stored in between one day to one week in a fridge before the SPE the samples had to be preserved. After the filtration, a phosphate buffer solution (pH 3) was therefore added. This buffer solution was prepared by DTU, since it had been used in a previous project (Hansen, Photochemical Methods for Degradation of Estrogens and Pharmaceuticals, 2007) where collected samples had been preserved in the same way.
From each reactor and time of sampling, a sample of 250 mL was preserved. The volume sample, 250 mL, that was used for the SPE was decided by DTU to correspond with the analysis method, GC‐MS.

4 Laboratory experiments
23
4.2.8 SOLID PHASE EXTRACTION SPE is a method to extract substances from a solution onto a solid phase. It is done in order to simplify the following analysis since the matrix becomes easier to analyse when it is less complex, i.e. less substances are present (Sigma‐Aldrich, 2008). The SPE was performed with Oasis HLB 30 μm extraction cartridges supplied by Waters and an IST Vac Master, supplied by Sorbent, Figure 4.5 and Figure 4.6.
FIGURE 4.5 Set up of the SPE.
FIGURE 4.6 Oasis cartridges.
The following steps were performed in the SPE, Table 4.10.
TABLE 4.10 Steps performed in the SPE.
Step Description
1. 250 μL of the IS mecoprop was added to each of the preserved 250 mL samples. The purpose of adding a known amount IS is to compensate possible losses in the SPE and analysis of the substances.
2. The cartridges were activated through conditioning with 3 mL ethyl acetate, 3 ml methanol followed by 3 mL acidified water (pH 2.6). The acidified water was prepared by adding the same phosphate buffer that was used for preserving the samples to distilled water until a pH of 2.6 was reached.
3. After the activation the cartridges were filled up with another 3 mL of acidified water in order for the cartridges not to go dry in the time it takes for the sample to reach the cartridge through the hose.
4. A drop speed of approximately one drop per second was used at a vacuum pressure at 0.25 bar. The different flasks gave different flows and the flasks were therefore placed on different heights to compensate for this so that the cartridges would not overflow. When all of the samples had passed through the cartridges, the cartridges were dried with maximum vacuum pressure for one hour or until dry (this can be tested by looking at the cartridge; if the filling behaves as a powder then the cartridge is dry).
5. The dry cartridges were then put in a plastic container and sent to DTU for analysis through GC‐MS.
At one occasion there was not enough time to let the cartridges dry completely that day and they were therefore frozen down and dried at another time, this does however not affect the analysis results. It is only dry cartridges that can be stored as they are.

Reduction of Active Pharmaceutical Ingredients in Wastewater
24
4.2.9 GAS CHROMATOGRAPHY‐MASS SPECTROMETRY After the SPE, the columns were sent onwards to DTU for GC‐MS analysis. Since the columns were completely dried in the SPE there was no need for freezing them before transport and they were transported in a regular plastic box by car to DTU.
Only a brief description of the GC‐MS will be presented here since that analysis is not part of this master thesis and was completely performed by DTU.
The GC separates the different substances from each other through heating. This is possible due to the substances differences in volatility. The MS measures the substances based on their structure and produces a mass spectrum. (Oregon State University, 2008) All of the GC‐MS analyses were performed on a MS, Agilent Technologies Mass selective detector 5973 N, and a GC, Network GC System 6890 N Injector 7683 Series, by K. Hansen, Research Assistant, DTU Environment, DTU. Details of the method will not be presented here, but can be found in Photochemical Methods for Degradation of Estrogens and Pharmaceuticals (Hansen, Photochemical Methods for Degradation of Estrogens and Pharmaceuticals, 2007).

5 Results
25
5 RESULTS In this chapter the results from the different experiments will be presented. It was not possible however in the analysis to gain results for carbamazepine, due to the fact that carbamazepine did not behave linear in the analysis range that was used and it was neither possible to fit a soft curve to the measure points, as can be seen in Figure 5.1 (K. Hansen, DTU, personal communication, May 8, 2008). Therefore no results for the API carbamazepine will be presented.
FIGURE 5.1 Standard curve for experiment 1, where all substances part from carbamazepine are linear in the interval used.
Sample 1, 2, 3 etc. have been used throughout the chapter to indicate the order of the days the sample have been collected.
5.1 BATCH 1 Batch 1 was performed in order to control that the analysis method that was planned for all of the experiments would function on the effluent from the reactors. It was also done to gain an understanding of the removal of APIs and oestrogens that could be expected at different concentrations of PAC.
It was discovered that the artificial wastewater that had been used in trial experiment 1 had an almost three times higher COD concentration than was planned. Therefore it was decided that the results from batch 1 were not relevant as a base for the coming experiments. Batch 1 was also performed without access to internal standard due to delivery problems which meant that the losses in the SPE and following analysis were unknown. However the analysis did give results on concentrations and showed that the SPE and GC‐MS would function as analysis method for the upcoming experiments.
5.2 BATCH 2 In batch 2 the COD concentration in the artificial wastewater had been adjusted and the results from this batch experiment were used to decide which PAC concentration that was going to be added in experiment 1. The batch 2 experiment was also performed in order to gain knowledge of the impact of the reaction time for the PAC so that an appropriate time for addition of PAC to the reactors could be decided.

Reduction of Active Pharmaceutical Ingredients in Wastewater
26
5.2.1 PAC CONCENTRATION The analysis of the sample where no PAC had been added, detected API levels for four of the five APIs that were higher than the added amount of 100 μg, as shown in Figure 5.2. This is presumably due to that the APIs and oestrogens bind to the cartridges in a different ratio than the IS, due to differences in acidity. The higher concentrations that were analysed in sample 1 have been used as starting concentrations for the calculations of the reduction and therefore the removal ratio is not affected by the initially higher concentrations analysed.
FIGURE 5.2 Results from batch 2 for sample 1 with no added PAC. It is notable that four of five concentrations detected in the sample are higher than the concentration of 100 μg APIs added per litre, marked out in the figure.
In order to emphasize the removal in the five samples where PAC was added, these are shown separately in Figure 5.3.
FIGURE 5.3 Results from batch 2 for samples 2 to 6 with different amounts [0.05 0.1 0.2 0.4 0.6 g/L] of PAC added. The added amount 100 μg has been marked out in the figure.
In all five samples where PAC had been added a removal of APIs had occurred. With an addition of 0.4 g PAC per litre wastewater there is a removal efficiency of 99 % or more for all of the APIs. From an economic perspective a low dosage of PAC is wanted. According to the results from
0
100
200
300
400
0 g PAC/L
APIs (μ
g)
Added PAC (g/L)
Batch 2(sample 1)
Ibuprofen Diclofenac Ketoprofen Naproxen Clofibric acid
0
20
40
60
80
100
0.05 0.1 0.2 0.4 0.6
APIs (μg/L)
Added PAC (g/L)
Batch 2 (sample 2 to 6)
Ibuprofen Diclofenac Ketoprofen Naproxen Clofibric acid

5 Results
27
batch 2 a concentration of 0.1 g PAC per litre wastewater results in the following removal efficiencies of the different APIs, Table 5.1.
TABLE 5.1 Detected amounts and removal efficiencies of APIs with a PAC concentration of 0.1 g per litre wastewater.
API Ibuprofen Diclofenac Ketoprofen Naproxen Clofibric acid Amount (μg/L) 21 2.1 12 14 13 Removal (%) 94 98 95 95 90 The removal has been calculated based on the sample with no PAC, see Figure 5.2. Since the starting concentrations detected were higher than the 100 μg per litre added to the sample for all APIs apart from diclofenac, the reduction may be overestimated. This is, however, not necessarily the case, since the same analysis overestimation could account for a higher amount of APIs in the after following samples, therefore resulting in the same reduction ratio.
Based on the results, all of the APIs reach a removal efficiency of 90 percent or higher when 0.1 g PAC is added per litre wastewater. Clofibric acid has the lowest removal efficiency at 90 percent whereas diclofenac has the highest, 98 percent.
Given that the aim is to find a method that in the future could be used in wastewater treatment plants, it is important to minimise the amount of PAC used in order to have as low treatment cost as possible. The lower concentration of 0.05 g PAC per litre wastewater was also tested in batch 2. This resulted in the following removal efficiencies, Table 5.2.
TABLE 5.2 Detected amount and reduction of APIs at a PAC concentration of 0.05 g per litre wastewater.
API Ibuprofen Diclofenac Ketoprofen Naproxen Clofibric acid Amount (μg/L) 52 4.6 14 14 74 Removal (%) 84 95 94 94 42 When a concentration of 0.05 g PAC per litre wastewater is used it results in a removal of 84 to 95 percent for four of the five APIs. Clofibric acid is however only removed by 42 percent.
A 90 to 98 percent removal, Table 5.1 of all the APIs however was considered sufficient, based on comparison with the removal efficiencies in the literature, see section 2.4.3, and it was decided based on the results from batch 2 to use a concentration of 0.1 g PAC per litre wastewater in experiment 1.
5.2.2 REACTION TIME Results from the different reaction times are found in Figure 5.4, below. A concentration of 0.6 g PAC per litre wastewater was used in all of the time experiments.

Reduction of Active Pharmaceutical Ingredients in Wastewater
28
FIGURE 5.4 Amount of APIs after the different time intervals with an added PAC concentration of 0.6 g. The line marks the added amount of 100 μg/L APIs.
In Figure 5.4 it is shown that already after 15 minutes less than 10 μg per litre is left of the five APIs compared to the initial concentrations of 100 μg per litre in Figure 5.2. After two hours 100 percent removal, of all APIs, is achieved.
Results for the shortest reaction time, five minutes, are presented in Table 5.3. The same inconsistency occurs here as in Table 5.1, that e.g. a concentration of 30 μg per litre ibuprofen corresponds to a removal efficiency of 92 percent due to that the initial concentration detected is higher than the 100 μg API added per litre.
TABLE 5.3 Amount and removal efficiency after five minutes reaction time with a PAC concentration at 0.6 g per litre.
API Ibuprofen Diclofenac Ketoprofen Naproxen Clofibric acid Amount (μg/L) 27 1.0 10 16 4.4 Removal (%) 92 99 96 94 97 Batch 2 shows that the PAC removal of APIs is rapid and after five minutes 92 to 99 percent, depending on API, have been removed. After two hours 100 percent of the APIs had been removed. Based on the results from batch 2, PAC was added to R1 when 30 minutes of the aerobic phase remained in the laboratory set up.
5.2.3 OESTROGENS In batch 2 the following removal efficiencies were obtained for the oestrogens when different PAC concentrations and reaction times were used, see Table 5.4 and Table 5.5. All of the oestrogens have been completely or almost completely removed and therefore only the removal efficiencies and no amounts will be accounted for in the oestrogen results.
020406080100
5 15 30 60 120
API (μg/L)
Time (min)
Batch 2(time intervals, added PAC 0.6 g)
Ibuprofen Diclofenac Ketoprofen Naproxen Clofibric acid

5 Results
29
TABLE 5.4 Results from batch 2 where different amounts of PAC have been used. The reaction time was two hours.
Oestrogen Removal (%)
0.05 0.1 0.2 0.4 0.6
g PAC/L
Oestrone 100 100 100 100 100
Oestradiol 98 98 100 100 100
Ethinyl oestradiol
99 99 100 100 100
TABLE 5.5 Results from batch 2 where 0.6 g PAC per litre artificial wastewater have been allowed to react during different time intervals.
Oestrogen Removal (%)
5 15 30 60 120
min
Oestrone 100 100 100 100 100
Oestradiol 99 99 100 99 100
Ethinyl oestradiol
100 100 100 100 100
As can be seen in Table 5.4 100 percent removal efficiency is achieved (detection limit for detected but not quantified is 0.25 μg) with a used PAC concentration of 0.02 g per litre artificial wastewater. A PAC dosage of 0.05 and also 0.1 g PAC per litre wastewater results in a reduction of 98 to 100 percent. With a removal efficiency at 98 percent of the oestrogens a PAC dosage of 0.05 g per litre artificial wastewater would be satisfactory. Table 5.5 shows that already after five minutes there is a 99 to 100 percent reduction of the APIs when a PAC concentration of 0.6 g PAC per litre wastewater has been used. A long reaction time is therefore not needed to gain an adsorbtion of the oestrogens to PAC.
5.2.4 BATCH 2 IN TOTAL From the results in batch 2 the decision was made to use a PAC concentration of 0.1 g PAC per litre artificial wastewater. Due to the rapid removal of APIs and oestrogens in the batch 2 experiment it was also decided to add the PAC 30 minutes before sedimentation starts in experiments 1 to 3. Another reason for wanting to add the PAC as late as possible in the treatment process is that there is a reduction of the APIs and oestrogens in the ordinary biological treatment process even if no PAC is added, and this reduction should be taken advantage of.
5.3 EXPERIMENT 1 – 0.1 G PAC PER LITRE ARTIFICIAL WASTEWATER Based on batch 2, 0.1 g PAC per litre artificial wastewater was added to R1 in experiment 1. R0 had no addition of PAC and served as a reference of the removal of APIs to be expected in the treatment process without any PAC added.
In experiment 1 it was presumed that the PAC dosage would function and therefore no record was taken of the dosage. It proved however that the PAC dosage was less reliable than presumed and the results in Table 5.6 are therefore presented with the reservation that the dosage of PAC most likely was not constant at 0.1 g.
For all calculations of removal efficiency, the found concentrations of APIs have been compared to the added amount of 100 μg APIs per litre and the analysed concentrations of oestrogens have been compared to the added amount of 25 μg per litre. The analytical overestimation has thus not been taken into consideration when calculating the removal efficiencies for experiment 1.
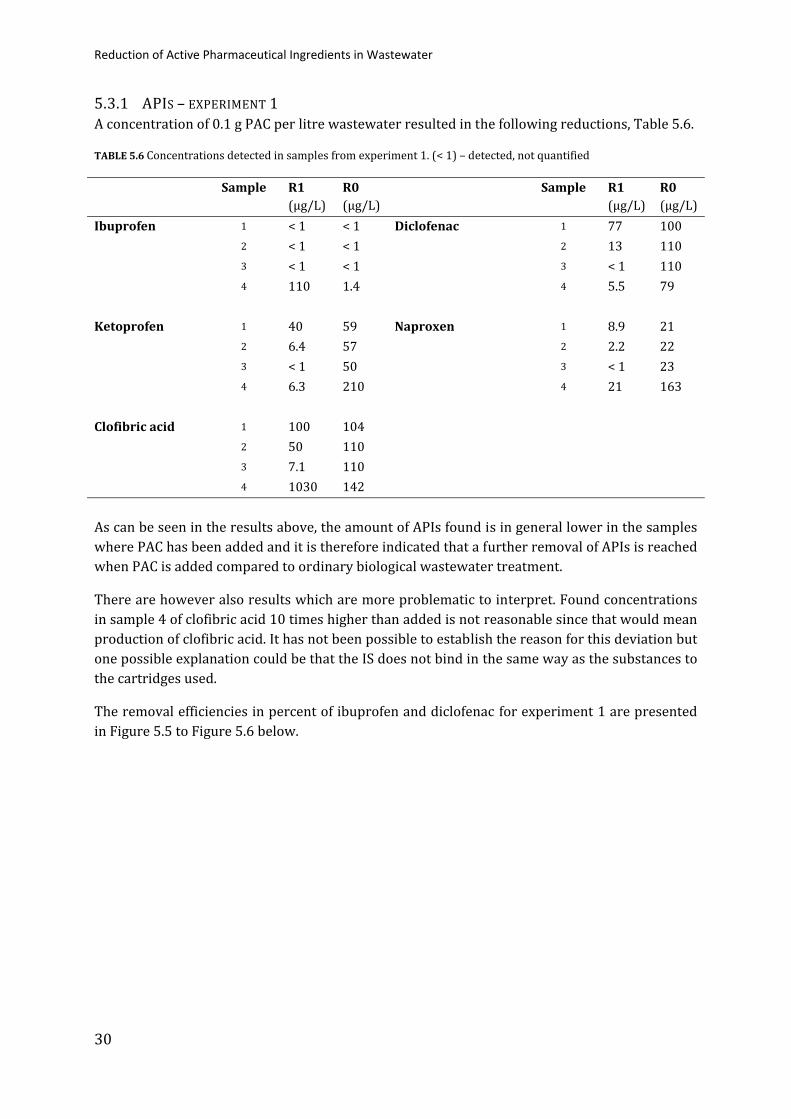
Reduction of Active Pharmaceutical Ingredients in Wastewater
30
5.3.1 APIS – EXPERIMENT 1 A concentration of 0.1 g PAC per litre wastewater resulted in the following reductions, Table 5.6.
TABLE 5.6 Concentrations detected in samples from experiment 1. (< 1) – detected, not quantified
Sample R1 (μg/L)
R0 (μg/L)
Sample R1 (μg/L)
R0 (μg/L)
Ibuprofen 1 < 1 < 1 Diclofenac 1 77 100 2 < 1 < 1 2 13 110 3 < 1 < 1 3 < 1 110 4 110 1.4 4 5.5 79 Ketoprofen 1 40 59 Naproxen 1 8.9 21 2 6.4 57 2 2.2 22 3 < 1 50 3 < 1 23 4 6.3 210 4 21 163 Clofibric acid 1 100 104 2 50 110 3 7.1 110 4 1030 142 As can be seen in the results above, the amount of APIs found is in general lower in the samples where PAC has been added and it is therefore indicated that a further removal of APIs is reached when PAC is added compared to ordinary biological wastewater treatment.
There are however also results which are more problematic to interpret. Found concentrations in sample 4 of clofibric acid 10 times higher than added is not reasonable since that would mean production of clofibric acid. It has not been possible to establish the reason for this deviation but one possible explanation could be that the IS does not bind in the same way as the substances to the cartridges used.
The removal efficiencies in percent of ibuprofen and diclofenac for experiment 1 are presented in Figure 5.5 to Figure 5.6 below.
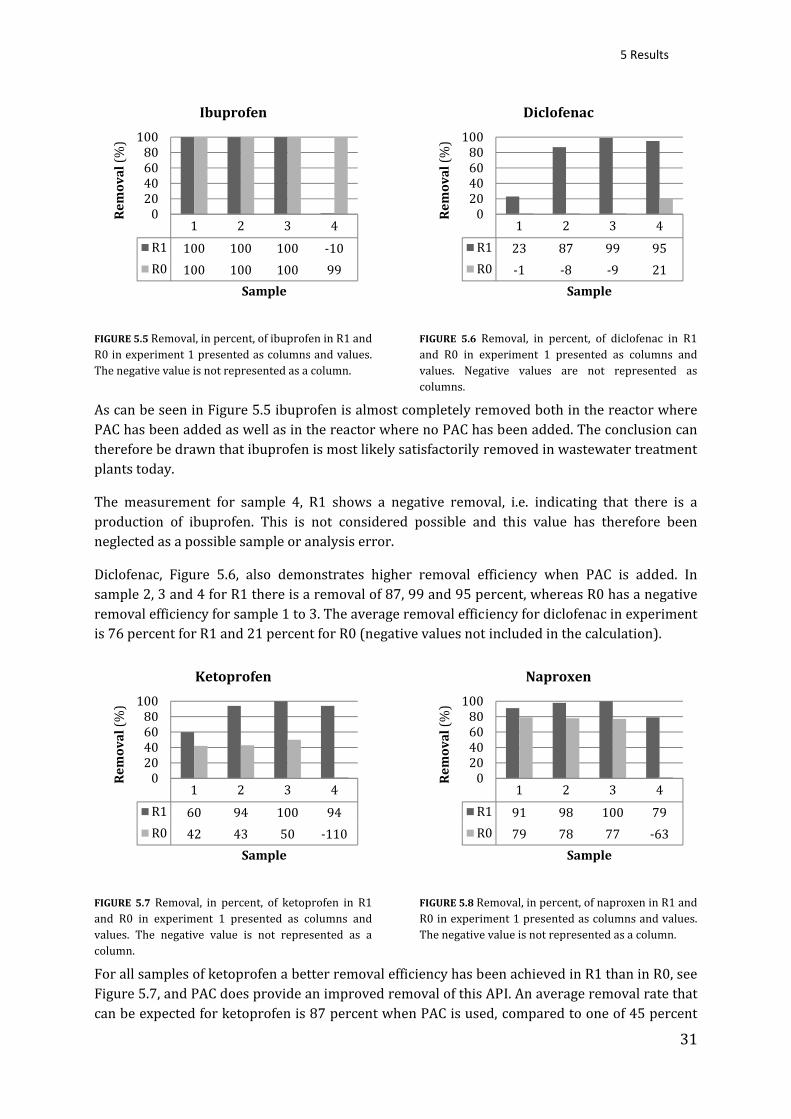
5 Results
31
FIGURE 5.5 Removal, in percent, of ibuprofen in R1 and R0 in experiment 1 presented as columns and values. The negative value is not represented as a column.
FIGURE 5.6 Removal, in percent, of diclofenac in R1 and R0 in experiment 1 presented as columns and values. Negative values are not represented as columns.
As can be seen in Figure 5.5 ibuprofen is almost completely removed both in the reactor where PAC has been added as well as in the reactor where no PAC has been added. The conclusion can therefore be drawn that ibuprofen is most likely satisfactorily removed in wastewater treatment plants today.
The measurement for sample 4, R1 shows a negative removal, i.e. indicating that there is a production of ibuprofen. This is not considered possible and this value has therefore been neglected as a possible sample or analysis error.
Diclofenac, Figure 5.6, also demonstrates higher removal efficiency when PAC is added. In sample 2, 3 and 4 for R1 there is a removal of 87, 99 and 95 percent, whereas R0 has a negative removal efficiency for sample 1 to 3. The average removal efficiency for diclofenac in experiment is 76 percent for R1 and 21 percent for R0 (negative values not included in the calculation).
FIGURE 5.7 Removal, in percent, of ketoprofen in R1 and R0 in experiment 1 presented as columns and values. The negative value is not represented as a column.
FIGURE 5.8 Removal, in percent, of naproxen in R1 and R0 in experiment 1 presented as columns and values. The negative value is not represented as a column.
For all samples of ketoprofen a better removal efficiency has been achieved in R1 than in R0, see Figure 5.7, and PAC does provide an improved removal of this API. An average removal rate that can be expected for ketoprofen is 87 percent when PAC is used, compared to one of 45 percent
1 2 3 4R1 100 100 100 ‐10R0 100 100 100 99
020406080100
Rem
oval (%
)
Sample
Ibuprofen
1 2 3 4R1 23 87 99 95R0 ‐1 ‐8 ‐9 21
020406080100
Rem
oval (%
)
Sample
Diclofenac
1 2 3 4R1 60 94 100 94R0 42 43 50 ‐110
020406080100
Rem
oval (%
)
Sample
Ketoprofen
1 2 3 4R1 91 98 100 79R0 79 78 77 ‐63
020406080100
Rem
oval (%
)
Sample
Naproxen
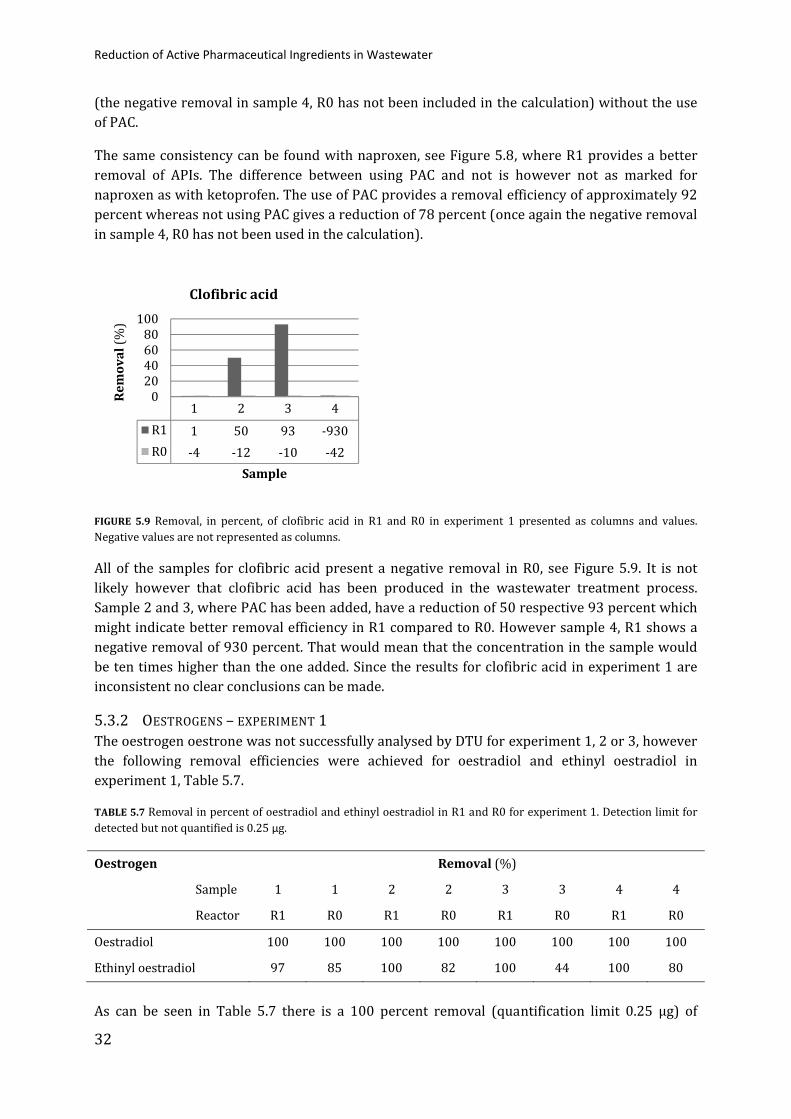
Reduction of Active Pharmaceutical Ingredients in Wastewater
32
(the negative removal in sample 4, R0 has not been included in the calculation) without the use of PAC.
The same consistency can be found with naproxen, see Figure 5.8, where R1 provides a better removal of APIs. The difference between using PAC and not is however not as marked for naproxen as with ketoprofen. The use of PAC provides a removal efficiency of approximately 92 percent whereas not using PAC gives a reduction of 78 percent (once again the negative removal in sample 4, R0 has not been used in the calculation).
FIGURE 5.9 Removal, in percent, of clofibric acid in R1 and R0 in experiment 1 presented as columns and values. Negative values are not represented as columns.
All of the samples for clofibric acid present a negative removal in R0, see Figure 5.9. It is not likely however that clofibric acid has been produced in the wastewater treatment process. Sample 2 and 3, where PAC has been added, have a reduction of 50 respective 93 percent which might indicate better removal efficiency in R1 compared to R0. However sample 4, R1 shows a negative removal of 930 percent. That would mean that the concentration in the sample would be ten times higher than the one added. Since the results for clofibric acid in experiment 1 are inconsistent no clear conclusions can be made.
5.3.2 OESTROGENS – EXPERIMENT 1 The oestrogen oestrone was not successfully analysed by DTU for experiment 1, 2 or 3, however the following removal efficiencies were achieved for oestradiol and ethinyl oestradiol in experiment 1, Table 5.7.
TABLE 5.7 Removal in percent of oestradiol and ethinyl oestradiol in R1 and R0 for experiment 1. Detection limit for detected but not quantified is 0.25 μg.
Oestrogen Removal (%)
Sample 1 1 2 2 3 3 4 4
Reactor R1 R0 R1 R0 R1 R0 R1 R0
Oestradiol 100 100 100 100 100 100 100 100
Ethinyl oestradiol 97 85 100 82 100 44 100 80
As can be seen in Table 5.7 there is a 100 percent removal (quantification limit 0.25 μg) of
1 2 3 4R1 1 50 93 ‐930R0 ‐4 ‐12 ‐10 ‐42
020406080100
Rem
oval (%
)
Sample
Clofibric acid
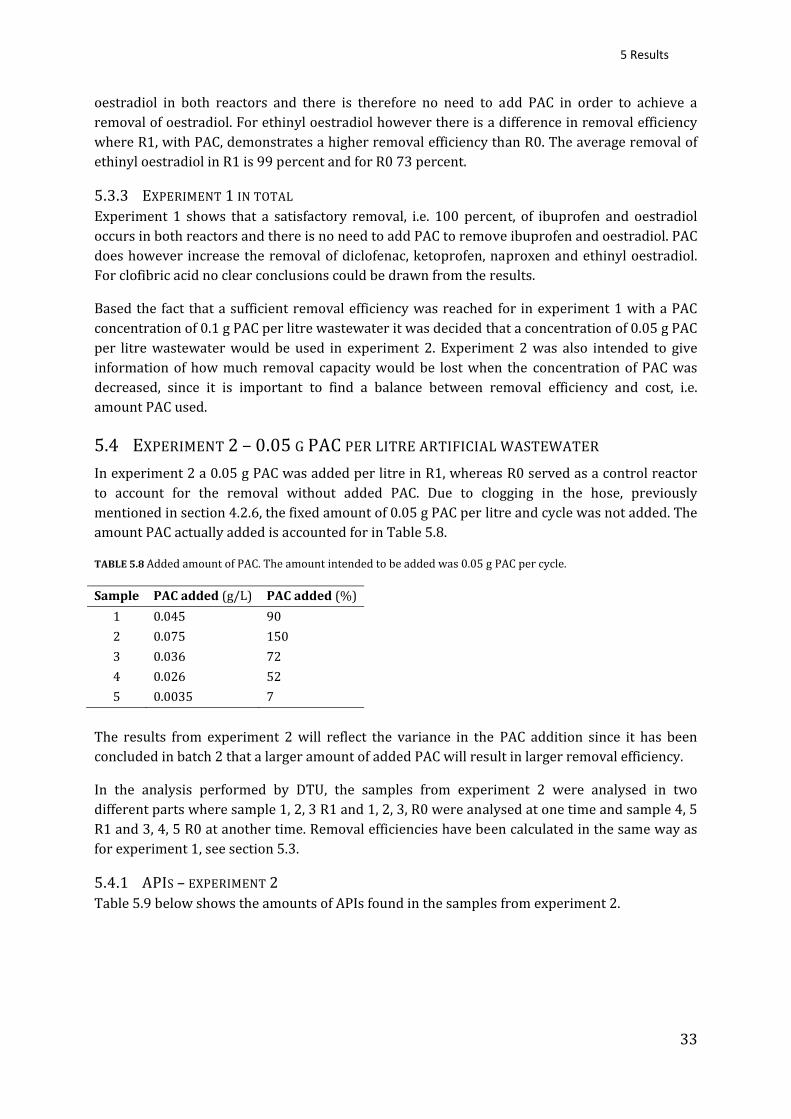
5 Results
33
oestradiol in both reactors and there is therefore no need to add PAC in order to achieve a removal of oestradiol. For ethinyl oestradiol however there is a difference in removal efficiency where R1, with PAC, demonstrates a higher removal efficiency than R0. The average removal of ethinyl oestradiol in R1 is 99 percent and for R0 73 percent.
5.3.3 EXPERIMENT 1 IN TOTAL Experiment 1 shows that a satisfactory removal, i.e. 100 percent, of ibuprofen and oestradiol occurs in both reactors and there is no need to add PAC to remove ibuprofen and oestradiol. PAC does however increase the removal of diclofenac, ketoprofen, naproxen and ethinyl oestradiol. For clofibric acid no clear conclusions could be drawn from the results.
Based the fact that a sufficient removal efficiency was reached for in experiment 1 with a PAC concentration of 0.1 g PAC per litre wastewater it was decided that a concentration of 0.05 g PAC per litre wastewater would be used in experiment 2. Experiment 2 was also intended to give information of how much removal capacity would be lost when the concentration of PAC was decreased, since it is important to find a balance between removal efficiency and cost, i.e. amount PAC used.
5.4 EXPERIMENT 2 – 0.05 G PAC PER LITRE ARTIFICIAL WASTEWATER In experiment 2 a 0.05 g PAC was added per litre in R1, whereas R0 served as a control reactor to account for the removal without added PAC. Due to clogging in the hose, previously mentioned in section 4.2.6, the fixed amount of 0.05 g PAC per litre and cycle was not added. The amount PAC actually added is accounted for in Table 5.8.
TABLE 5.8 Added amount of PAC. The amount intended to be added was 0.05 g PAC per cycle.
Sample PAC added (g/L) PAC added (%)1 0.045 90 2 0.075 150 3 0.036 72 4 0.026 52 5 0.0035 7
The results from experiment 2 will reflect the variance in the PAC addition since it has been concluded in batch 2 that a larger amount of added PAC will result in larger removal efficiency.
In the analysis performed by DTU, the samples from experiment 2 were analysed in two different parts where sample 1, 2, 3 R1 and 1, 2, 3, R0 were analysed at one time and sample 4, 5 R1 and 3, 4, 5 R0 at another time. Removal efficiencies have been calculated in the same way as for experiment 1, see section 5.3.
5.4.1 APIS – EXPERIMENT 2 Table 5.9 below shows the amounts of APIs found in the samples from experiment 2.

Reduction of Active Pharmaceutical Ingredients in Wastewater
34
TABLE 5.9 Concentrations detected in samples from experiment 2. (< 1) – detected, not quantified
Sample R1 (μg/L)
R0 (μg/L)
Sample R1 (μg/L)
R0 (μg/L)
Ibuprofen 1 < 1 < 1 Diclofenac 1 20 35 2 < 1 < 1 2 43 71 3 < 1 < 1 3 27 91 4 < 1 < 1 4 38 100 5 < 1 < 1 5 3.0 150 Ketoprofen 1 19 32 Naproxen 1 12 21 2 36 53 2 20 29 3 21 63 3 12 34 4 26 61 4 17 38 5 1.9 200 5 1.9 190 Clofibric acid 1 44 57 2 74 101 3 76 110 4 72 120 5 13 100 In the same way as in experiment 1 the ibuprofen is removed by the biological treatment process itself and there is no need to add extra PAC in order to remove ibuprofen. Figure 5.10 to Figure 5.11 shows removal efficiencies of ibuprofen and diclofenac expressed in percent.
FIGURE 5.10 Removal, in percent, of ibuprofen in R1 and R0 in experiment 2 presented as columns and values.
FIGURE 5.11 Removal, in percent, of diclofenac in R1 and R0 in experiment 2 presented as columns and values. Negative values are not represented as columns.
A complete removal is achieved in both R1 and R0 of ibuprofen. For diclofenac the results from experiment 2 shows a lower removal efficiency compared to experiment 1. R1 in samples 1 to 3 provides a removal of diclofenac with an average of 57 percent compared to R0 with an average of 34 percent. Also sample 4 and 5 have a high removal of diclofenac in R1, whereas the removal in R0 is none. The higher dosage of PAC for sample 2 is not traceable in the removal efficiency for diclofenac since no increased removal was shown in sample 2.
1 2 3 4 5R1 100 100 100 100 100R0 100 100 100 100 100
020406080100
Rem
oval (%
)
Sample
Ibuprofen
1 2 3 4 5R1 80 57 33 62 97R0 65 29 9 ‐2 ‐55
020406080100
Rem
oval (%
)
Sample
Diclofenac

5 Results
35
FIGURE 5.12 Removal, in percent, of ketoprofen in R1 and R0 in experiment 2 presented as columns and values. The negative value is not represented as a column.
FIGURE 5.13 Removal, in percent, of naproxen in R1 and R0 in experiment 2 presented as columns and values. The negative value is not represented as a column.
Ketoprofen have a higher removal efficiency in R1, average 70 percent, compared to R0 with an average at 48 percent (negative value in sample 5 not included). For naproxen R1 once again presents a higher removal efficiency than R0. The average values here are 83 respective 69 percent (negative value in sample 5 not included).
FIGURE 5.14 Removal, in percent, of clofibric acid in R1 and R0 in experiment 2 presented as columns and values.
In R1 there is a removal of clofibric acid whereas the results for R0 are more unclear indicating a production of clofibric acid in sample two to five. The average removal efficiency of clofibric acid in R1 is 44 percent.
5.4.2 OESTROGENS – EXPERIMENT 2 In the same way as in experiment 1 no results were obtained for oestrone, however oestradiol was removed below the quantification limit at 0.25 μg per litre in both R1 and R0. Ethinyl oestradiol was removed according to Table 5.10.
1 2 3 4 5R1 81 64 79 30 98R0 68 47 37 69 ‐100
020406080100
Rem
oval (%
)
Sample
Ketoprofen
1 2 3 4 5R1 88 80 68 83 98R0 79 71 66 62 ‐86
020406080100
Rem
oval (%
)
Sample
Naproxen
1 2 3 4 5R1 56 26 24 28 87R0 43 ‐1 ‐11 ‐19 ‐1
020406080100
Rem
oval (%
)
Sample
Clofibric acid

Reduction of Active Pharmaceutical Ingredients in Wastewater
36
TABLE 5.10 Removal efficiency in percent of ethinyl oestradiol in experiment 2.
Oestrogen Removal (%)
Sample 1 1 2 2 3 3 4 4 5 5
Reactor R1 R0 R1 R0 R1 R0 R1 R0 R1 R0
Ethinyl oestradiol 100 92 90 77 100 76 100 73 100 74
R1 is below detection limit (0.25 μg per litre) in all samples but for sample 2, whereas concentrations in R0 vary between 2 and 6.6 μg per litre. The average removal efficiency of ethinyl oestradiol for R1 and R0 is 98 respective 78 percent and therefore according to experiment 2 addition of PAC does provide a higher removal of ethinyl oestradiol. The extra dosage of PAC in sample 2 is not traced in the results for the oestrogens since there is no increased removal efficiency for that sample.
5.4.3 EXPERIMENT 2 IN TOTAL The uneven dosage of PAC cannot clearly be viewed in the results gained in experiment 2. Again a complete removal of ibuprofen in both reactors occurs and diclofenac demonstrates a higher removal efficiency in R1 than R0.
As in experiment 1 there is a better removal of ketoprofen and naproxen in R1, however the lower PAC dosage results in that the average removal efficiency of ketoprofen and naproxen has dropped from 87 to 70 percent respective 92 to 83 percent. To halve the PAC dosage has however not resulted in halved removal efficiency. Experiment 2 compared to the unclear results for R1 in experiment 1 does show a removal of clofibric acid at 44 percent.
Oestradiol is completely removed in both reactors, whereas there is a difference between PAC addition and not for ethinyl oestradiol where a better removal efficiency is achieved with PAC dosage. The lower PAC dosage does not seem to have affected the removal efficiency of ethinyl oestradiol compared to experiment 1.
5.5 EXPERIMENT 3 – 0.05 G PAC PER LITRE ARTIFICIAL WASTEWATER Experiment 3 was run on the same PAC concentration as in experiment 2 since the PAC dosage had not been working properly. With the wider hose (inner diameter 5 mm) and the more diluted PAC solution (1.25 g PAC per litre in the e‐flask) used in experiment 3, a more stable PAC dosage of approximately 0.05 g per litre artificial wastewater was achieved, see Table 5.11.
TABLE 5.11 PAC dosage in experiment
Sample PAC added (g/L) PAC added (%)1 0.04 g 80 2 0.05 g 100 3 0.04 g 80 4 No measurement was done.
Removal efficiencies have been calculated in the same way as for experiment 1 and 2, see section 5.3.

5 Results
37
5.5.1 APIS – EXPERIMENT 3 Table 5.12 below shows the amounts of APIs found in the samples from experiment 3. Sample 4, R1 was not possible to analyse since the IS was outside quality demand and therefore no results are presented for that sample (K. Hansen, DTU, personal communication, May 6, 2008).
TABLE 5.12 Concentrations detected in samples from experiment 3. (< 1) – detected, not quantified
Sample R1 (μg/L)
R0 (μg/L)
Sample R1 (μg/L)
R0 (μg/L)
Ibuprofen 1 < 1 < 1 Diclofenac 1 < 1 93 2 < 1 < 1 2 < 1 97 3 < 1 < 1 3 < 1 89 4 NA < 1 4 NA 151 Ketoprofen 1 < 1 56 Naproxen 1 < 1 27 2 < 1 47 2 < 1 24 3 < 1 31 3 < 1 21 4 NA 77 4 NA 91 Clofibric acid 1 16 130 2 14 140 3 28 120 4 NA 100 Figure 5.15 to Figure 5.16 shows the removal efficiency of ibuprofen and diclofenac expressed in percent.
FIGURE 5.15 Removal, in percent, of ibuprofen in R1 and R0 in experiment 3 presented as columns and values. Sample 4 could not be analysed.
FIGURE 5.16 Removal, in percent, of diclofenac in R1 and R0 in experiment 3 presented as columns and values. The negative value is not represented as a column. Sample 4 could not be analysed.
As in experiment 1 and 2 there is 100 percent removal efficiency of ibuprofen. Sample 1 to 3 of diclofenac also shows a 100 percent removal whereas sample 1 to 3 in R0 has removal efficiency 7 percent. Sample 4, R1 was not possible to analyse, see above, and for R0 the last sample shows a negative removal, i.e. production.
1 2 3 4R1 100 100 100R0 100 100 100 100
020406080100
Rem
oval (%
)
Sample
Ibuprofen
1 2 3 4R1 100 100 100R0 7 3 11 ‐51
020406080100
Rem
oval (%
)
Sample
Diclofenac

Reduction of Active Pharmaceutical Ingredients in Wastewater
38
FIGURE 5.17 Removal, in percent, of ketoprofen in R1 and R0 in experiment 3 presented as columns and values. Sample 4 could not be analysed.
FIGURE 5.18 Removal, in percent, of naproxen in R1 and R0 in experiment 3 presented as columns and values. Sample 4 could not be analysed.
Ketoprofen in R1 has been 100 percent removed in the analysed samples, whereas R0 has an average removal efficiency of 47 percent. PAC addition in R1 gives 100 percent removal of naproxen whereas the regular wastewater treatment removes 59 percent.
FIGURE 5.19 Removal, in percent, of clofibric acid in R1 and R0 in experiment 3 presented as columns and values.
Clofibric acid shows a removal in R1 with an average at 81 percent compared to R0 which shows no removal but instead indicates production of the substance.
5.5.2 OESTROGENS – EXPERIMENT 3 As in experiment 1 and 2, there was a 100 percent removal of oestradiol in experiment 3. Ethinyl oestradiol was not detected or detected but below quantification level for all of the samples from R1, which indicates a 100 percent removal when PAC is added. In R0 the average removal efficiency of ethinyl oestradiol was 75 percent, see Table 5.13.
1 2 3 4R1 100 100 100R0 44 53 69 23
020406080100
Rem
oval (%
)
Sample
Ketoprofen
1 2 3 4R1 100 100 100R0 73 76 79 9
020406080100
Rem
oval (%
)
Sample
Naproxen
1 2 3 4R1 84 86 72R0 ‐30 ‐37 ‐22 ‐3
020406080100
Rem
oval (%
)
Sample
Clofibric acid

6 Discussion
39
TABLE 5.13 Removal efficiency in percent of ethinyl oestradiol in experiment 3.
Oestrogen Removal (%)
Sample 1 1 2 2 3 3 4 4
Reactor R1 R0 R1 R0 R1 R0 R1 R0
Ethinyl oestradiol 100 75 100 72 100 77 100 76
5.5.3 EXPERIMENT 3 IN TOTAL As in experiment 1 and 2 there is a 100 percent removal of ibuprofen in both reactors in experiment 3. There is a large difference in removal efficiency of diclofenac, with an average removal of 100 percent in R1, compared to R0 where only 7 percent is removed. Ketoprofen, naproxen and also clofibric acid all show a higher removal in R1 compared to R0. Oestradiol is, as in the previous experiments, completely removed in both reactors, as is ethinyl oestradiol in R1. R0 does however have a lower removal efficiency of ethinyl oestradiol compared to R1 with PAC addition.
5.6 REAL WASTEWATER EXPERIMENT – 0.05 G PAC PER LITRE WASTEWATER In the real wastewater experiment a PAC dosage of 0.04 g PAC per litre wastewater, i.e. 80 percent of the intended, was achieved. The real wastewater collected from Källby wastewater treatment plant was spiked with an API concentration if 100 μg and an oestrogen concentration of 25 μg per litre wastewater before added to the reactors in the laboratory set up.
Removal efficiencies have been calculated in the same way as for experiment 1, 2 and 3, see section 5.3.
5.6.1 APIS – REAL WASTEWATER EXPERIMENT In the experiment with real wastewater effluent samples from two cycles were taken. However, the analysis of the sample from R1, second cycle was analysed with an IS outside quality demand and the results for sample 2, R1, are therefore very uncertain (K. Hansen, DTU, personal communication, May 6, 2008). Table 5.14 below shows the amounts of APIs found in the samples from the experiment where real wastewater was used.
TABLE 5.14 Concentrations detected in samples from the real wastewater experiment. The results for R1, sample 2, italic, are uncertain.
Sample R1 (μg/L)
R0 (μg/L)
Sample R1 (μg/L)
R0 (μg/L)
Ibuprofen 1 3 6 Diclofenac 1 24 35 2 340 71 2 95 78 Ketoprofen 1 23 37 Naproxen 1 15 26 2 190 107 2 220 92 Clofibric acid 1 23 30
2 54 36

Reduction of Active Pharmaceutical Ingredients in Wastewater
40
The results presented in percentage removal are found in below, Figure 5.20.
FIGURE 5.20 Removal in percentage for the APIs in the real wastewater experiment presented as columns and values. (1) – first sample, (2) – second sample, (IBU) – ibuprofen, (DIC) – diclofenac, (KP) – ketoprofen, (NPX) – naproxen, (CA) – Clofibric acid. Negative values are not represented as columns.
As seen in the figure there is, for sample 1, a removal efficiency of 76 to 97 percent in R1 whereas R0 has a removal of 63 to 94 percent of the different APIs. For all of the APIs, apart from clofibric acid, sample 2, the removal is larger when PAC is added. Sample 2 R1 has a removal efficiency of ‐240 to 56 percent. This variation is due to that the IS was outside quality demand. R0 has a removal efficiency of ‐7 to 64 percent in sample 2.
Since no problems occurred during the analysis due to using real wastewater, the conclusion can be made that there is no analytical problems with analysing these APIs in real wastewater.
5.6.2 OESTROGENS – REAL WASTEWATER EXPERIMENT In the real wastewater experiment, compared to the other experiments, the analysis of oestrone was successful and showed that no oestrone could be detected, indicating 100 percent removal.
TABLE 5.15 Removal efficiencies in percentage for the oestrogens in the real wastewater experiment.
Oestrogen Removal (%)
Sample 1 1 2 2
Reactor R1 R0 R1 R0
Oestrone 100 100 100 100
Oestradiol 97 100 96 96
Ethinyl oestradiol 93 92 92 84
The average removal efficiency for oestrone was 100 percent in both R1 and R0 and for oestradiol 97 percent in R1 and 98 percent in R0. Ethinyl oestradiol had a reduction efficiency of 93 percent in R1 and 88 percent in R0. For oestrone and oestradiol the addition of PAC does not provide an increased removal of the oestrogens. There is however a difference for ethinyl oestradiol, where PAC increases the removal efficiency with 5 percent.
IBU 1 IBU 2 DIC 1 DIC 2 KP 1 KP 2 NPX 1 NPX 2 CA 1 CA 2R1 97 ‐240 76 5 77 ‐93 85 ‐120 77 56R0 94 29 65 22 63 ‐7 74 8 70 64
020406080100
Rem
oval (%
)
API
Real wastewater experiment

6 Discussion
41
5.6.3 REAL WASTEWATER EXPERIMENT IN TOTAL Three of the four samples gathered from the real wastewater sample were successfully analysed, indicating that the analysis method chosen can be used for real wastewater. For all of the APIs, apart from sample 2, clofibric acid, PAC has increased the removal efficiency. There is no difference in the removal of oestrone and oestradiol when using PAC, whereas the removal of ethinyl oestradiol is increased when PAC is used.
5.7 APIS AND OESTROGENS IN THE INFLUENT AND EFFLUENT TO KÄLLBY BIOLOGICAL TREATMENT PART
When the samples from experiment 2 were analysed, two samples from the inflow to and outflow from Källby biological part were also analysed in order to gain knowledge of which levels of APIs that can be expected to be found in Källby wastewater treatment plant. The samples were also done in order to find out whether the analysis method used by DTU would be able to detect these lower levels of APIs and oestrogens.
The concentrations of oestrogens and APIs in the influent and effluent from Källby turned out to be too low to detect with the method for analysis used. Compared to previous studies, section 2.3.4, concentrations of the different APIs are most likely present in the intervals 0.16 to 7 μg per litre, i.e. 14 to 630 times lower than the concentrations used in the laboratory experiments.
5.8 IN TOTAL Table 5.16 below summons up the removal efficiencies that were gained in experiment 1 to 3 for the reactor with ordinary biological treatment, R0, and the reactor with addition of PAC, R1. The removal efficiencies have been calculated as averages from the different samples in the experiments with reservation for that the negative results have been left out in the average calculation.

Reduction of Active Pharmaceutical Ingredients in Wastewater
42
TABLE 5.16 Removal, in percentage, for the different APIs and experiments summoned up. In experiment 1 a PAC dosage of 0.01 g PAC per litre wastewater was used and in experiment 2 and 3 0.05 g PAC was used per litre wastewater. (#) – only negative values available thus no average calculated
Substance Removal R1 (%)
Removal R0 (%)
Substance Removal R1 (%)
Removal R0 (%)
Experiment 1 Experiment 3
Ibuprofen 100 100 Ibuprofen 100 100
Diclofenac 76 21 Diclofenac 100 7
Ketoprofen 87 45 Ketoprofen 100 47
Naproxen 92 78 Naproxen 100 59
Clofibric acid 48 # Clofibric acid 81 #
Oestradiol 100 100 Oestradiol 100 100
Ethinyl oestradiol 99 73 Ethinyl oestradiol 100 75
Experiment 2 Average (for experiment 2 and 3)
Ibuprofen 100 100 Ibuprofen 100 100
Diclofenac 66 34 Diclofenac 83 21
Ketoprofen 70 55 Ketoprofen 85 51
Naproxen 83 70 Naproxen 92 65
Clofibric acid 44 43 Clofibric acid 63 43
Oestradiol 100 100 Oestradiol 100 100
Ethinyl oestradiol 98 78 Ethinyl oestradiol 99 75
The average removal efficiencies of the different APIs and oestrogens when 0.05 g PAC is added per litre wastewater are as follows; ibuprofen 100 percent (compared to 100 percent when no PAC is added), diclofenac 83 percent (21 percent), ketoprofen 85 percent (51 percent), naproxen 92 percent (65 percent), clofibric acid 63 percent (43 percent), oestradiol 100 percent (100 percent) and ethinyl oestradiol 99 percent (75 percent).
For all substances included in this study, apart from ibuprofen and oestradiol, PAC has thus improved the removal efficiency when added to the biological treatment process. No knowledge has been gained of the removal of carbamazepine and oestrone, apart from for oestrone in the real wastewater experiment, due to incapacity to analyse those substances.
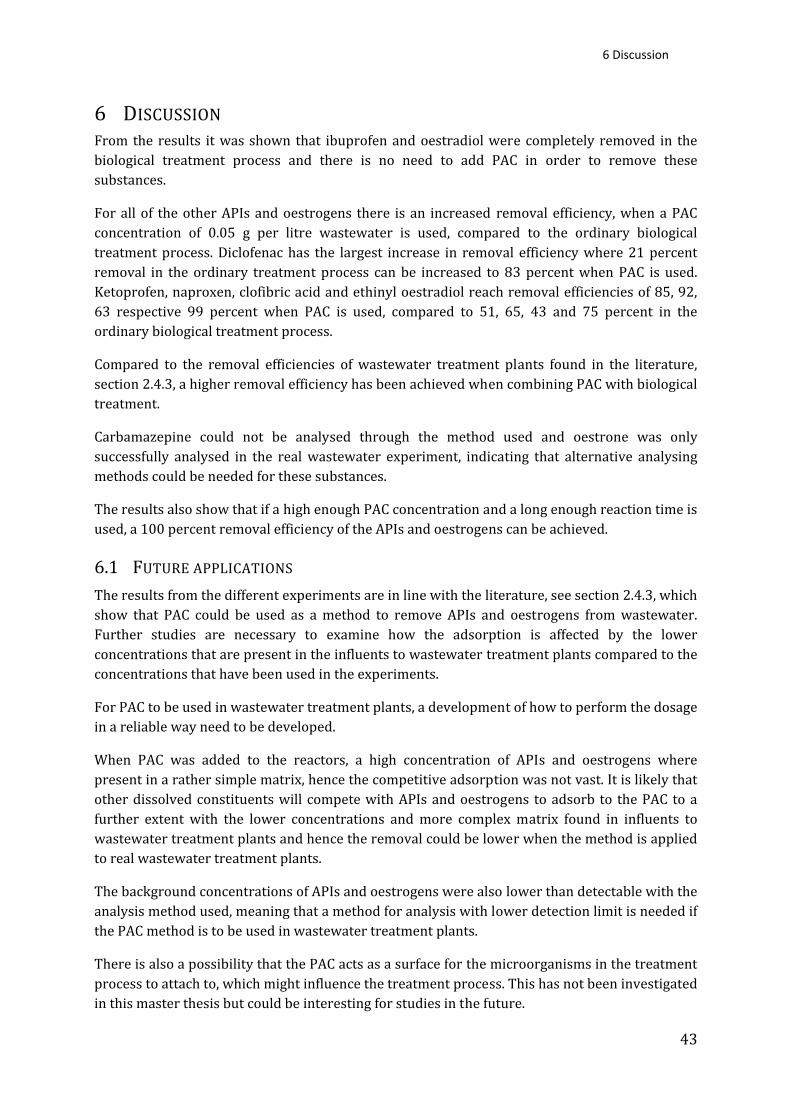
6 Discussion
43
6 DISCUSSION From the results it was shown that ibuprofen and oestradiol were completely removed in the biological treatment process and there is no need to add PAC in order to remove these substances.
For all of the other APIs and oestrogens there is an increased removal efficiency, when a PAC concentration of 0.05 g per litre wastewater is used, compared to the ordinary biological treatment process. Diclofenac has the largest increase in removal efficiency where 21 percent removal in the ordinary treatment process can be increased to 83 percent when PAC is used. Ketoprofen, naproxen, clofibric acid and ethinyl oestradiol reach removal efficiencies of 85, 92, 63 respective 99 percent when PAC is used, compared to 51, 65, 43 and 75 percent in the ordinary biological treatment process.
Compared to the removal efficiencies of wastewater treatment plants found in the literature, section 2.4.3, a higher removal efficiency has been achieved when combining PAC with biological treatment.
Carbamazepine could not be analysed through the method used and oestrone was only successfully analysed in the real wastewater experiment, indicating that alternative analysing methods could be needed for these substances.
The results also show that if a high enough PAC concentration and a long enough reaction time is used, a 100 percent removal efficiency of the APIs and oestrogens can be achieved.
6.1 FUTURE APPLICATIONS The results from the different experiments are in line with the literature, see section 2.4.3, which show that PAC could be used as a method to remove APIs and oestrogens from wastewater. Further studies are necessary to examine how the adsorption is affected by the lower concentrations that are present in the influents to wastewater treatment plants compared to the concentrations that have been used in the experiments.
For PAC to be used in wastewater treatment plants, a development of how to perform the dosage in a reliable way need to be developed.
When PAC was added to the reactors, a high concentration of APIs and oestrogens where present in a rather simple matrix, hence the competitive adsorption was not vast. It is likely that other dissolved constituents will compete with APIs and oestrogens to adsorb to the PAC to a further extent with the lower concentrations and more complex matrix found in influents to wastewater treatment plants and hence the removal could be lower when the method is applied to real wastewater treatment plants.
The background concentrations of APIs and oestrogens were also lower than detectable with the analysis method used, meaning that a method for analysis with lower detection limit is needed if the PAC method is to be used in wastewater treatment plants.
There is also a possibility that the PAC acts as a surface for the microorganisms in the treatment process to attach to, which might influence the treatment process. This has not been investigated in this master thesis but could be interesting for studies in the future.
Reduction of Active Pharmaceutical Ingredients in Wastewater
44
6.1.1 COST OF PAC In order for PAC to be realistically considered as a method to be applied in wastewater treatment plants to reduce APIs and oestrogens, it needs to be cost‐effective. Economically it is realistic with a PAC dosage of 0.01 g PAC per litre wastewater but a concentration of up to 0.02 g PAC per litre wastewater could be feasible (Nowotny, Epp, Sonntag, & Fahlenkamp, 2007). PAC to be used in wastewater treatment plants can be ordered at the cost of 20 SEK (2.2 EUR5) per kg, where transport ‐ half the price, is included (Edalat, 2008). This corresponds with the cost of 9.3 to 14 SEK (1 to 1.50 EUR) per kg activated carbon used for drinking water (Joss, Carballa, Kreuzinger, Siegrist, & Zabczynski, 2006).
The concentration of 0.05 g PAC per litre artificial wastewater that has been used in experiment 2 and 3 and as well in the real wastewater experiment would mean an additional cost of 1 SEK (0.11 EUR) per m3 treated wastewater. Compared to the average cost for wastewater treatment of 1.9 to 9.3 SEK (0.2 to 1 EUR) per m3, using PAC, at a concentration of 0.05 g PAC per litre wastewater would mean a cost of 2.9 to 10 SEK (0.3 to 1.1 EUR) per m3 instead (Joss, Carballa, Kreuzinger, Siegrist, & Zabczynski, 2006).
Today the fee that households pay for wastewater treatment in Källby wastewater treatment plant, including pumps and distribution network, is approximately 6.50 SEK (0.70 EUR) per m3 (M. Petersson, Källby wastewater treatment plant, personal communication, May 7, 2008). This cost would increase to 7.50 SEK per m3 if a concentration of 0.05 g PAC where to be added to the biological wastewater treatment process.
The method of using PAC should be further developed in order to diminish the costs associated with using the method. Based on the cost for the PAC itself the method could be used in wastewater treatment plants today, however, costs for solutions of how the PAC should be dosed in the wastewater treatment plants have not been included.
However it is not expected that the same high concentration will be needed in the wastewater treatment plants since the concentration of APIs and oestrogens in the laboratory experiments have been very high in order for the analysis to be possible. The API concentration in the laboratory experiments have been 100 μg per litre wastewater which is 14 to 630 times higher than concentrations found in the influent to Swedish wastewater treatment plants, see Table 2.2.
There is a risk that when PAC is added to real wastewater, the removal efficiencies will diminish due to competitive adsorption from other dissolved constituents. The COD used in the laboratory experiments was the same as in the influent to Källby, however the matrix of substances dissolved in the real wastewater is expected to be more complex and therefore it is possible that PAC at the dosages used in the experiments could be less efficient at removing APIs and oestrogens when added to real wastewater.
In comparison to the feasible amount of 0.02 g PAC per litre wastewater, according to Nowotny et. al. (2007) the method of using PAC could be economically justifiable at a PAC concentration 2.5 times lower than what have been used in the experiments. Considering that the concentrations used in the experiments have been much higher than the measured concentrations in influent, it should be reasonable from an economic point of view to use PAC as a method to remove APIs and oestrogens.
5 1 EUR = 9.28 SEK (Finansportalen, 2008)

6 Discussion
45
6.1.2 THE TIME ASPECT Since the continuous experiments were performed no longer than one week no knowledge has been gained of how the PAC behaves in the long term. There could be a risk of APIs will starting to leach from the PAC since the method with using PAC does not provide a decomposition of the APIs. This is an important aspect to be further investigated.
6.2 SOURCE OF ERRORS The experiments have all been scaled to correspond to Källby wastewater treatment. If the process would be altered to correspond to another type of wastewater treatment plant there could be an alteration in the expected removal of APIs and oestrogens. Källby wastewater treatment is situated in the south of Sweden where the climate is rather mild, which makes biological treatment more efficient compared to the north of Sweden where the average temperature is lower.
A source of error, especially for experiment 1 and 2 is that the PAC dosage was not completely reliable. In order to avoid this it is important to develop the method for the dosage further.
When the samples were filtered through glass filters in order to remove possible PAC residues that could disturb the following analysis, there was a concern that some of the APIs and oestrogens might get caught in the filter. Therefore two controls with the same concentration were made, where one sample was filtered and the other one not. The results from these controls showed no difference between the two controls and it was thus presumed that there was no loss of APIs and oestrogens in the glass filters.
Throughout the experiments there have been results deviating to a large extent from the expected concentrations to be found. This is especially so for carbamazepine, which turned out to not be analysable with the method used.
Several samples have in the results showed a negative reduction, indicating production of APIs, which is not considered possible. Improvements in the laboratory set up, running and analysis is needed in order to gain more consistent results. A critical point is to take care when the standard curve is prepared, especially since the volumes of APIs and oestrogens used for the IS are small. A more extensive control of exact concentrations of APIs and oestrogens in the influent from the artificial wastewater as well as control over variations in the cartridges used could reduce the negative deviations in the results.
6.3 APIS AND OESTROGENS IN SLUDGE INSTEAD The aim has been to remove APIs and oestrogens from the wastewater which has been proven possible by using PAC. However, these substances will, instead of being dissolved in the effluent, be present in the sludge. It is important to further study how these substances leach from the sludge from the PAC, especially as some sludge is intended to be used as fertiliser on cropland. However in the choice between having dissolved APIs and oestrogens released with effluent water and to have the APIs and oestrogens adsorbed in the PAC, the binding of the substances in the sludge will most likely have a less environmental effect, depending on how the sludge is treated after the wastewater plant.

Reduction of Active Pharmaceutical Ingredients in Wastewater
46
6.4 OTHER METHODS Other methods, instead of PAC, that could be used in wastewater treatment plants in order to reduce APIs and oestrogens are e.g. to use ozone (O3) or biofilm systems. These do provide a degradation of the pharmaceuticals that PAC does not, but when the substances are oxidised by ozone or biofilms there is also a risk of that the metabolite is just as environmentally dangerous as the substance is from start (Joss, Carballa, Kreuzinger, Siegrist, & Zabczynski, 2006). Compared to this PAC removes the APIs and oestrogens without risking to produce toxic metabolites. Also, compared to the methods of using O3 and biofilm systems to reduce APIs and oestrogens, PAC could offer a solution to remove pharmaceuticals without too extensive reconstructions since PAC could be added to one of the last biological treatment basins. The PAC with the APIs and oestrogens is presumed to behave as the sludge and will therefore become separated together with the sludge.

7 Conclusion
47
7 CONCLUSIONS The results show that PAC can be used as a method in wastewater treatment plants, with similar conditions to Källby wastewater treatment plant, to increase the removal of APIs and oestrogens. When PAC is added to the treatment process with activated sludge, a higher removal of APIs and oestrogens is reached compared to an ordinary biological wastewater treatment process with activated sludge and no PAC addition for all substances apart from ibuprofen and oestradiol, which both are removed completely in the ordinary biological wastewater treatment process without PAC.
Depending on the amount of PAC added and the reaction time, up to 100 percent of the APIs and oestrogens can be removed from the wastewater. With a PAC concentration of 0.05 g PAC per litre artificial wastewater, a removal efficiency of 63 to 99 percent, depending on API and oestrogen, was found. To use this concentration of PAC would mean an increase in wastewater treatment costs with 1 SEK (0.11 EUR6) per m3 treated wastewater.
The removal of APIs and oestrogens by PAC is rapid in the absence of competitive adsorption, and after five minutes 92 to 99 percent of the APIs and oestrogens were removed. PAC can therefore be added in the end of the biological wastewater treatment part, when the ordinary biological wastewater treatment process has reduced the APIs and oestrogens as well as other dissolved constituents to as far extent as possible, in order to minimise the amount of PAC needed.
6 1 EUR = 9.28 SEK (Finansportalen, 2008)

Reduction of Active Pharmaceutical Ingredients in Wastewater
48

8 References
49
8 REFERENCES Alder, A. C., Bruchet, A., Carballa, M., Clara, M., Joss, A., Löffler, D., et al. (2006). Consumption and Occurence. In T. A. Ternes, & A. Joss, Human Pharmaceuticals, Hormones and Fragences. The challenge of micropollutants in urban water management. (pp. 15‐54). London: IWA Publishing.
Apoteket. (2008). Läkemedelsutvecklingen 2007. Stockholm: Apoteket AB.
Bendz, D., Paxéus, N. A., Ginn, T. R., & Loge, F. J. (2005). Occurrence and fate of pharmaceutically active compounds in the environment, a case study: Höje River in Sweden. Journal of Hazardous Materials , 122 (3), pp. 195‐204.
Besse, J.‐P., & Garric, J. (2008). Human pharmaceuticals in surface waters Implementation of a prioritization methodology and application to the French situation. Toxicology Letters , 176, pp. 104‐123.
Chang, S., Waite, T. D., Ong, P. E., Schäfer, A. I., & Fane, A. G. (2004, July). Assessment of Trace Estrogenic Contaminants Removal by Coagulant Addition, Powdered Activated Carbon Adsorption and Powdered Activated Carbon/Microfiltration Processes. Journal of Environmental Engineering , pp. 736‐742.
Edalat, F. (2007). Activated Carbon and Its Role in Wastewater Treatment. Lund: Water and Environmental Engineering, Department of Chemical Engineering, LTH, Lund University.
Edalat, F. (2008). Activated Carbon Application in Leachate Treatment. Lund: Water and Environmental Engineering, Department of Chemical Engineering, LTH, Lund University.
Elvers, K., & Wright, S. (1995). Antibacterial activity of the anti‐inflammatory compound ibuprofen. Letters in Applied Microbiology , pp. 82‐84.
FASS. (2008). Retrieved March 4, 2008, from www.fass.se. Search: ibuprofen, diklofenac, ketoprofen, naproxen, karbamazepin, estradiol & etinylestradiol.
Finansportalen. (2008). Retrieved May 12, 2008, from http://www.finansportalen.se/valutakurser.htm
Halling‐Sørensen, B., Nielsen, S. N., Lanzky, P., Ingerslev, F., Lützhøft, H. H., & Jørgensen, S. (1998). Occurence, Fate and Effects of Pharmaceutical Substances in the Environment ‐ A Review. Chemosphere , 36 (2), pp. 357‐393.
Hansen, K. M. (2007). Photochemical Methods for Degradation of Estrogens and Pharmaceuticals. Copenhagen, Denmark: Institute of Environment & Resources, Technical University.
Hansen, K. M. (2007). Photochemical Methods for Degradation of Estrogens and Pharmaceuticals. Köpenhamn, Denmark: Institute of Environment & Resources, Technical University.
Henning, K. ‐D., & Degel, J. (n.d.). Retrieved May 12, 2008, from CPL Carbon Link: http://www.activated‐carbon.com/solrec2.html
Joss, A., Carballa, M., Kreuzinger, N., Siegrist, H., & Zabczynski, S. (2006). Wastewater Treatment. In T. A. Ternes, & A. Joss, Human Pharmaceuticals, Hormones and Fragances. The challenge of micropollutants in urban water management (pp. 243‐292). Padstow: IWA Publishing.
Karolinska Institutet. (2007). Retrieved March 12, 2008, from http://mesh.kib.ki.se/swemesh/swemesh. cfm. Search: clofibric acid.
Kemira Kemwater. (2003). About water treatment. Helsingborg: Kemira Kemwater.

Reduction of Active Pharmaceutical Ingredients in Wastewater
50
Larsson, D., Adolfsson‐Erici, M., J., P., Pettersson, M., Berg, A., Olsson, P.‐E., et al. (1999). Ethinyloestradiol — an undesired fish contraceptive? Aquatic Toxicology 45 , pp. 91‐97.
Lee, W. Y., & Arnold, C. R. (1983). Chronic Toxicity of Ocean‐dumped Pharmaceutical Wastes to the Marine Amphipod Amphithoe valida. Marine Pollution Bulletin , 14 (4), pp. 150‐153.
Lishman, L., Smyth, S. A., Sarafin, K., Kleywegt, S., Toito, J., Peart, T., et al. (2006, August 31). Occurence and reductions of pharmaceuticals and personal care products and estrogens by municipal wastewater treatment plants in Ontario, Canada. Science of the Total Environment , 367 (2‐3), pp. 544‐558.
Läkemedelsverket. (2008). Retrieved March 12, 2008, from http://www.lakemedelsverket.se/ Tpl/StartPage____3.aspx. Search: ibuprofen & diklofenac.
Mistra. (2007). MistraPharma Identification and Reduction of Environmental Risks Caused by the Use of Human Pharmaceuticals. An application for a Mistra Programme. Stockholm: Mistra.
Nakada, N., Tanishima, T., Shinohara, H., Kiri, K., & Takada, H. (2006). Pharmaceutical chemicals and endocrine disrupters in municipal wastewater in Tokyo and their removal during activated sludge treatment. Water Research , 40 (17), pp. 3297‐3303.
Nationalencyklopedin. (2008). Retrieved March 27, 2008, from www.ne.se Search: östrogener.
Nowotny, N., Epp, B., Sonntag, C. v., & Fahlenkamp, H. (2007). Quantification and Modeling of the elimination Behavior of Ecologically Problematic Wastewater Micropollutants by Adsorption on Powdered and Granulated Activated Carbon. Environmental Science & Technology , 41 (6), pp. 2050‐2055.
Nyholm, N., Berg, U. T., & Ingerslev, F. (1996). Activated Sludge Biodegradability Simulation Test. Copenhagen: Ministry of Environment and Energy.
Oregon State University. (2008). Retrieved April 14, 2008, from http://www.unsolvedmysteries. oregonstate.edu/GCMS_05.shtml
Sanyal, A., Roy, D., Chowdhury, B., & Banerjee, A. (1993). Ibuprofen, a unique anti‐inflammatory compound with antifungal activity against dermatophytes. Letters in Applied Microhioloy , pp. 109‐111.
Sigma‐Aldrich. (2008). Retrieved April 14, 2008, from http://www.sigmaaldrich.com/Area_of_Interest/ Analytical__Chromatography/Sample_Preparation/SPE/SPE_Overview.html
Sjukvårdsrådgivningen. (2008). Retrieved March 12, 2008, from www.sjukvardsradgivningen.se. Search: ibuprofen, ketoprofen, naproxen & karbamazepin.
Snyder, S. A., Adham, S., Redding, A. M., Cannon, F. S., DeCarolis, J., Oppenheimer, J., et al. (2007). Role of membranes and activated carbon in the removal of endocrine disruptors and pharmaceuticals. Desalination , 202, pp. 156‐181.
Svenskt Vatten. (2005). Fakta om vatten och avlopp. Stockholm: Svenskt Vatten.
Tekniska förvaltningen. (2005). Miljörapport 2004 Källby avloppsreningsverk. Lund: Tekniska förvaltningen.
Tekniska Förvaltningen, VA‐verket. (2004). Källby avloppsreningsverk. Lund: Tekniska Förvaltningen, VA‐verket.
Ternes, T. A., & Joss, A. (2006). Human Pharmaceuticals, Hormones and Fragrances. The challenge of micropollutants in urban water management. London: IWA Publishing.

8 References
51
University of Hertfordshire & FOOTPRINT. (2008). Retrieved March 26, 2008, from http://sitem.herts.ac. uk/aeru/footprint/de/Reports/430.htm
Westerhoff, P., Yoon, Y., Snyder, S., & Wert, E. (2005). Fate of Endocrine‐Disruptor, Pharmaceutical, and Personal Care Product Chemicals during Simulated Drinking Water Treatment Processes. Environmental Science & Technology , 39 (17), pp. 6649‐6693.
Westerlund, E. (2007). Screening av läkemedel i Skåne. Utvärdering av provtagning i reningsverk och deponier 2005. Malmö: Länsstyrelsen i Skåne Län.
Wikipedia. (2008). Retrieved March 12, 2008, from http://en.wikipedia.org/wiki/Main_Page. Search: clofibric acid & estrone.

Reduction of Active Pharmaceutical Ingredients in Wastewater
52
9 APPENDICES
A. PARAMETERS FOR THE EXPERIMENTS The following parameters were measured daily in both reactors and are accounted for in Table 9.1, R1 and Table 9.2, RO below.
TABLE 9.1 Parameters measured during the experiments in R1 with PAC addition.
R1, with PAC addition
Date NH4N (mg/L)
NO3N (mg/L)
CODF (mg/L)
COD (mg/L)
O2 (mg/L)
pH Cond. μS/cm
Alk. mmol HCO3/L
Temp. °C
Susp. SS VSS
g/L Experiment 1 08‐03‐06 < 2 8.3 < 30 7.8 1.5 3.7 2.9 08‐03‐07 < 2 9.9 30 34 6.9 7.6 405 1.9 20 2.5 2.0 08‐03‐08 Weekend, no measurements 08‐03‐09 Weekend, no measurements 08‐03‐10 < 2 14 < 30 31 6.7 7.7 570 2.0 20 2.2 1.8 08‐03‐11 < 2 12 < 30 26 6.4 7.6 600 1.7 20 2.1 1.7 08‐03‐12 < 2 11 2.5 2.0
Experiment 2 08‐03‐27 < 2 9.8 < 30 < 30 7.1 7.5 600 1.2 20 2.1 1.6 08‐03‐28 < 2 13 < 30 < 30 7.2 7.5 530 1.1 20 2.1 1.6 08‐03‐29 < 2 14 < 30 < 30 8.2 7.3 530 1.0 20 08‐03‐30 < 2 11 < 30 32 7.1 530 1.3 20 08‐03‐31 < 2 9.5 < 30 33 7.8 7.4 540 1.7 20 1.8 1.4 08‐04‐01 < 2 9.3 < 30 26 8.5 7.5 500 1.2 20 1.9 1.5 08‐04‐02 < 2 9.7 < 30 18 8.3 7.5 620 1.2 20 2.2 1.8
Experiment 3 08‐04‐17 < 2 5.9 56 68 3.9 450 20 08‐04‐18 < 2 11 44 46 7.7 810 1.5 20 2.7 2.0 08‐04‐19 Weekend, no measurements 08‐04‐20 Weekend, no measurements 08‐04‐21 < 2 10 < 30 < 30 5.4 7.2 460 1.5 20 1.9 08‐04‐22 < 2 9.4 < 30 20 7.3 7.4 490 1.8 20 1.8 08‐04‐23 < 2 9.5 40 48 7.9 7.4 460 1.8 20 1.8

9 Appendices
53
TABLE 9.2 Parameters measured during the experiments in R0, control reactor.
R0, control reactor
Date NH4N (mg/L)
NO3N (mg/L)
CODF (mg/L)
COD (mg/L)
O2 (mg/L)
pH Cond. μS/cm
Alk. mmol HCO3/L
Temp. °C
Susp. SS VSS
g/L Experiment 1 08‐03‐06 < 2 8.0 < 30 < 30 1.6 2.7 08‐03‐07 < 2 10 31 41 6.6 7.6 400 1.5 20 2.8 08‐03‐08 Weekend, no measurements 08‐03‐09 Weekend, no measurements 08‐03‐10 < 2 11 < 30 32 6.4 7.6 550 20 3.0 08‐03‐11 < 2 12 < 30 31 6.3 7.5 590 1.5 20 2.2 08‐03‐12 < 2 14 < 30 1.4 2.5
Experiment 2 08‐03‐27 < 2 9.5 < 30 < 30 7.4 7.5 590 1.1 20 2.4 1.8 08‐03‐28 < 2 11 < 30 < 30 7.3 7.6 510 1.3 20 2.3 1.7 08‐03‐29 < 2 11 < 30 < 30 7.6 7.3 530 1.0 20 08‐03‐30 < 2 10 < 30 34 7.1 520 1.1 20 08‐03‐31 < 2 10 < 30 < 30 7.7 7.4 540 1.5 20 2.2 1.7 08‐04‐01 < 2 10 < 30 < 30 8.4 7.4 500 1.0 20 2.2 1.7 08‐04‐02 < 2 10 < 30 < 30 8.1 7.4 630 1.0 20 2.2 1.7
Experiment 3 08‐04‐17 < 2 7.0 48 61 5.2 470 20 08‐04‐18 < 2 12 46 48 7.4 860 1.8 20 2.9 1.9 08‐04‐19 Weekend, no measurements 08‐04‐20 Weekend, no measurements 08‐04‐21 < 2 11 < 30 < 30 5.7 7.3 480 1.4 20 2.8 2.2 08‐04‐22 < 2 10 < 30 < 30 6.7 7.3 510 1.8 20 2.3 1.8 08‐04‐23 < 2 11 < 30 < 30 7.8 7.4 450 1.6 20 2.3 1.9 Measurements of the artificial wastewater were also taken, Table 9.3, in order to control that the COD concentration was in the interval of 380 to 480 mg/L.
TABLE 9.3 Measurements of COD concentration in the artificial wastewater.
Date COD (mg/L)
Date COD (mg/L)
Experiment 1 Experiment 3 2008‐03‐06 380 2008‐04‐17 460 Experiment 2 2008‐03‐27 220 2008‐03‐28 310 2008‐03‐30 410

Reduction of Active Pharmaceutical Ingredients in Wastewater
54
B. BUFFERS USED IN THE EXPERIMENTS Buffer solution for preservation This buffer solution, see Table 9.4, was prepared by DTU and added to the effluent samples before they were stored in a fridge (6°C).
TABLE 9.4 Chemicals used for the buffer used to preserve the effluent samples.
Chemical Concentration (stock) Concentration (sample)
NaH2PO4·H2O 3.625 M 0.04531 M
H3PO4 1.75 M 0.02188 M
pH 2.2 2.6 – 3.1
A stock solution is prepared weighting 600 g NaH2PO4·H2O which is added to 161 ml 85 % H3PO4 and filled to 1000 ml with demineralised water. (Equivalent amount of KH2PO4·H2O cannot be used since is less water soluble).
To each litre of sample, 10 mL is added of the buffer stock solution. The pH of the first sample should be checked, since the strength of the phosphoric acid varies. The buffer was developed for the case of 24h‐flow proportional sampling. In this case the buffer is added to the collection bottle before the sampler is started.
Buffer to increase alkalinity The artificial wastewater needs to have a high enough alkalinity to compensate for the nitrogen that is being oxidized or compensated with denitrification. To compensate for a possibly low alkalinity, due to excess ammonium, a buffer to increase alkalinity in the artificial wastewater was added. The chemicals used and amount added has been presented in section 4.2.2. The calculations for the amount added are found below.
NH4‐N in the artificial wastewater: 44 · 10 g/L 14.01 g/mol 3.14 mmol/L⁄
2 mol alkalinity = 1 mol NH4‐N
3.14 mmol/L · 2 6.28 mmol/L
Alkalinity in the artificial wastewater: 4.5 mmol HCO3/L
Add (6.28‐ 4.5) mmol/L = 1.78 mmol/L alkalinity
10 mL of the buffer = 7 mmol alkalinity
Add 2.5 mL buffer to 1 L artificial wastewater

9 Appendices
55
C. INCREASE IN COD FROM PAC AND METHANOL In the equations below the added amount of PAC to R1 is recalculated into the corresponding amount methanol (MeOH) and the increase of COD that this addition of methanol would give. All of the calculations have been based on the volume one litre.
Added amount of PAC (carbon) to R1: mC 0.05 g
Recalculated into mole: nCmMC
. g. g mol⁄
4.163 · 10 mol
Corresponded by the same mole MeOH: nMeOH 4.163 · 10 mol
Recalculated into mass: mMeOH nMeOH·MMeOH 4.163 · 10 mol ·32.04 gmol
0.1334 g
Recalculated into volume: VMeOHmMeOH . g
. g cm3⁄0.1686 mL 0.17 mL
The ratio between COD and methanol is: 1.5 g COD/g MeOH
An addition of 0.1334 g MeOH therefore increases COD concentration with:
1.5 · 0.1334 g 0.2001 g 200 mg
An addition of 0.05 g PAC per litre wastewater to R1 is corresponded by an addition of 0.1334 g (0.17 mL) methanol per litre wastewater, resulting in an increase of COD with 200 mg per litre wastewater.

Reduction of Active Pharmaceutical Ingredients in Wastewater
56
D. SCIENTIFIC PAPER
Reduction of active pharmaceutical ingredients and oestrogens in wastewater – using powdered activated carbon
Caroline Säfström
Water and Environmental Engineering, Department of Chemical Engineering,
Lund University May 2008
Abstract
Pharmaceuticals in the effluent from wastewater treatment plants are today released to recipients and thus could constitute a possible threat for the environment. There is no specific treatment process used in wastewater treatment plants in Sweden today in order to remove pharmaceuticals. In this study Powdered Activated Carbon (PAC) has been investigated as a method to increase removal of Active Pharmaceutical Ingredients (APIs) and oestrogens in the biological part of wastewater treatment plants with a similar treatment process as Källby wastewater treatment plant, situated in Lund, in the south of Sweden, with extended nitrogen and phosphorus removal. Depending on the amount of PAC added and the reaction time, up to 100 percent of the APIs and oestrogens could be removed from the wastewater. An addition of 0.05 g PAC per litre artificial wastewater lead to increased removal of diclofenac (83 compared to 21 percent), ketoprofen (85 compared to 51 percent), naproxen (92 compared to 65 percent), clofibric acid (63 compared to 43 percent), and ethinyl oestradiol (99 compared to 75 percent), whereas ibuprofen and oestradiol were completely removed in the ordinary biological treatment process. A batch experiment showed that the reaction between PAC and dissolved APIs and oestrogens is rapid and already after five minutes 92 to 99 percent of the added amount APIs (100 μg per litre) and oestrogens (25 μg per litre) had been removed. To add 0.05 g PAC per litre artificial wastewater would increase wastewater treatment costs of 1 SEK (0.11 EUR1) per m3 treated wastewater, which can be compared to the average cost for treating wastewater of 1.9 to 9.3 SEK (0.2 to 1 EUR) per m3 and also to the fee which households, connected to Källby wastewater treatment plant, pay today of 6.50 SEK (0.70 EUR). Keywords: Pharmaceuticals; Oestrogens; Activated carbon; Ibuprofen; Diclofenac; Ketoprofen; Naproxen; Clofibric acid; Oestradiol; Ethinyl oestradiol; Wastewater treatment
1. Introduction
In 2007 over 32 800 million SEK (3 508 million EUR7) were spent on pharmaceuticals for human use in Sweden (Apoteket, 2008). These pharmaceuticals help maintain human health but also constitute a possible environmental threat when spread in, for example, the aquatic environment. A recognized example of this is that male fish have become feminized
7 1 EUR = 9.28 SEK (Finansportalen, 2008)
when exposed to oestrogens distributed in domestic wastewater (Larsson, et al., 1999). The purpose of this study was to establish whether addition of PAC to the biological wastewater treatment process, at a laboratory scale, increased the removal of APIs and oestrogens compared to ordinary biological treatment with activated sludge. It was investigated which dosage of PAC, based on both effectiveness and cost, that should be used and also studied when in the biological wastewater treatment process

9 Appendices
57
that the PAC should be added. The results of this study are expected to provide information for the Mistra programme, MistraPharma, in their work‐package “Evaluate wastewater treatment technologies”, where different physical, chemical and biological methods will be studied in order to reduce APIs. 2. Materials and methods
The removal potential of PAC was investigated through 2 batch experiment and three one week continuous experiments. Activated sludge from Källby wastewater treatment plant together with artificial wastewater was used in the experiments. It was also tested how PAC removed APIs and oestrogens in real wastewater collected from Källby wastewater treatment plant. All of the experiments performed were scaled to Källby wastewater treatment plant. 2.1 Description of Källby wastewater treatment plant
Källby wastewater treatment plant has 79 000 people connected and 30 000 m3/d of wastewater is processed. The treatment consist of mechanical‐, biological‐, chemical‐ and post‐treatment. The mechanical treatment includes screening where larger objects are removed, sand traps and pre‐sedimentation. In the biological treatment nitrogen, organic substances and phosphorus are separated and in the following chemical treatment ferric chloride is used to enhance the removal of phosphorus. The final post treatment part before the recipient is biological ponds (Tekniska Förvaltningen, VA‐verket, 2004).
2.2 APIs and oestrogens
Five APIs and two oestrogens were used in the experiments, Table 1. The internal standard (IS) used, mecoprop (pKa=3.11 at
25°C), was chosen based on its alikeness in pKa to the APIs and oestrogens. Concentrations of APIs and oestrogens were chosen to fit the analysis method, GC‐MS, used by the Technical University of Denmark (DTU), rather than existing concentrations in wastewater treatment plants. The pharmaceuticals and oestrogens were diluted by DTU in methanol and 0.1 mL of the methanol‐solution added to one litre of artificial wastewater resulted in a concentration of 100 μg of the individual APIs and 25 μg of the individual oestrogens per litre artificial wastewater. Ibuprofen, diclofenac, ketoprofen and naproxen are the active substances in Non Steroidal Anti‐Inflammatory Drugs (NSAIDs), which reduces pain and inflammation, whereas clofibric acid, the active metabolite from lipid regulators, is used as an antilipemic, meaning it helps reducing lipid levels in blood (Sjukvårdsrådgivningen, 2008; FASS, 2008; Karolinska Institutet, 2008; Läkemedelsverket, 2008; Alder et al., 2006). Oestradiol is a natural oestrogen produced by the human body and assist in controlling the menstruation cycle in women. Due to their effect on reproduction in the human body, oestrogens have been developed synthetically and used in contraceptive pills. One of these synthetically manufactured oestrogens is ethinyl oestradiol, used in several contraceptive pills on the Swedish market (FASS, 2008; Nationalencyklopedin, 2008).
2.3 PAC
Since an addition of activated carbon was wanted directly to the wastewaterwater PAC was used, instead of granulated activated carbon, throughout all of the experiments. PAC (Material number MERCK1.02186.0250, Merck KGaA, Darmstadt, Germany) was used in all experiments.

Reductio
58
TABLE 1 AJoss (2006
2.4 Labo
Two in orderconcentfollowinwas alsoorder tois needsubstan In ewastewreactorswith noremovalbiologicreactor laborato
Pumping out so tharemained in each re
Figure 1
n of Active Ph
APIs and oestr6). All of the su
IbuprofeCAS: 15687‐2pKa: 4.5 – 5
NaproxeCAS: 22204‐5
pKa: 4.2
OestradiCAS: 50‐28pKa: 10.71
oratory set u
batch exper to get resutration that ng continuoo done for do gain an unded for PAces presentexperiment ater expes were usedo addition ol efficienccal treatmen
with PAory set up w
4. DECANTATION30 min
at 2 L eactor
1 Set up of the e
harmaceutical
rogens used inubstances used
en 27‐1 5.2
en 53‐1
ol 8‐2 1
up
riments weults to decidshould be
ous experimifferent reacderstandingAC to rea. 1 to 3 ariment, twd, one controof PAC to gcies in thnt process, AC additiowas scaled t
1. ANOXIC PHASE4 h
3. SEDIMENTATION30 min
N
Addition of 1 L synthetic wastewater to each reacor
experiment 1 t
Ingredients i
n the experimed were obtaine
C
C
Eth
ere performde which PAe used in tments. Testiction times,g of what timact with t
and the rewo separaol reactor, Rain results he ordinaand also on, R1. Tto correspon
2. AEROBIC PHASE3 h
to 4.
n Wastewate
ents (FASS, 200ed by DTU from
DiclofenacCAS: 15307‐86‐5
pKa: 4.15
Clofibric acidCAS: 882‐09‐7
pKa: 3.0
hinyl oestradCAS: 57‐63‐6 pKa: 10.4‐10.5
ed AC he ng in me he
eal ate R0, of ary ne he nd
tofolitCObiwfowSeindetw
2.
sofo
Addition of PAC to R1 after 2.5 h
TA
busuC
N
K
r
08; 1Wikipediam Sigma‐Aldric
5
1
diol
o Källby wour hour antre of artificOD concentiological twastewater ollowed by awas added edimentation phase threcantation pwo litres rem
5 Artificial w
For the aolution wasormula in T
ABLE 2 Chemiuffer solutionupplied by MERChemical Am
NaHCO3 67
KH2PO4 4.
a, 2008). CAS, ch.
KeCAS
wastewater noxic phasecial wastewtration as ttreatment treatment a three hour
to R1 on took placree, followephase after mained in ea
wastewater
artificial ws preparedable 3 and
icals dissolvedn to increaseRCK. mount (g/L)
7.2
4
obtained from
etoprofen S: 22071‐15‐4 pKa: 4.5
treatment , during wh
water, with tthe influenpart in was adde
r aerobic phafter 2.5 e during 30 d by a 30 which a voach reactor.
wastewater, d accordingthen correc
d in distilled e alkalinity.
m Ternes &
plant. A hich one the same t to the Källby
ed, was hase. PAC
hours. minutes minutes olume of
a stock g to the cted to a
water for Chemicals

9 Appendices
59
pH in the interval 7.0 to 7.2 by the addition of the buffer solution in Table 4 (Nyholm, Berg, & Ingerslev, 1996). In order to prevent growth in the artificial wastewater, peptone and meat extract was not added until the stock solution was to be used. The stock solution has a COD of 1 090 mg per litre and it was therefore diluted to correspond to the influent to the biological part of Källby wastewater treatment plant. Both stock solution and diluted artificial wastewater, apart from the amount being used, were stored in a fridge (6°C) until used, however no longer than four days, in order to avoid growth in the wastewater. An additional buffer solution was added to the artificial wastewater in order to gain an alkalinity corresponding to the nitrogen added from the artificial wastewater. The two chemicals in Table 2 were dissolved in distilled water in order to prepare the buffer. 2.5 mL of this buffer solution was added per litre artificial wastewater.
2.6 Experiments
The two batch experiments were performed according to Table 5. Experiment 1 to 3 and a real wastewater experiment were also performed, where the effluent was collected in one container for each reactor. An average sample from three cycles, 24 hours, was prepared for analyse by filtration twice through glass filters
(Whatman GF/C, 1.2 μm) in order to remove as much as possible of the PAC that might be present in the effluent, since still present PAC could disrupt the GC‐MS analysis. The samples, each with a volume of 250 mL, were then preserved with a phosphate buffer (Hansen, Photochemical Methods for Degradation of Estrogens and Pharmaceuticals, 2007) and stored in a fridge (6°C) until Solid Phase Extraction (SPE) was performed. The SPE was performed according to Table 6 with Oasis HLB 30 μm extraction cartridges supplied by Waters and an IST Vac Master, supplied by Sorbent.
2.7 Analysis
GC‐MS analyses were performed on a MS, Agilent Technologies Mass selective detector 5973 N, and a GC, Network GC System 6890 N Injector 7683 Series. Details of the method can be found in Photochemical Methods for Degradation of Estrogens and Pharmaceuticals (Hansen, 2007).
3. Results
From the batch experiments it was concluded that the reaction time for PAC short, already after five minutes 92 to 100 percent of the different APIs and oestrogens were removed when a PAC concentration of
TABLE 3 Chemicals used for the artificial wastewater (Nyholm, Berg, & Ingerslev, 1996). Peptone (order number 22089) was supplied by Fluka Sigma‐Aldrich, as was the meat extract (order number 70164). All of the other chemicals were supplied by MERCK.
Chemical Amount (g/L)
Peptone 8
Meat extract 5.5
Urea 1.5
NaCl 0.35
CaCl2 ∙ 2 H2O 0.2
MgSO4 ∙ 7 H2O 0.1
TABEL 4 Formula for the buffer solution used to lower pH in the artificial wastewater. 1NaH2PO4 ∙ H2O was used in the article but due to availability in the laboratory NaH2PO4 ∙ 2 H2O was used instead, after the amount had been adjusted. Chemicals supplied by MERCK. Chemical Amount (g/L)
NaH2PO4 ∙ 2 H2O1 84.21
KH2PO4 27.2
K2HPO4 80.1

Reduction of Active Pharmaceutical Ingredients in Wastewater
60
TABLE 5 Step by step description of the batch experiments. 1. Different PAC concentrations [0.05 0.1 0.2 0.4 0.6 g/L] were added to e‐flasks.
2. Treated wastewater from R1 and R0 was spiked with the API and oestrogen solution to the concentration of 100 μg APIs per litre and 25 μg oestrogens per litre.
3. 500 mL of the treated artificial wastewater was added to each e‐flask containing PAC.
4. The e‐flasks were placed in magnetic stirrers and covered with parafilm to prevent evaporation.
5. After 2 hours (for the e‐flasks with different PAC concentrations) respective [0 15 30 60 120] min (for the e‐flasks testing the time intervals in batch 2), the samples were filtrated.
6. The filtration was done through a first filtration in coarse filters (with a flow of 450 mL/min) so that the PAC would not block the finer glass filters and then a following double filtration in glass filters (Whatman GF/C, 1.2 μm).
7. After filtration the samples were preserved using a buffer prepared by DTU (contents for this buffer solution for preservation can be found in Appendix B).
8. IS was added to the samples just before the Solid Phase Extraction (SPE) was performed and the cartridges were then sent to DTU for analysis in GC‐MS.
0.6 g PAC per litre was used. Results for experiment 1 to 3 are found in Table 7. The experiment with real wastewater showed a higher removal efficiency when PAC was added compared to the ordinary biological treatment process. 4. Discussion
The results show that ibuprofen and oestradiol are completely removed in the biological treatment process and there is no need to add PAC in order to remove these substances. For all of the other APIs and oestrogens there is an increased removal efficiency, when a PAC concentration of 0.05 g per litre wastewater is used, compared to the
ordinary biological treatment process. Diclofenac has the largest increase in removal efficiency where 21 percent removal in the ordinary treatment process can be increased to 83 percent when PAC is used. Ketoprofen, naproxen, clofibric acid and ethinyl oestradiol reach removal efficiencies of 85, 92, 63 respective 99 percent when PAC is used, compared to 51, 65, 43 and 75 percent in the ordinary biological treatment process. The results also show that if a high enough PAC concentration, 0.6 g PAC per litre wastewater, and a long enough reaction time, 120 minutes, is used, a 100 percent removal efficiency of the APIs and oestrogens can be achieved.
TABLE 6 Steps performed in the SPE. Step Description
1. 250 μL of the IS mecoprop was added to each of the preserved 250 mL samples.
2. The cartridges were activated through conditioning with 3 mL ethyl acetate, 3 ml methanol followed by 3 mL acidified water (pH 2.6). The acidified water was prepared by adding the same phosphate buffer that was used for preserving the samples to distilled water until a pH of 2.6 was reached.
3. After the activation the cartridges were filled up with another 3 mL of acidified water in order for the cartridges not to go dry in the time it takes for the sample to reach the cartridge through the hose.
4. A drop speed of approximately one drop per second was used at a vacuum pressure at 0.25 bar. The different flasks gave different flows and the flasks were therefore placed on different highs to compensate for this so that the cartridges would not overflow. When all of the samples had passed through the cartridges, the cartridges were dried with maximum vacuum pressure for one hour or until dry.
5. The dry cartridges were then put in a plastic container and sent to DTU for analysis.

9 Appendices
61
TABLE 7 Removal, in percentage, for the different APIs and experiments. In experiment 1 a PAC dosage of 0.01 g PAC per litre wastewater was used and in experiment 2 and 3 0.05 g PAC was used per litre wastewater. (#) – only negative values available thus no average calculated Substance Removal R1
(%) Removal R0
(%) Substance Removal R1
(%) Removal R0
(%)
Experiment 1 Experiment 3
Ibuprofen 100 100 Ibuprofen 100 100
Diclofenac 76 21 Diclofenac 100 7
Ketoprofen 87 45 Ketoprofen 100 47
Naproxen 92 78 Naproxen 100 59
Clofibric acid 48 # Clofibric acid 81 #
Oestradiol 100 100 Oestradiol 100 100
Ethinyl oestradiol 99 73 Ethinyl oestradiol 100 75
Experiment 2 Average
Ibuprofen 100 100 Ibuprofen 100 100
Diclofenac 66 34 Diclofenac 83 21
Ketoprofen 70 55 Ketoprofen 85 51
Naproxen 83 70 Naproxen 92 65
Clofibric acid 44 43 Clofibric acid 63 43
Oestradiol 100 100 Oestradiol 100 100
Ethinyl oestradiol 98 78 Ethinyl oestradiol 99 75
(2.2 EUR8) per kg, where transport ‐ half the price, is included (Edalat, 2008). This corresponds with the cost of 9.3 to 14 SEK (1 to 1.50 EUR) per kg activated carbon used for drinking water (Joss, Carballa, Kreuzinger, Siegrist, & Zabczynski, 2006). The average total cost for wastewater treatment is 1.9 to 9.3 SEK (0.2 to 1 EUR) per m3 (Joss, Carballa, Kreuzinger, Siegrist, & Zabczynski, 2006). The concentration of 0.05 g PAC per litre artificial wastewater that was used in experiment 2 and 3 and as well in the real wastewater experiment would mean an additional cost of 1 SEK (0.11 EUR) per m3 treated wastewater.
5. Conclusions
From the results it can be concluded that PAC can be used as a method in wastewater treatment plants, with similar conditions to Källby wastewater treatment plant, to
8 1 EUR = 9.28 SEK (Finansportalen, 2008)
increase the removal of APIs and oestrogens. When PAC is added to the treatment process with activated sludge, a higher removal of APIs and oestrogens is reached compared to an ordinary biological wastewater treatment process with activated sludge and no PAC addition for all substances apart from ibuprofen and oestradiol, which both are removed completely in the ordinary biological wastewater treatment process without PAC. Depending on the amount of PAC added and the reaction time, up to 100 percent of the APIs and oestrogens can be removed from the wastewater. With a PAC concentration of 0.05 g PAC per litre artificial wastewater, a removal efficiency of 63 to 99 percent, depending on API and oestrogen, was found. To use this concentration of PAC would mean an increase in wastewater treatment costs with
Reduction of Active Pharmaceutical Ingredients in Wastewater
62
1 SEK (0.11 EUR9) per m3 treated wastewater. The removal of APIs and oestrogens by PAC is rapid and after five minutes 92 to 99 percent of the APIs and oestrogens were removed. PAC can thereflore be added in the end of the biological wastewater treatment part, when the ordinary biological wastewater treatment process has reduced the APIs and oestrogens as well as other dissolved constituents to as far extent as possible, in order to minimise the amount of PAC needed. Acknowledgements
This article is based on a master thesis that has been carried out at Water and Environmental Engineering, Department of Chemical Engineering, LTH, Lund University with professor Jes la Cour Jansen as supervisor, who is gratefully acknowledged along with the examiner, professor Ann‐Sofi Jönsson, the laboratory personnel, Gertrud Persson and Ylva Persson, and Therese Söderberg, also working on her master thesis, with whom all of the laboratory parts have been planned and performed.
References
Alder, A. C., Bruchet, A., Carballa, M., Clara, M., Joss, A., Löffler, D., et al. (2006). Consumption and Occurence. In T. A. Ternes, & A. Joss, Human Pharmaceuticals, Hormones and Fragences. The challenge of micropollutants in urban water management. (pp. 15‐54). London: IWA Publishing.
Apoteket. (2008). Läkemedelsutvecklingen 2007. Stockholm: Apoteket AB.
Edalat, F. (2007). Activated Carbon and Its Role in Wastewater Treatment. Lund: Lund University.
Edalat, F. (2008). Activated Carbon Application in Leachate Treatment. Lund: Water and Environmental Engineering, Department of Chemical Engineering, LTH, Lund University.
FASS. (2008). Retrieved March 4, 2008, from www.fass.se. Search: ibuprofen, diklofenac, ketoprofen, naproxen, karbamazepin, estradiol & etinylestradiol.
9 1 EUR = 9.28 SEK (Finansportalen, 2008)
Finansportalen. (2008). Retrieved May 12, 2008, from http://www.finansportalen.se/valutakurser.htm
Hansen, K. M. (2007). Photochemical Methods for Degradation of Estrogens and Pharmaceuticals. Copenhagen, Denmark: Institute of Environment & Resources, Technical University.
Henning, K. ‐D., & Degel, J. (n.d.). Retrieved May 12, 2008, from CPL Carbon Link: http://www.activated‐carbon.com/solrec2.html
Joss, A., Carballa, M., Kreuzinger, N., Siegrist, H., & Zabczynski, S. (2006). Wastewater Treatment. In T. A. Ternes, & A. Joss, Human Pharmaceuticals, Hormones and Fragances. The challenge of micropollutants in urban water management (pp. 243‐292). Padstow: IWA Publishing.
Karolinska Institutet. (2007). Retrieved March 12, 2008, from http://mesh.kib.ki.se/swemesh/swemesh.cfm. Search: clofibric acid.
Kemira Kemwater. (2003). About water treatment. Helsingborg: Kemira Kemwater.
Larsson, D., Adolfsson‐Erici, M., J., P., Pettersson, M., Berg, A., Olsson, P.‐E., et al. (1999). Ethinyloestradiol — an undesired fish contraceptive? Aquatic Toxicology 45 , pp. 91‐97.
Läkemedelsverket. (2008). Retrieved March 12, 2008, from http://www.lakemedelsverket.se/Tpl/StartPage____3.aspx. Search: ibuprofen & diklofenac.
Mistra. (2007). MistraPharma ‐ Identification and Reduction of Environmental Risks Caused by the Use of Human Pharmaceuticals. An application for a Mistra Programme. Stockholm: Mistra.
Nationalencyklopedin. (2008). Retrieved March 27, 2008, from www.ne.se Search: östrogener.
Nyholm, N., Berg, U. T., & Ingerslev, F. (1996). Activated Sludge Biodegradability Simulation Test. Copenhagen: Ministry of Environment and Energy.
Sjukvårdsrådgivningen. (2008). Retrieved March 12, 2008, from www.sjukvardsradgivningen.se. Search: ibuprofen, ketoprofen, naproxen & karbamazepin.
Tekniska Förvaltningen, VA‐verket. (2004). Källby avloppsreningsverk. Lund: Tekniska Förvaltningen, VA‐verket.
Ternes, T. A., & Joss, A. (2006). Human Pharmaceuticals, Hormones and Fragrances. The challenge of micropollutants in urban water management. London: IWA Publishing
Wikipedia. (2008). Retrieved March 12, 2008, from http://en.wikipedia.org/wiki/Main_Page. Search: clofibric acid & estrone.