Reducing emissions from deforestation and forest ... 12 REDD Aust case study final... · Policy...
29
Policy Brief 1 Reducing emissions from deforestation and forest degradation in developing countries: A cautionary tale from Australia Policy Brief No. 12 April 2010 ISSN 1836-9014 Andrew Macintosh, Associate Director, ANU Centre for Climate Law and Policy
Transcript of Reducing emissions from deforestation and forest ... 12 REDD Aust case study final... · Policy...
Policy Brief
1
Reducing emissions from deforestation and forest degradation in developing countries: A cautionary tale from Australia
Policy Brief No. 12 April 2010 ISSN 1836-9014
Andrew Macintosh, Associate Director, ANU Centre for Climate Law and Policy

A cautionary tale
1
Acknowledgements
Thanks to Dr Phil Gibbons and Dr Richard Denniss for their comments on an earlier draft of this paper. Any errors remain the responsibility of the author.
Abstract
If a binding agreement can be reached on a post-2012 international climate regime, it is likely to include a market-based instrument for reducing emissions from deforestation and forest degradation (REDD) and enhancing forest sinks in developing countries (collectively known as ‘REDD-plus’). Under such a scheme, countries that reduce net REDD emissions below a pre-set baseline would receive credits that could be sold in carbon markets and used by purchasing nations to meet their international mitigation obligations. This paper draws on the Australian experience with deforestation to identify some of the issues that might obstruct progress on REDD. For the past 20 years, Australia has had the highest rate of deforestation in the developed world—370,000 ha of ‘Kyoto forests’ were cleared annually between 1990 and 2007, resulting in the emission of ~80 MtCO2-e/yr. It is also the only developed country that will rely on reduced deforestation emissions as the primary way of meeting its quantified emission reduction target under the Kyoto Protocol. Australia’s approach to deforestation issues, both domestically and internationally, provides valuable insights into the difficulties a REDD-plus scheme might encounter in the future.
1 Introduction
The Copenhagen Climate Conference held in December 2009 was expected to produce a binding legal agreement on a post-2012 international climate regime. This did not occur and the only major output from the conference was a political agreement, the Copenhagen Accord.1 The failure to reach a binding legal outcome was primarily a result of differences between the major emitting countries on mitigation commitments. But while these issues could not be resolved, there were clear signs of progress on an international scheme to reduce greenhouse gas emissions from deforestation and forest degradation (REDD) and enhance forest sinks in developing countries (collectively known as ‘REDD-plus’).2
If an international REDD-plus scheme is introduced, it is likely to include a market-linked component under which countries that reduce net REDD emissions below a pre-set baseline (or reference level) would receive credits that could be sold in carbon markets and used by purchasing nations to meet their international mitigation obligations. As offsets, REDD credits would not normally result in a net reduction in global emissions; they would merely redistribute them. The primary aim of the scheme would be to lower abatement costs and promote sustainable development in developing countries, not unlike the Kyoto Protocol’s Clean Development Mechanism (CDM).
The pros and cons of market-linked REDD schemes have been extensively debated in the literature.3 Supporters have focused on the potential for these schemes to lower abatement
1 UNFCCC Secretariat, Copenhagen Accord. Decision -/CP15, 2009.
http://unfccc.int/files/meetings/cop_15/application/pdf/cop15_cph_auv.pdf. 2 See Copenhagen Accord, paragraphs 6 and 8; FCCC/SBSTA/2009/L.19/Add.1; and
FCCC/AWGLCA/2009/L.7/Add.6. 3 K Karousakis and J Corfee-Morlot, Financing Mechanisms to Reduce Emissions from Deforestation:
Issues in Design and Implementation. Organisation for Economic Cooperation and Development (OECD), Paris, France, 2007; M Skutsch, N Bird, E Trines, M Dutschke, P Frumhoff, B de Jong, P van Laake, O Masera and D Murdiyarso, ‘Clearing the way for reducing emissions from tropical deforestation’. Environmental Science Policy 10: 2007, pp. 322–334; J Eliasch, Climate Change: Financing Global Forests—The Eliasch Review. H M Stationery Office,

2
costs, promote sustainable development, and generate complementary environmental benefits, for example biodiversity conservation, improved air quality, and protection against land degradation. Advocates also contend that only a market-linked scheme would have the capacity to generate sufficient resources to significantly reduce REDD emissions.
The case against market-linked schemes is based primarily on their capacity to undermine the environmental integrity of the international climate regime by generating credits that do not represent real abatement. Concerns have also been raised about the potential for a market-linked scheme to stall abatement in other sectors (often described as ‘market flooding’), cause poverty and dislocation, adversely affect the interests of Indigenous peoples and local communities, and threaten the sovereignty of developing countries.
Several recent studies have stepped beyond the debate about the viability of a market-linked scheme and concentrated instead on the practical obstacles that such a scheme might encounter.4 Following this line of research, this paper draws on the Australian experience with deforestation to identify some of the issues that could hinder progress on an environmentally effective international REDD-plus scheme. The relevance of Australian deforestation is related to two factors. First, for the past 20 years Australia has had the highest rate of deforestation in the developed world;5 370,000 ha of ‘Kyoto forests’6 were cleared annually between 1990 and 2007, resulting in the emission of ~80 MtCO2-e/yr.7 The vast majority of this deforestation was agriculture-related (clearing for grazing and cropping).8 Australia’s efforts to control deforestation provide useful lessons for the design and implementation of a REDD scheme. Secondly, Australia is the only developed country intending to rely on reduced deforestation emissions as the primary way of meeting its quantified emission reduction target under the Kyoto Protocol. Australia’s approach to deforestation issues under the Protocol highlights the types of issues that a REDD-plus scheme might encounter in the future.
London, UK, 2008; D Humphreys, ‘The politics of “Avoided Deforestation”: historical context and contemporary issues’. International Forestry Review 10(3): 2008, pp. 433–442; I Fry, ‘Reducing Emissions from Deforestation and Forest Degradation: Opportunities and Pitfalls in Developing a New Legal Regime’. Review of European Community and International Environmental Law 17(2): 2008, pp. 166–182; T Neeff and F Ascui, ‘Lessons from carbon markets for designing an effective REDD architecture’. Climate Policy 9: 2009, pp. 306–315; M Collett, ‘In the REDD: A Conservative Approach to Reducing Emissions from Deforestation and Forest Degradation’. Carbon and Climate Law Review 3(3): 2009, pp. 324–339; A Angelsen, S Brown, C Loisel, L Peskett, C Streck and D Zarin, Reducing Emissions from Deforestation and Forest Degradation (REDD): An Options Assessment Report. Report for the Government of Norway, Meridian Institute, Washington DC, US, 2009.
4 C Potvin, B Guay and L Pedroni, ‘Is reducing emissions from deforestation financially feasible? A
Panamanian case study’. Climate Policy 8: 2008, pp. 23–40; E Corbera, M Estrada and K Brown, ‘Reducing greenhouse gas emissions from deforestation and forest degradation in developing countries: revisiting the assumptions’. Climatic Change, 2010. Doi: 10.1007/s10584-009-9773-1.
5 UNFCCC Secretariat, ‘GHG data from UNFCCC’, 2010.
http://unfccc.int/ghg_data/ghg_data_unfccc/items/4146.php. Accessed 16 February 2010. 6
Kyoto forests’ refers to areas that meet the definition of a forest for the purposes of the Kyoto Protocol. See FCCC/CP/2001/13/Add.1.
7 Australian Department of Climate Change (ADCC), ‘Australian Greenhouse Emissions Information
System’, 2010. http://www.climatechange.gov.au/climate-change/emissions.aspx. Accessed 12 February 2010. Readers should note that this emission estimate refers to net deforestation—it includes sinks from regrowth on deforested land units.
8 ADCC, ‘Australian Greenhouse Emissions Information System’;
Queensland Department of Environment and Resource Management (QDERM), Land cover change in Queensland 2007–08: a Statewide Landcover and Trees Study (SLATS) Report. Queensland Government, Brisbane, Australia, 2009.

A cautionary tale
3
The paper is set out as follows. Section 2 describes how deforestation is treated under the Kyoto Protocol and explores Australia’s involvement in the negotiation of the relevant provisions of the Protocol. Section 3 outlines a history of deforestation reform in Australia and analyses how effective the reform process has been. Section 4 identifies a number of REDD-related lessons that can be drawn from the Australian experience with deforestation. Section 5 provides a conclusion.
2 Australia, deforestation and the international climate regime
In the dying moments of the Kyoto Protocol negotiations in 1997, the Australian Government threatened not to sign unless amendments were made to the rules regarding land use, land-use change and forestry (LULUCF) to accommodate Australia’s interests.9 Australia’s primary request was for deforestation (or land-use change (LUC)) emissions to be included in its base year (1990) because these emissions had fallen by approximately 50 per cent over the period 1990 to 1997 (Figure 1). Including deforestation emissions in its base year would allow Australia to receive credit for reductions that had already occurred and offset emission increases in other sectors during the first commitment period, 2008 to 2012.
Desperate to reach agreement, the international community acceded to Australia’s demands. The resulting amendment to Article 3.7 of the Kyoto Protocol, known as either Article 3.7(2) or simply the ‘Australia clause’, reads:
Those Parties included in Annex I for whom land-use change and forestry constituted a net source of greenhouse gas emissions in 1990 shall include in their 1990 emissions base year or period the aggregate anthropogenic carbon dioxide equivalent emissions by sources minus removals by sinks in 1990 from land-use change for the purposes of calculating their assigned
amount.10
This clause allows countries with net emissions from LULUCF in 1990 to include deforestation emissions in their base-year emissions estimate. Australia is one of eight developed countries in the Annex I block to satisfy the conditions attaching to this clause.11 Two of these (Denmark and Iceland) had no deforestation emissions in the base year and Russia has chosen not to claim the benefits of Article 3.7(2). Four others, Ireland, the Netherlands, Portugal and the UK, all members of the European Community, have included deforestation emissions in their base year. However, the effect on the mitigation obligations of these countries is negligible as their combined deforestation emissions in 1990 were 1.4 MtCO2-e.12 In contrast, the capacity to include deforestation emissions in its base year will give Australia an ‘offset’ worth approximately 60 to 100 MtCO2-e per annum during the first commitment period.13,
9 C Hamilton and L Vellen, ‘Land-use change in Australia and the Kyoto Protocol’. Environmental Science
& Policy 2: 1999, pp. 145–152; C Hamilton, Running from the Storm: The Development of Climate Change Policy in Australia. UNSW Press, Kensington, Australia, 2001; C Hamilton, Scorcher: The Dirty Politics of Climate Change. Black Inc Agenda, Melbourne, Australia, 2007; G Pearse, High and Dry: John Howard, Climate Change and the Selling of Australia’s Future. Penguin Books Australia, Camberwell, Australia, 2007.
10 UNFCCC, The Kyoto Protocol, UN, 1998, Article 3.7.
<http://unfccc.int/essential_background/kyoto_protocol/background/items/1351.php> 11
UNFCCC Secretariat, ‘Initial reports under Article 7, paragraph 4, of the Kyoto Protocol and initial review reports’, 2008. http://unfccc.int/national_reports/initial_reports_under_the_kyoto_protocol/items/3765.php. Accessed 16 February 2010.
12 UNFCCC Secretariat, ‘Initial reports under Article 7, paragraph 4’.
13 Australian Department of Climate Change (ADCC), Tracking to Kyoto and 2020: Australia’s Greenhouse
Emissions Trends 1990 to 2008–12 and 2020. Commonwealth of Australia, Canberra, 2009; ADCC, ’Australian Greenhouse Emissions Information System’.

4
The application of Article 3.7(2) to Australia is analogous to the way avoided deforestation credits would operate under a market-linked REDD scheme. The 132 MtCO2-e of deforestation emissions included in Australia’s 1990 base-year emissions is comparable to an avoided deforestation baseline. During the first commitment period, Australia has effectively been provided with offset14 credits equal to this baseline minus its actual net deforestation emissions (Figure 1). It can use these deforestation credits to offset emissions from other sectors, which is what will happen.
Figure 1: Australia’s deforestation emissions (actual and projected), 1990 to 2012, and the application of Article 3.7(2)
0
20
40
60
80
100
120
140
1990 1992 1994 1996 1998 2000 2002 2004 2006 2008 2010 2012
MtCO2-e
Actual LUC emissions Projected LUC emissions LUC offset LUC baseline
Source: ADCC15
When deforestation is excluded, Australia’s net emissions rose by 26 per cent between 1990 and 2007, well in excess of the eight per cent target set under the Kyoto Protocol. If the accounting practices that apply to most other Annex I countries are used, whereby deforestation emissions are excluded from the base year but include in subsequent years, Australia’s net emissions rose by 44 per cent over this period. Article 3.7(2) is Australia’s saving grace. When deforestation emissions are included in Australia’s base year, net emissions rose by only nine per cent over this period, putting Australia within striking distance
14
This offset may prove to be even larger due to efforts by the Australian Government to promote reforestation and regrowth on land units that were cleared over the period 1990–2008. See Australian Government, Details of Proposed CPRS Changes, Australian Department of Climate Change, 2009. http://www.climatechange.gov.au/~/media/publications/cprs/CPRS_ESAS/091124oppnofferpdf.ashx. Accessed 16 February 2010.
15 ADCC, Tracking to Kyoto and 2020;
ADCC, ‘Australian Greenhouse Emissions Information System’.

A cautionary tale
5
of its target (Figure 2).16 In the absence of Article 3.7(2), Australia would have to import a substantial number of overseas credits to meet its Kyoto obligations.
Figure 2: Percentage change in Australian emissions: total net emissions, total (excluding LUC) and LUC, 1990 to 2007
-50
-40
-30
-20
-10
0
10
20
30
Aust total Total (ex LUC) LUC
% change from 1990 to 2007
Source: ADCC17
The Australia clause could be defended on the grounds that, unlike other developed countries at the time of the Kyoto negotiations, a significant proportion of the potentially productive agricultural lands in Australia were still undeveloped. Accordingly, it is only fair that the Protocol should take into account Australia’s unique position and provide an incentive for it to avoid deforestation. If this line of reasoning is followed, the deforestation emission estimate that was included in the base year should have constituted a rough projection of likely deforestation emissions over the first commitment period under business-as-usual (BAU) conditions—otherwise it would result in the generation of ‘hot air’ credits (credits that do not represent actual abatement).
While this argument is not completely devoid of merit, it does not represent the content of the Australia clause nor the basis on which it was negotiated. Most analysts recognise that the clause is nothing more than a loophole designed to lower Australia’s emissions target in a way that lacks transparency.18 This is evident from the fact that the Australian Government was aware that Australia’s deforestation emissions in 1990 were historically high and that they had fallen sharply since then. If the government had been genuine about being given credit for policy-induced reductions in deforestation emissions, it would have made some effort to ensure that the emissions that were included in the base year bore some resemblance to a BAU estimate. On the contrary, the Australian Government knew that deforestation emissions
16
ADCC, ‘Australian Greenhouse Emissions Information System’. 17
ADCC, ‘Australian Greenhouse Emissions Information System’. 18
Hamilton and Vellen, ‘Land-use change in Australia and the Kyoto Protocol’; Hamilton, Scorcher; Pearse, High and dry.

6
in 1990 did not provide a sound basis for a BAU projection yet it insisted on their inclusion in Australia’s base-year estimate as a condition for signing the Kyoto Protocol.19
3 Deforestation reform in Australia
3.1 A short history of deforestation control
Australia is a federation comprised of six states, two self-governing mainland territories, and a collection of external territories. Traditionally, environmental and land-use matters have been the domain of the states and self-governing territories. For much of the 20th century, these jurisdictions had contradictory policies on deforestation (or land clearing as it is known in Australia), with measures to conserve native vegetation existing alongside regulatory and policy programs that promoted deforestation.20 Reform of these structures began in the 1980s. In the mid-80s, significant changes were made to the land-clearing regulations in South Australia and Western Australia. The Australian Government also launched a number of information and voluntary ‘beneficiary pays’ measures (where the government pays landholders to alter their practices), including the National Tree Program in 1982 and the One Billion Trees and Save the Bush programs in 1989.
While an important first step, the reforms of the 1980s did little to curb the rates of deforestation. Land-clearing laws remained lax in most jurisdictions, particularly in the states facing the greatest deforestation pressures, Queensland and New South Wales.21 Similarly, the non-regulatory programs may have generated localised benefits but they were not on a scale that was capable of driving significant changes in nationwide land-use practices.22
19
Arguably, singling out Australia and the Australia clause for criticism on these grounds is unjust. A number of other developed countries have used the LULUCF sector (Article 3.4) to water down their Kyoto targets. See N Höhne, S Wartmann, A Herold and A Freibauer, ‘The rules for land use, land use change and forestry under the Kyoto Protocol–lessons learned for the future climate negotiations’. Environmental Science & Policy 10: 2007, pp. 353–369. Further, countries like Russia and the Ukraine were given overly generous targets that ensured they would have surplus credits under the international regime. The available data suggest that there will be approximately 10 to 13 GtCO2-e worth of surplus Assigned Amount Units in the first commitment period, the majority of which are likely to emanate from Russia and Ukraine. See: Eliasch, Climate change; Alliance of Small Island States (AOSIS), Potential effect of Surplus AAUs on Annex I allowed emissions in 2020: Technical Background and Assumptions. AOSIS, 2009; M den Elzen, M Roelfsema and S Slingerland, Too hot to handle? The emission surplus in the Copenhagen negotiations. Netherlands Environmental Assessment Agency, The Hague, The Netherlands, 2009.
20 Australian State of the Environment Advisory Council, Australia: State of the Environment 1996; An
independent report presented to the Commonwealth Minister for the Environment, Commonwealth of Australia, Canberra, 1996; A Young, Environmental Change in Australia since 1788. Oxford University Press, Melbourne, Australia, 1996; Australian Greenhouse Office (AGO), Land Clearing: A Social History. Commonwealth of Australia, Canberra, 2000.
21 Australian State of the Environment Advisory Council, Australia: State of the Environment 1996;
Australian State of the Environment Committee, Australia: State of the Environment 2001; Independent Report to the Commonwealth Minister for the Environment and Heritage. CSIRO Publishing on behalf of the Department of the Environment and Heritage, Canberra, 2001.
22 Australian State of the Environment Advisory Council, Australia: State of the Environment 1996;
P Toyne and R Farley, A Decade of Landcare: Looking Backward—Looking Forward. The Australia Institute, Canberra, 2000; Australian State of the Environment Committee, Australia State of the Environment 2001; Australian National Audit Office (ANAO), Commonwealth natural resource management and environment programs: Australia’s land, water and vegetation resources. Australian Government Publishing Service, Canberra, 1997.

A cautionary tale
7
The turning point for deforestation came in 1995. On 10 August of that year, the New South Wales Government introduced an approvals process (the State Environmental Planning Policy No.46—Protection and Management of Native Vegetation Policy (SEPP 46)) for the clearing of native vegetation in the eastern parts of the state. After a controversial two-year period,23 SEPP 46 was replaced with the Native Vegetation Conservation Act 1997 (NSW), which in turn was replaced by the Native Vegetation Act 2003 (NSW). The Native Vegetation Act 2003 (NSW) commenced in 2005 and was supposed to end broad-scale land clearing in the jurisdiction.
In Queensland, 1995 also marked the start of a regulatory reform process that is still ongoing. Late in the year, the Queensland Government issued guidelines to control broad-scale tree clearing on leasehold land, the dominant form of land tenure in Queensland’s rangelands.24 Since then, there have been three rounds of significant regulatory changes. In 1999, the Vegetation Management Act 1999 (Qld) was passed, which extended the vegetation clearing restrictions to freehold land. Flaws in the regime ensured that high rates of clearing continued after the Vegetation Management Act came into operation. Due to this, the Queensland Government placed a moratorium on clearing applications in May 2003 and, a year later, a new regime commenced that aimed to end broad-scale clearing of remnant vegetation by 31 December 2006..25
While the changes of 2003–04 were extremely significant, they left room for continued vegetation clearing. Of particular concern was the fact that regrowth vegetation remained vulnerable to widespread removal. This was partially addressed in April 2009 when a moratorium was placed on the clearing of high-value regrowth vegetation and native vegetation adjacent to regrowth watercourses in the so-called ‘priority’ Great Barrier Reef catchments (Burdekin, Mackay-Whitsundays and Wet Tropics). These interim arrangements were superseded by permanent changes that took effect on 8 October 2009.
The other notable change of the mid- to late-1990s was an increase in the Australian Government’s involvement in environmental issues. Most relevantly, in 1997 the government launched a major natural-resource management initiative, the Natural Heritage Trust, an AU$2.8 billion, 10-year program that aimed to promote improved land-management practices, biodiversity conservation, and the protection and replanting of native vegetation. This was followed by the National Action Plan for Salinity and Water Quality in 2000 (AU$1.4 billion over seven years) and, in 2008, the Natural Heritage Trust and National Action Plan were replaced by Caring for Our Country (AU$2 billion over five years). In 1999, the Australian Government also passed the Environment Protection and Biodiversity Conservation Act 1999, which, on paper at least, imposed regulatory restrictions that could control deforestation in areas that contained ‘matters of national environmental significance’, for example forests containing threatened species and ecological communities.
3.2 How successful has Australia been in controlling deforestation?
As discussed in Section 2, Australia’s deforestation emissions have fallen significantly since 1990. The Australian Government and others have attributed this to government action. For
23
E Lee, M Baird and I Lloyd, ‘State Environmental Planning Policy No 46—Protection and Management of Native Vegetation’. Environmental and Planning Law Journal 15(2): 1998, pp. 127–135.
24 Australian State of the Environment Advisory Council, Australia: State of the Environment 1996;
J Rolfe, ‘Broadscale Tree Clearing in Queensland’. Agenda 7(3): 2000, pp. 219–236; J Rolfe, R Blamey and J Bennett, ‘Valuing the preservation of rangelands: Tree clearing in the desert uplands region of Queensland’. Rangeland Journal 22(2): 2000, pp. 205–219.
25 C McGrath, ‘End of Broadscale Clearing in Queensland’. Environmental and Planning Law Journal 24:
2007, pp. 5–13; J Kehoe, ‘Environmental law making in Queensland: The Vegetation Management Act 1999 (Qld)’. Environmental and Planning Law Journal 26(5): 2009, pp. 392–410.

8
example, the Australian Minister for Climate Change and Water, Penny Wong, has argued that ‘State Governments have introduced vegetation management laws designed to protect natural resources and deliver climate change outcomes [and the] result has been that the area of remnant vegetation cleared annually has fallen from about 450,000 hectares in 1990 to approximately 200,000 hectares in 2005’.26 Similarly, the Garnaut Climate Change Review asserts that ‘land clearing has slowed significantly since 1990, primarily due to regulatory controls’.27
The claim that the decline in deforestation emissions since 1990 is attributable to government action is misleading, or at least incomplete. As Figure 1 shows, the sharpest fall in deforestation emissions occurred over the period 1990–95, and 82 per cent of this decline came from Queensland and New South Wales.28 The regulatory and policy regimes that were in place during those years were incapable of producing these trends. The best explanation is that during the late 1980s and early 1990s, there was above-average rainfall and high commodity prices, a combination that appears to have triggered historically high rates of deforestation in agricultural areas.29 With the onset of the global recession in the early 1990s and the 1991–95 drought that struck parts of Australia, these drivers subsided and deforestation rates fell.30
The impact of the reforms that have occurred since the mid-1990s is more contentious. In New South Wales, the evidence suggests that both SEPP 46 and the Native Vegetation Conservation Act 1997 failed to significantly reduce the rate of deforestation.31 As Figure 3 shows, in New South Wales the total deforestation rate fell sharply between 1990 and 1995 and then fluctuated between 45,000 and 75,000 hectares over the period 1996 to 2005. The forest conversion rate (clearing of remnant vegetation) is of particular note as it remained
26
The Australian Government’s line on this issue has not been consistent. In some instances, it has attributed the decline solely to government action, in others it has acknowledged the role of climatic and market forces. See:
P Wong, ‘Forests in a Climate Change World—Unlocking their potential’. Paper delivered to the Asia Pacific Forest Industries Climate Change Conference, 2008, p. 7. http://www.climatechange.gov.au/minister/wong/2008/major-speeches.aspx. Accessed 13 October 2009; Australian Greenhouse Office (AGO), Tracking to the Kyoto Target 2005: Australia’s Greenhouse Emissions Trends 1990 to 2008–12 and 2020. Commonwealth of Australia, Canberra, 2005; Australian Greenhouse Office (AGO), Tracking to the Kyoto Target 2006: Australia’s Greenhouse Emissions Trends 1990 to 2008–12 and 2020. Commonwealth of Australia, Canberra, 2006; Australian Department of Climate Change (ADCC), Carbon Pollution Reduction Scheme: Australia’s Low Pollution Future. Commonwealth of Australia, Canberra, 2008; Australian Department of Climate Change (ADCC), Tracking to the Kyoto Target 2007: Australia’s Greenhouse Emissions Trends 1990 to 2008–12 and 2020. Commonwealth of Australia, Canberra, 2008; Australian Department of Climate Change (ADCC), Land Use Change Sector Greenhouse Gas Emissions Projections 2007. Commonwealth of Australia, Canberra, 2008; Wong, ’Forests in a climate-changed world’, p. 7; P Wong, ‘A Carbon Pollution Reduction Scheme for Australia’. National Press Club Address, 16 July 2008. http://www.climatechange.gov.au/minister/wong/2008/major-speeches.aspx. Accessed 13 October 2009.
27 R Garnaut, The Garnaut Climate Change Review. Cambridge University Press, Cambridge, UK, 2008, p.
535. 28
ADCC, ‘Australian Greenhouse Emissions Information System’. 29
Rolfe, ‘Broadscale Tree Clearing in Queensland’. 30
Australian Bureau of Agricultural and Resource Economics (ABARE) Australian Commodity Statistics 2004. Commonwealth of Australia, Canberra, 2004; Australian Bureau of Agricultural and Resource Economics (ABARE), Australian Commodity Statistics 2008. Commonwealth of Australia, Canberra, 2008; Australian Bureau of Meteorology (ABOM), ‘Weather Station Data’, 2009. http://www.bom.gov.au/climate/data/weather-data.shtml. Accessed 22 November 2009.
31 Lee et al., ‘State Environmental Planning Policy No 46’;
New South Wales (NSW) Auditor-General, Regulating the Clearing of Native Vegetation. Audit Office of NSW, Sydney, Australia, 2006.

A cautionary tale
9
relatively stable between 1995 and 2005, notwithstanding that the regulatory system was supposed to be focused on the protection of remnant vegetation.
Figure 3: New South Wales deforestation rate (ha), 1990 to 2005
0
20000
40000
60000
80000
100000
120000
1990 1992 1994 1996 1998 2000 2002 2004
hectares
Reclearing Conversion
Source: ADCC32
The Native Vegetation Act 2003 (NSW) commenced in December 2005 and was widely heralded as ushering in a new era in vegetation management.33 It is too early to judge its effectiveness, although the available data suggest that it has not yet prompted a significant decline in land clearing.34 New South Wales operates a satellite-based monitoring system that tracks ‘woody vegetation clearing’ (the removal of any perennial woody vegetation that can be identified using satellite imagery). This is different from the deforestation that is monitored for the purposes of the Kyoto Protocol. Deforestation is defined for these purposes in Australia as the conversion of any area of land of ≥0.2 ha with crown cover of ≥20 per cent with woody vegetation with the potential to reach 2m or more in height to a non-forest use and any subsequent reclearing of regrowth forests.35 Noting these definitional differences, Figure 4 shows the annual and average rate of woody-vegetation change in New South Wales over the period 1990–2008. The clearing rate increased significantly in the lead-up to the
32
ADCC, Tracking to Kyoto and 2020. 33
P Cosier, ‘Native Vegetation Reforms in NSW’. Presentation to the Australian Centre for Environmental Law, 29 September 2004. Wentworth Group of Concerned Scientists, Sydney, Australia, 2004.
34 New South Wales Department of Environment, Climate Change and Water (NSWDECCW), New South
Wales State of the Environment 2009. New South Wales Government, Sydney, 2009; ADCC, ‘Australian Greenhouse Emissions Information System’.
35 FCCC/CP/2001/13/Add.1, at 58;
Australian Department of Climate Change (ADCC), The Australian Government’s Initial Report under the Kyoto Protocol: Report to facilitate the calculation of the assigned amount of Australia pursuant to Article 3, paragraphs 7 and 8 of the Kyoto Protocol, Commonwealth of Australia, Canberra, 2008.

10
commencement of the Native Vegetation Act 2003 (NSW). Since 2005, it has hovered just below the 19-year average at around 20,000 ha/yr.
Figure 4: Annual and average rate of woody-vegetation change in New South Wales (ha), 1990 to 2008
0
5000
10000
15000
20000
25000
30000
35000
40000
1990 1991 1992 1993 1994 1995 1996 1997 1998 1999 2000 2001 2002 2003 2004 2005 2006 2007 2008
hectares
Annual woody clearing Average since 1990
Source: NSWDECCW36
Queensland’s land-clearing regulation regime has had a chequered history. The 1995 changes failed. Queensland’s rate of woody-vegetation clearing did not decline in response to the reforms—the changes failed to reduce even the rate of clearing on leasehold land, which the legislation was specifically designed to address (Figure 5). This was hardly surprising. Clearing on freehold land was largely unregulated in most agricultural areas and the regime that applied to leasehold land contained numerous exemptions and other loopholes.
The regulatory regime that was introduced in 1999 encountered similar problems. If anything, it probably resulted in an increase in emissions in the late 1990s and 2000, which was offset by falls in subsequent years (i.e. it brought forward planned clearing). This was a product of gaps in the regime and the fact that there was a sizeable delay between the time the relevant legislation was passed (8 December 1999) and when it commenced (15 September 2000). This delay provided a window in which there was panic pre-emptive clearing by landholders;37 as Figure 5 shows, the clearing rate in 2000 exceeded 750,000 ha, well above trend.
36
NSWDECCW, New South Wales State of the Environment 2009. 37
Kehoe, ‘Environmental law making in Queensland’.

A cautionary tale
11
Figure 5: Queensland woody-vegetation clearing, by tenure, 1988 to 2008
0
100000
200000
300000
400000
500000
600000
700000
800000
1988 1990 1992 1994 1996 1998 2000 2002 2004 2006 2008
hectares
Freehold Leasehold
Source: QDERM38
The regime introduced in 2003-04 appears to have had greater success. Over the period 2005 to 2008, there was a marked drop in woody-vegetation clearing that seems at least partly attributable to the regulatory changes. Further research is required but the available data suggest that Queensland’s clearing laws are finally reducing the rates of vegetation removal.
Like many of the state programs, the Australian Government’s regulatory and non-regulatory initiatives since 1997 have struggled to curb deforestation. There is limited data on the environmental effectiveness of the government’s information and beneficiary pays programs, but what are available suggest that the impact on deforestation has been negligible. This is probably due to relative under-investment in deforestation control, lack of capacity in regional and rural areas, and poor design and administration.39 The evidence on the federal regulatory
38
QDERM, Land cover change in Queensland 2007–08. 39
Australian State of the Environment Advisory Council, Australia: State of the Environment 1996; Toyne and Farley, A Decade of Landcare; Hassall & Associates Pty Ltd, Natural Heritage Trust Phase 1 Final Evaluation. Commonwealth of Australia, Canberra, 2005; Australian State of the Environment Committee, Australia State of the Environment 2001; Australian State of the Environment Committee, Australia State of the Environment 2006. Commonwealth of Australia, Canberra, 2006; ANAO, Commonwealth natural resource management; Australian National Audit Office (ANAO), The Administration of the National Action Plan for Salinity and Water Quality. Commonwealth of Australia, Canberra, 2004; Australian National Audit Office (ANAO), The Conservation and Protection of National Threatened Species and Ecological Communities. Commonwealth of Australia, Canberra, 2007;
Australian National Audit Office (ANAO), Regional Delivery Model for the Natural Heritage Trust and the National Action Plan for Salinity and Water Quality. Commonwealth of Australia, Canberra, 2008.

12
regime (the Environment Protection and Biodiversity Conservation Act) is categorical however; the Act has had almost no impact on the rates of deforestation. Between July 2000 and July 2008, the regulatory regime was applied to a total of 10 agricultural-related land-clearing projects involving the removal of a mere 6,200 ha of vegetation, less than 0.2 per cent of the national total over the period.40
4. Drawing lessons from the Australian experience
The literature on REDD contains extensive discussion of the principal climate-related risks of market-linked REDD schemes, namely:
• additionality
• measurement
• leakage
• permanence.
As discussed, there is also a growing literature on the practical limits of an international REDD scheme and how on-ground issues might hinder progress on reducing REDD emissions.41
The history of deforestation reform in Australia and Article 3.7 of the Kyoto Protocol illustrate how real these risks are and the need for vigilance in the design and administration of any REDD scheme. Four lessons from the Australian experience are worth highlighting:
1) the risks associated with politically negotiated baselines;
2) the difficulty in setting baselines;
3) measurement uncertainty; and
4) the difficulty of implementing successful policy measures to reduce deforestation and forest degradation.
4.1 Risks associated with politically negotiated baselines
The loophole that Australia has exploited under Article 3.7(2) of the Kyoto Protocol is essentially a faulty baseline. A number of other countries also manipulated the LULUCF processes to the detriment of the environmental credibility of the Protocol.42 These experiences suggest that if REDD baselines are negotiated, there is a risk they will be overly generous and result in the production of hot air credits. This risk is particularly acute because of the incentives that both developed and developing countries have to agree on inflated baselines. In order to lure developing countries into the REDD scheme, developed countries may have to agree to baselines that make it relatively easy for developing countries to earn credits. At the same time, the generation of credits with dubious environmental value may suit some developed countries as it could lower the cost of meeting their mitigation commitments, even if it results in worse climate outcomes.
40
A Macintosh, ‘The Environment Protection and Biodiversity Conservation Act 1999 (Cth): An evaluation of its cost-effectiveness’. Environmental and Planning Law Journal 26(5): 2009, pp. 337–362
41 Skutsch et al. ‘Clearing the way for reducing emissions’;
Potvin et al., ‘Is reducing emissions from deforestation financially feasible?’; Fry, ’Reducing Emissions from Deforestation and Forest Degradation’; Neeff and Ascui, ‘Lessons from carbon markets’; Corbera et al., ‘Reducing greenhouse gas emissions’; M Skutsch and M McCall, ‘Reassessing REDD: governance, markets and the hype cycle’. Climatic Change, 2010. Doi: 10.1007/s10584-009-9768-y.
42 Höhne et al. ‘The rules for land use’.

A cautionary tale
13
4.2 Difficulty in setting baselines
Since the Kyoto Protocol was negotiated, the Australian Government has published a number of BAU and ‘with measures’ (WM) deforestation emissions projections.43 BAU projections have generally been derived by extrapolating from historical trends, a method that has considerable support in negotiations over the REDD-plus scheme. In order to generate WM projections, the government has tended to subtract an estimate of the anticipated abatement from the state land-clearing reforms of 2003–05 from the BAU estimate. Figure 6 compares Australia’s actual reported deforestation emissions to the government’s highest and lowest BAU and WM projections that were published between 2003 and 2009.44 The projection period is 2002 to 2012.
Figure 6: Actual Australian deforestation emissions vs. Australian Government projections, 2002 to 2012
0
10
20
30
40
50
60
70
80
90
2002 2003 2004 2005 2006 2007 2008 2009 2010 2011 2012
MtCO2-e
Actual BAU - high BAU - low WM - high WM - low
Source: AGO; ADCC 45
43
‘With measures’ refers to the best-estimate of future emissions taking into account past, current and committed policy actions that have an impact on greenhouse gas emissions.
44 The government did not publish a WM projection in 2003 nor provide details of its BAU projection in 2009.
45 Australian Greenhouse Office (AGO), National Greenhouse Gas Inventory 2001. Commonwealth of
Australia, Canberra, 2003; Australian Greenhouse Office (AGO), Tracking to the Kyoto Target 2003: Australia’s Greenhouse Emissions Trends 1990 to 2008–12 and 2020. Commonwealth of Australia, Canberra, 2003; Australian Greenhouse Office (AGO), National Greenhouse Gas Inventory 2002. Commonwealth of Australia, Canberra, 2004; AGO, Tracking to the Kyoto Target 2004; Australian Greenhouse Office (AGO), National Greenhouse Gas Inventory 2003. Commonwealth of Australia, Canberra, 2005; AGO, Tracking to the Kyoto Target 2005; Australian Greenhouse Office (AGO), National Greenhouse Gas Inventory 2004. Commonwealth of Australia, Canberra, 2006; AGO, Tracking to the Kyoto Target 2006;

14
As Figure 6 shows, the Australian Government has had little success in projecting deforestation emissions, even over short timeframes. In some years, actual deforestation emissions have been in excess of 80 per cent higher than the BAU projections and over 100 per cent higher than the WM projections. Even when emissions are aggregated over a five-year period to mimic a Kyoto commitment period, large discrepancies remain—the aggregate actual emissions for five-year periods for which data are available are between 24 to 33 per cent higher than the equivalent BAU projections and 79 per cent higher than the WM projections.
The problems that the government has encountered in predicting deforestation emissions are not surprising; it is difficult to measure these emissions and even harder to predict how they will change over time.46 For the government to have accurately predicted these emissions, it would have had to foresee changes in commodity prices, rainfall and other relevant social and economic factors. This is made difficult by the variability and unpredictability of these types of underlying drivers.
4.3 Measurement problems
Australia has one of the most advanced satellite-based systems for monitoring deforestation emissions in the world, the National Carbon Accounting System (NCAS). The NCAS program was established in 1997 in order to inform policy and account for LULUCF emissions and sinks under the international climate regime.47 The Australian Government spent approximately AU$50 million on the project during its first 12 years,48 and created a world-leading land-base emissions monitoring system.49
Australian Greenhouse Office (AGO), National Greenhouse Gas Inventory 2005. Commonwealth of Australia, Canberra, 2007; Australian Department of Climate Change (ADCC) (2008b). National Greenhouse Gas Inventory 2006. Commonwealth of Australia, Canberra; ADCC, Tracking to the Kyoto Target 2007; ADCC, ‘Australian Greenhouse Emissions Information System’; ADCC, Tracking to Kyoto and 2020.
46 R DeFries, F Achard, S Brown, M Herold, D Murdiyarso, B Schlamadinger and C de Souza, ‘Earth
observations for estimating greenhouse gas emissions from deforestation in developing countries’. Environmental Science & Policy 10: 2007, pp. 385–394; Eliasch, Climate Change; A Herold, G Zeri, J Dietz, A Freibauer, M Hüttner, M Jung, D Mollicone and M Scheffler, Emissions and removals from land-use, land use change and forestry activities in a post-Kyoto regime—quantitative analysis of a framework for reducing deforestation. Institute for Applied Ecology, MPI-BGC, ECOFYS, Berlin, Germany, 2008; Collett, ‘In the REDD’.
47 J Howard, Safeguarding the Future: Australia’s response to climate change. Commonwealth of Australia,
Canberra, 1997; Australian Greenhouse Office (AGO), Greenhouse Gas Emissions from Land Use Change in Australia: Results of the National Carbon Accounting System 1988–2001. Commonwealth of Australia, Canberra, 2003.
48 R Hill, Investing in Our Natural Heritage: The Commonwealth’s Environment Expenditure 1997–98.
Commonwealth of Australia, Canberra, 1997; R Hill, Investing in Our Natural Heritage: The Commonwealth’s Environment Expenditure 1998–99. Commonwealth of Australia, Canberra, 1998; R Hill, Investing in Our Natural and Cultural Heritage: The Commonwealth’s Environment Expenditure 1999–2000. Commonwealth of Australia, Canberra, 1999; R Hill, Investing in Our Natural and Cultural Heritage: The Commonwealth’s Environment Expenditure 2000–2001. Commonwealth of Australia, Canberra, 2000; R Hill, Investing in Our Natural and Cultural Heritage: Commonwealth Environment Expenditure 2001–2002. Commonwealth of Australia, Canberra, 2001; D Kemp, Towards a Sustainable Australia: Commonwealth Environment Expenditure 2002–03. Commonwealth of Australia, Canberra, 2002; D Kemp, A Sustainability Strategy for the Australian Continent: Environment Budget Statement 2004–05. Commonwealth of Australia, Canberra, 2004;

A cautionary tale
15
The Australian Government has expressed a relatively high level of confidence in the accuracy of NCAS’s emission estimates. In 2003, it rated the uncertainty level as ‘low’, or less than 20 per cent.50 By 2006, it had classified the level of uncertainty associated with the underlying deforestation activity data (ha deforested) as zero and the emission factor uncertainties as 10 per cent for CO2 and 20 per cent for both CH4 and N2O, giving a combined uncertainty estimate of ±10 per cent for CO2 and ±20 per cent for CH4 and N2O.51 These uncertainty estimates have remained constant since 2006.52
The published uncertainty ranges suggest there is little cause for concern about Australia’s deforestation emissions estimates. However, other data indicate that the government’s confidence in the accuracy of its estimates may be overstated. Figure 7 graphs the NCAS deforestation activity data (conversion and reclearing) that was published over the period 2002 to 2009. Preliminary estimates (typically covering the most recent two years) have been removed to provide a more accurate picture of the variability in the published estimates.
Figure 7: Government estimates of Australia’s deforestation rate (ha/yr) published between 2002 and 2009
0
100000
200000
300000
400000
500000
600000
700000
1990 1992 1994 1996 1998 2000 2002 2004
hectares
2009 data
2007 data
2006 data
2005 data
2003 data
2002 data
Source: AGO; ADCC53
G Richards, Australia’s National Carbon Accounting System. Australian Greenhouse Office (AGO), Commonwealth of Australia, Canberra, 2004.
49 NCAS was chosen by the Clinton Climate Initiative for its forest carbon measurement program and was
awarded the 2008 Australian Museum Eureka Prize for Environmental Research and the 2008 CSIRO Partnerships Excellence Award.
50 AGO, National Greenhouse Gas Inventory 2003.
51 Australian Greenhouse Office (AGO), National Inventory Report 2004. Commonwealth of Australia,
Canberra, 2006. 52
Australian Department of Climate Change (ADCC), National Inventory Report 2005. Commonwealth of Australia, Canberra, 2008; Australian Department of Climate Change (ADCC), National Inventory Report 2006. Commonwealth of Australia, Canberra, 2008; Australian Department of Climate Change (ADCC), National Inventory Report 2007. Commonwealth of Australia, Canberra, 2009.
53 Australian Greenhouse Office (AGO), Greenhouse Gas Emissions from Land Use Change in Australia:
Results of the National Carbon Accounting System. Commonwealth of Australia, Canberra, 2002; AGO, National Greenhouse Gas Inventory 2001; AGO, Greenhouse Gas Emissions from Land Use Change in Australia;

16
The Australian Government’s estimates of deforestation since the commencement of NCAS have varied considerably, by over 50 per cent in some years. The degree of variability was reduced significantly in the two most recently published datasets (2007 and 2009), but differences of up to six per cent for particular years are still present, contrary to the government’s stated position that there is zero uncertainty in the activity data.54
Further questions about the uncertainty associated with the activity data arise when the NCAS results are compared to those generated by state monitoring programs. Since 1995, the Queensland Government has run a satellite-based woody-vegetation-change monitoring program called the Statewide Landcover and Trees Study (SLATS). Like NCAS, SLATS is highly regarded both in Australia and internationally and it now forms an integral part of Queensland’s natural-resource management policy framework. The success of the SLATS program resulted in its replication in New South Wales in the mid-2000s.
As discussed in Section 3, there is a difference between the woody-vegetation clearing that is tracked by SLATS in Queensland and New South Wales and the deforestation that is monitored by NCAS.55 SLATS monitors the removal of perennial woody vegetation and is able to detect woody-vegetation change to a minimum threshold of approximately eight per cent foliage projective cover (FPC) (roughly 16 per cent crown cover).56 However, SLATS also generates woody-vegetation change data confined to vegetation with an FPC of ≥10–12 per cent, 57 which approximates the ≥20 per cent crown-cover definition that is used for the purposes of NCAS.58
Figure 8 compares the NCAS deforestation activity data for Queensland to the ≥10–12 per cent FPC woody-vegetation-clearing data published by SLATS for the period 1990 to 2005. There are significant discrepancies between the datasets, with SLATS showing noticeably
AGO, National Greenhouse Gas Inventory 2003; Australian Greenhouse Office (AGO), Greenhouse Gas Emissions from Land Use Change in Australia: Results of the National Carbon Accounting System 1988–2003. Commonwealth of Australia, Canberra, 2005; AGO, National Inventory Report 2004; ADCC, National Inventory Report 2006; ADCC, Tracking to Kyoto and 2020; ADCC, National Inventory Report 2007.
54 AGO, National Greenhouse Gas Inventory 2003;
AGO, National Inventory Report 2004; ADCC, National Inventory Report 2005; ADCC, National Inventory Report 2006; ADCC, National Inventory Report 2007.
55 A Macintosh, The National Greenhouse Accounts and Land Clearing: Do the Numbers Stack Up? The
Australia Institute, Canberra, 2007; Queensland Department of Natural Resources and Water (QDNRW), Land cover change in Queensland 2006–07: a Statewide Landcover and Trees Study (SLATS) Report. Queensland Government, Brisbane, 2008; QDERM, Land cover change in Queensland 2007–08.
56 QDNRW, Land cover change in Queensland 2006–07;
QDERM, Land cover change in Queensland 2007–08. 57
The SLATS 10 to 12 per cent FPC clearing data excludes areas that were not mapped as woody vegetation in 1991 (young regrowth).
58 Queensland Department of Natural Resources and Mines (QDNRM), Land Cover Change in Queensland
1999–2001. Queensland Government, Brisbane, 2003; Queensland Department of Natural Resources and Mines (QDNRM), Land Cover Change in Queensland 2001–2003, Incorporating 2001–2002 and 2002–2003 Change Periods: A Statewide Landcover and Trees Study (SLATS) Report. Queensland Government, Brisbane, 2005; Queensland Department of Natural Resources and Mines (QDNRM), Land Cover Change in Queensland 2003–2004: A Statewide Landcover and Trees Study (SLATS) Report. Queensland Government, Brisbane, 2006; QDNRW, Land cover change in Queensland 2006–07; QDERM, Land cover change in Queensland 2007–08.

A cautionary tale
17
higher clearing estimates in most years. The Australian Government has not provided an explanation for the differences. One theory hinges on NCAS’s approach to forest classification.59
Over the past two decades, clearing in Queensland has progressively moved into more marginal agricultural areas with sparse vegetation, a significant proportion of which sits close to the forest classification threshold. NCAS adopts a deliberately conservative approach to forest classification to avoid false positives, justified on the basis that a more liberal approach could artificially inflate the base-year estimate of Australia’s deforestation emissions.60 The adoption of this conservative approach to forest classification may have resulted in NCAS excluding a significant amount of vegetation clearance that is picked up by SLATS.
While this explanation is logical, and it has not been refuted by the Australian Government, it does not explain why the estimates of woody-vegetation clearing in New South Wales are significantly lower than the equivalent NCAS deforestation estimates (see Appendix A). For the years from 1990 to 2005, the annual woody-vegetation-change estimates published by the New South Wales Government are between 31 to 74 per cent lower than the latest NCAS deforestation estimates.61
Figure 8: Queensland clearing data, NCAS vs. SLATS 10 to 12 per cent FPC, 1990 to 2005
0
100000
200000
300000
400000
500000
600000
700000
800000
1990 1992 1994 1996 1998 2000 2002 2004
hectares
NCAS SLATS 10-12% FPC
Source: QDNRM; QDNRW; QDERM; ADCC62
59
Macintosh, The National Greenhouse Accounts; A Macintosh, Response to the Federal Government’s Critique of The National Greenhouse Accounts and Land Clearing: Do the Numbers Stack Up? The Australia Institute, Canberra, 2007.
60 AGO, Greenhouse Gas Emissions from Land Use Change in Australia.
61 NSWDECCW, New South Wales State of the Environment 2009;
ADCC, Tracking to Kyoto and 2020. 62
QDNRM, Land Cover Change in Queensland 1999–2001; QDNRM, Land Cover Change in Queensland 2001–2003; QDNRM, Land Cover Change in Queensland 2003–2004; QDNRW, Land cover change in Queensland 2006–07; QDERM, Land cover change in Queensland 2007–08; ADCC, Tracking to Kyoto and 2020.

18
Consistent with the activity data results, NCAS’s deforestation emissions estimates have also been highly variable. Figure 9 graphs the CO2 deforestation emissions that were reported by the Australian Government from 2002 to 2007. Over this period, the emission estimates varied by up to 30 per cent in particular years. The base-year estimate has varied by up to 11 per cent. Since 2006, there has been less variability but differences of up to 15 per cent have still been recorded.
Figure 9: Reported Australian CO2 deforestation emissions
30
40
50
60
70
80
90
100
110
120
130
140
1990 1992 1994 1996 1998 2000 2002 2004
MtCO2
NGGI 2002
NGGI 2003
NGGI 2004
NGGI 2005
NGGI 2006
NGGI 2007
Source: AGO; ADCC63
The fluctuations in emissions estimates could be attributable to a number of factors, including changes in activity data, increases in geographic coverage, model reruns and technical modifications. However, a lack of transparency in the operation of NCAS has made it difficult to identify the underlying drivers of the variability. These transparency problems have caused consternation amongst academics, non-government organisations, opposition political parties and state government agencies.64 Transparency issues associated with deforestation
63
AGO, Greenhouse Gas Emissions from Land Use Change in Australia; AGO, National Greenhouse Gas Inventory 2001; AGO, Greenhouse Gas Emissions from Land Use Change in Australia; AGO, National Greenhouse Gas Inventory 2003; AGO, Greenhouse Gas Emissions from Land Use Change in Australia; AGO, National Inventory Report 2004; ADCC, National Inventory Report 2005; ADCC, National Inventory Report 2006; ADCC, Tracking to Kyoto and 2020; ADCC, National Inventory Report 2007.
64 Macintosh, The National Greenhouse Accounts;
Macintosh, Response to the Federal Government’s Critique of The National Greenhouse Accounts; Parliament of Australia Senate, ‘Orders for the production of documents 2009’, 2009; Parliament of Australia Senate, ‘Notice Paper No. 108’, Monday 22 February 2010; Parliament of Australia Senate, Finance and Public Administration Legislation Committee, Estimates—Proof Committee Hansard, 8 February 2010.

A cautionary tale
19
emissions and NCAS have also been noted in reviews of Australia’s inventory submissions under the UNFCCC.65
In March 2010, 13 years after NCAS was established, the Australian Government finally released fine-scale data on forest cover and land-use change. The information was released under a return-to-order motion made by the Australian Greens and supported by the conservative Liberal-National Party Coalition in the Australian Senate. At the time of writing, this information was being analysed by independent researchers to identify the causes of some of the irregularities that have been detected.
The issues associated with the measurement of deforestation emissions in Australia illustrate the types of problems that could arise with a REDD scheme. Measurement difficulties could easily result in a significant over- or under-estimation of REDD abatement. This could be a product of deliberate manipulation of the data or inadvertent errors that arise as a result of the inherent difficulties associated with measuring REDD emissions. The complexity associated with the measurement of REDD emissions naturally reduces transparency, a situation that can easily be aggravated by a reluctance on behalf of governments to divulge data and details of their monitoring systems.
4.4 Difficulty of reducing land clearing
The story of deforestation in Australia demonstrates the magnitude of the task facing any international REDD scheme. Australia is a developed country with advanced technological capabilities and, by global standards, good governance and institutional arrangements for the implementation of legal and policy measures. Poverty levels are low, literacy and education levels are high, and government budgetary pressures are slight in comparison to those faced by other countries. Further, there has been sustained public pressure for a reduction in deforestation for at least 20 years. Despite these factors, Australia has struggled to control deforestation.
Recently, there have been signs of progress, particularly in Queensland. However, it would be premature to say that deforestation is no longer an issue in Australia. The difficulty that Australia has experienced in controlling deforestation should serve as a warning about the potential obstacles that stand in the way of an environmentally effective international REDD scheme. If a country like Australia finds it hard to halt deforestation, what is the outlook for developing countries with less advanced institutional, governance, monitoring and economic systems?
5. Conclusion
It is difficult to draw direct parallels between the Australian experience with deforestation and the proposed REDD schemes. The political environment has changed since the Kyoto Protocol and its rules were negotiated and history may not be a good guide to how the international climate regime will evolve in the coming years. The drivers of deforestation in Australia are also different from those in tropical developing countries, as are the economic, social, and governmental environments. Notwithstanding these considerations, the Australian experience does provide insights into the risks associated with a market-linked REDD scheme, especially the obstacles to success and the potential for the scheme to undermine the environmental credibility of the international climate regime.
65
UNFCCC Secretariat, Report of the individual review of the greenhouse inventory of Australia submitted in 2008. FCCC/ARR/2008/AUS. UNFCCC Secretariat, Bonn, Germany, 2009.

20
Skutsch et al. have described deforestation as ‘a hard nut to crack’.66 The history of deforestation regulation and reform in Australia highlights just how hard the task is. Fifteen years of government action has yielded variable results, some good, some not so good. It took a full decade of failed measures and half attempts before concerted steps were taken to clamp down on clearing. There are now signs of progress but deforestation continues to be an issue of concern—all this in a developed country with few of the governance, institutional and technical problems that stand in the way of progress in developing countries.
More than simply highlighting how difficult reducing REDD emissions in developing countries is likely to be, the Australian experience is a reminder of how the environmental credibility of an international REDD scheme could be undermined. The success of any future market-linked REDD scheme will hinge on how well baselines approximate BAU emissions, the accuracy of emissions estimates and the capacity to identify drivers of emission trends. Despite having all the required institutional and technical capabilities, Australia has struggled with all three. Its deforestation baseline under the Kyoto Protocol was deliberately manipulated. In domestic policy processes, the Australian Government has found it difficult to formulate accurate deforestation emissions projections. And while it has one of the most advanced satellite monitoring systems in the world, the Australian Government’s deforestation emission estimates have been subject to considerable uncertainty and lacked transparency.
There has been a tendency in some circles to over-hype the benefits of a market-linked REDD scheme and downplay the risks and limitations. This paper has deliberately highlighted the latter in an attempt to provide a more realistic picture of what an international REDD scheme might be able to achieve. A well-designed market-linked REDD scheme has the potential to generate significant benefits for all participants; however, progress on REDD will take time and the benefits will not be realised without considerable effort to ensure that any future REDD scheme is designed and administered in a transparent and environmentally robust manner.
66
Skutsch et al., ‘Clearing the way for reducing emissions from tropical deforestation’, p. 330.

A cautionary tale
21
References
Alliance of Small Island States (AOSIS) (2009). Potential effect of Surplus AAUs on Annex I allowed emissions in 2020: Technical Background and Assumptions. AOSIS.
Angelsen, A, Brown, S, Loisel, C, Peskett, L, Streck, C and Zarin, D (2009). Reducing Emissions from Deforestation and Forest Degradation (REDD): An Options Assessment Report. Report for the Government of Norway, Meridian Institute, Washington DC, US.
Australian Bureau of Agricultural and Resource Economics (ABARE) (2004). Australian Commodity Statistics 2004. Commonwealth of Australia, Canberra.
Australian Bureau of Agricultural and Resource Economics (ABARE) (2008). Australian Commodity Statistics 2008. Commonwealth of Australia, Canberra.
Australian Bureau of Meteorology (ABOM) (2009). ‘Weather Station Data’. http://www.bom.gov.au/climate/data/weather-data.shtml. Accessed 22 November 2009.
Australian Department of Climate Change (ADCC) (2008). The Australian Government’s Initial Report under the Kyoto Protocol: Report to facilitate the calculation of the assigned amount of Australia pursuant to Article 3, paragraphs 7 and 8 of the Kyoto Protocol, Commonwealth of Australia, Canberra.
Australian Department of Climate Change (ADCC) (2008). Carbon Pollution Reduction Scheme: Australia’s Low Pollution Future. Commonwealth of Australia, Canberra.
Australian Department of Climate Change (ADCC) (2008). Land Use Change Sector Greenhouse Gas Emissions Projections 2007. Commonwealth of Australia, Canberra.
Australian Department of Climate Change (ADCC) (2008). National Greenhouse Gas Inventory 2006. Commonwealth of Australia, Canberra.
Australian Department of Climate Change (ADCC) (2008). National Inventory Report 2005. Commonwealth of Australia, Canberra.
Australian Department of Climate Change (ADCC) (2008). National Inventory Report 2006. Commonwealth of Australia, Canberra.
Australian Department of Climate Change (ADCC) (2008). Tracking to the Kyoto Target 2007: Australia’s Greenhouse Emissions Trends 1990 to 2008–12 and 2020. Commonwealth of Australia, Canberra.
Australian Department of Climate Change (ADCC) (2009). ‘Australian Greenhouse Emissions Information System’. http://www.climatechange.gov.au/climate-change/emissions.aspx. Accessed 5 February 2009.
Australian Department of Climate Change (ADCC) (2009). National Inventory Report 2007. Commonwealth of Australia, Canberra.
Australian Department of Climate Change (ADCC) (2009). Tracking to Kyoto and 2020: Australia’s Greenhouse Emissions Trends 1990 to 2008–12 and 2020. Commonwealth of Australia, Canberra.

22
Australian Department of Climate Change (ADCC) (2010). ‘Australian Greenhouse Emissions Information System’. http://www.climatechange.gov.au/climate-change/emissions.aspx. Accessed 12 February 2010.
Australian Government (2009). Details of Proposed CPRS Changes. Australian Department of Climate Change. http://www.climatechange.gov.au/~/media/publications/cprs/CPRS_ESAS/091124oppnofferpdf.ashx. Accessed 16 February 2010.
Australian Greenhouse Office (AGO) (2000). Land Clearing: A Social History. Commonwealth of Australia, Canberra.
Australian Greenhouse Office (AGO) (2002). Greenhouse Gas Emissions from Land Use Change in Australia: Results of the National Carbon Accounting System. Commonwealth of Australia, Canberra.
Australian Greenhouse Office (AGO) (2003). Greenhouse Gas Emissions from Land Use Change in Australia: Results of the National Carbon Accounting System 1988–2001. Commonwealth of Australia, Canberra.
Australian Greenhouse Office (AGO) (2003). National Greenhouse Gas Inventory 2001. Commonwealth of Australia, Canberra.
Australian Greenhouse Office (AGO) (2003). Tracking to the Kyoto Target 2003: Australia’s Greenhouse Emissions Trends 1990 to 2008–12 and 2020. Commonwealth of Australia, Canberra.
Australian Greenhouse Office (AGO) (2004). National Greenhouse Gas Inventory 2002. Commonwealth of Australia, Canberra.
Australian Greenhouse Office (AGO) (2004). Tracking to the Kyoto Target 2004: Australia’s Greenhouse Emissions Trends 1990 to 2008–12 and 2020. Commonwealth of Australia, Canberra.
Australian Greenhouse Office (AGO) (2005). Greenhouse Gas Emissions from Land Use Change in Australia: Results of the National Carbon Accounting System 1988–2003. Commonwealth of Australia, Canberra.
Australian Greenhouse Office (AGO) (2005). National Greenhouse Gas Inventory 2003. Commonwealth of Australia, Canberra.
Australian Greenhouse Office (AGO) (2005). Tracking to the Kyoto Target 2005: Australia’s Greenhouse Emissions Trends 1990 to 2008–12 and 2020. Commonwealth of Australia, Canberra.
Australian Greenhouse Office (AGO) (2006). National Greenhouse Gas Inventory 2004. Commonwealth of Australia, Canberra.
Australian Greenhouse Office (AGO) (2006) National Inventory Report 2004. Commonwealth of Australia, Canberra.
Australian Greenhouse Office (AGO) (2006). Tracking to the Kyoto Target 2006: Australia’s Greenhouse Emissions Trends 1990 to 2008–12 and 2020. Commonwealth of Australia, Canberra.

A cautionary tale
23
Australian Greenhouse Office (AGO) (2007). National Greenhouse Gas Inventory 2005. Commonwealth of Australia, Canberra.
Australian National Audit Office (ANAO) (1997). Commonwealth natural resource management and environment programs: Australia’s land, water and vegetation resources. Australian Government Publishing Service, Canberra.
Australian National Audit Office (ANAO) (2004). The Administration of the National Action Plan for Salinity and Water Quality. Commonwealth of Australia, Canberra.
Australian National Audit Office (ANAO) (2007). The Conservation and Protection of National Threatened Species and Ecological Communities. Commonwealth of Australia, Canberra.
Australian National Audit Office (ANAO) (2008). Regional Delivery Model for the Natural Heritage Trust and the National Action Plan for Salinity and Water Quality. Commonwealth of Australia, Canberra.
Australia. State of the Environment Advisory Council, (1996). Australia: State of the Environment 1996; an independent report presented to the Commonwealth Minister for the
Environment, Commonwealth of Australia, Canberra.
Australian State of the Environment Committee (2001). Australia: State of the Environment 2001; Independent Report to the Commonwealth Minister for the Environment and Heritage. CSIRO Publishing on behalf of the Department of the Environment and Heritage, Canberra.
Australian State of the Environment Committee (2006). Australia State of the Environment 2006. Commonwealth of Australia, Canberra
Collett, M (2009). ‘In the REDD: A Conservative Approach to Reducing Emissions from Deforestation and Forest Degradation’. Carbon and Climate Law Review 3(3): pp. 324–339.
Corbera, E, Estrada, M and Brown, K (2010). ‘Reducing greenhouse gas emissions from deforestation and forest degradation in developing countries: revisiting the assumptions’. Climatic Change. Doi: 10.1007/s10584-009-9773-1.
Cosier, P (2004). ‘Native Vegetation Reforms in NSW’. Presentation to the Australian Centre for Environmental Law, 29 September 2004. Wentworth Group of Concerned Scientists, Sydney.
DeFries, R Achard, F Brown, S Herold, M Murdiyarso, D Schlamadinger, B and de Souza, C (2007). ‘Earth observations for estimating greenhouse gas emissions from deforestation in developing countries’. Environmental Science & Policy 10: pp. 385–394.
den Elzen, M, Roelfsema, M and Slingerland, S (2009). Too hot to handle? The emission surplus in the Copenhagen negotiations. Netherlands Environmental Assessment Agency, The Hague, The Netherlands.
Eliasch, J (2008). Climate Change: Financing Global Forests—The Eliasch Review. H M Stationery Office, London, UK.
Fry, I (2008).‘Reducing Emissions from Deforestation and Forest Degradation: Opportunities and Pitfalls in Developing a New Legal Regime’. Review of European Community and International Environmental Law 17(2): pp. 166–182.
24
Garnaut, R (2008). The Garnaut Climate Change Review. Cambridge University Press, Cambridge, UK.
Hamilton, C (2001). Running from the Storm: The Development of Climate Change Policy in Australia. UNSW Press, Kensington.
Hamilton, C (2007). Scorcher: The Dirty Politics of Climate Change. Black Inc Agenda, Melbourne.
Hamilton, C and Vellen, L (1999). ‘Land-use change in Australia and the Kyoto Protocol’. Environmental Science & Policy 2: pp. 145–152.
Hassall & Associates Pty Ltd (2005). Natural Heritage Trust Phase 1 Final Evaluation. Commonwealth of Australia, Canberra.
Herold, A, Zeri ,G, Dietz, J, Freibauer, A, Hüttner, M, Jung, M, Mollicone, D and Scheffler, M (2008). Emissions and removals from land-use, land use change and forestry activities in a post-Kyoto regime—quantitative analysis of a framework for reducing deforestation. Institute for Applied Ecology, MPI-BGC, ECOFYS, Berlin, Germany.
Hill, R (1997). Investing in Our Natural Heritage: The Commonwealth’s Environment Expenditure 1997–98. Commonwealth of Australia, Canberra.
Hill, R (1998). Investing in Our Natural Heritage: The Commonwealth’s Environment Expenditure 1998–99. Commonwealth of Australia, Canberra.
Hill, R (1999). Investing in Our Natural and Cultural Heritage: The Commonwealth’s Environment Expenditure 1999–2000. Commonwealth of Australia, Canberra.
Hill, R (2000). Investing in Our Natural and Cultural Heritage: The Commonwealth’s Environment Expenditure 2000–2001. Commonwealth of Australia, Canberra.
Hill, R (2001). Investing in Our Natural and Cultural Heritage: Commonwealth Environment Expenditure 2001–2002. Commonwealth of Australia, Canberra.
Höhne, N, Wartmann, S, Herold, A and Freibauer, A (2007). ‘The rules for land use, land use change and forestry under the Kyoto Protocol–lessons learned for the future climate negotiations’. Environmental Science & Policy 10: pp. 353–369.
Howard, J (1997). Safeguarding the Future: Australia’s response to climate change. Commonwealth of Australia, Canberra.
Humphreys, D (2008). ‘The politics of “Avoided Deforestation”: historical context and contemporary issues’. International Forestry Review 10(3): pp. 433–442.
Karousakis, K and Corfee-Morlot, J (2007). Financing Mechanisms to Reduce Emissions from Deforestation: Issues in Design and Implementation. Organisation for Economic Cooperation and Development (OECD), Paris, France.
Kehoe J (2009) ‘Environmental law making in Queensland: The Vegetation Management Act 1999 (Qld)’. Environmental and Planning Law Journal 26(5): pp. 392–410.
Kemp, D (2002). Towards a Sustainable Australia: Commonwealth Environment Expenditure 2002–03. Commonwealth of Australia, Canberra.

A cautionary tale
25
Kemp, D (2004). A Sustainability Strategy for the Australian Continent: Environment Budget Statement 2004–05. Commonwealth of Australia, Canberra.
Lee, E, Baird, M and Lloyd, I (1998). ‘State Environmental Planning Policy No 46—Protection and Management of Native Vegetation’. Environmental and Planning Law Journal 15(2): pp. 127–135.
Macintosh, A (2007). The National Greenhouse Accounts and Land Clearing: Do the Numbers Stack Up? The Australia Institute, Canberra.
Macintosh, A (2007). Response to the Federal Government’s Critique of The National Greenhouse Accounts and Land Clearing: Do the Numbers Stack Up? The Australia Institute, Canberra.
Macintosh, A (2009). ‘The Environment Protection and Biodiversity Conservation Act 1999 (Cth): An evaluation of its cost-effectiveness’. Environmental and Planning Law Journal 26(5): pp. 337–362.
McGrath, C (2007). ‘End of Broadscale Clearing in Queensland’. Environmental and Planning Law Journal 24: pp. 5–13.
Neeff, T and Ascui, F (2009). ‘Lessons from carbon markets for designing an effective REDD architecture’. Climate Policy 9: pp. 306–315.
New South Wales (NSW) Auditor-General (2006). Regulating the Clearing of Native Vegetation. Audit Office of NSW, Sydney, Australia
New South Wales Department of Environment, Climate Change and Water (NSWDECCW) (2009). New South Wales State of the Environment 2009. New South Wales Government, Sydney.
Parliament of Australia Senate (2009). ‘Orders for the production of documents 2009’. http://www.aph.gov.au/Senate/work/statistics/bus_senate/2009/other_bus/returns_order.htm. Accessed 16 February 2010.
Parliament of Australia Senate, Finance and Public Administration Legislation Committee (2010). Estimates—Proof Committee Hansard, 8 February 2010. http://parlinfo.aph.gov.au/parlInfo/download/committees/estimate/12745/toc_pdf/7368-5.pdf;fileType=application%2Fpdf#search=%22milne%20maps%22. Accessed 16 February 2010
Parliament of Australia Senate (2010). ‘Notice Paper No. 108’, Monday 22 February 2010. http://parlinfo.aph.gov.au/parlInfo/download/chamber/notices/20100222_SNP108/toc_pdf/snpf_108.pdf;fileType=application%2Fpdf#search=%22milne%20maps%22. Accessed 16 February 2010
Pearse, G (2007). High and Dry: John Howard, Climate Change and the Selling of Australia’s Future. Penguin Books Australia, Camberwell.
Potvin, C, Guay, B and Pedroni, L (2008). ‘Is reducing emissions from deforestation financially feasible? A Panamanian case study’. Climate Policy 8: pp. 23–40.
Queensland Department of Environment and Resource Management (QDERM) (2009). Land cover change in Queensland 2007–08: a Statewide Landcover and Trees Study (SLATS) Report. Queensland Government, Brisbane, Australia.

26
Queensland Department of Natural Resources and Mines (QDNRM) (2003). Land Cover Change in Queensland 1999–2001. Queensland Government, Brisbane.
Queensland Department of Natural Resources and Mines (QDNRM) (2005). Land Cover Change in Queensland 2001–2003, Incorporating 2001–2002 and 2002–2003 Change Periods: A Statewide Landcover and Trees Study (SLATS) Report. Queensland Government, Brisbane.
Queensland Department of Natural Resources and Mines (QDNRM) (2006). Land Cover Change in Queensland 2003–2004: A Statewide Landcover and Trees Study (SLATS) Report. Queensland Government, Brisbane.
Queensland Department of Natural Resources and Water (QDNRW) (2008). Land cover change in Queensland 2006–07: a Statewide Landcover and Trees Study (SLATS) Report. Queensland Government, Brisbane.
Richards, G (2004). Australia’s National Carbon Accounting System. Australian Greenhouse Office (AGO), Commonwealth of Australia, Canberra.
Rolfe, J (2000). ‘Broadscale Tree Clearing in Queensland’. Agenda 7(3): pp. 219–236.
Rolfe, J, Blamey, R and Bennett, J (2000). ‘Valuing the preservation of rangelands: Tree clearing in the desert uplands region of Queensland’. Rangeland Journal 22(2): pp. 205–219.
Skutsch, M, Bird, N, Trines, E, Dutschke, M, Frumhoff, P, de Jong, B, van Laake, P, Masera, and, Murdiyarso, D (2007). ‘Clearing the way for reducing emissions from tropical deforestation’. Environmental Science & Policy 10: pp. 322–334.
Skutsch, M and McCall, M (2010). ‘Reassessing REDD: governance, markets and the hype cycle’. Climatic Change. Doi: 10.1007/s10584-009-9768-y.
Toyne, P and Farley, R (2000). A Decade of Landcare: Looking Backward—Looking Forward. The Australia Institute, Canberra.
UNFCCC (1998). The Kyoto Protocol, UN. <http://unfccc.int/essential_background/.
UNFCCC Secretariat (2008). ‘Initial reports under Article 7, paragraph 4, of the Kyoto Protocol and initial review report’. http://unfccc.int/national_reports/initial_reports_under_the_kyoto_protocol/items/3765.php. Accessed 16 February 2010.
UNFCCC Secretariat (2009). Report of the individual review of the greenhouse inventory of Australia submitted in 2008. FCCC/ARR/2008/AUS. UNFCCC Secretariat, Bonn, Germany
UNFCCC Secretariat (2009). Copenhagen Accord, Decision ‐/CP15. http://unfccc.int/files/meetings/cop_15/application/pdf/cop15_cph_auv.pdf.
UNFCCC Secretariat (2010) ‘GHG data from UNFCCC’. http://unfccc.int/ghg_data/ghg_data_unfccc/items/4146.php. Accessed 16 February 2010
Wong, P (2008). ‘A Carbon Pollution Reduction Scheme for Australia’. National Press Club Address, 16 July 2008. http://www.climatechange.gov.au/minister/wong/2008/major-speeches.aspx. Accessed 13 October 2009

A cautionary tale
27
Wong, P (2008). ‘Forests in a Climate Change World—Unlocking their potential’. Paper delivered to the Asia Pacific Forest Industries Climate Change Conference. http://www.climatechange.gov.au/minister/wong/2008/major-speeches.aspx. Accessed 13 October 2009
Young, A (1996). Environmental Change in Australia since 1788. Oxford University Press, Melbourne.
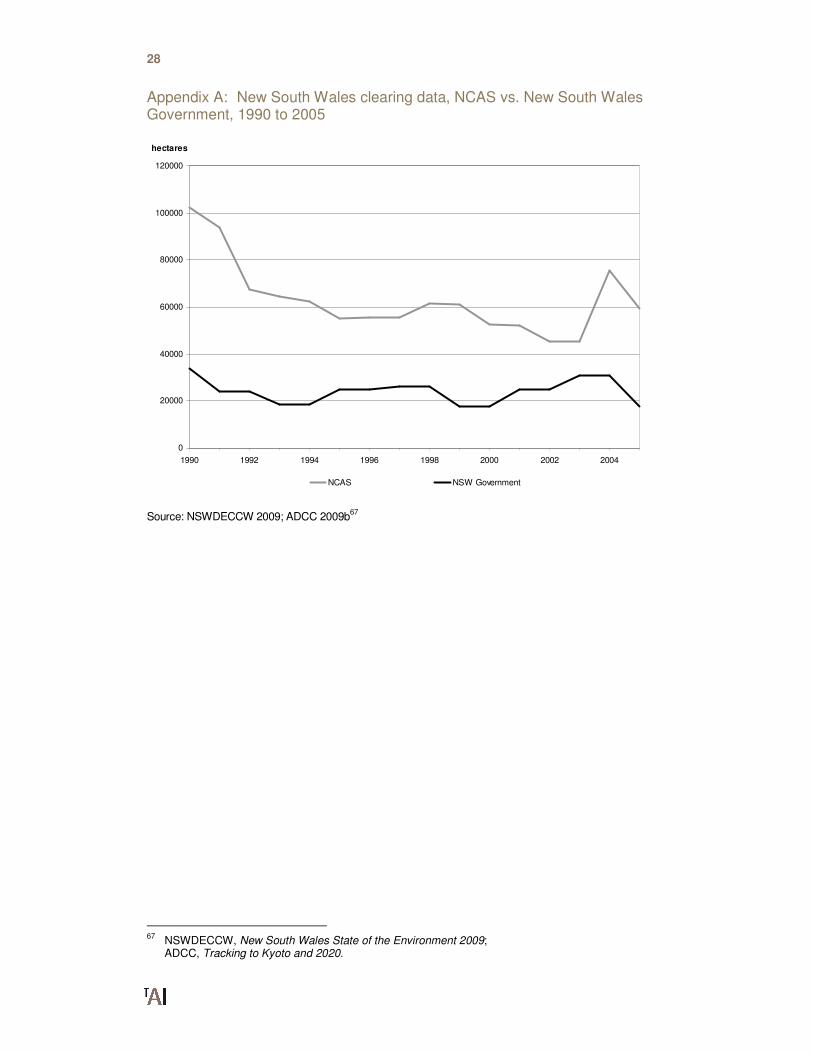
28
Appendix A: New South Wales clearing data, NCAS vs. New South Wales Government, 1990 to 2005
0
20000
40000
60000
80000
100000
120000
1990 1992 1994 1996 1998 2000 2002 2004
hectares
NCAS NSW Government
Source: NSWDECCW 2009; ADCC 2009b67
67
NSWDECCW, New South Wales State of the Environment 2009; ADCC, Tracking to Kyoto and 2020.