On the Road to REDD+: The UN-REDD Programme's Support to REDD+ Readiness 2008-2013

1 . F o r e s t , C a r b o n S e q u e s t r a t i o n a n d C l i m a t e C h a n g e
1
REDD+ ACADEMY – LEARNING JOURNAL
1. FOREST, CARBON SEQUESTRATION AND CLIMATE CHANGE
CONTENTS REDD+ Academy – Learning Journal ....................................................................................................................... 1
1.Forest, Carbon Sequestration and Climate Change ............................................................................................. 1
Key Messages ......................................................................................................................................................... 2
Introduction ............................................................................................................................................................ 3
What is causing climate change? ............................................................................................................................ 5
The Greenhouse Effect ........................................................................................................................................... 5
How does climate change link to the carbon cycle and forests? ............................................................................ 7
Expected changes in the future .............................................................................................................................. 8
Emissions from forest carbon stocks .................................................................................................................... 10
Carbon sequestration potential of forests ........................................................................................................... 12
Forests and climate change mitigation ................................................................................................................. 13
Case study ........................................................................................................................................................... 144
Exercises ............................................................................................................................................................... 14

1 . F o r e s t , C a r b o n S e q u e s t r a t i o n a n d C l i m a t e C h a n g e
2
KEY MESSAGES
There is increasing evidence from around the world that the Earth’s climate is changing and human
activity is the most likely cause;
The carbon cycle means that vegetation (including forests), soils, oceans and the atmosphere are
connected, and it is important to consider the role vegetation and changes in vegetation cover play in
controlling overall greenhouse gas emissions and hence climate change;
As forests contain substantial stores of carbon, their degradation and or conversion to other land
cover causes the release of some of the carbon stored within them, conversely their restoration can
act as a sink for atmospheric carbon;
The UNFCC developed REDD+, reducing emissions from deforestation and forest degradation plus the
conservation of forest carbon stocks, sustainable management of forests and enhancement of forest
carbon stocks, recognizing the potential role of forests in contributing to climate change mitigation.

1 . F o r e s t , C a r b o n S e q u e s t r a t i o n a n d C l i m a t e C h a n g e
3
INTRODUCTION This module shows evidence that the climate is changing and shows a clear link with human activity. It then
presents the role of forests regarding climate regulation.
The module includes explanations about:
Evidence of human induced climate change and factors influencing the climate;
The regulatory role of forests;
How human activity impacts the climate related function of forests.
There is increasing evidence from around the world that the Earth’s climate is changing and human activity is
the most likely cause. As the IPCC 2015 AR5 summary report1 notes: “It is extremely likely that we are the
dominant cause of warming since the mid-20th century”.
These changes are most obviously seen by increasing average temperatures and rising sea levels. Figure 1.1
shows the average changes in temperature around the world between 1901 and 2012. As can be seen, apart
from a couple of light blue areas which represent falling average temperatures, most of the world has
experienced an increase in average temperatures represented by the orange/red and purple areas. The global
average temperature increase over the period 1880 to 2012 period is 0.85°C.
FIGURE 1.1 MAP OF THE OBSERVED SURFACE TEMPERATURE CHANGE FROM 1901 TO 2012
Source: IPCC, 2013
REFLECTION POINT
On average have temperatures in your region increased or decreased?
1 http://www.ipcc.ch/report/ar5/wg1/

1 . F o r e s t , C a r b o n S e q u e s t r a t i o n a n d C l i m a t e C h a n g e
4
Figure 1.2 shows how temperatures have varied, between 1850 and 2010, in comparison to the average
temperature of 1961-1990. The graph shows, for example, that in 1850, the average temperature was 0.4
degrees cooler than the average temperature between 1961 and 1990. The top part of the graph presents the
annual averages, while the bottom one shows the average for decadal periods.
FIGURE 1.2 OBSERVED GLOBAL MEAN COMBINED LAND AND OCEAN SURFACE TEMPERATURE ANOMALIES
Source: IPCC, 2013
Figure 1.2 clearly shows that over this period, average temperatures have been increasing, and that the three
last decades have been the hottest; each successively warmer at the Earth’s surface than any preceding
decade since 1850.
The rise in temperature is not the only evidence of a changing climate: Figure 1.3 illustrates the changes
measured in several other ways.
FIGURE 1.3 MULTIPLE OBSERVED INDICATORS OF A CHANGING GLOBAL CLIMATE
Source: IPCC, 2013

1 . F o r e s t , C a r b o n S e q u e s t r a t i o n a n d C l i m a t e C h a n g e
5
Figure 1.3(b) shows that Northern Hemisphere snow cover and Arctic summer ice are falling, particularly since
1960. The melting snow and ice ends up in the oceans, which contributes to higher average sea levels (around
15 cm already over the observed period). In spite of the melting ice water, global upper water layers have
warmed since 1950, when the measurements started.
REFLECTION POINT
Have you already noticed impacts of climate change? (e.g. changing in the timing of the seasons, species
movements, changes in the frequency of extreme events).
Are you aware of any changes within your country that have been attributed to climate change?
Are you aware of the predicted threats from a warming planet on your country or region?
WHAT IS CAUSING CLIMATE CHANGE?
As mentioned previously, humans are the most likely cause of recent changes in the earth’s climate, but the
climate system is complex, and is influenced by several natural effects such as variations in solar radiation, the
natural greenhouse gas effect, naturally occurring aerosols, water currents, etc.
THE GREENHOUSE EFFECT
The greenhouse effect is a natural phenomena through which carbon dioxide in the atmosphere (and a few
other Greenhouse Gases (GHGs) including methane and nitrous oxide) keep the solar rays that hit the earth
surface from reflecting back into the outer space, thus heating the earth’s atmosphere. Figure 1.4 illustrates
the greenhouse effect and how it operates and how GHGs contribute. The GHGs absorb some of the reflected
radiation and then re-emit it, including back down to the earth’s surface, heating the atmosphere. There are
several GHGs and their impact depends on their ‘global warming potential’, as well as the amount of the gas in
the atmosphere. The global warming potential is a factor of:
The radiative forcing (the net downward flux) due to a pulse emission of the compound (gas);
How long the compound remains in the atmosphere.
The global warming potential of methane and nitrous oxide are much larger than that of carbon dioxide but a
far larger amount of carbon dioxide is emitted into the atmosphere.
In principle, the greenhouse effect is a good thing, as otherwise the planet would be too cold for humans to
survive, but the increase in greenhouse gases has led to an increase in the “warming potential” of the
atmosphere, and this is related to the changes in the climate observed. Mankind is, in effect, putting an extra
blanket around the earth.

1 . F o r e s t , C a r b o n S e q u e s t r a t i o n a n d C l i m a t e C h a n g e
6
FIGURE 1.4 THE GREENHOUSE EFFECT
Source: EDF Energy, 2015
There is now a consensus amongst the scientific community that the cause of actual (and future) climate
change is anthropogenic (from humans), mainly by the intensification of the greenhouse effect caused by the
emission of greenhouse gases in the atmosphere.
The warming of the climate system is unequivocal, and the largest contribution comes from the increase in the
atmospheric concentration of carbon dioxide (CO2), which is man-made. The IPCC states it clearly: it is
extremely likely (95%) that human influence has been the dominant cause of the observed warming since the
mid-20th century. The figure 1.5 shows how the concentration of atmospheric CO2, methane (CH4) and Nitrous
oxide (N2O) have increased in the recent past.
FIGURE 1.5 GLOBALLY AVERAGED GREENHOUSE GAS CONCENTRATIONS
Source: IPCC, 2013
REFLECTION POINT
Are the following statements True or False?
Without the greenhouse effect the planet would be too cold to live on.
Climate change is a result of an increase in the concentration of these greenhouse gases mostly from
anthropogenic sources, such as the burning of fossil fuels, agriculture and deforestation.

1 . F o r e s t , C a r b o n S e q u e s t r a t i o n a n d C l i m a t e C h a n g e
7
HOW DOES CLIMATE CHANGE LINK TO THE CARBON CYCLE AND FORESTS?
Carbon can be found in a variety of different forms and locations. These include in living organisms (including
trees and other plants), fossil fuels (coal, oil and gas) and carbon dioxide within the atmosphere. The absolute
quantity held within these different locations at a specified time is called the stock, and changes in these
stocks are referred to as fluxes. Carbon flows between these stocks through a number of processes collectively
known as the “carbon cycle”. The fluxes include natural processes such as plant growth and respiration, and
human interventions such as the burning of fossil fuels and destruction of forests. Figure 1.6 below illustrates
the global carbon cycle with its stocks and flows, which are shown in two ways:
1. How they were before large human intervention (roughly before 1750 – black figures and arrows);
2. How they were changed with human intervention since the industrial revolution (red figures and
arrows).
The ‘historical’ fluxes were generally in equilibrium, the amount going into and out of each stock being about
the same. Human actions, such as the burning of fossil fuels, cement production and land use change are
creating disequilibrium, through increasing emissions. But these bigger fluxes from ‘sources’ (stocks producing
carbon (C) output to the atmosphere) are compensated partly by bigger fluxes from the atmosphere into
‘sinks’ (processes or mechanisms that remove carbon dioxide from the atmosphere), particularly the ocean
and the land sinks (this will bel revisited later).
FIGURE 1.6 GLOBAL CARBON CYCLE FOR THE 1990S
Source: IPCC, 2015
The carbon cycle means that vegetation (including forests), soils, oceans and the atmosphere are connected,
and it is important to consider the role vegetation and changes in vegetation cover play in controlling overall
greenhouse gas emissions and hence climate change. Overall, the most recent assessments by the IPCC

1 . F o r e s t , C a r b o n S e q u e s t r a t i o n a n d C l i m a t e C h a n g e
8
estimate that anthropogenic net CO2 emissions from land use change represent about 10% of the total
anthropogenic emissions (IPCC AR5 WGI2).
EXPECTED CHANGES IN THE FUTURE
There is little doubt that climate change is happening, and that it is being caused by human activity through
the enhancing of the greenhouse effect by increasing greenhouse gas emissions. Several scenarios have been
produced to provide an idea of what the future climate could look like. The scientific community has produced
Representative Concentration Pathways (RCP), which are projections based on emission scenarios until 2100.
These projections are based on scenarios which describe several ways in which emissions could fluctuate in
the future. RCP 8.5 presents a continuous growth of emissions, RCP 6 and RCP 4.5 present intermediate
situations, and RCP 2.6 present projection with a scenario of sharp emission reductions. These projections are
useful for informing decisions related to future climate. The projections for change in temperature are shown
in Figure 1.7.
FIGURE 1.7 SIMULATED TIME SERIES FROM 1950 TO 2100
Source: IPCC, 2013
Figure 1.7 shows that unless important action is taken to reduce emissions; there will be drastic changes in the
climate which will strongly affect the environment.
2 http://www.ipcc.ch/report/ar5/wg1/

1 . F o r e s t , C a r b o n S e q u e s t r a t i o n a n d C l i m a t e C h a n g e
9
Current international agreements have set a goal that the rise in average world temperature should not go
higher than 2°C above pre-industrial levels. The link between emissions since the 1850s and temperature
increases means that emissions need to be capped at a certain level of cumulative emissions (the level that
corresponds to the 2°C increase). If emission rates stay at the current levels, the remaining budget ‘quota’
would be used up in about 30 years.
In other words, unless strong mitigation actions are urgently adopted, the limit of a 2°C temperature rise will
quickly be passed and a much more uncertain climate future awaits.
REFLECTION POINT
What do the initials ‘RCP’ stand? Why are RCPs so important?
THE EXTENT OF FORESTS AND FOREST CARBON STOCKS
Globally, forests cover about 4 billion ha or 31% of the world’s land surface (relative to a pre-industrial area of
5.9 billion hectares of forests). Most forests occur in the tropics and in large areas of the Northern hemisphere
in Canada, the US, Europe, Siberia and China, as shown in Figure 1.8.
The different forest (and other) biomes contain varying amounts of carbon, as presented in Figure 1.8. At a
global scale tropical forests contain the largest carbon stock (547.8 million tonnes C in tropical and subtropical
forests). There are also differences within tropical areas, with mangrove forests and swamp forests containing
particularly high levels of biomass3 in their vegetation cover and soils.
FIGURE 1.8 FOREST COVER IN 2010
Source: FAO, 2010.
3 Biomass is the total mass of living organisms in a given area or volume; dead plant material can be included as dead biomass. The quantity of carbon contained in biomass varies slightly between vegetation types but on average, a ton of biomass equates to half a ton of carbon.

1 . F o r e s t , C a r b o n S e q u e s t r a t i o n a n d C l i m a t e C h a n g e
10
FIGURE 1.9 CARBON STORAGE BY ECOSYSTEM
Source: Kapos, V., Ravilious, C., Leng, C., Bertzky, M., Osti, M., Clements, T., Dickson, B. (2010)
REFLECTION POINT
Referring to figure 1.9, what different ecosystem types are there in your country?
How much forest is there and where is it situated? Are there different types of forested habitat (e.g.
mangroves, swamp-forests)?
EMISSIONS FROM FOREST CARBON STOCKS
As forests contain substantial stores of carbon, their degradation and or conversion to other land cover causes
the release of some of the carbon stored within them. Forest degradation is defined as human activities
negatively impacting on the forest, causing the partial removal and loss of ecosystem function, but where
some forest cover remains, for example through damage from selective logging. The level of emissions
depends on the amount of carbon stored in the forest, the extent to which the vegetation cover and soil
structure is damaged or destroyed, as well as what happens to the land afterwards. Particularly high emissions
will result if the vegetation is completely destroyed and then the area is burned afterwards, as is carried out
during slash and burn agriculture in some parts of the developing world.
The extent of forest destruction is very high in some areas. For example, a recently published study on
deforestation in Borneo shows that deforestation has reduced the once large forest cover on Borneo (75.7%)
by one third, as shown in figure 1.10.

1 . F o r e s t , C a r b o n S e q u e s t r a t i o n a n d C l i m a t e C h a n g e
11
FIGURE 1.10 EVOLUTION OF FOREST COVER ON BORNEO ISLAND
Source: Gaveau et al., 2014
Historically, deforestation was largely in the US, Europe and Eastern Europe. Today, the largest deforestation
rates are observed in tropical rain forest regions. Figure 1.11 shows that the USA and Europe have reversed
the trend and are now increasing their forest cover. This highlights an important issue, that although the
destruction of forests causes the release of carbon dioxide, their restoration can act as a sink for atmospheric
carbon. As mentioned previously, the net contribution of land use change to global emissions is about 10% (0.9
PgC/yr). This contribution is calculated by combining both emissions due to deforestation and the
sequestration of carbon due to forest recovery. The gross emissions from deforestation and degradation are
larger than the net emissions (about 2.8 ± 0.5 PgC/yr for the 2000s, IPCC AR5 WGI, 20134) because of the
significant regrowth that compensates for the gross emissions.
There are several causes for deforestation and forest degradation, which are addressed more in depth in
Module 3: Drivers of Forest Degradation and Deforestation.
4 http://www.ipcc.ch/report/ar5/wg1/

1 . F o r e s t , C a r b o n S e q u e s t r a t i o n a n d C l i m a t e C h a n g e
12
FIGURE 1.11 HISTORICAL FOREST CARBON BALANCE 1855-1995
Source: GRID-Arendall, 2015
REFLECTION POINT
Why is it so important to understand the link between deforestation and degradation in addressing the issues
of climate change?
CARBON SEQUESTRATION POTENTIAL OF FORESTS
Forests are not only potential sources of carbon emissions to the atmosphere; they can also act as carbon
sinks, sequestering carbon both as they grow when they are being restored to the biomass sink and as part of
the terrestrial carbon sink.
More than two billion hectares worldwide may offer some form of opportunities for restoration. In areas that
were deforested but that are not currently densely populated or cultivated, it may be possible to undertake
some form of restoration, ranging from complete reforestation of closed canopy cover to more mosaic
restoration that includes restored forest areas interspersed with other land uses including agroforestry, small
scale agriculture and settlements. Such restoration sequesters carbon, with the level of sequestration
depending on the extent of recovery of plant biomass and soil carbon. This potential is illustrated in figure
1.12.

1 . F o r e s t , C a r b o n S e q u e s t r a t i o n a n d C l i m a t e C h a n g e
13
FIGURE 1.12 FOREST AND LANDSCAPE RESTORATION OPPORTUNITIES
Source: WRI, 2015
The observed increases in atmospheric carbon dioxide are lower than would be expected if anthropogenic
emissions were considered alone, due to the combined action of natural land and ocean sinks of carbon
dioxide which removed an average 55% of the total anthropogenic emissions every year during the period
1958–2011 (IPCC 2013, AR5 WGI). The increased storage of carbon in terrestrial ecosystems not affected by
land use change is partially caused by enhanced photosynthesis at higher carbon dioxide levels, and it means
that intact forests are helping to act as a buffer against anthropogenic carbon dioxide emissions.
FORESTS AND CLIMATE CHANGE MITIGATION
The links between forests and the carbon cycle mean that actions that affect the forest sector can have a large
impact on greenhouse gas emissions and so on climate change. The total amount of carbon dioxide in the
atmosphere can be reduced by decreasing emissions from both deforestation and forest degradation.
Maintaining standing forests can preserve their role in the terrestrial carbon sink and restoring forests can
increase the sequestration of carbon by forests thereby decreasing the overall levels of carbon dioxide in the
atmosphere.
Recognizing the potential role of forests in contributing to climate change mitigation, the UNFCC developed
REDD+, reducing emissions from deforestation and forest degradation plus the conservation of forest carbon
stocks, sustainable management of forests and enhancement of forest carbon stocks. Module 2 presents the
basis of REDD+ and the UN-REDD Programme.
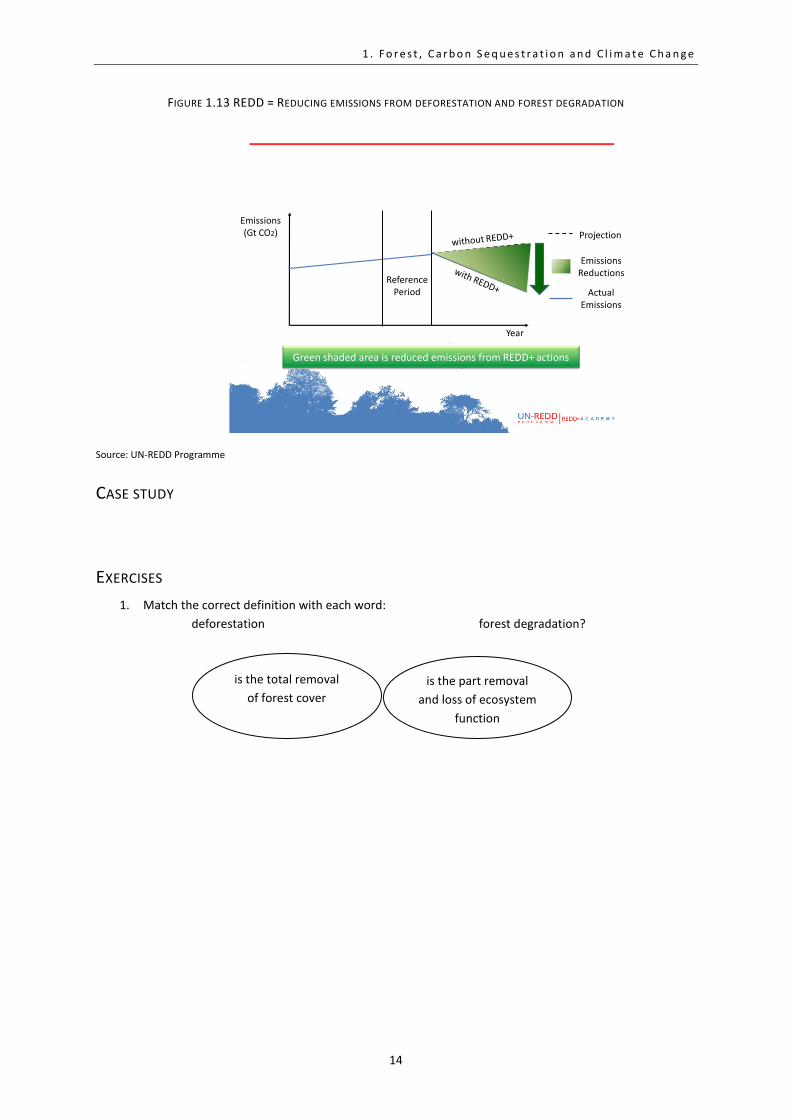
REDD+ is a potentially important way to reduce total GHG emissions and thus mitigate climate change as
illustrated by figure 1.13.
1 . F o r e s t , C a r b o n S e q u e s t r a t i o n a n d C l i m a t e C h a n g e
14
FIGURE 1.13 REDD = REDUCING EMISSIONS FROM DEFORESTATION AND FOREST DEGRADATION
Reference Period
Emissions (Gt CO2)
Year
Projection
Actual Emissions
EmissionsReductions
Green shaded area is reduced emissions from REDD+ actions
Source: UN-REDD Programme
CASE STUDY
EXERCISES
1. Match the correct definition with each word:
deforestation forest degradation?
is the part removal
and loss of ecosystem
function
is the total removal
of forest cover

1 . F o r e s t , C a r b o n S e q u e s t r a t i o n a n d C l i m a t e C h a n g e
15
2. Below is the recent IPCC estimate of the fluxes in the Carbon cycle expressed in Petagrammes Carbon per year (1
Petagramme = Gigatonne Carbon per year).
List the numbers in the figure below associated with the following fluxes:
Atmosphere
Net Ocean
Net land use change
Fossil fuels (coal. Oil, gas), cement production.
Source: IPCC, 2015