RECRYSTALLIZATION AND GRAIN GROWTH IN … · RECRYSTALLIZATION AND GRAIN GROWTH IN NICKEL ALLOY 706...
21
RECRYSTALLIZATION AND GRAIN GROWTH IN NICKEL ALLOY 706 FORGINGS Kate Felde Case Western Reserve University Academic Advisor: Professor John Lewandowski, CWRU Project Advisor: Michael Parzuchowski, Alcoa Sponsoring Professor: Professor David Schwam, CWRU Case Western Reserve University Department of Materials Science and Engineering Alcoa Forged Products Large Aerospace and Industrial Products
Transcript of RECRYSTALLIZATION AND GRAIN GROWTH IN … · RECRYSTALLIZATION AND GRAIN GROWTH IN NICKEL ALLOY 706...

RECRYSTALLIZATION AND GRAIN GROWTH IN NICKEL ALLOY 706 FORGINGS
Kate Felde Case Western Reserve University
Academic Advisor: Professor John Lewandowski, CWRU Project Advisor: Michael Parzuchowski, Alcoa Sponsoring Professor: Professor David Schwam, CWRU
Case Western Reserve University Department of Materials Science and Engineering
Alcoa Forged Products Large Aerospace and Industrial Products

ABSTRACT A 1000-lb piece of nickel-iron base alloy 706 was forged to a four-level stepped hand forging. This induced 0.0, 0.5, 1.0, and 1.5 (in/in) true strain into the four sections, respectively. Pieces from each strain section were annealed at three different solution heat treatment temperatures (1785ºF, 1800ºF, and 1815ºF) for times ranging from 0 minutes (unannealed condition) to 5.5 hours. The samples were then measured for Rockwell B hardness and metallographically examined to determine the degree of recrystallization. Results showed that all combinations of strain (i.e. 0.5, 1.0, and 1.5) and annealing temperature (i.e. 1785ºF, 1800ºF, and 1815ºF) achieved complete recrystallization. All specimens did exhibit some degree of grain growth as revealed by metallographic examination, and at higher annealing temperatures, there is a greater degree of grain growth. With increasing amounts of deformation, the recrystallized grain size is smaller. It was also determined that hardness measurements are effective in demonstrating recrystallization. 1.0 OBJECTIVE The objective is to determine the correlation between the amount of strain and the amount of thermal energy (time and temperature) required to initiate and complete recrystallization in nickel-iron base alloy 706. 2.0 INTRODUCTION AND BACKGROUND Recrystallization is a function of the amount of strain induced during the forging operation as well as the time and temperature of annealing. Increasing the strain, time and temperature of annealing increases the driving energy for recrystallization. Processing conditions could be improved by knowing the correlation between the total strain, time and temperature parameters of annealing. Determining the optimum annealing parameters in nickel-iron base alloy 706 forgings can ensure full recrystallization while minimizing detrimental grain growth. Full recrystallization will not be achieved in the forgings if there is an insufficient amount of deformation and/or insufficient heat treatment time and temperature, i.e., insufficient energy. It is desirable to solution heat treat at the lowest possible temperature to minimize grain growth. The strain in the parts is fixed by current production practice; therefore, the minimum time and temperature combination that will achieve full recrystallization needs to be determined. 2.1 Nickel-Iron Base Alloy 706 Alloy 706 is a nickel-iron base superalloy patented in 1972. The nominal chemistry is shown in Table 1. C Mn Si Cr Ni Fe Ti Al Cb 0.03 0.20 0.20 16.0 41.5 40.0 1.8 0.2 2.9 Table 1. Nominal chemistry of alloy 706 [1]
Alloy 706 is used in applications where good strength and toughness are required at the high operating temperatures. Mechanical properties are a function of the final microstructure of the metal. The microstructure is a function of the strain, strain rate, and temperature history. The final grain size is dependent upon the annealing time and temperature, assuming the minimum required amount of strain is achieved.
1

2.2 Microstructure Nickel alloy 706 is age hardened by the coherent precipitation of γ’ and γ” in an austenitic matrix. The precipitation behavior is strongly affected by the annealing parameters. [2] The slow growth kinetics of the γ” strengthening phase in alloy 706 allow it to be used in components with large cross sections because it will not over-age during heat treatment. [1] The strengthening phases γ’ and γ” dissolve at heat treatment temperatures above 1625°F, though typical heat treatment temperatures range between 1800°F and 1850°F to prevent eta and Laves precipitation. [1] Table 2 lists the major precipitates in alloy 706. Precipitate Structure Morphology Composition Gamma Prime (γ’) Ordered Face Centered Cubic Spheres Ni3(Al,Ti) Gamma Double Prime (γ”)
Ordered Body Centered Tetragonal
Disks Ni3Nb
Laves Hexagonal Close Packed Globular (Fe,Ni)2Nb Eta (η) Hexagonal Close Packed Platelets or Cellular Ni3Ti Delta (δ) Orthorhombic Needles Ni3Nb Table 2. Major precipitates in alloy 706 [1]
2.4 Previous Related Work Previous experimental work [1] has led to several conclusions relating strain and recrystallization. They found that there is a minimum strain of 0.15 (forged at 1950°F) required to attain full static recrystallization when solution heat treated above 1750°F. Dynamic recrystallization in alloy 706 is not completed during forging due to the slow strain rates during forging and the total forging strains of up to 0.7 inch/inch. Static recrystallization will not occur below 1700°F, but it can be achieved above 1750°F.
2

3.0 EXPERIMENTAL PROCEDURE A nickel alloy 706 specimen was forged to induce varying amounts of strain. Pieces of this forging were then subjected to different time and temperature combinations of heat treatment to determine at what time and temperature combination recrystallization is completed. Recrystallization was analyzed via metallography and as a function of hardness. 3.1 Strain Calculations The first part of the experiment was to induce known amounts of strain into the nickel alloy test piece. True strain is calculated as
=
fT l
l0lnε (Equation 1)
where εT is the true strain in units of in/in, l0 is the initial height in inches, and lf is the final height in inches. True strain is additive, and the total strain is calculated as the sum of all the amounts of strain induced during the various hot working operations. Strain ranges between 0.0 and 1.5 (in/in) true strain were tested in this experiment. A stepped hand forging configuration was chosen to allow a range of strains to be evaluated in one piece. Starting with a rectangular block of dimensions 10” x 10” x 30”, the block was reduced in two successive operations to heights of 10”, 6.07”, 3.68”, and 2.23”, respectively, to give total strains of 0.0, 0.5, 1.0, and 1.5 (in/in) true strain. This is shown schematically in Figure 1, and the strain calculations are shown in Table 3.
10"6.07 3.68
10
2.23
10"
10"
30"
10"7.79 6.07 4.72
10
Figure 1. Forging schematic
Section Initial Height
(in.)
First Forging
Height (in.)
Second Forging
Height (in.)
True Strain from First Forging
True Strain from Second
Forging
Cumulative True Strain
(in./in.) 1 10 10 10 0.0 0.0 0.0 2 10 7.79 6.07 0.25 0.25 0.5 3 10 6.07 3.68 0.5 0.5 1.0 4 10 4.72 2.23 0.75 0.75 1.5
Table 3. Strain calculations
3

3.2 Computer-Aided Engineering Simulations Following these calculations, computer simulations were run to evaluate the effective strain of the part. Parameters that were considered in the simulation were the dimensions, temperature of the forging operations, strain rates, and transfer times. The accumulated strain was simulated using the computer-modeling program DEFORM-3D by Scientific Forming Technologies Corporation. DEFORM 3D is a commonly used computer-aided engineering finite element analysis in the forging industry. It has the capability to simulate deformation processes such as hammer forging, mechanical press forging, hydraulic press forging, rolling, and extrusion. 3.3 Forming 3.3.1 Cutting and Flattening A sample of approximately 1400 lbs. (635 kg) of nickel alloy 706 was first cut to size and then underwent a “flattening” operation above 2000°F. All forging operations were performed on a 3000-ton capacity hydraulic press. After conditioning, the remaining weight was approximately 1000 lbs (454 kg). 3.3.2 Hot Working Operation An initial high temperature operation was necessary to erase prior working history and produce an equiaxed microstructure. The metal sample was subjected to three upset and draw operations above 2000°F and then forged to dimensions of 10” x 10” x 30”. The piece was then air cooled to room temperature. When alloy 706 is worked at temperatures above 2000°F, it does not store any strain energy. Any strain energy that is put into the material is immediately recrystallized out. Therefore, this initial operation was not included in strain calculations. 3.3.3 Stepped Hand Forging Operation The piece was forged into a four-stepped hand forging, inducing 0.0, 0.5, 1.0, and 1.5 (in/in) true strain, respectively, to the final dimensions shown in Figure 2. After forging, the piece was air quenched to room temperature.
εT = 0.0
Figure 2. Final shape of the nickel alloy piece
εT = 0.5 6.07” 3.68” εT = 1.0 εT = 1.5 10”
17.4” 14.5”
12.8” 12.8”
2.23”
4

3.4 Sample Acquisition Thirty samples of approximately 1” cube dimensions were removed from each of the four strain areas for a total of 120 samples. The samples were removed from the center of the stepped sections to give the most uniform amount of strain. If samples were taken too close to the edge, there would be frictional effects on the strain. The stepped hand forging was cut as shown in the following figure, and samples used for metallography and hardness testing were taken from each section.
Metallographic and Hardness Samples
30 Samples of 0.0 Strain 30 Samples of 0.5 Strain 30 Samples of 1.0 Strain 30 Samples of 1.5 Strain
Figure 3. Metallographic and hardness sample acquisition 3.5 Heat Treatment For alloy 706, typical industry practice utilizes an annealing temperature of 1800°F, above the η solvus (~1778°F). In this experiment, three different annealing temperatures were tested: 1785°F, 1800°F, and 1815°F. For each combination of annealing temperature and true strain, there were 10 timed samples. The ten samples were pulled out of the solution heat treatment furnace at various times and water quenched. To normalize the heat treatment times at the three different temperatures, the Larson-Miller Parameter was used. The Larson-Miller parameter for nickel alloy 706 is:
)10)(log30)(460( 3−++= tTLMP (Equation 2)
where T is the temperature in degrees Fahrenheit and t is the time in hours. The Larson-Miller parameter is used to extrapolate creep rupture data beyond the limits of practical laboratory testing. Based upon the fact that creep is a thermally activated process, it correlates the time to failure (i.e. rupture) and absolute temperature at a constant engineering stress.
Recrystallization is similarly a diffusion-controlled process that is dependent upon both time and temperature. For the timed samples, the Larson-Miller Parameters were held constant, and the times were calculated from these values. The test times ranged from 0 minutes to 5.5 hours with more time at the lower heat treatment temperature and less time at the higher temperature. In Figure 4, the heat treatment times are plotted as a function of the Larson-Miller Parameter. 5

Heat Treatment Time
10
100
1000
66.5 67.0 67.5 68.0 68.5 69.0 69.5Larson-Miller Parameter
Tim
e (m
inut
es)
1785 ºF1800 ºF1815 ºF
Figure 4. Heat treatment time as a function of the Larson-Miller parameter
3.6 Hardness Testing The samples were rough ground with a 60-grit silicon carbide paper and then tested for hardness on a Rockwell Hardness Tester manufactured by Wilson Mechanical Instrument Company, Inc. For the B Scale, a 1/16th inch steel ball is used with a 100 kg load. Each sample was tested three times. 3.7 Sample Preparation and Metallography Based on the results from the hardness testing, thirty-six of the samples were selected for metallographic analysis. The samples were mounted in epoxy and mechanically prepared to a 1200-grit silicon carbide finish. An electropolishing system was then used to polish the samples. Each sample was subjected to 20 Volts at a current density range of 4.8 to 7.2 mA/mm2 for 20 seconds. The Seven Acids swab etch was chosen for alloy 706 because it shows grain boundaries, phases, and precipitates present. Each polished sample was lightly swab etched for 30 seconds and then rinsed with water and dried. Representative micrographs of the thirty-six samples were taken at 100x magnification on Polaroid film.
6

3.8 Processing Profile Figure 5 shows a processing profile schematic of the experimental procedure.
Ambient
Tem
pera
ture
(°F)
Time
ε = 0
1815°F
1800°F
1785°F
100% Recrystallization
Achieved
Solution Heat Treatment
Finish Operations 1720 - 1900°F
Hot Work Above 2000°F
Figure 5. Processing profile
7
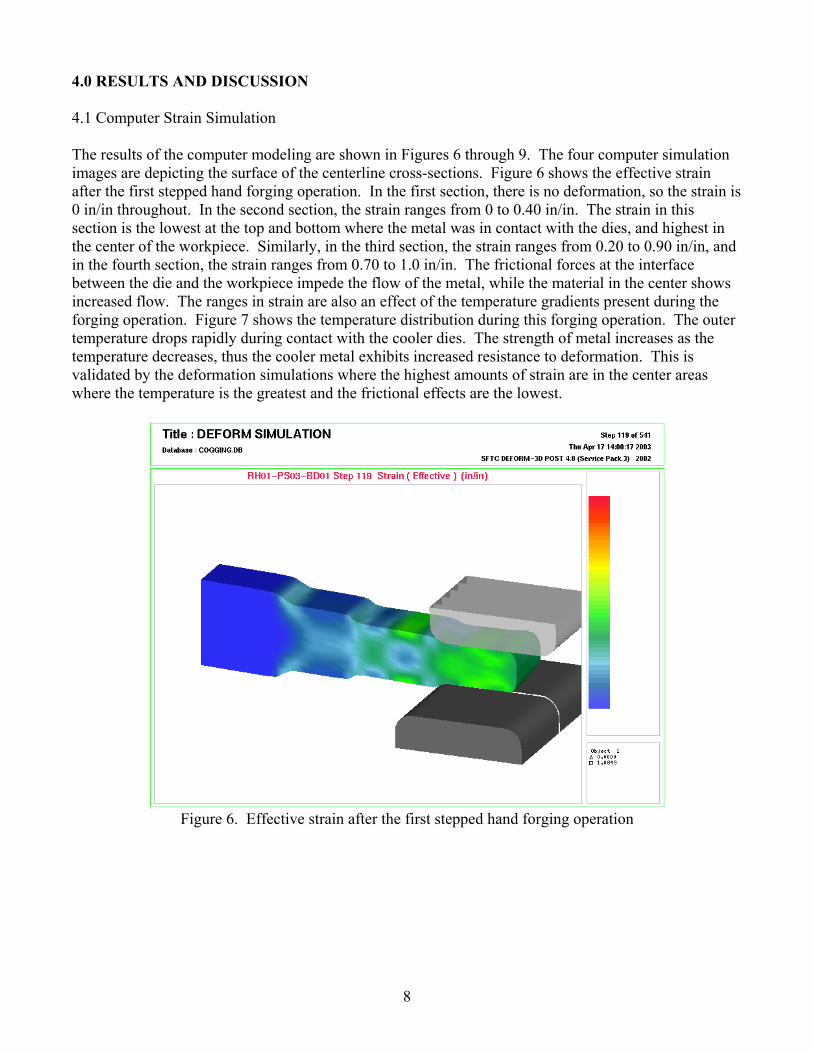
4.0 RESULTS AND DISCUSSION 4.1 Computer Strain Simulation The results of the computer modeling are shown in Figures 6 through 9. The four computer simulation images are depicting the surface of the centerline cross-sections. Figure 6 shows the effective strain after the first stepped hand forging operation. In the first section, there is no deformation, so the strain is 0 in/in throughout. In the second section, the strain ranges from 0 to 0.40 in/in. The strain in this section is the lowest at the top and bottom where the metal was in contact with the dies, and highest in the center of the workpiece. Similarly, in the third section, the strain ranges from 0.20 to 0.90 in/in, and in the fourth section, the strain ranges from 0.70 to 1.0 in/in. The frictional forces at the interface between the die and the workpiece impede the flow of the metal, while the material in the center shows increased flow. The ranges in strain are also an effect of the temperature gradients present during the forging operation. Figure 7 shows the temperature distribution during this forging operation. The outer temperature drops rapidly during contact with the cooler dies. The strength of metal increases as the temperature decreases, thus the cooler metal exhibits increased resistance to deformation. This is validated by the deformation simulations where the highest amounts of strain are in the center areas where the temperature is the greatest and the frictional effects are the lowest.
Figure 6. Effective strain after the first stepped hand forging operation
8

Figure 7. Temperature profile during the first stepped hand forging operation
Figure 8 shows the cumulative effective strains after the second, and final, stepped hand forging operation. The temperature profile is shown in Figure 9. Again, the first section did not receive any deformation, so the cumulative strain remains 0 in/in throughout. The second section shows ranges of strain from 0.30 to 0.70 in/in. The third section shows strains from 0.7 to 1.3 in/in, and the fourth section shows strains from 0.90 to 2.00 in/in. The variation in strain throughout the sections is why hardness and metallographic samples were taken from the center areas. The strain is not constant in the center, but it does demonstrate less variability.
9

Figure 8. Cumulative effective strain after the final stepped hand forging operation
Figure 9. Temperature profile during the final stepped hand forging
10

Table 4 compares the calculated strains to the strains based upon the results of the deformation simulations.
Section
Calculated Strain (in/in)
Strain Based upon Deformation Simulation (in/in)
1 0.0 0.0 2 0.5 0.45 – 0.70 3 1.0 0.90 – 1.10 4 1.5 1.50 – 1.90
Table 4. Strains in samples 4.2 Hardness Results Hardness measurements indicate when recrystallization is completed. Figure 10 shows the significant drop in hardness when recrystallization is completed as verified by the microstructures.
Hardness as a Function of Annealing Temperature and Time
75
80
85
90
95
100
105
110
0 20 40 60 80 100 120 140
Annealing Time (minutes)
HR
B
1785, 0.5 Strain1785, 1.0 Strain1785, 1.5 Strain1800, 0.5 Strain1800, 1.0 Strain1800, 1.5 Strain1815, 0.5 Strain1815, 1.0 Strain1815, 1.5 Strain
Unrecrystallized (before Annealing)
Recrystallized
Figure 10. Hardness as a function of annealing temperature and time
11

4.3 Microstructure and Hardness Results before Annealing Figures 11, 12, 13, and 14 show the initial microstructures prior to heat treatment for 0.0, 0.5, 1.0, and 1.5 true strain, respectively. Figure 11 shows a relatively equiaxed grain structure. Figures 12, 13, and 14 show increasing deformation as a function of increased strain.
Figure 11. T = N/A, ε = 0.0, t = 0 minutes
Figure 12. T = N/A, ε = 0.5, t = 0 minutes
Figure 13. T = N/A, ε = 1.0, t = 0 minutes
Figure 14. T = N/A, ε = 1.5, t = 0 minutes
100 µm 100 µm
The average hardness readings for the unannealed samples as a function of the amount of strain are listed in Table 5. The material from the 0.0 strain area has a significantly lower hardness reading than the other areas that received strain. The material from the 0.5, 1.0, and 1.5 strain areas have statistically similar hardness readings.
Table 5. Average hardness as a function of strain prior to annealing
Strain (in/in)
Average Rockwell Hardness
Measurement 0.0 95.9 ± 2.7 0.5 105.0 ± 1.1 1.0 105.4 ± 1.0 1.5 105.7 ± 0.8
100 µm 100 µm
12

4.4 Strain Effects There is a minimum amount of strain required to complete recrystallization. Previous research [1] found that a minimum strain of 0.15 is required to attain full static recrystallization in alloy 706 when solution heat treated above 1750ºF. In this experiment, the first section of the hand forging was calculated to have 0.0 true strain because it was not forged after the hot work operation above 2000°F. As previously stated, forging above 2000ºF does not retain strain because the thermal energy is so high. Figure 15 received 0.0 strain and was not heat treated. It shows relatively equiaxed undeformed grains that are not capable of recrystallization.
100 µm
Figure 15. T = N/A, ε = 0.0, t = 0 minutes
The grains grow as a function of time and temperature. After various times of heat treatment at the different temperatures, all samples exhibit substantial grain growth. There is increased grain growth with increasing time and temperature. Figure 16 was heat treated for 60 minutes at 1815ºF. See Appendix B for additional micrographs.
100 µm
Figure 16. T = 1815ºF, ε = 0.0, t = 60 minutes This shows that grains that do not receive sufficient deformation will not recrystallize. Furthermore, when they are heat treated, they will undergo substantial grain growth that will have deleterious effects on the properties of the final forged parts.
13

Increased deformation also produces smaller grains after heat treatment. Figures 17, 18, 19 and 20 were all heat treated at 1785°F for 42 minutes and then water quenched. The difference between the samples was the amount of deformation they received prior to heat treatment. This is illustrated in the following four figures. Figure 20 has the smallest grain size because it received the most prior deformation, followed by Figures 19, 18, and 17, respectively.
Figure 17. T = 1785ºF, ε = 0.0, t = 42 minutes
Figure 18. T = 1785ºF, ε = 0.5, t = 42 minutes
Figure 19. T = 1785ºF, ε = 1.0, t = 42 minutes
Figure 20. T = 1785ºF, ε = 1.5, t = 42 minutes
100 µm 100 µm
100 µm 100 µm
14

4.5 Annealing Time Effects
The following 6 micrographs show the microstructure as a function of annealing time. The samples were from the 1.5 strain section, and all were heat treated at 1815ºF for times ranging from 0 minutes to 128 minutes. By 17 minutes, the microstructure is completely recrystallized. Further time exposure leads to dramatic grain growth.
Figure 21. T = N/A, ε = 1.5, t = 0 minutes
Figure 22. T = 1815ºF, ε = 1.5, t = 17 minutes
Figure 23. T = 1815ºF, ε = 1.5, t = 28 minutes
Figure 24. T = 1815ºF, ε = 1.5, t = 36 minutes
Figure 25. T = 1815ºF, ε = 1.5, t = 60 minutes
Figure 26. T = 1815ºF, ε = 1.5, t = 128 minutes
100 µm 100 µm
100 µm 100 µm
100 µm 100 µm
15

Grain growth as a function of annealing time is evident at all combinations of strain and temperature. At 1785ºF and 0.5 strain, Figures 27, 28, and 29 show the microstructure before annealing, after 42 minutes, and after 151 minutes, respectively.
100 µm
Figure 27. T = N/A, ε = 0.5, t = 0 minutes
100 µm
Figure 28. T = 1785ºF, ε = 0.5, t = 42 minutes
100 µm
Figure 29. T = 1785ºF, ε = 0.5, t = 151 minutes
16

At 1800ºF and 1.0 strain, Figures 30, 31, and 32 show the microstructure before annealing, after 27 minutes, and after 95 minutes, respectively.
100 µm
Figure 30. T = N/A, ε = 1.0, t = 0 minutes
100 µm
Figure 31. T = 1800ºF, ε = 1.0, t = 27 minutes
100 µm
Figure 32. T = 1800ºF, ε = 1.0, t = 95 minutes
17

4.6 Annealing Temperature Effects When strain and time are held constant, the effects of temperature can be analyzed. Figure 33 received 1.5 strain and was heat treated at 1785ºF for 42 minutes. Figure 34 also received 1.5 strain and was heat treated at 1815ºF for 36 minutes. There is a considerable difference in grain size as shown in between Figures 33 and 34. Similarly, the differences between 1800˚F and 1815˚F are shown in Figures 35 and 36.
Figure 33. T = 1785ºF, ε = 1.5, t = 42 minutes
Figure 34. T = 1815ºF, ε = 1.5, t = 36 minutes
Figure 35. T = 1800ºF, ε = 1.5, t = 27 minutes
Figure 36. T = 1815ºF, ε = 1.5, t = 28 minutes
100 µm 100 µm
100 µm 100 µm
18

5.0 CONCLUSIONS From the data obtained and statistical analysis performed in this experiment, the following conclusions can be made: 1. Complete recrystallization is achieved for all combinations of strain (i.e. 0.5, 1.0, and 1.5) and
annealing temperature (i.e. 1785 F, 1800ºF, and 1815ºF). 2. Hardness measurements are an effective means for demonstrating recrystallization. 3. All specimens exhibit some degree of grain growth, regardless of processing parameters, as revealed
by metallography. 4. Increased annealing temperature generates larger grains as a function of annealing time. 5. Increased strain produces smaller grains after annealing. 6.0 RECOMMENDATIONS Based on the results of this experiment and the desired objective, the following recommendations are made for further research: 1. All the combinations of strain and annealing temperature demonstrated 100% recrystallization
within the first annealing time increment as tested in this experiment. To determine the minimum time required to complete recrystallization at each time and annealing temperature combination, smaller time increments should be investigated.
2. Additional combinations of strain and annealing temperature should be investigated. This
experiment investigated cumulative true strains of 0.0, 0.5, 1.0, and 1.5 (in/in). To more fully understand the dependence of recrystallization upon the amount of strain, a broader range of strains should be investigated.
3. Thermal modeling of heat treatment should be explored to determine the temperature profile of
actual parts. 4. The grain growth as a function of strain, annealing time, and annealing temperature should be
analyzed in greater detail.
19

20
REFERENCES 1 Schilke, Peter W., J.J. Pepe, and Robin C. Schwant. “Alloy 706 Metallurgy and Turbine Wheel
Application.” Superalloys 718, 625, 706 and Various Derivatives. Ed: E.A. Loria. Warrendale: The Minerals, Metals & Materials Society, 1994. (1-12).
2 Shibata, Takashi, Tatsuya Takahashi, Junichi Taira, and Terutaka Kure. “Superalloy 706 Large Forgings by
ESR.” Superalloys 718, 625, 706 and Various Derivatives. Ed: E.A. Loria. Warrendale: The Minerals, Metals & Materials Society, 2001. (161-172).
WORKS CITED Byrne, J. Gerald. Recovery, Recrystallization, and Grain Growth. New York: The MacMillan Company, 1965. Dieter, George E. Mechanical Metallurgy. 3rd Ed. New York: McGraw-Hill, Inc., 1986. Fesland, J.P. and P. Petit. “Manufacturing Alloy 706 Forgings.” Superalloys 718, 625, 706 and Various Derivatives. Ed:
E.A. Loria. Warrendale: The Minerals, Metals & Materials Society, 1994. (229-238). Heck, Karl A. “The Time-Temperature-Transformation Behavior of Alloy 706.” Superalloys 718, 625, 706 and Various
Derivatives. Ed: E.A. Loria. Warrendale: The Minerals, Metals & Materials Society, 1994. (393-404.) Hu, Hsun. “Recovery, Recrystallization, and Grain-Growth Structures.” Metals Handbook. Ninth Edition. Volume Nine:
Metallography and Microstructures. Metals Park: American Society for Metals, 1985. Kalpakjian, Serope. Manufacturing Processes for Engineering Materials. Addison-Wesley Publishing Co., Inc., 1984. Kuhlman, G.W., A.K. Chakrabarti, R.A. Beaumont, E.D. Seaton, and J.F. Radavich. “Microstructure-Mechanical Properties
Relationships in Inconel 706 Superalloy.” Superalloys 718, 625, 706 and Various Derivatives. Ed: E.A. Loria. Warrendale: The Minerals, Metals & Materials Society, 1994. (441-450).
Russo, Patrick A. and Stan R. Seagle. “Deformation and Recrystallization of Titanium and Its Alloys.” Titanium and Its
Alloys. ASM International, 1994. Schilke, Peter W., J.J. Pepe, and Robin C. Schwant. “Alloy 706 Metallurgy and Turbine Wheel Application.” Superalloys
718, 625, 706 and Various Derivatives. Ed: E.A. Loria. Warrendale: The Minerals, Metals & Materials Society, 1994. (1-12).
Schilke, Peter W. and Robin C. Schwant. “Alloy 706 Use, Process Optimization, and Future Directions for GE Gas Turbine
Rotor Materials.” Superalloys 718, 625, 706 and Various Derivatives. Ed: E.A. Loria. Warrendale: The Minerals, Metals & Materials Society, 2001. (25-34).
Schönfeld, K.H., B. Donth, M.G. Cambi, S.V. Thamboo, and M.P. Manning. “Manufacturing and Properties of a Large
Alloy 706 Disc Made by the Open Die Forging Process.” Superalloys 718, 625, 706 and Various Derivatives. Ed: E.A. Loria. Warrendale: The Minerals, Metals & Materials Society, 2001. (185-192).
Smith, William F. Principles of Materials Science and Engineering. 3rd Edition. New York: McGraw-Hill, Inc., 1996. Thamboo, Samuel V. “Thermomechanical Behavior and Microstructure Development.” Superalloys 718, 625, 706 and
Various Derivatives. Ed: E.A. Loria. Warrendale: The Minerals, Metals & Materials Society, 1997. (211-217).