Research Article Recrystallization from a Three-Grain...
7
Research Article Recrystallization from a Three-Grain Crystalline Iron Bo Zhao, 1,2 Shanshan Chen, 1,2 Jinfan Huang, 2 and Lawrence S. Bartell 2 1 Department of Chemistry, Nanjing Normal University, Nanjing, China 2 Department of Chemistry, University of Michigan, 930 N. University Avenue, Ann Arbor, MI 48109, USA Correspondence should be addressed to Jinfan Huang; [email protected] Received 30 August 2014; Revised 27 December 2014; Accepted 28 December 2014 Academic Editor: V´ ıctor Lav´ ın Copyright © 2015 Bo Zhao et al. is is an open access article distributed under the Creative Commons Attribution License, which permits unrestricted use, distribution, and reproduction in any medium, provided the original work is properly cited. e solid state recrystallization and grain boundary migrations in an iron nanoparticle Fe 2616 with three grains were studied by a molecular dynamics simulation. It was found that nucleation rates could be determined as the smaller grains were consumed by the larger ones. Moreover, the grain disorder was more important than the misorientation angle in governing the rates. Suggestions about the critical nuclei for the recrystallization are proposed. No obvious interaction between the grain boundaries was observed in the example studied in this report. 1. Introduction Recrystallization is the formation of a new grain structure in a solid material by the migration of grain boundaries that results in larger grains. is spontaneous process is considered to be driven by the excess energy in grain boundaries [1] but we have found that grain disorder is also important. Most industrial metals contain numerous grains and the new grain structure forms when larger grains grow by consuming the smaller adjacent ones. Understanding of the details of the solid state recrystallization behavior of metals and semiconductors in the thermomechanical or annealing processes is of importance because it can have a strong influence on the microstructure and texture of solids. From an understanding of this, a metallurgist is able to control the microstructure of metals and therefore improve the properties during thermomechanical processing. And material scientists may be able to control the crystal growth in the semiconductor industries once they understand the principles of recrystallization. However, several aspects of recrystallization, such as the almost universally proposed nucleation and grain boundary migration, are poorly under- stood at the atomic level [1–3]. Consequently computer molecular dynamics (MD) simulations provide an alternative and promising approach to study aspects of solid state recrystallization. Because none of the crystalline grains in this MD study are completely surrounded by other grains in the simulations, the behavior is not directly analogous to the behavior of grains in bulk studies but it is an initial step in understanding what happens when small grains are consumed by larger ones. In the past decade, we have used the MD technique to study nucleation in the crystallization of molten materials and in phase transitions between different solid phases of nanometer size. To explore recrystallization in solids, we began an MD study on the simplest system, an iron nanoparticle Fe 1436 with only two grains, and observed the thermal annealing process [4]. We found that the rate of transformation is not necessarily determined by the degree of misorientation between the grains, as seems to be the case in bulk experiments. Instead, the degree of the disorder of the starting grains plays a more important role. Although the interfacial migration does not differ from that in the earlier study, the dependence on grain size and relative stability of the grains can be observed. We are approaching the problem of solid state recrystallization in stages of complexity in order to better interpret the atomic activity involved. In this paper we report the MD simulation results on an iron nanoparticle, Fe 2616 , which included three grains with a larger grain in the middle and sandwiched by two smaller grains. 2. Computational Procedures 2.1. Generation of Polycrystalline Nanoparticles for Recrystal- lization Study. Molecular dynamics simulations were per- formed on a solid state polycrystalline iron nanoparticle Hindawi Publishing Corporation Journal of Solid State Physics Volume 2015, Article ID 549314, 6 pages http://dx.doi.org/10.1155/2015/549314
Transcript of Research Article Recrystallization from a Three-Grain...
Research ArticleRecrystallization from a Three-Grain Crystalline Iron
Bo Zhao,1,2 Shanshan Chen,1,2 Jinfan Huang,2 and Lawrence S. Bartell2
1Department of Chemistry, Nanjing Normal University, Nanjing, China2Department of Chemistry, University of Michigan, 930 N. University Avenue, Ann Arbor, MI 48109, USA
Correspondence should be addressed to Jinfan Huang; [email protected]
Received 30 August 2014; Revised 27 December 2014; Accepted 28 December 2014
Academic Editor: Vıctor Lavın
Copyright © 2015 Bo Zhao et al.This is an open access article distributed under the Creative Commons Attribution License, whichpermits unrestricted use, distribution, and reproduction in any medium, provided the original work is properly cited.
The solid state recrystallization and grain boundary migrations in an iron nanoparticle Fe2616
with three grains were studied by amolecular dynamics simulation. It was found that nucleation rates could be determined as the smaller grains were consumed bythe larger ones. Moreover, the grain disorder was more important than the misorientation angle in governing the rates. Suggestionsabout the critical nuclei for the recrystallization are proposed. No obvious interaction between the grain boundaries was observedin the example studied in this report.
1. Introduction
Recrystallization is the formation of a new grain structurein a solid material by the migration of grain boundariesthat results in larger grains. This spontaneous process isconsidered to be driven by the excess energy in grainboundaries [1] but we have found that grain disorder isalso important. Most industrial metals contain numerousgrains and the new grain structure forms when larger grainsgrowby consuming the smaller adjacent ones.Understandingof the details of the solid state recrystallization behaviorof metals and semiconductors in the thermomechanical orannealing processes is of importance because it can have astrong influence on the microstructure and texture of solids.From an understanding of this, a metallurgist is able tocontrol the microstructure of metals and therefore improvethe properties during thermomechanical processing. Andmaterial scientists may be able to control the crystal growthin the semiconductor industries once they understand theprinciples of recrystallization. However, several aspects ofrecrystallization, such as the almost universally proposednucleation and grain boundary migration, are poorly under-stood at the atomic level [1–3]. Consequently computermolecular dynamics (MD) simulations provide an alternativeand promising approach to study aspects of solid staterecrystallization. Because none of the crystalline grains inthis MD study are completely surrounded by other grainsin the simulations, the behavior is not directly analogous
to the behavior of grains in bulk studies but it is an initialstep in understanding what happens when small grains areconsumed by larger ones.
In the past decade, we have used the MD technique tostudy nucleation in the crystallization of molten materialsand in phase transitions between different solid phasesof nanometer size. To explore recrystallization in solids,we began an MD study on the simplest system, an ironnanoparticle Fe
1436with only two grains, and observed the
thermal annealing process [4]. We found that the rate oftransformation is not necessarily determined by the degreeof misorientation between the grains, as seems to be the casein bulk experiments. Instead, the degree of the disorder ofthe starting grains plays a more important role. Although theinterfacial migration does not differ from that in the earlierstudy, the dependence on grain size and relative stability ofthe grains can be observed. We are approaching the problemof solid state recrystallization in stages of complexity in orderto better interpret the atomic activity involved. In this paperwe report the MD simulation results on an iron nanoparticle,Fe2616
, which included three grains with a larger grain in themiddle and sandwiched by two smaller grains.
2. Computational Procedures
2.1. Generation of Polycrystalline Nanoparticles for Recrystal-lization Study. Molecular dynamics simulations were per-formed on a solid state polycrystalline iron nanoparticle
Hindawi Publishing CorporationJournal of Solid State PhysicsVolume 2015, Article ID 549314, 6 pageshttp://dx.doi.org/10.1155/2015/549314
2 Journal of Solid State Physics
(a) Starting point (b) Molten droplet at 1680K
(c) One of 18 molten particles withdifferent thermal history
(d) Polycrystal after quenching to850K
(e) Polycrystal after quenching to850K
(f) Polycrystal after quenching to 850K
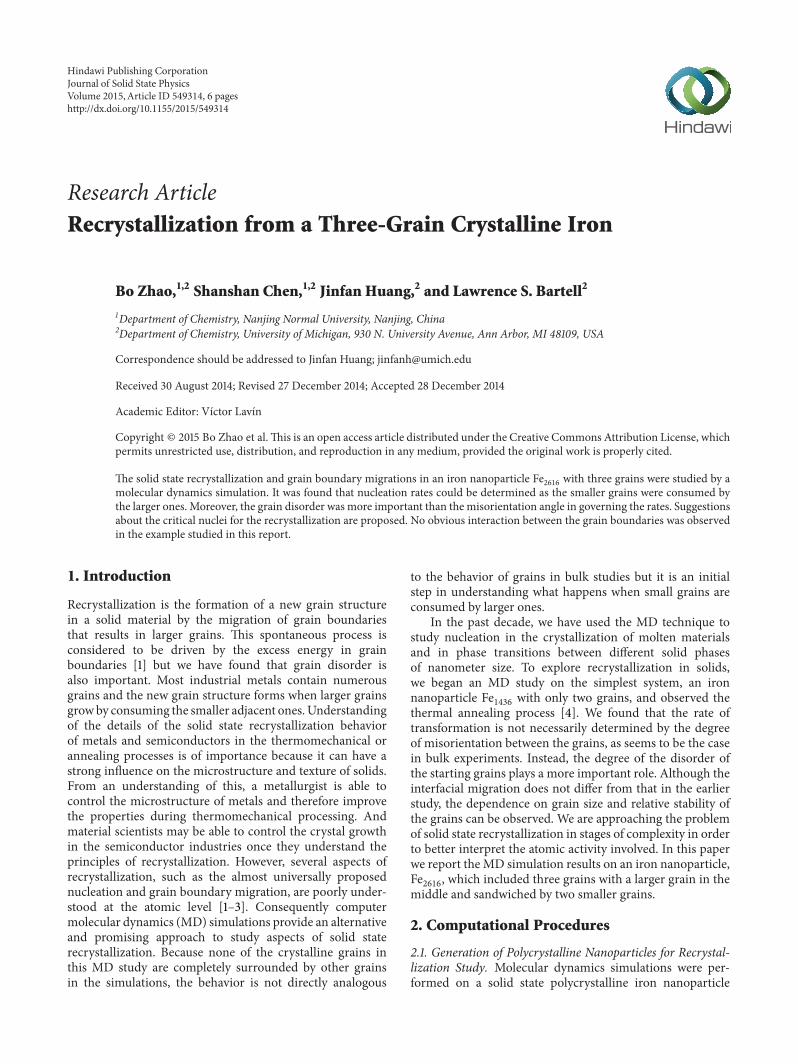
Figure 1: Images of the nanoparticles from various processing stages and different quenching runs.
Fe2616
. The program XMD [5] was employed to carry out thesimulationwith an embedded-atommethod (EAM)potential[6, 7] and 2 fs time step was used in all of the simulations.
The studied quasispherical iron particle containing 2616iron atoms was first cut from a body-center cubic (BCC)lattice of iron (Figure 1(a)).TheMDsimulations began at con-stant temperature with 50,000 time steps in a bath at 200K.A series of heating stages started at 300K with increments of20K; each stage was run at constant temperature for 50,000time steps. The Fe
2616nanoparticle was heated to 1680K
to obtain a completely melted nanodroplet (Figure 1(b)).The molten nanodroplet was then cooled to 1660K andsimulations were continued to form 18 Fe
2616nanodroplets
with different thermal histories, each with 50,000 more timesteps than the previous one.
One image of molten particles is given in Figure 1(c).These 18 melted Fe
2616nanodroplets were quenched into
heat bath at a temperature of 850K, and all of them froze
into polycrystalline nanoparticles. Figures 1(d), 1(e), and 1(f)show the images of three of them. The nanoparticle withthree grains as depicted in Figure 1(f) was selected for therecrystallization.
To observe the stochastic behavior of the recrystalliza-tion, it is necessary to generate ensembles of systems withdifferent thermal histories.Therefore the selected three-grainpolycrystalline particle shown in Figure 1(f) was then heatedat 900K, to generate 18 particles, each particle experiencing2000more time steps than the previous one.These 18 particleswere then annealed at constant temperature in a heat bath of850K. The simulation time length for each member of theensemble at this stage was determined by the formation ofthe final single crystalline solid.
2.2. Analysis of the Recrystallization Process. Recrystallizationis said to be initiated by nucleation. What is observed tohappen is that the crystalline planes of the smaller grains
Journal of Solid State Physics 3
become disrupted, making the grain appear to becomeamorphous. Then some stochastic, first-order process beginsto form crystalline planes coincident with those of thelarger, adjacent crystal. While this process has some ofthe earmarks of nucleation, regrettably we so far lack anadequate knowledge of the characteristics defining nuclei forrecrystallization.
The recrystallization of grain structure is accompanied byenergy changes. Therefore a transition in a given particle canbe recognized by a sudden change in the slope of energy as afunction of temperature during an annealing run.Monitoringstructural changes is an effective alternative analysis methodto energy, during freezing and recrystallization. Structuralchanges were followed by observing the linearity in the arraysof atoms corresponding to BCC cell edges. Deviations fromlinearity disclosed dislocations.
For an ideal BCC lattice, each atom and its nearest 8coordination atoms, the corner atoms, form a body-centeredcubic unit cell. Each atom in an array along cell edges islocated at the crossing point of three orthogonal axes thatconnect the corners of the cells. Taking this crossing of centralatoms as an origin, at the ends of the three orthogonal celledges are 6 atoms appearing as sharp spots for a perfectcrystal. For the sake of simplicity, we only consider the linesconnecting an array of three atoms, with the central atom atthe corner of a BCC cell, which is shared by BCC cells inthe bulk case. For imperfectly packed nanoparticles these sixspots may be diffuse.
Line of three atoms along a cell edge may be far fromlinear because of a surface or other imperfections, and ifthere are fewer than three nearly orthogonal lines crossinga cell corner, we will refer to these cases as having fewerthan three “cross-overs” and use these in an analysis ofdislocations and surfaces. In determining the number of“cross-overs” we considered neighboring atoms within therange of 2.76–2.96 A lying along directions within 4∘ ofperfect orthogonality [4].
2.3. Estimation of Recrystallization Rate. Inasmuch as therecrystallization rate was observed to evolve into a first-orderprocess, it is possible to interpret results in terms of classicalnucleation theory as follows. The fraction of particles, inwhich a postulated nucleation site for recrystallization has notyet formed, obeys the first-order rate law
ln𝑁𝑛(𝑡)
𝑁0
= −𝐽𝑉𝑐(𝑡𝑛− 𝑡0) , (1)
where𝑁0is the total number of particles in the assembly,𝑉
𝑐is
the effective volume for the proposed nucleation, and 𝐽 is thenucleation rate, 𝑡
𝑛is the time at which the 𝑛th transition in the
set of𝑁0particles has taken place, 𝑡
0is the time lag to achieve
a steady state of precritical nuclei, and𝑁𝑛(𝑡) is defined as
𝑁𝑛(𝑡) = 𝑁
0− 𝑛 + 1. (2)
From the slope of the curve In[𝑁𝑛(𝑡)/𝑁0] versus (𝑡
𝑛− 𝑡0),
𝐽, the rate of recrystallization, can be obtained. The times 𝑡𝑛
in the ensemble are estimated from the sudden changes in
the energy-time curves of members of the ensemble. We take𝑉𝑐to be the volume of the layer with three-atom thick grain
boundary at the interface of the grain that is transforming. Toaccount for the appreciable statistical uncertainties associatedwith the stochastic nature of the hypothetical nucleationevents when𝑁
0is small, a weighted least-squares procedure
was carried out to determine 𝐽 and 𝑡0. Details are given in our
previous report [8].
3. Results
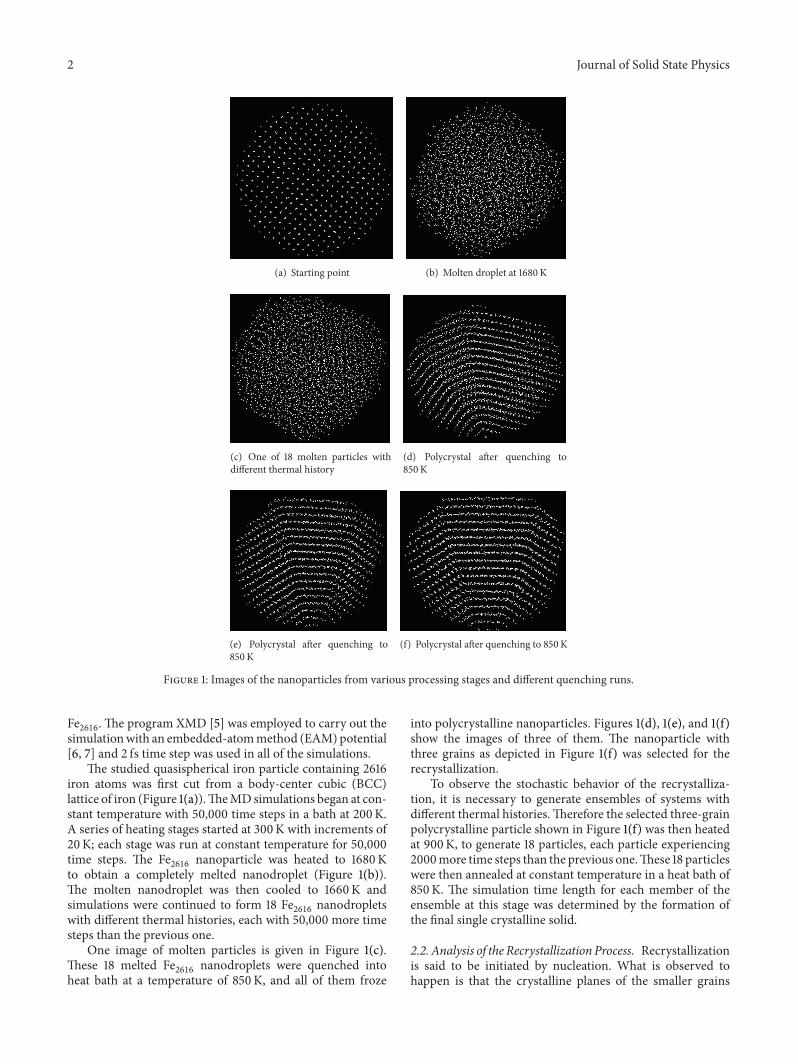
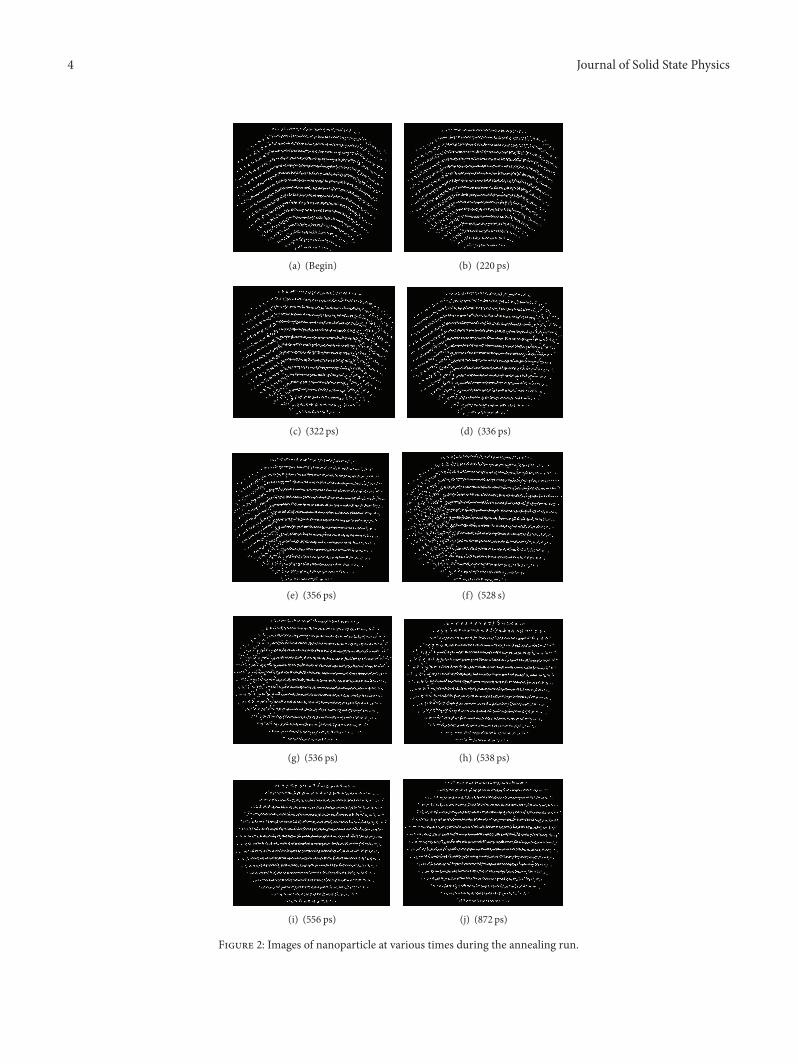
3.1. Grain Boundary Migration and Grain Growth. Figure 2displays images of a nanoparticle at various times duringthe annealing run from one of the 18 particles with differ-ent thermal histories. Laboratory experiments indicate thatrecrystallization proceeds first from the migration of highangle grain boundaries away from a more crystalline matrix.Whether this is true for simulations is considered in thefollowing. Migration is driven by the energy gradient acrossthe boundary between grains. For the displayed nanoparticlethe conspicuous change began when the particle had beenannealed for about 322 ps from the beginning. The imagechanged quickly after 322 ps and the entire reorganizationended within 34 ps while the smallest grain on the right sidewas completely transformed as shown in Figure 2(e). Thegrain boundary motion can be seen in the three snapshotsof such moving given in Figures 2(b), 2(c), and 2(d).
As seen in Figure 2, the left grain boundary remainsunchanged even after the right boundary has completelydisappeared (Figures 2(a)–2(e)). The recrystallization alongthis boundary started at 528 ps (Figure 2(f)), about 162 psafter the completion of the recrystallization of the right-handgrain. The grain growth and the grain boundary migrationspeed along this grain boundary were faster, and the particlefinally became a single crystal within 28 ps.The time range forthe recrystallization and the grain growth is between 322 psand 356 ps near the right grain boundary, while it is between528 ps and 556 ps along the left side boundary.
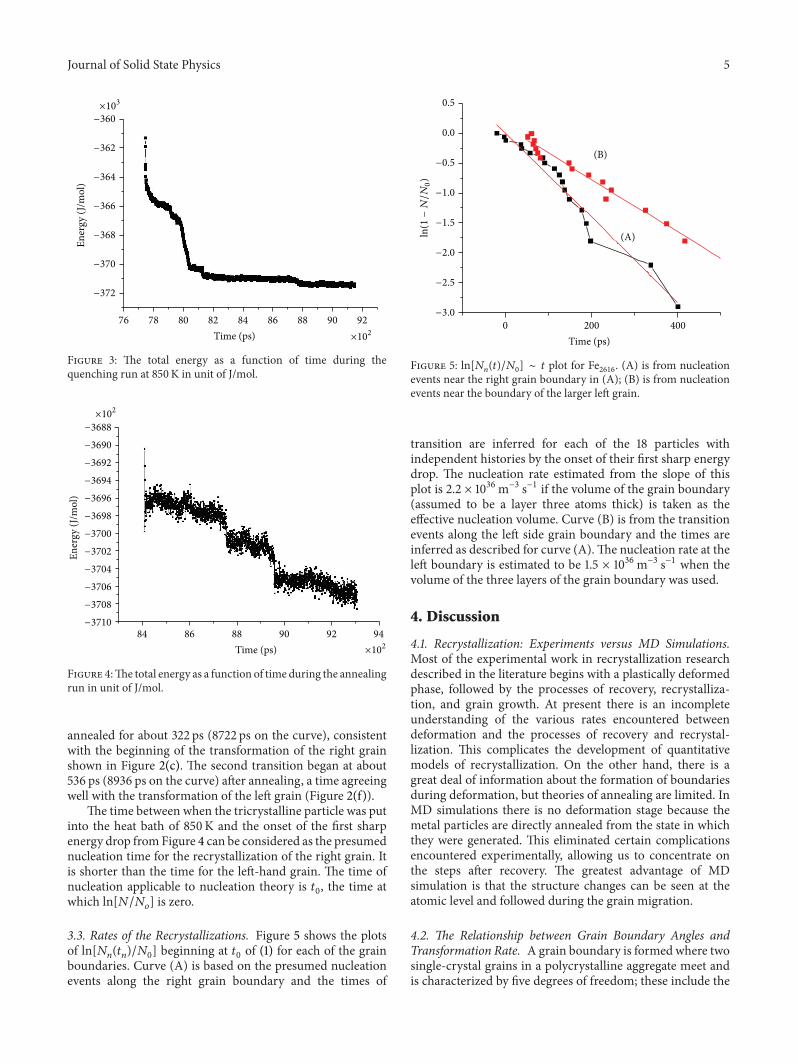
3.2. Strain Energy and Initiation of Recrystallization. Figure 3plots the total energy as a function of time that the moltendroplet spent in the 850K heat bath from the quenching runthat formed the tricrystalline particle shown in Figure 1(f).From Figure 3 it can be seen that when the molten dropletwas quenched into the heat bath of 850K the total energydropped very sharply around 7700 ps (this time including allthe heating history for the particle started at 200K) due tothe sudden temperature change that produced a supercooledliquid droplet (Figure 1(c)). The first sudden energy changeof the droplet at about 8000 ps in the curve correspondsto the freezing of the liquid droplet into a polycrystallinesolid (Figure 1(d)).The second sharp energy change indicatesa recrystallization process from the polycrystalline particletransforming from the droplet into a particle with threegrains (Figure 1(e)).
Figure 4 gives the total energy change at higher resolutionthan in Figure 3 from the annealing at 850K for the tricrys-talline particle selected (Figure 2(a)). Two sharp energy dropsare seen. The first one began when the nanoparticle was
4 Journal of Solid State Physics
(a) (Begin) (b) (220 ps)
(c) (322 ps) (d) (336 ps)
(e) (356 ps) (f) (528 s)
(g) (536 ps) (h) (538 ps)
(i) (556 ps) (j) (872 ps)
Figure 2: Images of nanoparticle at various times during the annealing run.
Journal of Solid State Physics 5
−360
−362
−364
−366
−368
−370
−372
×103
Ener
gy (J
/mol
)
76 78 80 82 84 86 88 90 92
Time (ps) ×102
Figure 3: The total energy as a function of time during thequenching run at 850K in unit of J/mol.
−3688
−3690
−3692
−3694
−3696
−3698
−3700
−3702
−3704
−3706
−3708
−3710
×102
Ener
gy (J
/mol
)
84 86 88 90 92 94
Time (ps) ×102
Figure 4:The total energy as a function of time during the annealingrun in unit of J/mol.
annealed for about 322 ps (8722 ps on the curve), consistentwith the beginning of the transformation of the right grainshown in Figure 2(c). The second transition began at about536 ps (8936 ps on the curve) after annealing, a time agreeingwell with the transformation of the left grain (Figure 2(f)).
The time between when the tricrystalline particle was putinto the heat bath of 850K and the onset of the first sharpenergy drop fromFigure 4 can be considered as the presumednucleation time for the recrystallization of the right grain. Itis shorter than the time for the left-hand grain. The time ofnucleation applicable to nucleation theory is 𝑡
0, the time at
which ln[𝑁/𝑁𝑜] is zero.
3.3. Rates of the Recrystallizations. Figure 5 shows the plotsof ln[𝑁
𝑛(𝑡𝑛)/𝑁0] beginning at 𝑡
0of (1) for each of the grain
boundaries. Curve (A) is based on the presumed nucleationevents along the right grain boundary and the times of
0 200 400
Time (ps)
(A)
(B)
0.5
0.0
−0.5
−1.0
−1.5
−2.0
−2.5
−3.0
ln(1
−N/N
0)
Figure 5: ln[𝑁𝑛(𝑡)/𝑁
0] ∼ 𝑡 plot for Fe
2616. (A) is from nucleation
events near the right grain boundary in (A); (B) is from nucleationevents near the boundary of the larger left grain.
transition are inferred for each of the 18 particles withindependent histories by the onset of their first sharp energydrop. The nucleation rate estimated from the slope of thisplot is 2.2 × 1036m−3 s−1 if the volume of the grain boundary(assumed to be a layer three atoms thick) is taken as theeffective nucleation volume. Curve (B) is from the transitionevents along the left side grain boundary and the times areinferred as described for curve (A).The nucleation rate at theleft boundary is estimated to be 1.5 × 1036m−3 s−1 when thevolume of the three layers of the grain boundary was used.
4. Discussion
4.1. Recrystallization: Experiments versus MD Simulations.Most of the experimental work in recrystallization researchdescribed in the literature begins with a plastically deformedphase, followed by the processes of recovery, recrystalliza-tion, and grain growth. At present there is an incompleteunderstanding of the various rates encountered betweendeformation and the processes of recovery and recrystal-lization. This complicates the development of quantitativemodels of recrystallization. On the other hand, there is agreat deal of information about the formation of boundariesduring deformation, but theories of annealing are limited. InMD simulations there is no deformation stage because themetal particles are directly annealed from the state in whichthey were generated. This eliminated certain complicationsencountered experimentally, allowing us to concentrate onthe steps after recovery. The greatest advantage of MDsimulation is that the structure changes can be seen at theatomic level and followed during the grain migration.
4.2. The Relationship between Grain Boundary Angles andTransformation Rate. A grain boundary is formed where twosingle-crystal grains in a polycrystalline aggregate meet andis characterized by five degrees of freedom; these include the
6 Journal of Solid State Physics
35∘
31∘
Figure 6:Grain boundarymisorientation angles of an Fe2616
particleat the beginning of an annealing run.
misorientation of the grains on either side of the boundary(two degrees of freedom for the axis of misorientation andone for the misorientation angle) and the plane of theinterface (two degrees of freedom). Once the boundary planeand the rotation axis are determined, then the smallestrotation angle around the rotation axis can be used for themisorientation between two crystal grains. Conventionally,grain boundaries are often grouped into low angle and highangle with the delimiting angle separating low from highangle boundaries of 15∘.
Our selected sample was annealed at constant temper-ature in a bath at 850K, and recrystallization events wereanalyzed at the atomic level. Figure 6 shows the grainboundary misorientation angles in our Fe
2616particle at the
beginning of an annealing run, viewed from a directionalmost parallel to the angle bisector of (0 1 0) and (00 1)surfaces of a BCC lattice of the particle. There were threegrains in the iron particle with high angle boundaries, whichwere formed where two single-crystal grains in this aggregatemet. It is commonly believed that these boundaries are themajor sources of the extra strain energy for recrystallizationbut our simulations show that the disorders (energy peratom) are important contributors.The right subgrain was thesmallest and most disordered.
The recrystallization rates for these two different grainswere different. One interesting thing is that the transforma-tion rate for the right grain is higher despite its smaller grainboundary misorientation angle. The factor discriminatingbetween the two rates can be attributed to the greater disorderin the smaller particle despite its lower misorientation angle.
As mentioned before, once a grain boundary starts tomove, the time to complete the consumption of the left grainis less than the time used for the right grain despite the slowerrate. This counterintuitive effect seems to stem from the factthat, for reasons unknown, the smaller grain takes a longertime in its transformation to develop into first-order kinetics.
4.3. Conjectures about Critical Nuclei in Recrystallization.Presumably any critical nucleus is in the disordered grainand is immediately adjacent to the grain boundary. It mustcontain atoms in planes with the orientation of the largergrain. Such a nucleus was not conspicuous in our simulationand, regrettably, such a nucleus was not intensively searchedfor, so it remains speculative.
5. Concluding Remarks
The solid state recrystallization and grain boundary migra-tions in an iron nanoparticle Fe
2616with three grains were
studied by a molecular dynamics simulation. Rates were notinconsistent with what would be expected for a process ofnucleation though no direct evidence of nuclei was observed.It was found that first-order transformation rates could bedetermined as the smaller grains were consumed by thelarger one. In comparing subgrains, the conclusion thatgrain disorder was more important than the misorientationangle in governing the rates was reconfirmed in this study.Suggestions about the critical nuclei for the recrystallizationare proposed.No obvious interactions between the subsidiarygrains boundaries were observed in the example studied inthis report.
Conflict of Interests
The authors declare that there is no conflict of interestsregarding the publication of this paper.
Acknowledgment
This work was supported in part by the Social SecurityAdministration.
References
[1] R. D. Doherty, D. A. Hughes, F. J. Humphreys et al., “Currentissues in recrystallization: a review,” Materials Science andEngineering A, vol. 238, no. 2, pp. 219–274, 1997.
[2] F. J. Humphreys and M. Hatherly, Recrystallization and RelatedAnnealing Phenomena, Elsevier, Oxford, UK, 2nd edition, 2004.
[3] B. Hutchnson, Thermomechenical Processing in Theory, Model-ing and Practice, ASM International, Material Park, Ohio, USA,1997.
[4] J. Huang and L. S. Bartell, “Molecular dynamics simulations ofsolid state recrystallization I: observation of grain growth inannealed iron nanoparticles,” Journal of Solid State Chemistry,vol. 185, pp. 238–244, 2012.
[5] J. Rifkin, “XMDprogram,” [email protected] at the Univer-sity of Connecticut.
[6] M. S. Daw, S. M. Foiles, andM. I. Baskes, “The embedded-atommethod: a review of theory and applications,”Materials ScienceReports, vol. 9, no. 7-8, pp. 251–310, 1993.
[7] D. Farkas, “Potential data for iron,” http://www.ims.uccon.edu/centers/simul/pot/fefarkas.pot.
[8] L. S. Bartell, “Analyses of nucleation rates from moleculardynamics simulations,” Journal of Physical Chemistry A, vol. 106,no. 45, pp. 10893–10897, 2002.

Submit your manuscripts athttp://www.hindawi.com
Hindawi Publishing Corporationhttp://www.hindawi.com Volume 2014
High Energy PhysicsAdvances in
The Scientific World JournalHindawi Publishing Corporation http://www.hindawi.com Volume 2014
Hindawi Publishing Corporationhttp://www.hindawi.com Volume 2014
FluidsJournal of
Atomic and Molecular Physics
Journal of
Hindawi Publishing Corporationhttp://www.hindawi.com Volume 2014
Hindawi Publishing Corporationhttp://www.hindawi.com Volume 2014
Advances in Condensed Matter Physics
OpticsInternational Journal of
Hindawi Publishing Corporationhttp://www.hindawi.com Volume 2014
Hindawi Publishing Corporationhttp://www.hindawi.com Volume 2014
AstronomyAdvances in
International Journal of
Hindawi Publishing Corporationhttp://www.hindawi.com Volume 2014
Superconductivity
Hindawi Publishing Corporationhttp://www.hindawi.com Volume 2014
Statistical MechanicsInternational Journal of
Hindawi Publishing Corporationhttp://www.hindawi.com Volume 2014
GravityJournal of
Hindawi Publishing Corporationhttp://www.hindawi.com Volume 2014
AstrophysicsJournal of
Hindawi Publishing Corporationhttp://www.hindawi.com Volume 2014
Physics Research International
Hindawi Publishing Corporationhttp://www.hindawi.com Volume 2014
Solid State PhysicsJournal of
Computational Methods in Physics
Journal of
Hindawi Publishing Corporationhttp://www.hindawi.com Volume 2014
Hindawi Publishing Corporationhttp://www.hindawi.com Volume 2014
Soft MatterJournal of
Hindawi Publishing Corporationhttp://www.hindawi.com
AerodynamicsJournal of
Volume 2014
Hindawi Publishing Corporationhttp://www.hindawi.com Volume 2014
PhotonicsJournal of
Hindawi Publishing Corporationhttp://www.hindawi.com Volume 2014
Journal of
Biophysics
Hindawi Publishing Corporationhttp://www.hindawi.com Volume 2014
ThermodynamicsJournal of


![Surface recrystallization of single crystal nickel-based ...recrystallization behavior of SC superalloys are rarely reported [9,10]. Typically, recrystallization behavior of alloys](https://static.fdocuments.in/doc/165x107/5f2652b9bf73cd24c24d8552/surface-recrystallization-of-single-crystal-nickel-based-recrystallization-behavior.jpg)