Recreational fisheries in the Bristol Bay Management Area ...
Fishery Management Report No. 15-40 Recreational Fisheries in the Bristol Bay Management Area, 2013–2015 by Jason E. Dye and Ian K. Fo November 2015 Alaska Department of Fish and Game Divisions of Sport Fish and Commercial Fisheries
Transcript of Recreational fisheries in the Bristol Bay Management Area ...

Fishery Management Report No. 15-40
Recreational Fisheries in the Bristol Bay Management Area, 2013–2015
by
Jason E. Dye
and
Ian K. Fo
November 2015
Alaska Department of Fish and Game Divisions of Sport Fish and Commercial Fisheries

Symbols and Abbreviations The following symbols and abbreviations, and others approved for the Système International d'Unités (SI), are used without definition in the following reports by the Divisions of Sport Fish and of Commercial Fisheries: Fishery Manuscripts, Fishery Data Series Reports, Fishery Management Reports, and Special Publications. All others, including deviations from definitions listed below, are noted in the text at first mention, as well as in the titles or footnotes of tables, and in figure or figure captions. Weights and measures (metric) centimeter cm deciliter dL gram g hectare ha kilogram kg kilometer km liter L meter m milliliter mL millimeter mm Weights and measures (English) cubic feet per second ft3/s foot ft gallon gal inch in mile mi nautical mile nmi ounce oz pound lb quart qt yard yd Time and temperature day d degrees Celsius °C degrees Fahrenheit °F degrees kelvin K hour h minute min second s Physics and chemistry all atomic symbols alternating current AC ampere A calorie cal direct current DC hertz Hz horsepower hp hydrogen ion activity pH (negative log of) parts per million ppm parts per thousand ppt, ‰ volts V watts W
General Alaska Administrative Code AAC all commonly accepted abbreviations e.g., Mr., Mrs.,
AM, PM, etc. all commonly accepted professional titles e.g., Dr., Ph.D., R.N., etc. at @ compass directions:
east E north N south S west W
copyright corporate suffixes:
Company Co. Corporation Corp. Incorporated Inc. Limited Ltd.
District of Columbia D.C. et alii (and others) et al. et cetera (and so forth) etc. exempli gratia (for example) e.g. Federal Information Code FIC id est (that is) i.e. latitude or longitude lat or long monetary symbols (U.S.) $, ¢ months (tables and figures): first three letters Jan,...,Dec registered trademark trademark United States (adjective) U.S. United States of America (noun) USA U.S.C. United States
Code U.S. state use two-letter
abbreviations (e.g., AK, WA)
Mathematics, statistics all standard mathematical signs, symbols and abbreviations alternate hypothesis HA base of natural logarithm e catch per unit effort CPUE coefficient of variation CV common test statistics (F, t, χ2, etc.) confidence interval CI correlation coefficient (multiple) R correlation coefficient (simple) r covariance cov degree (angular ) ° degrees of freedom df expected value E greater than > greater than or equal to ≥ harvest per unit effort HPUE less than < less than or equal to ≤ logarithm (natural) ln logarithm (base 10) log logarithm (specify base) log2, etc. minute (angular) ' not significant NS null hypothesis HO percent % probability P probability of a type I error (rejection of the null hypothesis when true) α probability of a type II error (acceptance of the null hypothesis when false) β second (angular) " standard deviation SD standard error SE variance population Var sample var

FISHERY MANAGEMENT REPORT NO. 15-40
RECREATIONAL FISHERIES IN THE BRISTOL BAY MANAGEMENT AREA, 2013–2015
by
Jason E. Dye
and
Ian K. Fo
Alaska Department of Fish and Game Division of Sport Fish, Research and Technical Services 333 Raspberry Road, Anchorage, Alaska, 99518-1565
November 2015

The Fishery Management Reports series was established in 1989 by the Division of Sport Fish for the publication of an overview of management activities and goals in a specific geographic area, and became a joint divisional series in 2004 with the Division of Commercial Fisheries. Fishery Management Reports are intended for fishery and other technical professionals, as well as lay persons. Fishery Management Reports are available through the Alaska State Library and on the Internet: http://www.adfg.alaska.gov/sf/publications/. This publication has undergone regional peer review.
Jason E. DyeAlaska Department of Fish and Game, Division of Sport Fish,
P.O. Box 230, Dillingham, AK 99576-0230, USA
and
Ian K. Fo Alaska Department of Fish and Game, Division of Sport Fish,
P.O. Box 230, Dillingham, AK 99576-0230, USA
This document should be cited as follows: Dye, J. E., and I. K. Fo. 2015. Recreational fisheries in the Bristol Bay Management Area, 2013–2015. Alaska
Department of Fish and Game, Fishery Management Report No. 15-40, Anchorage.
The Alaska Department of Fish and Game (ADF&G) administers all programs and activities free from discrimination based on race, color, national origin, age, sex, religion, marital status, pregnancy, parenthood, or disability. The department administers all programs and activities in compliance with Title VI of the Civil Rights Act of 1964, Section 504 of the Rehabilitation Act of 1973, Title II of the Americans with Disabilities Act (ADA) of 1990, the Age Discrimination Act of 1975, and Title IX of the Education Amendments of 1972.
If you believe you have been discriminated against in any program, activity, or facility please write: ADF&G ADA Coordinator, P.O. Box 115526, Juneau, AK 99811-5526
U.S. Fish and Wildlife Service, 4401 N. Fairfax Drive, MS 2042, Arlington, VA 22203 Office of Equal Opportunity, U.S. Department of the Interior, 1849 C Street NW MS 5230, Washington DC 20240
The department’s ADA Coordinator can be reached via phone at the following numbers: (VOICE) 907-465-6077, (Statewide Telecommunication Device for the Deaf) 1-800-478-3648,
(Juneau TDD) 907-465-3646, or (FAX) 907-465-6078 For information on alternative formats and questions on this publication, please contact:
ADF&G Division of Sport Fish, Research and Technical Services, 333 Raspberry Road, Anchorage AK 99518 (907) 267-2375

TABLE OF CONTENTS Page
LIST OF TABLES........................................................................................................................................................iii
LIST OF FIGURES ...................................................................................................................................................... iv
LIST OF APPENDICES ............................................................................................................................................... v
ABSTRACT .................................................................................................................................................................. 1
INTRODUCTION ......................................................................................................................................................... 1 Management Area Description ...................................................................................................................................... 1 Information Sources for Management ........................................................................................................................... 2 Sport Fishing Effort and Harvest ................................................................................................................................... 3 Management Plans and Policies .................................................................................................................................... 9
Nushagak–Mulchatna King Salmon Management Plan ........................................................................................... 9 Nushagak River Coho Salmon Management Plan .................................................................................................... 9 Kvichak River Drainage Sockeye Salmon Management Plan .................................................................................. 9 Southwest Alaska Rainbow Trout Management Plan ............................................................................................... 9 Statewide Policy and Plan for Management of Sustainable Wild Rainbow Trout Fisheries .................................. 10 Sustainable Salmon Fisheries Policy for Alaska ..................................................................................................... 10
Emergency Orders Issued in 2013 through 2015 ......................................................................................................... 11 Emergency Order 2-SS-5-47-13 ............................................................................................................................. 11 Emergency Order 2-KS-5-32-14............................................................................................................................. 11 Emergency Order 2-RS-5-33-14 ............................................................................................................................. 11 Emergency Order 2-KS-5-37-14............................................................................................................................. 11
CHINOOK SALMON FISHERIES ............................................................................................................................ 12
Areawide Fishery Description ..................................................................................................................................... 12 Areawide Fishery Management and Objectives .......................................................................................................... 15 Naknek River ............................................................................................................................................................... 16
Fishery Description ................................................................................................................................................. 16 Fishery Management and Objectives ...................................................................................................................... 16 2015 Season ............................................................................................................................................................ 18
Alagnak (Branch) River ............................................................................................................................................... 19 Fishery Description ................................................................................................................................................. 19 Fishery Management and Objectives ...................................................................................................................... 19 2015 Season ............................................................................................................................................................ 21
Nushagak and Mulchatna Rivers ................................................................................................................................. 21 Fishery Description ................................................................................................................................................. 21 Fishery Management and Objectives ...................................................................................................................... 24 2015 Season ............................................................................................................................................................ 26
Togiak River ................................................................................................................................................................ 26 Fishery Description ................................................................................................................................................. 26 Fishery Management and Objectives ...................................................................................................................... 27 2015 Season ............................................................................................................................................................ 28
COHO SALMON FISHERIES ................................................................................................................................... 28
Areawide Fishery Description ..................................................................................................................................... 28 Areawide Management and Objectives ....................................................................................................................... 29
i

TABLE OF CONTENTS (Continued) Page
Ugashik River Drainage .............................................................................................................................................. 31 Fishery Description ................................................................................................................................................. 31 Fishery Management and Objectives ...................................................................................................................... 31 2015 Season ............................................................................................................................................................ 32
Naknek River ............................................................................................................................................................... 33 Fishery Description ................................................................................................................................................. 33 Fishery Management and Objectives ...................................................................................................................... 33 2015 season ............................................................................................................................................................. 34
Nushagak–Mulchatna Rivers Drainage ....................................................................................................................... 34 Fishery Description ................................................................................................................................................. 34 Fishery Management and Objectives ...................................................................................................................... 35 2015 Season ............................................................................................................................................................ 36
Togiak River ................................................................................................................................................................ 37 Fishery Description ................................................................................................................................................. 37 Fishery Management and Objectives ...................................................................................................................... 38 2015 season ............................................................................................................................................................. 38
SOCKEYE SALMON FISHERIES ............................................................................................................................ 39
Brooks River ................................................................................................................................................................ 42 Fishery Description ................................................................................................................................................. 42 Fishery Management and Objectives ...................................................................................................................... 42 2015 season ............................................................................................................................................................. 43
Kvichak River .............................................................................................................................................................. 43 Fishery Description ................................................................................................................................................. 43 Fishery Management and Objectives ...................................................................................................................... 44 2015 season ............................................................................................................................................................. 44
Newhalen River ........................................................................................................................................................... 46 Fishery Description ................................................................................................................................................. 46 Fishery Management and Objectives ...................................................................................................................... 46 2015 season ............................................................................................................................................................. 46
Central Section Sockeye Salmon Fisheries.................................................................................................................. 46 RAINBOW TROUT FISHERIES ............................................................................................................................... 47
Areawide Fishery Description ..................................................................................................................................... 47 Southwest Alaska Rainbow Trout Management Plan.................................................................................................. 50
Philosophy of the Plan ............................................................................................................................................ 50 Plan Implementation ............................................................................................................................................... 51
Lower Talarik Creek .................................................................................................................................................... 55 Fishery Description ................................................................................................................................................. 55 Fishery Management and Objectives ...................................................................................................................... 55 Research .................................................................................................................................................................. 57 2015 Season ............................................................................................................................................................ 57
Kvichak River .............................................................................................................................................................. 57 Fishery Description ................................................................................................................................................. 57 Fishery Management and Objectives ...................................................................................................................... 58 2015 Season ............................................................................................................................................................ 58
ii

TABLE OF CONTENTS (Continued) Page
Alagnak (Branch) River ............................................................................................................................................... 58 Fishery Description ................................................................................................................................................. 58 Fishery Management and Objectives ...................................................................................................................... 59
Upper Nushagak River ................................................................................................................................................ 60 Fishery Description ................................................................................................................................................. 60 Fishery Management and Objectives ...................................................................................................................... 60 2015 Season ............................................................................................................................................................ 60
Naknek River ............................................................................................................................................................... 60 Fishery Description ................................................................................................................................................. 60 Fishery Management and Objectives ...................................................................................................................... 62 2015 Season ............................................................................................................................................................ 63
OTHER SPECIES FISHERIES ............................................................................................................................... 63
Wood River Lakes System Arctic Char ....................................................................................................................... 63 Fishery Description ................................................................................................................................................. 63 Fishery Management and Objectives ...................................................................................................................... 64 2015 Season ............................................................................................................................................................ 64
Ugashik Lakes Arctic Grayling ................................................................................................................................... 67 Fishery Description ................................................................................................................................................. 67 Fishery Management and Objectives ...................................................................................................................... 67 2015 Season ............................................................................................................................................................ 68
ACKNOWLEDGEMENTS ......................................................................................................................................... 70
REFERENCES CITED ............................................................................................................................................... 70 APPENDIX A: CATCH TABLES .............................................................................................................................. 75
LIST OF TABLES Table Page
1 Sport fishing effort in angler-days by section and drainage, Bristol Bay Management Area, 2004–2014, including 1977–2003 average.......................................................................................................................... 4
2 Total guided sport fishing effort in angler-days in selected waters of the BBMA, 2006–2013. ..................... 5 3 Numbers of fish harvested by species in recreational fisheries in the BBMA, 2004–2014, including
1977–2003 average. ........................................................................................................................................ 7 4 Total guided sport fishing harvest by species in selected waters of the BBMA, 2006–2013. ......................... 8 5 Sport harvest of Chinook salmon, by section and drainage in the BBMA, 2004–2014, including 1977–
2003 average. ................................................................................................................................................ 14 6 Bag limit regulatory changes affecting Chinook salmon in the BBMA. ....................................................... 15 7 Chinook salmon commercial, subsistence and sport harvest plus escapement for the Naknek River,
1995–2015, including 1985–1994 average. ................................................................................................... 17 8 Unexpanded escapement counts and total sport fishing effort and harvest of Chinook salmon in the
Alagnak River, 1995–2015, including 1985–1994 average. ......................................................................... 20 9 Chinook salmon commercial, subsistence, sport harvest, and escapement for the Nushagak River
drainage, 1989–2015. .................................................................................................................................... 22 10 A chronology of significant regulation changes for the Nushagak and Mulchatna rivers. ............................ 25 11 Escapement and commercial (Togiak Section only), subsistence, and sport harvests of Chinook salmon
from the Togiak River, 1995–2015, including 1983–1994 average. ............................................................. 27 12 Sport harvest of coho salmon from the waters of the BBMA by fishery, 2004–2014, including 1977–
2003 average. ................................................................................................................................................ 30
iii

LIST OF TABLES Table Page 13 Angler effort and coho salmon harvest plus escapement for the Ugashik River drainage, 1995–2015,
with 1977–1994 average. .............................................................................................................................. 32 14 Coho salmon commercial, subsistence, and sport harvests from the Naknek River, 1995–2015, with
1971–1994 average. ...................................................................................................................................... 34 15 Coho salmon commercial, subsistence, and sport harvest, plus inriver abundance for the Nushagak
River drainage, 1995–2015, with 1980–1994 average. ................................................................................. 36 16 Coho salmon commercial, subsistence, and sport harvest plus escapement for the Togiak River, 1995–
2015, with 1977–1994 average...................................................................................................................... 39 17 Sport harvest of sockeye salmon by section for the BBMA, 2004–2014, with 1977–2003 average. ............ 41 18 Historical sockeye salmon harvests and escapements for the Kvichak River, 1995–2015, with 1974–
1994 average. ................................................................................................................................................ 45 19 Sport harvest of rainbow trout by section and drainage in the BBMA, 2004–2014, with 1977–2003
average. ......................................................................................................................................................... 49 20 A chronology of significant regulation changes for Lower Talarik Creek. ................................................... 56 21 Lower Talarik Creek rainbow trout weir counts 2009–2015. ........................................................................ 57 22 Naknek River sport fishing effort and rainbow trout harvest and catch, 1991–2014. ................................... 62 23 Sport harvest of Dolly Varden and Arctic char from the waters of the BBMA by fishery, 2004–2014,
with 1977–2003 average. .............................................................................................................................. 65 24 Sport harvest of Arctic grayling from the waters of BBMA by fishery, 2004–2014, with 1977–2003
average. ......................................................................................................................................................... 69
LIST OF FIGURES Figure Page 1 Bristol Bay Sport Fish Management Area, showing the Eastern, Central, and Western sections. .................. 2 2 Percent of total sport fishing effort by section for the Bristol Bay Management Area, 2004–2014,
including 1977–2003 average.......................................................................................................................... 6 3 Popular Chinook salmon sport fisheries (delineated with dark dots) in the Bristol Bay Sport Fish
Management Area. ........................................................................................................................................ 13 4 Popular coho salmon sport fisheries (delineated with dark square dots) in the Bristol Bay Management
Area. .............................................................................................................................................................. 29 5 Popular sockeye salmon sport fisheries (delineated with dark square dots) in the Bristol Bay
Management Area. ........................................................................................................................................ 40 6 Popular rainbow trout sport fisheries (delineated with black dots) in the Bristol Bay Sport Fish
Management Area. ........................................................................................................................................ 48 7 Sport catch of rainbow trout by section for the Bristol Bay Sport Fish Management Area, 2004–2014,
with averages for 1991–2003 and 2009–2013. .............................................................................................. 50 8 Catch-and-release special management areas for rainbow trout in the Bristol Bay Sport Fish
Management area. ......................................................................................................................................... 52 9 Fly-only, catch-and-release special management areas for rainbow trout in the Bristol Bay Sport Fish
Management Area. ........................................................................................................................................ 53 10 Unbaited single-hook artificial lure special management areas for rainbow trout in the Bristol Bay
Sport Fish Management Area. ....................................................................................................................... 54
iv
LIST OF APPENDICES Appendix Page A1 Sport catch of Chinook salmon from the BBMA by fishery, 2004–2014, with 1994–2003 average. ........... 76 A2 Sport catch of coho salmon from the BBMA by fishery, 2004–2014, with 1994–2003 average. ................. 78 A3 Sport catch of sockeye salmon from the BBMA by fishery, 2004–2014, with 1994–2003 average. ............ 80 A4 Sport catch of rainbow trout from the BBMA by fishery, 2004–2014, with 1991–2003 average. ................ 82 A5 Sport catch of Dolly Varden and Arctic char from the BBMA by fishery, 2004–2014, with 1991–2003
average. ......................................................................................................................................................... 83 A6 Sport catch of Arctic grayling from the waters of the BBMA by fishery, 2004–2014, with 1991–2003
average. ......................................................................................................................................................... 85
v

vi

1
ABSTRACT This report summarizes the major sport fisheries in the Bristol Bay Management Area during 2013, 2014, and 2015. Fisheries include Chinook (Oncorhynchus tshawytscha), coho (O. kisutch), and sockeye salmon (O. nerka), rainbow trout (O. mykiss), Arctic char (Salvelinus alpinus), Dolly Varden (Salvelinus malma), Arctic grayling (Thymallus arcticus), and northern pike (Esox lucius). Numerous significant sport fisheries are described, and estimates of sport fishing effort, catch, and harvest, and salmon escapements are provided. Overviews of the management for each fishery are provided, including sport fishing regulations and management plans.
Key words: Bristol Bay Sport Fish Management Area, Alaska Board of Fisheries, management plan, Nushagak River, Togiak River, Naknek River, rainbow trout, Oncorhynchus mykiss, Chinook salmon, Oncorhynchus tshawytscha, coho salmon, Oncorhynchus kisutch, sockeye salmon, Oncorhynchus nerka.
INTRODUCTION MANAGEMENT AREA DESCRIPTION The Bristol Bay Sport Fish Management Area (BBMA) is part of the Division of Sport Fish’s Southcentral Region (Region II) and includes all waters and drainages flowing into Bristol Bay between Cape Newenham in the northwest to Cape Menshikof in the southeast (Figure 1).
The sport fisheries of this large region are more easily discussed by dividing the management area into 3 geographic sections: Eastern, Central, and Western (Figure 1). The section boundaries, which encompass one or more adjacent drainages, are located somewhat arbitrarily. However, for some species, particularly rainbow trout, the section boundaries delineate distinct differences in the character of the fisheries or the biology of the local stocks.
The Eastern Section includes all drainages from the Kvichak River to the area’s southern boundary at Cape Menshikof (Figure 1). Major federal jurisdictions in the Eastern Section include the Lake Clark National Park and Preserve, Katmai National Park and Preserve, and the Becharof National Wildlife Refuge. The Central Section is composed of the drainages entering Nushagak Bay and is dominated by the Nushagak and Wood River systems. The Wood–Tikchik State Park falls within the Central Section boundaries. The Western Section includes all drainages from Cape Constantine on the Nushagak Peninsula west to Cape Newenham and contains portions of the Togiak National Wildlife Refuge. The Togiak River is the major drainage within the section.
Major communities located within the area include Togiak, Dillingham, Iliamna, King Salmon, Naknek, Egegik, and Pilot Point. The management area is not linked to the State of Alaska highway system, although local roads provide sport fishermen with limited access near the major communities. Float-equipped aircraft, and to a lesser extent boats, are commonly used to access the area’s many remote fisheries.
Although the Alaska Department of Fish and Game (ADF&G) has management jurisdiction for sport fisheries in the BBMA, the United States Fish and Wildlife Service (USFWS), National Park Service (NPS), and United States Geological Survey (USGS) manage federal public lands and conduct research in the area.

2
Figure 1.–Bristol Bay Sport Fish Management Area, showing the Eastern, Central, and Western
sections.
INFORMATION SOURCES FOR MANAGEMENT ADF&G utilizes several sources of information to manage fisheries in the BBMA. One of the primary means for monitoring sport fishing effort, catch, and harvest is a mail survey by ADF&G called the Statewide Harvest Survey (SWHS) (Mills 1979–1980, 1981a, 1981b, 1982–1994; Howe et al. 1995, 1996, 2001a, 2001b, 2001c, 2001d; Walker et al. 2003; Jennings et al. 2004, 2006a, 2006b, 2007, 2009a, 2009b, 2015; Romberg et al. In prep). This annual survey, begun in 1977, estimates the number of angler-days of sport fishing effort expended by anglers in Alaskan waters (residents as well as nonresidents), and harvest by species. The survey provides estimates of effort and harvest on a site-by-site basis but is not designed to provide estimates of effort directed toward a single species. Beginning in 1990, the survey was modified to include estimates of catch (release plus harvest) on a site-by-site basis. The BBMA includes portions of 3 areas defined in the SWHS: a portion of the Naknek River Drainage–Alaska

3
Peninsula Area (Area R) excluding the saltwater fisheries and freshwater fisheries of Cold Bay and the Aleutian Islands, the Kvichak Area (Area S), and the Nushagak Area (Area T).
In addition to the SWHS, ADF&G Division of Sport Fish (SF) has operated the freshwater logbook program since 2005, which requires sport fishing guide businesses to record sport fishing effort, catch, and harvest by freshwater commercially guided clients (Sigurdsson and Powers 2009-2014).
Creel surveys have been selectively used to ground-truth the SWHS and the freshwater logbook program for fisheries of interest or for fisheries that require more detailed information or inseason management. For BBMA, these include creels surveys of the Alagnak River (Brookover 1989; Dunaway 1990a, 1994; Naughton and Gryska 2000; Collins and Dye 2003), the Kvichak River (Dunaway and Fleischman 1996b), Lower Talarik Creek (Russell 1977; Minard 1990; Minard et al. 1992; and unpublished data1), and the Nushagak River (Dye 2012).
ADF&G also conducts stock assessment projects. For example, on the Nushagak and Mulchatna rivers, significant monitoring and stock assessment projects have been conducted intermittently since 1986 (Minard 1987; Minard and Brookover 1988a; Dunaway et al. 1991; Dunaway and Bingham 1992; Dunaway and Fleischman 1995; Minard et al. 1998; Dye 2005; Cappiello and Dye 2006; Dye 2012).
Commercial and subsistence harvests of salmon are monitored and reported by the ADF&G Division of Commercial Fisheries (Elison et al. 2015). For larger fisheries, forecasts of each season’s run are provided by the Division of Commercial Fisheries (CF) and are reported in a statewide salmon forecast summary (Jones et al. 2014; Elison et al. 2015).
Escapements of some salmon stocks are monitored by counting towers, sonar, or aerial index surveys. For example, in the Nushagak River, escapement is estimated by sonar as the salmon migrate upriver (Elison et al. 2015). Historically, aerial index surveys of Chinook salmon (Oncorhynchus tshawytscha) in the drainages of the Nushagak, Togiak, Alagnak, and Naknek rivers are also conducted. Due to budget shortfalls, most of these aerial index surveys were suspended from 2009 through 2014.
SPORT FISHING EFFORT AND HARVEST The BBMA contains some of the most productive waters in the world for Pacific salmon (Oncorhynchus spp.), rainbow trout (O. mykiss), Arctic grayling (Thymallus arcticus), Arctic char (Salvelinus alpinus), and Dolly Varden (S. malma). The area has been acclaimed for its sport fisheries since the 1930s.
Total sport fishing effort in the BBMA increased from about 25,000 angler-days in 1977 to a peak of more than 116,000 angler-days in 1995. From 2009 through 2013, total annual effort in the BBMA averaged 77,269 angler-days and effort during 2014 was 89,942 angler-days (Table 1). From 2009 through 2013, guided sport fishing effort has averaged 29,303 angler-days (Table 2). Based on recent trends and current economic stability, sport fishing effort is expected to stabilize or slowly increase during the foreseeable future. 1 Memos summarizing the Lower Talarik Creek rainbow trout projects, located at Alaska Department of Fish and Game, Division of Sport Fish,
Dillingham are as follows: 1997 data from J. Dye, dated October 15, 1997, Dillingham; 1998 data from C. Schwanke, dated December 1, 1998; 1999 data from J. Dye to Bob Clark, dated November 15, 2000; 2000 data from J. Dye and M. Cavin to Bob Clark, dated November 15, 2000; 2001 data from J. Dye to Bob Clark, dated January 2002; 2003 data from C. Collins to James Hasbrouck, dated August 12, 2004; 2004 data from T. Jaecks to James Hasbrouck, dated January 23, 2005.

4 4
Table 1.–Sport fishing effort in angler-days by section and drainage, Bristol Bay Management Area, 2004–2014, including 1977–2003 average.
Average 1977–2003
Annual sport fishing effort (angler-days) Average 2009–2013
Section Drainage 2004 2005 2006 2007 2008 2009 2010 2011 2012 2013 2014 Eastern
Naknek R. 13,980 16,956 12,699 14,928 17,744 14,444 16,850 16,828 14,465 12,704 12,723 14,714 16,202 Brooks R. 3,109 3,317 1,945 3,887 3,882 3,951 2,513 3,469 4,227 3,607 3,426 3,448 3,696 Kvichak R. 3,601 4,219 5,463 7,022 5,557 5,849 6,015 6,061 6,045 5,313 4,080 5,503 4,172 Copper R. 1,852 1,349 1,082 1,868 2,513 1,520 1,959 1,756 2,246 2,625 3,082 2,334 3,427 Alagnak R. 6,573 9,028 11,228 11,747 8,881 8,652 5,541 6,549 5,669 5,039 4,782 5,516 6,013 Newhalen R. 4,025 1,842 1,273 2,169 1,643 1,470 1,370 968 1,048 540 1,498 1,085 429 Lake Clark 2,515 2,886 1,244 1,103 1,377 2,008 1,725 1,964 1,586 965 3,193 1,887 3,341 Other 9,775 17,216 14,083 14,028 18,944 15,872 10,177 13,828 14,824 12,355 5,342 11,305 12,591 Subtotal a 45,430 56,813 49,017 56,752 60,541 53,766 46,150 51,423 50,110 43,148 38,126 45,791 49,871
Central Nushagak R. 8,743 18,869 17,841 15,302 16,970 14,936 13,991 8,671 11,329 14,973 16,082 13,009 17,568 Mulchatna R. 3,139 2,218 3,071 3,930 3,084 1,524 1,157 879 1,548 1,573 1,415 1,314 1,341 Agulowak R. 1,567 2,712 4,094 2,804 3,966 2,040 1,641 1,953 2,065 1,136 1,176 1,594 1,993 Agulukpak R. 1,325 1,473 1,406 1,086 1,249 1,239 1,430 924 2,480 738 689 1,252 796 Wood River L. b 5,706 8,884 10,547 6,596 7,300 6,484 3,893 4,013 9,146 2,953 7,988 5,599 6,678 Tikchik L.and Nuyakuk R. 2,127 2,899 2,001 1,009 2,145 2,070 1,419 1,278 4,255 1,353 1,353 1,932 2,964 Other 2,930 3,693 3,519 8,129 2,371 1,185 1,060 997 983 1,123 638 960 396 Subtotal a 25,537 38,774 42,479 38,856 37,085 29,478 24,591 18,715 31,806 23,849 29,341 25,660 31,736
Western Togiak R. 2,351 6,249 6,235 4,772 5,181 4,695 3,638 3,636 4,326 9,526 3,170 4,859 8,098 Other 355 160 37 70 884 249 1,583 1,034 758 1,502 1,037 1,183 237
Subtotal a 2,706 6,409 6,272 4,842 5,218 4,944 5,221 4,670 5,084 9,905 4,207 5,817 8,335 Total 73,673 101,996 97,768 100,450 102,844 88,188 75,962 74,808 87,000 76,902 71,674 77,269 89,942 Source: Estimates from Alaska Statewide Harvest Survey (SWHS) were obtained from the Alaska Sport Fishing Survey database [Intranet]. 1996– . Anchorage, AK: Alaska
Department of Fish and Game, Division of Sport Fish (cited October 14, 2015). Available from: https://intra.sf.adfg.state.ak.us/swhs_est/ (custom query details available upon request from ADF&G, Division of Sport Fish, Research and Technical Services).
Note: ”Angler-day“ is the time spent fishing by 1 person for any part of a day. a Subtotals of averages may not be the sum of the drainages because information for some drainages is not available for some years. b Wood River Lakes includes Lake Nunavaugaluk. Prior to 1998, Agulowak and Agulukpak rivers were included in Wood River Lakes.

5
Table 2.–Total guided sport fishing effort in angler-days in selected waters of the BBMA, 2006–2013.
Annual guided sport fishing effort (angler-days) Average 2009–
2013 Drainage 2006 2007 2008 2009 2010 2011 2012 2013 Ugashik River 186 434 339 216 302 406 285 298 301 Naknek River 4,006 3,981 4,273 3,923 3,160 4,162 3,444 3,784 3,695 Brooks River 848 858 833 664 751 1,090 1,155 1,021 936 Alagnak River 5,066 4,732 4,152 3,057 2,809 2,954 2,462 2,780 2,812 Kvichak River 2,156 1,927 2,218 1,585 2,538 1,451 1,030 988 1,518 Newhalen River 252 254 314 120 159 46 220 186 146 Lower Talarik Creek 165 123 143 101 129 123 151 116 124 Nushagak River downstream of Mulchatna River 8,559 7,632 7,738 5,539 3,920 4,056 6,208 6,799 5,304 Nushagak River upstream of Mulchatna River 741 715 330 100 630 732 544 601 521 Togiak River 2,485 2,211 1,818 1,223 873 1,094 1,429 1,470 1,218 All Bristol Bay drainages 40,038 38,573 37,879 29,906 26,739 29,658 29,373 30,841 29,303 Source: ADF&G freshwater logbook database and Sigurdsson and Powers (2009–2014).
Historically, more than 60% of the sport fishing effort has occurred on average (1977–2003) in the waters of the Eastern Section of the BBMA (Figure 2). Although the Eastern Section effort still dominates, the percentage has declined slightly with the growth of fisheries in the other sections (Figure 2). On average, the Eastern Section has accounted for 59% of the total effort from 2009 through 2013. The Central Section typically accounts for the second largest proportion of effort, followed by the Western Section. Distribution of effort among sections during 2014 was similar to other recent seasons (Figure 2).
Sockeye salmon (O. nerka), Chinook salmon (referred to as “king salmon” in regulatory language), and coho salmon (O. kisutch) are the most popular species harvested in the BBMA, with fewer chum (O. keta) and pink (O.gorbuscha) salmon, Dolly Varden, Arctic char, Arctic grayling, and rainbow trout taken annually (Tables 3 and 4). The apparent decline in harvests of nonsalmon species is likely due in part to the accepted catch-and-release ethic among sport anglers as well as bag limit reductions for Dolly Varden and Arctic char, northern pike (Esox lucius), and Arctic grayling adopted by the Alaska Board of Fisheries (BOF) in 1997, 2001, and 2006.

6
Figure 2.–Percent of total sport fishing effort by section for the Bristol Bay Management Area, 2004–2014, including 1977–2003 average.
0
0.1
0.2
0.3
0.4
0.5
0.6
0.7
0.8
2004 2005 2006 2007 2008 2009 2010 2011 2012 2013 2014
Perc
ent o
f tot
al e
ffort
Year
EasternCentralWestern
Average1977–2003
Average2009–2013

7
Table 3.–Numbers of fish harvested by species in recreational fisheries in the BBMA, 2004–2014, including 1977–2003 average.
Average 1977–
2003
Annual sport fishing harvest Average 2009–
2013
Species 2004 2005 2006 2007 2008 2009 2010 2011 2012 2013 2014 Sockeye salmon 12,725 12,071 11,925 17,658 14,835 18,593 17,874 14,725 14,068 14,341 13,218 14,845 14,747 Chinook salmon 10,176 13,195 13,076 12,838 13,821 9,969 9,671 6,224 10,412 10,009 9,794 9,222 10,671 Coho salmon 8,868 17,977 12,447 14,164 13,139 20,152 13,375 12,917 13,535 16,722 12,380 13,786 20,699 Dolly Varden and Arctic char 5,743 6,268 2,177 2,104 3,076 1,930 2,393 2,897 2,594 1,657 1,766 2,261 2,137 Rainbow trout 4,121 1,932 1,902 1,108 2,411 1,255 462 766 1,961 652 323 833 648 Arctic grayling 4,439 3,010 839 959 1,793 1,836 1,129 1,411 999 809 640 998 799 Pink salmon 1,163 3,138 550 625 437 1,579 47 1,170 79 1,430 124 570 1,079 Lake trout 1,283 1,289 1,309 435 738 920 645 724 1,370 188 719 729 599 Chum salmon 1,820 1,848 2,703 1,509 501 1,458 1,443 2,159 1,267 1,497 2,946 1,862 1,344 Northern pike 1,410 1,751 1,626 1,293 1,051 812 1,545 614 780 442 917 860 715
Total 51,748 62,479 48,554 52,693 51,802 58,504 48,584 43,607 47,065 47,747 42,827 45,966 53,438 Source: Estimates from Alaska Statewide Harvest Survey (SWHS) were obtained from the Alaska Sport Fishing Survey database [Intranet]. 1996– . Anchorage, AK: Alaska
Department of Fish and Game, Division of Sport Fish (cited October 14, 2015). Available from: https://intra.sf.adfg.state.ak.us/swhs_est/ (custom query details available upon request from ADF&G, Division of Sport Fish, Research and Technical Services).

8
Table 4.–Total guided sport fishing harvest by species in selected waters of the BBMA, 2006–2013.
Anuual guided sport fishing harvest Average 2009–
2013 Drainage Species 2006 2007 2008 2009 2010 2011 2012 2013 Ugashik River
Chinook salmon 76 4 0 4 6 1 1 2 3 Coho salmon 47 190 73 97 58 48 84 112 80 Sockeye salmon 2 25 1 15 3 9 2 24 11 Rainbow trout 0 0 0 0 0 0 0 0 0
Naknek River Chinook salmon 1,073 910 790 661 469 608 608 768 623 Coho salmon 1,776 1,891 3,081 2,125 960 1,880 1,819 2,014 1,760 Sockeye salmon 1,416 2,656 2,513 1,980 2,142 2,068 2,109 2,505 2,161 Rainbow trout 43 52 12 24 13 9 21 32 20
Brooks River Chinook salmon 2 5 0 0 1 0 0 2 1 Coho salmon 0 0 1 3 0 0 0 0 1 Sockeye salmon 4 21 10 8 8 4 1 18 8 Rainbow trout 41 67 0 0 5 6 7 40 12
Alagnak River Chinook salmon 693 540 308 150 254 345 290 284 265 Coho salmon 815 601 663 558 609 442 493 849 590 Sockeye salmon 3,347 3,903 3,787 2,494 2,522 2,686 2,182 1,686 2,314 Rainbow trout 160 322 13 7 14 3 3 17 9
Kvichak River Chinook salmon 34 4 66 7 3 1 0 0 2 Coho salmon 361 260 357 335 599 254 194 139 304 Sockeye salmon 1,145 1,446 2,267 1,319 2,156 1,476 1,255 1,049 1,451 Rainbow trout 91 141 29 12 39 13 4 2 14
Newhalen River Chinook salmon 0 0 0 1 0 0 8 0 2 Coho salmon 15 2 3 16 10 4 9 64 21 Sockeye salmon 593 459 1,099 392 533 167 663 499 451 Rainbow trout 0 0 0 0 0 0 6 0 1
Lower Talarik Creek Chinook salmon 0 0 0 0 0 0 0 0 0 Coho salmon 5 0 5 9 32 2 14 3 12 Sockeye salmon 0 0 0 0 6 12 65 11 19 Rainbow trout 0 0 0 0 0 0 0 0 0
Nushagak and Mulchatna rivers Chinook salmon 5,254 4,324 4,621 3,030 1,567 2,140 3,827 3,823 2,877 Coho salmon 1,025 1,159 2,135 1,704 1,723 1,723 1,993 2,993 2,027 Sockeye salmon 134 89 264 29 53 81 139 388 138 Rainbow trout 39 216 24 2 19 12 9 16 12
Togiak River Chinook salmon 1,037 1,078 685 539 477 455 521 543 507 Coho salmon 1,978 1,353 1,945 887 597 878 1,407 1,603 1,074 Sockeye salmon 123 140 269 44 2 22 70 28 33
Rainbow trout 13 13 10 0 9 0 1 3 3 -continued-

9
Table 4.–Page 2 of 2.
Annual guided sport fishing harvest Average 2009–
2013 Drainage Species 2006 2007 2008 2009 2010 2011 2012 2013 All drainages
Chinook salmon 8,169 6,865 6,470 4,392 2,777 3,550 5,255 5,422 4,279 Coho salmon 6,022 5,456 8,263 5,734 4,588 5,231 6,013 7,777 5,869 Sockeye salmon 6,764 8,739 10,210 6,281 7,425 6,525 6,486 6,208 6,585
Rainbow trout 387 811 88 45 99 43 51 110 70 Source: ADF&G freshwater logbook database and Sigurdsson and Powers (2009–2014).
MANAGEMENT PLANS AND POLICIES The following section is a list of the various management plans adopted or implemented by the BOF that guide ADF&G’s management of Bristol Bay sport fisheries. For those plans specifically adopted as a regulation, the Alaska Administrative Code (AAC) is provided. Additional information is provided later in the pertinent fishery sections. There are other management plans that address commercial salmon fisheries that do not directly address sport fisheries management, but may affect sport fisheries to some extent. These plans are more fully discussed under the specific sport fishery where such plans may be a factor.
Nushagak–Mulchatna King Salmon Management Plan Management of the subsistence, commercial, and sport fisheries for Nushagak Chinook salmon stocks is governed by the Nushagak–Mulchatna King Salmon Management Plan (5 AAC 06.361). The plan was first adopted by the BOF in January 1992 and most recently modified during the December 2012 meeting.
Nushagak River Coho Salmon Management Plan Management of the subsistence, commercial, and sport fisheries for Nushagak coho salmon stocks is governed by the Nushagak River Coho Salmon Management Plan (5 AAC 06.368). The plan was first adopted by the BOF during the December 1995 meeting. The purpose of this plan is to provide management guidelines to ensure an adequate spawning escapement of coho salmon into the Nushagak River system.
Kvichak River Drainage Sockeye Salmon Management Plan To ensure biological spawning escapement requirements of sockeye salmon into the Kvichak River drainage, the BOF adopted the Kvichak River Drainage Sockeye Salmon Management Plan (5 AAC 67.025) during the January 2001 meeting. The impetus for this plan was the poor sockeye salmon runs of 1999 and 2000. This is an inriver plan that addresses sport and subsistence fisheries only.
Southwest Alaska Rainbow Trout Management Plan In February 1990, the BOF overhauled nearly all regulations for rainbow trout fisheries in the 2 management areas now known as the Bristol Bay Management Area and Kuskokwim–Goodnews Sport Fish Management Area. The new regulations essentially implement the Southwest Alaska Rainbow Trout Management Plan without adopting the plan’s language into regulation. However, the BOF recognized the plan as a guiding policy to achieve and maintain a more orderly and comprehensive mix of rainbow trout angling opportunities throughout the 2

10
areas. The overriding philosophy of the Southwest Alaska Rainbow Trout Management Plan is one of conservative wild stock management (ADF&G 1990). In 1998, the BOF adopted Criteria for Establishing Special Management Areas for Trout (5 AAC 75.013; subsequently amended as 5 AAC 75.210). This regulation embodies most of the criteria that originated and are still used in the Southwest Alaska Rainbow Trout Management Plan.
Statewide Policy and Plan for Management of Sustainable Wild Rainbow Trout Fisheries The BOF adopted the Policy for the Management of Sustainable Wild Trout Fisheries (5 AAC 75.222), and Statewide Management Standards for Wild Trout (5 AAC 75.220) in March 2003. The policy provides principles and criteria to ensure conservation, sustainability, and optimal sustained yield and benefits for wild trout, and provides direction to the BOF and ADF&G as to how those principles and criteria are to be applied in the regulatory process. The plan ensures conservative management of wild trout fisheries while recognizing existing plans and policies that guide management of wild trout on a regional basis.
In most areas of the state, conservative management for wild rainbow trout, cutthroat trout, and steelhead trout, in combination, means a bag and possession limit of 2 fish, of which only 1 may be 20 inches or greater in length, with an annual limit of 2 fish 20 inches or greater in length. The plan recognizes existing plans and policies that guide management of wild trout on a regional basis, and allows the BOF to adopt regulations that deviate from the plan as necessary to address sustainability or optimal sustained yield issues, establish special management areas, or liberalize harvest opportunities in specific water bodies under other criteria.
Sustainable Salmon Fisheries Policy for Alaska In March 2000, the BOF adopted the Policy for the Management of Sustainable Salmon Fisheries (5 AAC 39.222), which became an integral part of the BOF’s yearly review of the state’s salmon fisheries. The policy contains 5 fundamental principles for sustainable salmon management, each with criteria that are to be used by ADF&G and the BOF to evaluate the health of the state’s salmon fisheries and address any conservation issues and problems as they arise. The 5 fundamental principles of the policy are as follows:
1) Wild salmon populations and their habitats must be protected to maintain resource productivity.
2) Fisheries shall be managed to allow escapements within ranges necessary to conserve and sustain potential salmon production and maintain normal ecosystem functioning.
3) Effective salmon management systems should be established and applied to regulate human activities that affect salmon.
4) Public support and involvement for sustained use and protection of salmon resources must be maintained.
5) In the face of uncertainty, salmon stocks, fisheries, artificial propagation, and essential habitats must be managed conservatively.
The policy requires that ADF&G describe the extent to which salmon fisheries and their habitats conform to explicit principles and criteria. In response to these reports, the BOF must review fishery management plans or create new ones. If a salmon stock of concern is identified in the

11
course of this review, the management plan will contain measures to address the concern, including needed research, habitat improvements, or new regulations.
EMERGENCY ORDERS ISSUED IN 2013 THROUGH 2015 There was 1 emergency order issued in 2013, 3 issued in 2014, and none were issued in 2015.
Emergency Order 2-SS-5-47-13 Issued: August 9, 2013
Effective Date: 12:01 AM, Saturday, August 10, 2013
Expiration Date: 11:59 PM, Tuesday, December 31, 2013
Unless superseded by subsequent emergency order
This emergency order increased the bag and possession limit for coho salmon from 5 to 10 in all waters of the Nushagak–Mulchatna rivers drainage, excluding the Wood River drainage. The limit for other salmon, other than Chinook salmon, remained at 5 per day, 5 in possession. These limits were in addition to the more liberal limits for coho salmon.
Emergency Order 2-KS-5-32-14 Issued: July 3, 2014
Effective Date: 12:01 AM, Monday, July 7, 2014
Expiration Date: 11:59 PM, Wednesday, December 31, 2014
Unless superseded by subsequent emergency order
This emergency order reduced the bag and possession limit for Chinook salmon 20 inches or greater in length from 2 fish, only 1 of which may exceed 28 inches in length to 1 fish 20 inches or greater in length in all waters of the Nushagak–Mulchatna rivers drainage beginning 12:01 AM, Monday, July 7, 2014.
Emergency Order 2-RS-5-33-14
Issued: July 3, 2014
Effective Date: 12:01 AM, Friday, July 4, 2014
Expiration Date: 11:59 PM, Wednesday, December 31, 2014
Unless superseded by subsequent emergency order
This emergency order increased the bag and possession limit for sockeye salmon from 5 per day, 5 in possession to 10 per day, 10 in possession in all waters of the Wood River drainage beginning 12:01 AM, Friday, July 4, 2014. The limit for other salmon, except Chinook and sockeye salmon, remained at 5 per day, 5 in possession. These limits were in combination with the more liberal limit for sockeye salmon.
Emergency Order 2-KS-5-37-14 Issued: August 6, 2014
Effective Date: 12:01 AM, Thursday, August 7, 2014
Expiration Date: 11:59 PM, Wednesday, December 31, 2014

12
Unless superseded by subsequent emergency order
This emergency order increased the bag and possession limit for coho salmon in all waters of the Nushagak–Mulchatna rivers drainage, excluding the Wood River drainage. Beginning 12:01 AM, Thursday, August 7, 2014, the bag and possession limit for coho salmon was 10 per day; 10 in possession. The limit for pink, sockeye, and chum salmon in combination remained at 5 per day, 5 in possession. These limits were in addition to the more liberal limits for coho salmon.
CHINOOK SALMON FISHERIES AREAWIDE FISHERY DESCRIPTION Bristol Bay is home to several world-class Chinook salmon sport fisheries. The peaks of the Chinook salmon sport fisheries occurs from mid-June to late July in the lower reaches of the Alagnak, Nushagak, Naknek, and Togiak rivers, as well as several smaller rivers (Figure 3). Chinook salmon stocks throughout the management area significantly increased in measures of abundance from the late 1970s through the early 1980s. From about 1984 through 2009, Chinook salmon abundance in Bristol Bay returned to previous levels. With some exceptions during 2010 through 2014, Chinook salmon abundance decreased significantly and then rebounded in 2015.
The Bristol Bay commercial fishery generally takes the majority of the area’s annual Chinook salmon harvest. The majority of these fish are harvested incidentally during the sockeye salmon commercial fishery. From 1994 through 2003, the annual commercial harvest ranged from 15,750 to 140,908 Chinook salmon with an average of nearly 70,000 (Elison et al. 2015). Since 2003, the commercial take has ranged from 14,487 (2015) to 114,280 (2004) with an average of 52,221 fish annually (Elison et al. 2015). Subsistence harvests from 2004 through 2013 averaged 14,043 Chinook salmon annually, ranging from a low of 10,852 (2010) fish to a high of 18,012 fish (2004) (Elison et al. 2015).
In the BBMA, the Chinook salmon sport fisheries, like the sport fisheries for most other species, are fished primarily by guided anglers. With few exceptions, the guided to unguided angler ratio is about 3 to 1. Anglers usually keep less than 50% of the fish they catch, especially since the adoption of areawide annual bag limits (see management section below).
Sport fishing harvests of Chinook salmon have loosely followed trends in abundance, reaching historical peaks of 16,604 fish in 1987 and 17,504 fish in 1994 (Dunaway and Sonnichsen 2001). Chinook salmon typically account for approximately 20–30% of the sport salmon harvest in Bristol Bay. The 2009 through 2013 sport harvest estimate averaged 9,222 Chinook salmon (Table 5). The 2014 sport harvest for the entire Bristol Bay Management Area was 10,671 Chinook salmon (Table 5) and the 2014 commercial harvest was 15,077 Chinook salmon (Elison et al. 2015).

13
Figure 3.–Popular Chinook salmon sport fisheries (delineated with dark dots) in the Bristol Bay Sport
Fish Management Area.

14
Table 5.–Sport harvest of Chinook salmon, by section and drainage in the BBMA, 2004–2014, including 1977–2003 average.
Average 1977–
2003
Annual sport fishing harvest of Chinook salmon Average 2009–
2013
Section Drainage 2004 2005 2006 2007 2008 2009 2010 2011 2012 2013 2014 Eastern
Naknek R. 2,451 3,004 2,140 2,558 1,431 1,285 2,279 1,266 2,416 2,288 1,242 1,898 1,071 Brooks R. 0 0 0 0 0 0 0 0 0 0 0 0 0 Kvichak R. 166 27 217 80 68 344 91 0 110 56 111 74 41 Copper R. 2 27 0 0 0 26 0 0 0 307 0 61 0 Alagnak R. 402 1,146 1,008 1,052 1,007 394 199 418 1,317 512 823 654 983 Newhalen R. 0 13 0 0 0 78 0 0 0 0 0 0 0 Lake Clark 0 0 0 0 0 42 0 0 0 0 0 0 0 Other 188 557 267 460 0 156 10 26 40 42 15 27 134 Subtotal a 3,210 4,774 3,632 4,150 2,506 2,325 2,579 1,710 3,883 3,205 2,191 2,714 2,229
Central Nushagak R. 5,451 6,773 7,399 7,429 9,212 6,505 6,217 3,843 4,762 5,276 6,332 5,286 5,796 Mulchatna R. 300 40 134 44 287 91 58 0 82 351 236 145 337 Agulowak R. 1 0 0 0 0 0 0 0 0 0 0 0 16 Agulukpak R. 2 0 0 0 0 0 0 0 22 0 0 4 0 Wood River L. b 167 87 15 94 111 26 48 16 8 14 0 17 0 Tikchik L.–Nuyakuk R. 49 93 61 0 170 104 0 64 50 304 117 107 0 Other 49 40 101 57 34 26 163 0 32 0 0 39 127 Subtotal a 6,019 7,033 7,710 7,624 9,814 6,752 6,486 3,923 4,956 5,945 6,685 5,599 6,276
Western Togiak R. 684 1,388 1,734 1,064 1,501 892 606 591 1,438 859 900 879 2,166 Other 5 0 0 0 0 0 0 0 135 0 18 31 0 Subtotal a 689 1,388 1,734 1,064 1,501 892 606 591 1,573 859 918 909 2,166
Total 7,570 13,195 13,076 12,838 13,821 9,969 9,671 6,224 10,412 10,009 9,794 9,222 10,671 Source: Estimates from Alaska Statewide Harvest Survey (SWHS) were obtained from the Alaska Sport Fishing Survey database [Intranet]. 1996– . Anchorage, AK: Alaska
Department of Fish and Game, Division of Sport Fish (cited October 14, 2015). Available from: https://intra.sf.adfg.state.ak.us/swhs_est/ (custom query details available upon request from ADF&G, Division of Sport Fish, Research and Technical Services).
a Subtotals of averages may not be the sum of the drainages because information for some drainages is not available for some years. b Wood River Lakes includes Lake Nunavaugaluk. Prior to 1998, Agulowak and Agulukpak rivers were included in Wood River Lakes.

15
AREAWIDE FISHERY MANAGEMENT AND OBJECTIVES Since 1960, bag limits for Chinook salmon in Bristol Bay and across Alaska have become increasingly conservative and complex. The most conservative and sweeping regulatory changes to the area’s Chinook salmon fisheries were adopted during the November and December 1997 BOF meetings. A Bristol Bay-wide annual limit of 5 Chinook salmon was adopted, and in the Nushagak River drainage, anglers were further restricted to an annual limit of 4 Chinook salmon. The daily bag limits in several other major fisheries were reduced slightly. Season closures of July 25 or July 31 were adopted for all Bristol Bay waters to protect spawning Chinook salmon.
In 2001, a statewide regulation (5 AAC 67.010 (b)) created a daily bag and possession limit for Chinook salmon under 20 inches of 10 per day in all fresh waters open to Chinook salmon sport fishing, except for the Nushagak River drainage. The limit is in addition to the daily limits for Chinook salmon 20 inches or longer. Chinook salmon under 20 inches do not count toward the annual limit and are in addition to the daily bag limit for Chinook salmon 20 inches or longer. The sole exception is the Nushagak River, which has a daily bag and possession limit of 5 Chinook salmon under 20 inches per day.
In the drainages of the Alagnak, Egegik, Kvichak, Igushik, Naknek, Snake, Togiak, and Ugashik rivers, the bag and possession limits for Chinook salmon are uniform at 3 per day, 1 of which may exceed 28 inches in length (5 AAC 67.020 (1)).
Anglers are prohibited from removing a Chinook salmon from the water before releasing the fish in all fresh waters of Bristol Bay. Any Chinook salmon removed from the water must be kept and becomes part of an angler’s daily bag limit. The goal of this regulation is to improve the potential survival of released Chinook salmon and to encourage anglers to be more careful with the fish they release.
Table 6 lists the chronology of the bag limit regulatory changes affecting Chinook salmon sport fisheries in all drainages of Bristol Bay.
Table 6.–Bag limit regulatory changes affecting Chinook salmon in the BBMA.
Effective year Regulation 1965 10 salmon (all species combined) per day, no size limit 1972 5 king per day, only 2 may be over 26 inches 1976 5 king per day, only 2 may be over 28 inches 1988 3 king per day, only 2 may be over 28 inches 1998 Daily bag and possession limits on several waters reduced to 3 per day, only 2 over 28 inches.
Annual limit of 5 king salmon. Spawning closures for all waters.
2001 Daily bag and possession limits on most Eastern and most Central section waters (except Nushagak and Wood River drainages) reduced to 3 per day, only 1 over 28 inches. All waters except Nushagak drainage allow harvest of 10 per day under 20 inches. All fish released must remain in the water from Cape Menshikof to Cape Constantine.
2003 All fish released must remain in the water from Cape Menshikof to Cape Pierce. Harvest of 5 per day under 20 inches allowed in the Nushagak drainage. 2012 Bag and possession limit for king salmon in all drainages from Cape Constantine to Cape
Newenham changed to 3, only 1 fish over 28 inches in length. Note: Chinook salmon are referred to as king salmon in the regulatory language.

16
NAKNEK RIVER Fishery Description The Naknek River (Figure 3) is located on the Alaska Peninsula near the communities of King Salmon, Naknek, and South Naknek. The Naknek River Chinook salmon sport fishery commences May 1 and continues through July 31, when it closes by regulation to protect spawning fish. The peak angling weeks are from about June 22 to July 14. Effort is concentrated in a 12-mile stretch of the Naknek River adjacent to the community of King Salmon. This fishery is one of the most popular sport fisheries in the area and accounts for roughly 21% of all the Chinook salmon harvested by sport fishermen in the BBMA. Several factors contribute to the popularity of the Naknek River, including ease of access and regularly scheduled airline service into King Salmon. This fishery has a significant amount of unguided effort, reasonably good catch rates, and a relatively high retention rate. Of the estimated catch of 3,482 Chinook salmon in 2014, 1,071 or nearly 31% were kept2.
Based on the SWHS, the estimated Chinook salmon sport harvest from 2004 through 2014 ranged from a high of 3,004 in 2004 to a low of 1,071 in 2014, with an average of 1,907 fish from the Naknek River drainage (Table 5). Angler effort for all species on the Naknek River has decreased from highs of over 20,000 angler-days in the early 2000s to a 5-year average of 14,714 (2009–2013; Table 1).
Based on freshwater logbook data from 2009 through 2013, guided effort has remained fairly stable with an average of 3,695 angler-days (Table 2).
Fishery Management and Objectives In 2006, the escapement goal for Naknek River Chinook salmon was changed to a sustainable escapement goal (SEG) of 5,000 Chinook salmon as assessed by aerial survey. While managing for the escapement, consideration is also given to maintaining the historical distribution of spawners within the 4 primary spawning areas of Pauls Creek, King Salmon Creek, Big Creek, and the mainstem of the Naknek River near Rapids Camp.
Sport harvests and effort are estimated through the SWHS and are reported in the ADF&G Fishery Data Series (Mills 1979–1980, 1981a, 1981b, 1982–1994; Howe et al. 1995, 1996, 2001a, 2001b, 2001c, 2001d; Walker et al. 2003; Jennings et al. 2004, 2006a, 2006b, 2007, 2009a, 2009b, 2015; Romberg et al. In prep). Commercial and subsistence harvests are monitored by the Division of Commercial Fisheries (CF) and are reported in the ADF&G Annual Management Report series (Elison et al. 2015). The Division of Sport Fish (SF) has also conducted significant monitoring and stock assessment projects (Coggins and Bingham 1993; Gryska and Naughton 2001).
Escapement of Chinook salmon is estimated by fixed-wing aerial surveys of the 4 primary spawning areas during the presumed peak of spawning in early to mid-August. Aerial counts are left unexpanded and are considered minimum estimates of escapement. Results of the escapement surveys indicate the mainstem of the Naknek River, along with Big Creek, comprises approximately 90% of the observed escapement. Except in 2000 and 2015, recent
2 Alaska Sport Fishing Survey database [Intranet]. 1996– . Anchorage, AK: Alaska Department of Fish and Game, Division of Sport Fish [cited
October 14, 2015]

17
escapements have generally met or exceeded the escapement goal. Surveys were not conducted from 2010 through 2014 due to budget shortfalls.
Table 7.–Chinook salmon commercial, subsistence and sport harvest plus escapement for the Naknek
River, 1995–2015, including 1985–1994 average.
Harvest Escapement index c Year Commercial a Subsistence b Sport Total
1995 5,130 1,431 4,153 10,714 4,960 1996 4,273 1,574 2,984 8,831 5,010 1997 3,132 2,764 4,231 10,127 10,453 1998 2,722 2,433 3,443 8,598 5,505 1999 1,439 1,567 2,856 5,862 NA 2000 1,077 894 2,105 4,076 3,233 2001 995 869 2,656 4,520 6,340 2002 1,002 837 2,170 4,009 7,593 2003 611 1,221 2,412 4,244 6,081 2004 1,496 1,075 3,004 5,575 12,878 2005 1,458 1,047 2,140 4,645 NA 2006 2,333 881 2,558 5,772 NA 2007 1,520 672 1,431 3,623 5,498 2008 1,344 719 1,285 3,348 5,390 2009 d 1,026 392 2,279 3,697 NA 2010 d 1,060 422 1,266 2,748 NA 2011 d 1,962 550 2,416 4,928 NA 2012 d 2,306 785 2,288 5,379 NA 2013 d 1,360 502 1,242 3,104 NA 2014 d 1,526 530 1,071 3,127 NA Average 1985–1994 5,508 1,329 4,362 11,199 6,065 1995–2014 1,889 1,058 2,400 5,346 6,631 2010–2014 1,643 558 1,657 3,857 NA Percent 1995–2014 35% 20% 45% 2010–2014 43% 14% 43% 2015 e 740 NA NA NA 3,305 Sources: Commercial: Jones et al. 2014; Elison et al. 2015: Appendix A4. Sport: Alaska Sport Fishing Survey database
[Intranet]. 1996– . Anchorage, AK: Alaska Department of Fish and Game, Division of Sport Fish (cited October 14, 2015). Available from: https://intra.sf.adfg.state.ak.us/swhs_est/ (custom query details available upon request from ADF&G, Division of Sport Fish, Research and Technical Services).
a Naknek–Kvichak district commercial harvests likely include Naknek, Alagnak, and Kvichak stocks. The harvests reported for Naknek River stocks are therefore considered maximums.
b Naknek–Kvichak District harvests. c Actual raw counts made from fixed wing aerial surveys. d No escapement surveys conducted due to budget constraints. e Aerial survey was conducted by an inexperienced surveyor and is considered a minimum extimate.

18
Concern over low escapements and increasing sport harvest prompted the 1987 BOF to adopt a regulation package addressing Naknek River Chinook salmon. The key elements of that package included the following:
1) establishing a season for Chinook salmon (May 1 to July 31),
2) artificial-lure-only designation, and
3) reduction in bag and possession limits to 3 per day, 1 of which may be over 28 inches.
Beginning in the early 1990s, increasing portions of Pauls and King Salmon creeks were closed to Chinook salmon fishing to protect spawning stocks in these waters. In 1995, the outlets of Pauls and King Salmon creeks into the Naknek River were closed to angling to protect important holding areas for Chinook salmon.
In 1997, closures to Chinook salmon angling in Pauls and King Salmon creeks were clarified, and an annual limit of 5 Chinook salmon per angler was adopted for this fishery. The annual harvest limit was areawide in the BBMA and required anglers to record the date and location of each Chinook salmon taken.
With the advent of the annual limit on Chinook salmon, a number of local anglers had expressed strong interest in taking smaller Chinook salmon on the Naknek River. In January 2001, the BOF added the opportunity to harvest 10 Chinook salmon per day under 20 inches in length and prohibited anglers from removing Chinook salmon from the water if the fish were to be released3. During the January 2001 meeting, the BOF also restricted most of Big Creek to catch-and-release angling for Chinook salmon. The Big Creek regulation grew from a locally generated proposal designed to address concerns for the Big Creek Chinook salmon escapement. In 2013, Big Creek and waters of the Naknek River drainage within a one-quarter mile radius of its confluence with Big Creek were closed to sport fishing for Chinook salmon.
As described earlier in this report, a particular concern for some Naknek River anglers is the management of the Naknek–Kvichak District commercial sockeye salmon fishery. When conservation concerns for the Kvichak River sockeye salmon stocks require area restrictions in the Naknek–Kvichak District, commercial fishing may be allowed in the lower reaches of the Naknek River under the terms of the Naknek River Sockeye Salmon Special Harvest Area Plan (NRSHA; 5 AAC 06.360). The plan was adopted by the BOF in 1986. This management strategy can result in a higher percentage of the Naknek River escapement being exposed to gill nets, raising the concern of a number of guides and anglers. The BOF has amended the plan several times and in 2001 adopted amendments to address the quality of salmon of all species escaping through the NRSHA openings.
2015 Season Sport fishing effort, catch, and harvest will not be available until 2016; however, anglers reported that sport fishing for Chinook salmon on the Naknek River was good in 2015. Escapement counts (3,060 fish) were well below the historical average; however, this may be partially attributed to an inexperienced surveyor and less than ideal counting conditions.
3 Alaska sport fishing regulations summary––Bristol Bay drainages (effective April 15, 2015 through April 14,
2016) Alaska Department of Fish and Game, Division of Sport Fish, Anchorage.

19
Commercial harvest of Chinook salmon in the Naknek–Kvichak District during 2015 was approximately 740.
ALAGNAK (BRANCH) RIVER Fishery Description The Alagnak River (Figure 3), known locally as the Branch River, is located in the Kvichak River drainage, approximately 40 miles north of the community of King Salmon. The Alagnak River’s proximity to the community of King Salmon makes it an attractive alternative to fishing the more crowded Naknek River. In addition, it is the closest Chinook salmon fishery for many of the lodges near Iliamna Lake, where few Chinook salmon spawn. The Chinook salmon fishery in the Alagnak River occurs mainly in the lower 15 miles of the river and peaks in mid to late July, roughly 2 weeks later than other Chinook salmon fisheries in the area. Chinook salmon returning to the Alagnak River are typically larger than those found in other systems. Effort is primarily guided (about 80%), nonresidents (more than 90%; Dunaway 1990a, 1994; Naughton and Gryska 2000). Most anglers either fly in with float-equipped aircraft for 1-day trips or base themselves in one of several lodges located along the river. Retention rates average approximately 20% (Dunaway 1990a, 1994; Naughton and Gryska 2000), typical of most of the area’s Chinook salmon fisheries.
From 2004 through 2013, the largest estimated annual harvest of Chinook salmon from the Alagnak River was 1,317 fish in 2011 (Jennings et al. 2015). From 2009 through 2013, the average harvest of Chinook salmon in the Alagnak River was 654 fish (Table 5). The 2014 harvest of 983 fish was above the recent average (Table 5). The 2014 total estimated effort of 6,013 angler-days also exceeded the 2009 through 2013 average effort of 5,516 angler-days (Table 1).
Based on freshwater logbook data from 2009 through 2013, guided effort has declined from a peak of 5,066 in 2006 to a low of 2,462 in 2012, with an average of 2,812 angler-days (Table 2).
Unexpanded escapement index counts of Chinook salmon in the Alagnak River averaged 3,320 fish from 2005 through 2014 (Table 8).
Fishery Management and Objectives Alagnak River drainage Chinook salmon fisheries are managed to achieve a sustainable escapement goal (SEG) of 2,700 Chinook salmon as assessed by aerial survey.
Sport harvests and effort are estimated through the SWHS and are reported in the ADF&G Fishery Data Series (Mills 1979–1980, 1981a, 1981b, 1982–1994; Howe et al. 1995, 1996, 2001a, 2001b, 2001c, 2001d; Walker et al. 2003; Jennings et al. 2004, 2006a, 2006b, 2007, 2009a, 2009b, 2015; Romberg et al. In prep). Commercial and subsistence harvests are monitored by CF and are reported in the ADF&G Annual Management Report series (Elison et al. 2015). Commercial harvests are reported for the Naknek–Kvichak District, which is a mixed-stock fishery composed of Kvichak, Naknek, and Alagnak river stocks. It is not possible to separate the commercial harvests by river of origin. SF has conducted significant monitoring and stock assessment projects on the Alagnak River in the recent past (Brookover 1989; Dunaway 1990a, 1994; Naughton and Gryska 2000).

20
Table 8.–Unexpanded escapement counts and total sport fishing effort and harvest of Chinook salmon in the Alagnak River, 1995–2015, including 1985–1994 average.
Year Index count a Total effort Harvest 1995 6,860 13,232 891 1996 9,885 8,121 931 1997 15,210 11,062 972 1998 4,148 7,715 1,531 1999 2,178 6,411 592 2000 2,220 7,589 501 2001 5,458 4,391 508 2002 3,765 7,886 305 2003 8,209 9,956 334 2004 6,755 8,267 1,146 2005 b 5,084 11,228 1,008 2006 b 4,278 11,747 1,052 2007 b 3,455 8,881 1,007 2008 1,825 8,652 394 2009 1,957 5,541 199 2010 c NC 6,459 405 2011 NC 5,669 1,317 2012 NC 5,039 572 2013 NC 4,782 823 2014 NC 6,013 983 Average 1985–1994 4,362 6,715 945 2005–2014 3,320 7,401 776 2015 d 917 NA NA Source: Total effort and Harvest: Alaska Sport Fishing Survey database [Intranet]. 1996– . Anchorage, AK: Alaska Department
of Fish and Game, Division of Sport Fish (cited October 14, 2015). Available from: https://intra.sf.adfg.state.ak.us/swhs_est/ (custom query details available upon request from ADF&G, Division of Sport Fish, Research and Technical Services).
a Maximum index count; escapement goal is 2,700. b Commercial fishing occurred in the Alagnak River Special Harvest Area. c Emergency order issued July 15 reducing the bag limit to 1 fish over 20 inches and the seasonal limit to 3. d Escapement survey conducted by an inexperienced surveyor and considered a minimum estimate.
Management concerns for Chinook salmon stocks of the Alagnak River drainage center on an inability to estimate total exploitation rates. Allocation of commercial catches from the Naknek–Kvichak District to the river of origin is not yet possible, and the lack of inseason assessment of escapement makes it difficult to effectively manage this stock. Run timing of Chinook salmon stocks to the Alagnak River coincides with peak periods of commercial sockeye salmon fishing in the Naknek–Kvichak District. When sockeye salmon runs are sufficient to allow for liberal fishing schedules, the potential for substantial incidental harvest of the Alagnak River Chinook salmon stocks exists.
Terminal tackle in this river system has been restricted for many years to single-hook artificial lures only to protect rainbow trout. Through 1988, the bag and possession limits for Chinook salmon in the Alagnak River were 5 fish, only 2 over 28 inches in length. From 1989 through 1997, the limits were 3 fish, only 2 over 28 inches in length. Finally, in addition to a 5 fish

21
annual limit and a spawning season closure on July 31, the BOF established a daily bag and possession limit of 3 fish, only 1 of which could exceed 28 inches in length4. As mentioned in the introduction of this section, in January 2001, the BOF added the opportunity to harvest 10 Chinook salmon under 20 inches in length per day and prohibited anglers from removing Chinook salmon from the water if the fish were to be released.
2015 Season Based on recent returns and low productivity of Chinook salmon stocks statewide, a below average to average run of Chinook salmon was expected to the Alagnak River drainage. However, information from anglers and guides indicated that angling success in the sport fishery was above average. Aerial surveys counted 917 Chinook salmon within the drainage index areas, less than half the long term average (Table 8); however, this is considered a minimum estimate because the surveyor was relatively inexperienced and counting conditions were less than ideal. Estimates of sport fishing effort, catch, and harvest will not be available until 2016.
NUSHAGAK AND MULCHATNA RIVERS Fishery Description The Nushagak River drainage (Figure 3) supports the largest sport, commercial, and subsistence fisheries for Chinook salmon in the BBMA (Tables 5 and 9).
Sport fishing effort is concentrated in 3 areas: the lower Nushagak River near the village of Portage Creek, the middle section of the Nushagak River in the vicinity of the village of Ekwok, and the midsection of the Mulchatna River between the Stuyahok and Koktuli rivers. Between 1992 and 1997, effort in the Ekwok area was highly variable. Since about 1999, the lower river fishery has begun to expand steadily upriver to Ekwok and the 2 areas are merging into a single fishery. The amount of angling for Chinook salmon in the middle section of the Mulchatna River seems to have diminished since bait was prohibited there in 1992. Although sport fishing for Chinook salmon does occur in some of the tributaries of the drainage, the overall impact of that activity, in terms of harvest, is considered slight.
The uplands along much of the Nushagak River are privately owned. Choggiung Limited, an Alaska Native village corporation, administers a recreational land management program. Since its inception in the mid-1980s, this program has grown to include the lands of the adjoining villages of Ekwok, New Stuyahok, and, in some years, Koliganek. Private and commercial land-use permits sold by the program allow anglers access to desirable campsites while engaged in recreational fishing and hunting.
4 Alaska sport fishing regulations summary––Bristol Bay drainages (effective April 15, 2015 through April 14,
2016) Alaska Department of Fish and Game, Division of Sport Fish, Anchorage.

22
Table 9.–Chinook salmon commercial, subsistence, sport harvest, and escapement for the Nushagak River drainage, 1989–2015.
Harvest below sonar Harvest above sonar Spawning escapement
Year Total run a Commercial
harvest b Subsistence
harvest c Sport
harvest d Inriver sonar
estimate Subsistence
Harvest e Sport
Harvest f Sonar
estimate g Aerial survey
estimate 1989 102,241 17,637 4,898 1,404 78,302 2,217 2,210 73,875 1990 85,792 14,812 6,228 797 63,955 3,325 2,689 57,941 1991 132,769 19,718 6,907 1,793 104,351 3,127 3,758 97,466 1992 139,943 47,563 7,688 1,844 82,848 2,499 2,911 77,438 1993 173,747 62,976 10,552 2,408 97,812 2,919 3,492 91,401 1994 332,388 119,480 8,829 4,436 199,643 6,661 6,191 186,792 1995 268,137 79,943 7,810 2,238 178,146 5,891 2,713 169,542 1996 192,011 72,123 9,086 2,346 108,456 6,855 3,045 98,557 1997 156,052 64,390 8,731 931 170,610 6,587 2,567 82,000 1998 370,908 117,820 6,987 1,640 244,461 5,271 4,188 235,003 1999 147,530 11,178 5,732 934 129,686 4,325 3,304 122,058 2000 136,194 12,120 5,398 1,389 117,288 4,072 4,628 108,588 2001 212,037 11,746 6,703 1,600 191,988 5,057 4,299 182,632 2002 228,969 40,039 6,430 1,193 181,307 4,851 2,500 173,956 2003 222,846 43,485 10,651 2,203 166,507 8,035 3,752 154,720 2004 350,407 96,759 8,898 2,567 242,183 6,712 4,339 231,132 2005 306,892 62,764 7,142 2,863 234,123 5,387 5,702 223,034 2006 218,413 84,881 5,683 3,166 124,683 4,288 4,307 116,088 2007 121,959 51,831 7,598 3,581 60,464 5,732 6,088 48,644 2008 126,301 18,968 7,387 3,305 96,641 5,573 3,395 87,673 2009 115,884 24,693 7,260 2,451 81,480 5,477 3,903 72,100 2010 69,556 26,056 5,216 1,659 36,625 3,935 2,248 30,443 2011 95,300 26,927 7,103 1,542 59,728 5,358 3,302 51,068 2012 129,282 11,952 7,711 1,833 107,786 2,639 4,098 101,049 2013 133,246 10,213 6,613 1,971 113,709 4,989 4,714 104,746 2014 90,717 11,448 6,418 2,369 70,482 4,842 3,891 61,749
-continued-

23
Table 9.–Page 2 of 2.
Harvest below sonar Harvest above sonar Spawning escapement
Year Total run a Commercial
harvest b Subsistence
harvest c Sport
harvest d Inriver sonar
estimate Subsistence
Harvest e Sport
Harvest f Sonar
estimate g Aerial survey
estimate Average 1989–2014 179,212 44,674 7,295 2,095 128,587 4,870 3,778 118,308 2010–2014 103,620 17,319 6,612 1,875 77,666 4,352 3,651 69,811 Percent 1989–2014 40% 22% 8% 17% 13% 2010–2014 51% 20% 6% 13% 11% 2015 NA 48,803 NA NA 98,019 NA NA NA Source: Commercial harvest (total Nushagak District): 1989-1993 Jones et al. (2010: Appendix A19); 1994–2014 Elison et al. (2015: Appendix A19). Subsistence harvests above
and below sonar: ADF&G Subsistence Division, Subsistence Database from Charles Utermohle, Program Coordinator, Subsistence Division, Region II, Anchorage, Nov. 20, 2000. Data for 2000–2008 provided by James Fall, Subsistence Division, Region II, Anchorage. Sport harvests above and below the sonar: Alaska Sport Fishing Survey database [Intranet]. 1996– . Anchorage, AK: Alaska Department of Fish and Game, Division of Sport Fish (cited October 14, 2015). Available from: https://intra.sf.adfg.state.ak.us/swhs_est/ (custom query details available upon request from ADF&G, Division of Sport Fish, Research and Technical Services). Sonar estimates: 1989–1993 Jones et al. (2010: Appendix A19); 1994–2014 Elison et al. (2015: Appendix A19).
a Run refers to an aggregation of salmon of all ages returning from ocean feeding grounds to spawn in any given year. b Total Nushagak District commercial harvest. c Includes Nushagak Bay and Igushik. d Sport harvest total for 1989 to 1996 is 50% of the Nushagak River system sport harvest. Sport harvest total for 1997 to 2009 is Nushagak River sport harvest from Black Point
to sonar. e Includes Ekwok area, Iowithla River, Klutuk River, Koliganek area, New Stuyahok area, Portage Creek area, Kokwok area, Mulchatna River, and an unknown Nushagak River
watershed site. f Sport harvest total for 1989 to-1996 is 50% of the Nushagak River system sport harvest plus the Mulchatna River system, Tikchik-Nuyakuk rivers, and Koktuli River sport
harvests. Sport harvest total for 1997 to 2001 is 50% of the Nushagak River harvest plus the Black Point to Iowithla River, Nushagak River upstream of Iowithla River, Mulchatna River system, Tikchik–Nuyakuk rivers and the Koktuli River harvests. Sport harvest total for 2002 to 2011 is Nushagak River excluding Black Point to sonar.
g Sonar estimates for 1989 to 1996, and 1998 to 2014 are sonar estimates minus subsistence and sport harvest above sonar.

24
Chinook salmon stocks in the Nushagak–Mulchatna drainage have been variable in recent years. The 2009, 2010, 2011, and 2014 runs were well below average and did not achieve the inriver goal. The 2012, 2013, and 2015 runs were above average and exceeded the inriver goal. Total runs of Nushagak and Mulchatna rivers Chinook salmon averaged 103,620 fish from 2010 through 2014, ranging from 69,556 to 133,246 fish (Table 9).
Total harvest by commercial, subsistence, and sport fisheries averaged 33,809 Chinook salmon from 2010 through 2014 (calculated from Table 9). The majority (51%) of the harvest was taken by the commercial fishery, 33% was taken by the subsistence fishery, and 17% by sport anglers (Table 9). Sport harvest of Chinook salmon averaged 5,526 fish from 2010 through 2014 (calculated from Table 9).
Based on freshwater logbook data from 2006 through 2013, guided effort downstream of the Mulchatna River has been variable, with a low of 3,920 angler-days in 2010 and a high of 8,559 angler-days in 2006. From 2009 through 2013, effort averaged 5,304 angler-days (Table 2).
Chinook salmon escapement into the Nushagak and Mulchatna rivers was estimated by aerial surveys beginning in 1967. Since 1987, sonar has been used to estimate the inriver run of Chinook salmon to the Nushagak River drainage. The sonar is considered an improvement over the aerial survey program because it gives a real-time estimate of escapement on which management decisions can be based.
Fishery Management and Objectives Under the Nushagak and Mulchatna King Salmon Management Plan (5 AAC 06.361, adopted January 1992, amended December 1994, November 1997, January 2001, December 2003, and December 2012; Table 10), Chinook salmon are managed to attain an inriver run of 95,000 fish, which is expected to provide 55,000 to 120,000 spawning fish per year, a reasonable opportunity to harvest Chinook salmon in the inriver subsistence fishery, and a guideline harvest level in the sport fishery of 5,000 fish. If the inriver run exceeds 95,000 Chinook salmon, then the guideline harvest level does not apply. If the inriver run falls below 95,000 Chinook salmon, then restrictive actions are required for the sport fishery. If the inriver run falls below 70,000 Chinook salmon, then additional restrictive actions are required for the sport fishery. If the inriver run falls below 55,000 Chinook salmon, the sport fishery is to be closed and the subsistence fishery may be restricted.
Since 1972, smaller runs and increasing sport fishing effort have prompted restrictive actions on the inshore commercial and sport fisheries. To remain within the sport fishery guideline harvest level of 5,000 fish, the bag and possession limit is 2 Chinook salmon per day, of which only 1 may be longer than 28 inches in length (ADF&G 2009). Only 4 of the 5 Chinook salmon allowed in an angler’s Bristol Bay annual harvest may come from the Nushagak–Mulchatna drainage. Additionally, in the Nushagak–Mulchatna drainage, there is a bag and possession limit of 5 per day for Chinook salmon under 20 inches. Chinook salmon under 20 inches do not count toward the annual limit of 4 and are in addition to the daily bag limit for Chinook salmon 20 inches or longer. Due to concerns over catch-and-release mortality, BOF adopted regulations in 2012 requiring anglers to use single hooks and, after harvesting a bag limit, to use only unbaited, single-hook, artificial lures for the remainder of that day.

25
Table 10.–A chronology of significant regulation changes for the Nushagak and Mulchatna rivers.
Effective year Regulation 1990 Sport season established from January 1 to July 25 upstream of and including the Iowithla River.
Spawning season closure adopted to afford drainagewide protection to spawning king salmon stocks. 1992 Gear restricted to single-hook artificial lures for the portion of the Mulchatna River between the
Koktuli and Stuyahok rivers. 1992 Nushagak and Mulchatna King Salmon Management Plan (5 AAC 06.361) is adopted, capping the
sport harvest at 5,000 fish and establishing an escapement projection of 65,000 as the trigger for inseason restrictions in the sport fishery.
1994 Nushagak and Mulchatna King Salmon Management Plan (5 AAC 06.361) is amended, setting the sport allocation as a guideline harvest rather than a cap.
1997 Nushagak and Mulchatna King Salmon Management Plan (5 AAC 06.361) was amended, by establishing an escapement projection of 55,000 king salmon below which inseason restrictions in the sport fishery must be imposed. The 55,000 fish “trigger” was adopted when analysis showed this escapement level was not likely to show a difference in the expected productivity versus that expected at the 65,000 fish trigger. In addition, the 65,000 fish “trigger” had become quite disruptive to the sport fishery by precipitating frequent inseason restrictions.
1997 The daily bag and possession limit was reduced to 2 king per day, only 1 over 28 inches. An annual harvest limit of 4 king salmon was adopted for the whole Nushagak–Mulchatna rivers drainage.
1997 Guides were prohibited from retaining any species of fish while guiding (all Bristol Bay.)
1997 The Kokwok River and the Nushagak River upstream from its confluence with Harris Creek were closed to angling for king salmon.
1997 A July 31 spawning season closure was adopted for the Nushagak River drainage downstream from the Iowithla River outlet.
1997 The commercial fishery was to be managed to allow pulses of king salmon to enter the Nushagak River untouched.
2001 The Alaska Board of Fisheries amended the management plan to allow a catch-and-release fishery when the final inriver abundance is projected to be below 55,000 fish but above 40,000 fish. The amended plan also stipulates that when the king salmon sport fishery is restricted to catch-and-release or is closed for conservation, the use of bait must be prohibited.
2001 A regulation allowing a daily bag limit of 10 king salmon less than 20 inches total length (508 mm TL) statewide, specifically excluded the Nushagak–Mulchatna rivers drainage until ADF&G could study the potential effects of the regulation on the spawning populations and the escapement goal.
2001 As with most other Bristol Bay drainages, the Nushagak River drainage was included in the regulation prohibiting anglers from removing king salmon from the water if the fish were to be released.
2003 A daily bag and possession limit for king salmon under 20 inches of 5 per day is implemented on the Nushagak drainage. King salmon under 20 inches do not count toward the annual limit of 4 and are in addition to the bag limit for king salmon 20 inches or longer. The Nushagak and Mulchatna King Salmon Management Plan (5 AAC 06.361) was amended so that if inriver projections fall below 75,000, a bag limit of 1 per day, 1 in possession, no size limit, is imposed on the sport fishery. The seasonal limit would not be adjusted.
2012 The Alaska Board of Fisheries adopted the following regulations: from May 1 to July 31 only 1 single-hook or single-hook lure may be used and the use of bait is allowed UNTIL an angler harvests a daily bag limit of king salmon 20 inches or greater in length, then that angler can only fish with 1 UNBAITED, single-hook or single-hook lure for the remainder of that day. Additionally, the numbers in the Nushagak and Mulchatna King Salmon Management Plan were updated to reflect counts from the new dual frequency identification sonar counter.
Note: Chinook salmon are referred to as king salmon in the regulatory language.

26
Sport harvests and effort are estimated through the SWHS and reported in the ADF&G Fishery Data Series (Mills 1979–1980, 1981a, 1981b, 1982–1994; Howe et al. 1995, 1996, 2001a, 2001b, 2001c, 2001d; Walker et al. 2003; Jennings et al. 2004, 2006a, 2001b, 2007, 2009a, 2009b, 2015; Romberg et al. In prep). Commercial and subsistence harvests are monitored by CF and are reported in the ADF&G Annual Management Report series (Elison et al. 2015).
2015 Season Due to uncertainty with past estimates of escapement, there was no preseason forecast for the 2015 Nushagak and Mulchatna rivers Chinook salmon run. Additionally, due to low runs of Nushagak and Mulchatna rivers Chinook salmon in recent years and poor performance of Chinook salmon stocks statewide, in 2015 a conservative management approach seemed warranted. However, inriver escapement projections remained above the inriver goal throughout the entire season and, in accordance with the Nushagak and Mulchatna King Salmon Management Plan, no inseason restrictions were implemented on the sport fishery. The preliminary total estimate of Chinook salmon passing the sonar was 98,019 fish (Table 9). No directed Chinook salmon commercial fishing periods allowing large mesh gillnets occurred in the Nushagak District. Approximately 48,803 Chinook salmon were harvested incidentally during commercial sockeye salmon fishery openings (Table 9). Harvest estimates for the sport and subsistence fisheries are not yet available, but anecdotal information suggests that average to above average harvests occurred in both fisheries. By assuming that the sport harvest in 2015 was near the guideline harvest level of approximately 5,000 fish and that an average subsistence harvest of approximately 11,000 fish occurred, the 2015 total run was probably about 163,000 Chinook salmon. This total is significantly larger than the 2010 through 2014 average total run of 103,620 Chinook salmon (Table 9).
TOGIAK RIVER Fishery Description The Togiak River (Figure 3) is one of 3 major river systems within the Togiak National Wildlife Refuge. The relatively small Chinook salmon sport fishery on the Togiak River is concentrated along the lower 15 miles of the river and runs from late June through the month of July. The Togiak River supports the second largest Chinook salmon run in Bristol Bay, but its remote location, refuge regulations on guides, and ongoing friction between user groups have limited development of the fishery.
Based on SWHS estimates, the Chinook salmon sport harvest from 2010 through 2014 has ranged from a high of 2,166 in 2014 to a low of 591 in 2010 with an average of 1,191 fish from the Togiak River drainage (Table 11). Angler effort for the Togiak River drainage peaked in 2012 with a high of over 9,526 angler days; average effort for 2009–2013 was 4,859 angler-days (Table 1). During 2014, effort increased to 8,098 angler-days.
Based on freshwater logbook data from 2006 through 2013, guided angler-days have ranged from 873 in 2010 to 2,485 in 2006 with an average of 1,218 angler-days from 2009 through 2013 (Table 2).

27
Table 11.–Escapement and commercial (Togiak Section only), subsistence, and sport harvests of Chinook salmon from the Togiak River, 1995–2015, including 1983–1994 average.
Harvest Year Commercial Subsistence Sport a Total Escapement b 1995 10,768 448 581 11,797 12,600 1996 8,113 471 790 9,374 8,299 1997 5,357 667 1,165 7,189 10,300 1998 12,867 782 763 14,412 9,856 1999 10,830 1,244 644 12,718 9,520 2000 7,258 1,116 470 8,844 11,813 2001 9,518 1,612 1,006 12,136 13,110 2002 2,682 703 76 3,461 9,515 2003e 3,078 1,208 706 4,992 3,050 c 2004 7,673 1,094 1,388 10,155 12,324 2005 10,125 1,528 1,734 13,387 10,200 2006 15,078 1,630 1,064 17,772 NA 2007 7,142 1,234 1,501 9,877 NA 2008 2,891 1,337 892 5,120 2,140 c 2009 4,429 827 606 5,862 NA 2010 5,160 1,162 591 6,913 10,096 2011 5,780 966 1,438 8,184 2,140 c 2012 4,357 951 859 6,167 1,503 2013 2,458 691 900 4,049 NA 2014 1,477 919 2,166 4,562 3,994 Average 1983–1994 15,725 690 280 16,695 13,740 1995–2014 6,852 1,030 967 8,849 8,154 2010–2014 3,846 938 1,191 5,975 4,433 Percent 1995–2014 77% 12% 11% 2010–2014 64% 16% 20% 2015 2,896 NA NA NA NA Source: Commercial and subsistence: Elison et al. (2015). Sport: Alaska Sport Fishing Survey database [Intranet]. 1996– .
Anchorage, AK: Alaska Department of Fish and Game, Division of Sport Fish (cited October 14, 2015). Available from: https://intra.sf.adfg.state.ak.us/swhs_est/ (custom query details available upon request from ADF&G, Division of Sport Fish, Research and Technical Services).
a Sport harvest from Togiak River system. b Togiak River drainage total, estimated by aerial survey and expanded for missed fish. c Aerial survey was incomplete; 3 sections of the mainstem and 2 tributaries were not surveyed.
Fishery Management and Objectives Escapement of Chinook salmon into the Togiak River has been inconsistently estimated by aerial survey from fixed-wing aircraft since 1980. Aerial counts are expanded to account for missed fish and therefore represent total escapement estimates. Due to budget constraints, aerial Chinook salmon counts were not conducted by SF from 2010 through 2014. In 2006, the escapement goal for Togiak River Chinook salmon became a sustainable escapement goal (SEG) of 9,300 fish; however, due to a lack of annual escapement information, this goal was dropped in 2012.

28
Sport harvests and effort are estimated through the SWHS and reported in the ADF&G Fishery Data Series (Mills 1979–1980, 1981a, 1981b, 1982–1994; Howe et al. 1995, 1996, 2001a, 2001b, 2001c, 2001d; Walker et al. 2003; Jennings et al. 2004, 2006a, 2006b, 2007, 2009a, 2009b, 2015; Romberg et al. In prep). Commercial and subsistence harvests are monitored by the CF and are reported in the ADF&G Annual Management Report series (Elison et al. 2015). SF has conducted significant monitoring and stock assessment projects (Dunaway 1990b; Gryska and Naughton 2000).
In 1997, the BOF adopted several regulation changes that affected the Togiak Chinook salmon sport fishery. The May 1 through July 31 Chinook salmon sport fishery season was established by the BOF to protect spawning salmon. An annual limit of 5 Chinook salmon for sport anglers throughout Bristol Bay waters was adopted. In addition, guides were no longer allowed to harvest fish while guiding. These measures were designed to moderate the brief fishing season throughout the Bristol Bay drainage and to spread the harvest among more anglers. In 2012, the BOF reduced the area open to commercial fishing near the outlet of the Togiak River to minimize harvest of Chinook salmon.
2015 Season Estimates of sport fishing effort, catch, and harvest will not be available until 2016; however, anglers reported that sport fishing for Chinook salmon on the Togiak River was above average in 2015. Commercial harvest was 2,896, well below the historic average of 6,852 (Table 11). Changes to the area open to commercial fishing, as well as low levels of effort, likely contributed to the lower than average harvest.
COHO SALMON FISHERIES AREAWIDE FISHERY DESCRIPTION Coho salmon are a very popular component of the Bristol Bay sport fishery. Coho salmon fisheries occur from late July through September with some isolated runs of fish available into October. While many BBMA anglers pursue coho salmon with the assistance of a guide, this readily caught species is quite popular with unguided anglers. Given the run timing, this species often serves as a popular activity for hunters and rainbow trout anglers visiting the area. Significant fisheries occur in the Alagnak, Egegik, Mulchatna, Naknek, Nushagak, Togiak, and Ugashik rivers, as well as a host of smaller, lesser known waters (Figure 4).
The Bristol Bay commercial fishery generally takes the majority of the area’s annual coho salmon harvest. Since 1994, the annual commercial harvest ranged from 13,474 to 287,048 coho salmon with an average of 78,753 fish harvested annually (Elison et al. 2015). Subsistence harvests from 2004 through 2013 averaged over 6,500 coho salmon annually (Elison et al. 2015). From 2009 through 2013, the annual estimated sport harvest averaged 13,786 coho salmon and reached a peak of 16,722 fish in 2012 (Table 12). In 2014, anglers harvested 20,699 fish (Table 12).

29
Figure 4.–Popular coho salmon sport fisheries (delineated with dark square dots) in the Bristol Bay
Management Area.
AREAWIDE MANAGEMENT AND OBJECTIVES Annual estimates of harvest (Jennings et al. 2004, 2006 a, 2006b, 2007, 2009 a, 2009b, 2015; Romberg et al. In prep) indicate that despite the 5 fish daily bag limit (in most waters), on average coho salmon are harvested in similar numbers as Chinook salmon, which have more restrictive bag limits (compare Table 5 to Table 12). Except for the Kvichak River drainage, where the limit is 2 coho salmon per day, and the Alagnak River drainage, where the limit is 3 per day, the limits for coho salmon are 5 salmon per day with no size limit. The 5-per-day limit has been in effect since 1972. The lower limits for the Kvichak and Alagnak rivers drainage were adopted during the 1997 BOF meetings (first effective in the 1998 season) to protect the small runs in the Kvichak River system and to address modest runs and large angling effort on the Alagnak River. The lack of escapement data to establish biological escapement goals and harvest strategies for all user groups continues to be a concern.

30
Table 12.–Sport harvest of coho salmon from the waters of the BBMA by fishery, 2004–2014, including 1977–2003 average.
Average 1977–2003
Annual sport fishing harvest of coho salmon Average 2009–
2013
Section Drainage 2004 2005 2006 2007 2008 2009 2010 2011 2012 2013 2014 Eastern
Naknek R. 2,618 7,333 2,714 4,015 4,218 5,830 4,325 4,970 2,879 3,239 2,987 3,680 6,026 Brooks R. 60 275 0 49 53 118 72 57 0 0 0 26 13 Kvichak R. 263 594 1,186 700 588 1,070 839 1,031 1,212 1,300 715 1,019 235 Copper R. 26 0 0 0 138 48 105 16 36 0 0 31 64 Alagnak R. 512 1,550 756 1,466 493 1,022 785 764 819 892 1,030 858 1,754 Newhalen R. 229 366 0 0 58 54 0 32 0 0 115 29 0 Lake Clark 30 65 0 0 0 77 0 0 9 0 0 2 41 Other 1,108 994 2,763 2,115 1,470 1,438 1,224 1,726 2,494 2,959 848 1,850 3,051 Subtotal a 4,846 11,177 7,419 8,345 7,018 9,657 7,350 8,596 7,449 8,390 5,695 7,496 11,184
Central Nushagak R. 716 2,814 1,835 1,810 2,399 6,390 3,371 2,261 2,997 5,076 3,318 3,405 5,319 Mulchatna R. 191 181 244 546 460 29 31 111 127 106 114 98 246 Agulowak R. 20 0 0 129 210 110 181 42 100 19 23 73 0 Agulukpak R. 11 52 0 61 38 0 0 0 0 0 57 11 0 Wood River L. b 444 799 857 628 752 182 636 378 1,038 482 1,479 803 410 Tikchik L.–Nuyakuk R. 106 418 0 36 48 77 76 448 46 0 0 114 20 Other 180 215 133 395 244 287 174 309 199 19 11 142 194 Subtotal a 1,090 4,479 3,069 3,605 4,151 7,075 4,469 3,549 4,507 5,702 5,002 4,646 6,189
Western Togiak R. 739 2,321 1,959 2,214 1,970 3,420 1,556 772 1,232 2,506 1,534 1,520 3,319 Other 30 0 0 0 0 0 0 0 347 124 149 124 7 Subtotal a 769 2,321 1,959 2,214 1,970 3,420 1,556 772 1,579 2,630 1,683 1,644 3,326
Total 6,705 17,977 12,447 14,164 13,139 20,152 13,375 12,917 13,535 16,722 12,380 13,786 20,699 Source: Alaska Sport Fishing Survey database [Intranet]. 1996– . Anchorage, AK: Alaska Department of Fish and Game, Division of Sport Fish (cited October 14, 2015).
Available from: https://intra.sf.adfg.state.ak.us/swhs_est/ (custom query details available upon request from ADF&G, Division of Sport Fish, Research and Technical Services). a Subtotals of averages may not be the sum of the drainages because information for some drainages is not available for some years. b Wood River Lakes includes Lake Nunavaugaluk. Prior to 1998, Agulowak and Agulukpak rivers were included in Wood River Lakes.

31
UGASHIK RIVER DRAINAGE Fishery Description The Ugashik River drainage (Figure 4) is located on the Alaska Peninsula about 128 km south of the community of King Salmon. Much of the drainage is within the boundaries of the Alaska Peninsula National Wildlife Refuge. The local population center of Pilot Point, at the outlet of the Ugashik River, has a long history of a commercial fishing and subsistence based economy. The drainage has been well known for producing some of the biggest Arctic grayling in Alaska, as well as providing good angling for sockeye and coho salmon, and Dolly Varden and Arctic char. The Ugashik Lakes area is accessible only by float plane or by boat from the village of Ugashik and Pilot Point, 40 km downstream from the Lower Ugashik Lake outlet. Most angler effort is nonresident guided anglers who access the river by flying out from nearby area lodges for day-fishing trips.
Coho salmon angling in the drainage is popular from mid-August through early September and combines well with anglers seeking a mixed bag of Dolly Varden, Arctic char, and Arctic grayling. Available information suggests peak coho salmon run timing to the Ugashik drainage occurs in late August. The most popular fishing sites are the “Narrows,” a short stream connecting upper and lower Ugashik Lake, the outlet of lower Ugashik Lake, and the outlets of larger streams where they flow into the big lakes.
The Ugashik River drainage has historically been a popular destination for coho salmon anglers from lodges in Bristol Bay, however recent angling effort in the drainage has decreased from over 2,000 angler-days during 1999–2001 to a 2010–2014 average of 1,496 angler-days (Table 13). The sport harvest of coho salmon decreased from a high of 921 in 2005 to a low of 72 in 2011 (Table 13).
Based on freshwater logbook data from 2009 through 2013, the average estimated coho salmon harvest by guided anglers from 2009 through 2013 was 80 fish from the Ugashik River drainage which includes the Ugashik, King Salmon, and Dog Salmon rivers (Table 4). Guided effort during the same period was stable and averaged 301 angler-days (Table 2).
Fishery Management and Objectives Escapement of coho salmon in the Ugashik River drainage has been estimated with aerial surveys since 1981. Estimated escapement has ranged from 400 in 1991 to 20,100 in 2006; however, during many years the drainage survey was not completed due to poor weather and survey conditions (e.g., see Table 13). As a result, survey results are minimum estimates of escapement and do not provide a reliable index to assess Ugashik River drainage coho salmon escapement.
Sport harvests and effort are estimated through the SWHS and reported in the ADF&G Fishery Data Series (Mills 1979–1980, 1981a, 1981b, 1982–1994; Howe et al. 1995, 1996, 2001a, 2001b, 2001c, 2001d; Walker et al. 2003; Jennings et al. 2004, 2006a, 2006b, 2007, 2009a, 2009b, 2015; Romberg et al. In prep). Commercial and subsistence harvests are monitored by CF and are reported in the ADF&G Annual Management Report series (Elison et al. 2015).

32
2015 Season Estimates of sport fishery effort, catch, and harvest will not be available until 2016; however, reports from anglers during the 2015 season indicated an average to above average coho salmon return. An aerial survey was not conducted to assess coho salmon escapement.
Table 13.–Angler effort and coho salmon harvest plus escapement for the Ugashik River drainage, 1995–2015, with 1977–1994 average.
Harvest Year Effort Sport Commercial Subsistence Total Escapement a 1995 905 346 13,800 290 14,436 NA 1996 2,098 392 13,163 298 13,853 8,275 1997 2,551 631 7,156 311 8,098 9,400 1998 1,534 223 13,007 485 13,715 1,459 1999 2,008 830 2,289 271 3,390 10,210 2000 2,403 513 1,269 467 2,249 12,070 2001 2,471 690 976 357 2,023 4,540 2002 1,350 724 464 460 1,648 3,805 2003 1,317 529 994 392 1,915 19,670 2004 1,017 408 4,744 234 5,386 5,440 2005 882 921 8,162 249 9,332 9,850 2006 541 571 3,087 339 3,997 20,100 2007 1,393 336 1,954 281 2,571 3,500 2008 615 74 2,220 222 2,516 6,240 2009 868 233 2,602 131 2,966 NA 2010 1,390 251 407 135 793 NA 2011 1,844 72 84 136 292 4,900 2012 1,756 116 0 228 344 NA 2013 1,471 411 479 106 996 NA 2014 1,019 604 435 147 1,186 NA Average 1977–1994 1,278 243 28,952 342 29,537 9,907 1995–2014 1,472 444 3,865 277 4,585 8,533 2010–2014 1,496 291 281 150 722 9,947 Percent 1995–2014 10% 84% 6% 2010–2014 40% 39% 21% 2015 NA NA NA NA NA NA Source: Effort and sport harvest: Alaska Sport Fishing Survey database [Intranet]. 1996– . Anchorage, AK: Alaska Department of
Fish and Game, Division of Sport Fish (cited October 14, 2015). Available from: https://intra.sf.adfg.state.ak.us/swhs_est/ (custom query details available upon request from ADF&G, Division of Sport Fish, Research and Technical Services). Commercial and subsistence harvests: Elison et al. (2015). Escapement: estimates from ADF&G-Division of Commercial Fisheries Salmon Spawning Ground Surveys in the Bristol Bay, Alaska.
a Counts may be variable due to timing, conditions, etc. Escapement estimates were not made in 1995, 2009–2010, and 2012–2014 due to poor survey conditions.

33
NAKNEK RIVER Fishery Description The Naknek River coho salmon sport fishery (Figure 4) develops in late July and continues well into September. The peak period is normally from August 7 to August 21. Effort is concentrated along a 12-mile stretch of the Naknek River adjacent to the community of King Salmon, but significant and possibly increasing effort occurs upstream from Rapids Camp to Lake Camp. This fishery is the most popular coho salmon fishery in the area and provides significant recreational opportunity and economic benefit for the community of King Salmon. Most anglers in the coho salmon fishery are unguided and are not Alaskan residents (Gryska and Naughton 2001).
Harvests of coho salmon by the recreational fishery averaged 4,020 fish during 2010–2014 (Table 14). Harvest of coho salmon from the Naknek River since 2004 has ranged from a high of 7,333 coho salmon in 2004 to a low of 2,714 in 2005 (Table 14).
Based on freshwater logbook data from 2006 through 2013, guided effort has remained fairly stable with an average of 3,695 angler-days (Table 2).
In recent years, the fall commercial fishery has not been active and its impact on coho salmon has been modest to nonexistent. Most of the commercial take is incidental to the sockeye salmon fishery. Subsistence harvests of coho salmon have generally declined since 2008, reaching a low of 399 in 2013 (Table 14).
Fishery Management and Objectives No biological escapement goal (BEG) has been established for Naknek River coho salmon stocks. Because of the lack of escapement information, it is impossible to assess fishery impacts on the total run. In addition, the commercial harvest occurs on stocks returning to 3 different major rivers, further confounding ADF&G’s ability to calculate the spawner-return relationships needed to develop an escapement goal.
Sport harvests and effort are estimated through the SWHS and reported in the ADF&G Fishery Data Series (Mills 1979–1980, 1981a, 1981b, 1982–1994; Howe et al. 1995, 1996, 2001a, 2001b, 2001c 2001d; Walker et al. 2003; Jennings et al. 2004, 2006a, 2006b, 2007, 2009a, 2009b, 2015; Romberg et al. In prep). Commercial and subsistence harvests are monitored by CF and are reported in the ADF&G Annual Management Report series (Elison et al. 2015). SF has conducted significant monitoring and stock assessment projects in the recent past (Minard and Brookover III 1988b; Minard 1989a; Coggins 1992; Dunaway and Fleischman 1996a; Gryska and Naughton 2001).
The present bag and possession limits for coho salmon on the Naknek River are 5 fish per day with no size limit; the same limit has been in effect since 1972. No adjustments to the Naknek River coho salmon fishery bag and possession limits have occurred by inseason emergency order since 1999. In 1999, the coho salmon returns were so poor throughout Bristol Bay that the coho salmon sport fishery was restricted by emergency order to 1 coho salmon per day beginning on August 23.
Management concerns for this fishery center on the lack of escapement data and the lack of a management goal or target for this fishery. Without a clearer management target, justification for adjusting fishing time in the various fisheries is tenuous.

34
2015 season Sport fishing effort, catch, and harvest will not be available until 2016; however, reports from anglers during the 2015 season indicated an average to above average coho salmon return. Harvest in the commercial fishery was only 1,164 fish (Table 14). The low harvest in the commercial fishery was due to limited markets and no directed participation. No aerial escapement survey was conducted during 2015.
Table 14.–Coho salmon commercial, subsistence, and sport harvests from the Naknek River, 1995–2015, with 1971–1994 average.
Harvest Year Commercial Subsistence Sport Total 1995 981 1,791 1,788 4,560 1996 3,601 1,482 4,754 9,837 1997 718 1,457 3,879 6,054 1998 1,587 1,592 2,547 5,726 1999 303 856 3,672 4,831 2000 952 937 3,549 5,438 2001 3 740 4,795 5,538 2002 0 943 4,756 5,699 2003 42 812 6,393 7,247 2004 2,142 566 7,333 10,041 2005 3,314 1,224 2,714 7,252 2006 5,163 720 4,015 9,898 2007 2,180 1,104 4,218 7,502 2008 7,059 1,437 5,830 14,326 2009 732 669 4,325 5,726 2010 901 645 4,970 6,516 2011 633 690 2,879 4,202 2012 431 485 3,239 4,155 2013 467 399 2,987 3,853 2014 618 578 6,026 7,222 Average 1971–1994 7,634 844 1,781 12,830 1995–2014 1,591 956 4,233 6,781 2010–2014 610 559 4,020 5,190 Percent 1995–2014 23% 14% 62% 2010–2014 12% 11% 77% 2015 1,164 NA NA NA Source: Commercial and subsistence: Elison et al. (2015). Sport: Alaska Sport Fishing Survey database [Intranet]. 1996– .
Anchorage, AK: Alaska Department of Fish and Game, Division of Sport Fish (cited October 14, 2015). Available from: https://intra.sf.adfg.state.ak.us/swhs_est/ (custom query details available upon request from ADF&G, Division of Sport Fish, Research and Technical Services).
NUSHAGAK–MULCHATNA DRAINAGE Fishery Description The Nushagak–Mulchatna rivers drainage (Figure 4) produces the largest runs of coho salmon in Bristol Bay. Within the drainage, there are 4 areas of concentrated recreational effort: the lower 15 miles of the Nushagak River near the village of Portage Creek, the middle section of the Nushagak River in the vicinity of the village of Ekwok, the section of the Mulchatna River

35
between the Stuyahok and Koktuli rivers, and the upper Nushagak River from the outlet of Nuyakuk River upstream to the outlet of the King Salmon River (Figure 4). Of the areas mentioned above, the lower portion of the Nushagak River and the fishery in the immediate vicinity of the Nuyakuk River outlet have long been the most significant. Although sport fishing for coho salmon occurs in some of the tributaries of the drainage, the overall harvest resulting from that activity is considered slight. The lower Nushagak River provides fishing opportunity for early coho salmon in late July and early August when other coho salmon fisheries have not yet begun. Increased guided rainbow trout angling as well as caribou hunting in the upper Nushagak River area may be responsible for increased coho salmon angling activity in this remote portion of the drainage. Combination hunting and fishing (coho salmon and rainbow trout) float trips have been popular for years in the Mulchatna River drainage.
Most recently, the sport fishing harvest has averaged 3,297 fish, or about 3% of the total harvest of Nushagak and Mulchatna coho stocks from 2010 through 2014 (Table 15). Commercial harvest accounted for 93% and subsistence 4% of the total annual harvest for the same period. Subsistence harvest has tended to increase since such harvests were first recorded. At the current levels, the coho salmon sport fishery is considered to have a minor impact on the overall productivity of Nushagak and Mulchatna rivers drainage coho salmon stocks.
Based on freshwater logbook data from 2006 through 2013, guided effort downstream of the Mulchatna River has been variable with a low of 3,920 angler-days in 2010 and a high of 8,559 angler-days in 2006. From 2009 through 2013 total effort averaged 5,304 angler-days (Table 2).
Fishery Management and Objectives The Nushagak River coho salmon stocks are currently considered to be healthy. Since 1989, the 90,000 spawning fish escapement goal has been achieved in 6 years, although in 10 of those years, including 2015, the sonar did not operate during the coho salmon run due to budget shortfalls (Table 15). In the past, significant restrictions have been placed on all fisheries, including closure of the subsistence fishery, to reduce exploitation on this stock in poor years, such as 1999 when the inriver sonar estimate was the lowest on record since 1987 (Table 15). Recent runs have been well above average and the inriver and escapement goals have been exceeded. Current management of Nushagak and Mulchatna rivers coho salmon is governed by 5 AAC 06.368. Nushagak River Coho Salmon Management Plan, adopted by the BOF in December of 1995. The plan calls for managing the commercial fishery for an inriver run of 100,000 coho salmon, which provides for a spawning escapement of 90,000 fish, a reasonable opportunity in the subsistence fishery, and a 2,000 fish guideline harvest in the sport fishery. The plan addresses management actions that should be taken should the inriver run fall short of the goal. In the sport fishery, if the inriver run falls below 60,000 fish, then restrictions to maintain the sport harvest below 2,000 fish are required. If the inriver run is less than 50,000 fish, then closure of the sport fishery is required. Along with sport fishery management actions, the plan directs ADF&G to take actions in the commercial and subsistence fisheries; all fisheries must close when the inriver run falls below 50,000 coho salmon.
Sport harvests and effort are estimated through the SWHS and reported in the ADF&G Fishery Data Series (Mills 1979–1980, 1981a, 1981b, 1982–1994; Howe et al. 1995, 1996, 2001a, 2001b, 2001c, 2001d; Walker et al. 2003; Jennings et al. 2004, 2006a, 2006b, 2007, 2009a, 2009b, 2015; Romberg et al. In prep). Commercial and subsistence harvests are monitored by CF and are reported in the ADF&G Annual Management Report series (Elison et al. 2015). Inriver

36
abundance of coho salmon in the Nushagak River is estimated by side scan sonar operated near the village of Portage Creek. Sport and subsistence harvests are assumed to occur above the sonar site; therefore, estimated spawning escapement is equal to the sonar count minus sport and subsistence harvest.
From 1984 through 1992, Nushagak River coho salmon stocks were managed to achieve a biological escapement goal (BEG) of 150,000 fish, estimated by sonar at Portage Creek. However, spawning escapements during that period consistently fell short of the goal, averaging 85,020 fish. Subsequent spawner–recruit analysis suggested the 150,000 fish goal was higher than necessary to manage for maximum sustained yield. ADF&G used new spawner–recruit data to reduce the BEG to 90,000 spawners in 1992. The present bag and possession limits for coho salmon on the Nushagak–Mulchatna drainage are 5 fish per day with no size limit5. That is the same limit for most of the region and has been in effect since 1972.
2015 Season Estimates of sport fishing effort, catch, and harvest will not be available until 2016; however, anglers reported good sport fishing. Due to budget shortfalls, the 2015 run was not counted by sonar and no aerial escapement surveys were flown, so total run size and escapement is unknown. The commercial harvest was 5,635 fish (Table 15). The low commercial harvest was due to limited markets and little participation.
Table 15.–Coho salmon commercial, subsistence, and sport harvest, plus inriver abundance for the Nushagak River drainage, 1995–2015, with 1980–1994 average.
Harvest Inriver abundance estimate b
Estimated spawning escapement Year Commercial a Subsistence Sport
1995 4,181 3,905 725 53,510 51,519 1996 11,401 5,217 3,488 235,007 231,264 1997 4,110 3,433 500 46,243 44,552 1998 22,703 5,316 1,368 127,199 124,325 1999 2,836 3,993 618 38,697 36,714 2000 112,852 5,983 2,219 219,328 215,801 2001 3,218 5,993 2,113 86,822 83,337 2002 93 4,565 1,415 53,775 51,204 2003 583 5,432 917 NA NA 2004 47,706 4,240 2,814 152,613 149,580 2005 42,456 5,596 1,835 NA NA 2006 44,385 3,590 1,810 NA NA 2007 29,578 3,050 2,399 NA NA 2008 76,932 5,133 6,390 NA NA
-continued-
5 Alaska sport fishing regulations summary - Bristol Bay drainages (effective April 15, 2015 through April 14, 2016)
Alaska Department of Fish and Game, Division of Sport Fish, Anchorage.

37
Table 15.–Part 2 of 2.
Harvest Inriver abundance estimate b
Estimated spawning escapement Year Commercial a Subsistence Sport
2009 35,171 6,777 3,222 NA NA 2010 72,909 2,983 2,261 NA NA 2011 4,712 5,746 2,997 NA NA 2012 97,382 2,642 3,208 329,946 327,431 2013 124,185 7,717 2,700 200,718 196,239 2014 242,391 NA 5,319 483,219 NA Average 1980–1994 93,901 6,411 808 101,753 98,649 1995–2014 48,989 4,806 2,416 168,923 137,451 2010–2014 108,316 4,772 3,297 337,961 261,835 Percent 1995–2014 87% 9% 4% 2010–2014 93% 4% 3% 2015 5,635 NA NA NA NA Source: Commercial and subsistence harvest: Elison et al. (2015). Sport: Alaska Sport Fishing Survey database [Intranet]. 1996–
. Anchorage, AK: Alaska Department of Fish and Game, Division of Sport Fish (cited October 14, 2015). Available from: https://intra.sf.adfg.state.ak.us/swhs_est/ (custom query details available upon request from ADF&G, Division of Sport Fish, Research and Technical Services).
a Total Nushagak District commercial harvest. b Inriver abundance estimated by sonar counter at Portage Creek.
TOGIAK RIVER Fishery Description The bulk of the Togiak River coho salmon fishery occurs in the lower 20 miles of the Togiak River (Figure 4) below the Wilderness boundary of the Togiak National Wildlife Refuge. The sport fishery occurs from early August to the middle of September. The best angling usually occurs between August 21 and September 7 when the coho salmon enter in the greatest abundance. Angler effort is largely nonresident guided anglers who access the river by flying out from nearby lodges to fish for the day. In addition, there are 2 river-based lodges that cater to nonresident anglers, one of which is owned by the local native corporation in Togiak and leased to a concession group.
Sport harvest of coho salmon from the Togiak River averaged 1,873 fish annually from 2010 through 2014, or about 9% of the total Togiak River coho salmon harvest (Table 16). Annual sport harvest peaked in 2008 at 3,420 fish. A high degree of voluntary catch-and-release angling has been documented for this fishery and ranges up to 60% of the catch (Gryska and Naughton 2000). Given previous studies (Vincent-Lang et al. 1993), concern over hook-induced mortality prompted staff to evaluate the potential catch-and-release mortality in this fishery. ADF&G concluded that although the released proportion of the catch was large, the total number of fish caught is small in terms of the total run. Therefore, catch-and-release is believed to affect only a small number of fish and is expected to have only a minor impact on the overall abundance of the stocks. In addition, Vincent-Lang et al. (1993) and Stuby (2002) have demonstrated that the mortality of released coho salmon is low when catches are made above the intertidal area, as is the case for much of the Togiak River fishery.

38
Based on freshwater logbook data from 2006 through 2013, guided angler-days have ranged from 873 in 2010 to 2,485 in 2006 with an average of 1,218 angler-days from 2009 through 2013 (Table 2).
Since 1995, commercial catches in the Togiak Section have been erratic, ranging from a high of 58,978 fish in 1998 to a low of 8 in 2005. The annual average commercial harvest from 2010 through 2014 was 18,240 fish, accounting for 86% of the total Togiak coho salmon harvest (Table 16).
From 2010 through 2014, subsistence harvests were relatively stable and ranged from 208 to 545 fish per year (Table 16).
Fishery Management and Objectives Currently there is no escapement goal for Togiak River coho salmon due to a lack of annual escapement information. Coho salmon runs have been highly variable; weather frequently prohibits escapement assessment, and occasional illegal fishing with unknown harvest has confounded ADF&G’s ability to consistently collect accurate run size information.
Sport fishery harvests and effort are estimated through the SWHS and reported in the ADF&G Fishery Data Series (Mills 1979–1980, 1981a, 1981b, 1982–1994; Howe et al. 1995, 1996, 2001a, 2001b, 2001c, 2001d; Walker et al. 2003; Jennings et al. 2004, 2006a, 2006b, 2007, 2009a, 2009b, 2015; Romberg et al. In prep). Commercial and subsistence harvests are monitored by CF and are reported in the ADF&G Annual Management Report series (Elison et al. 2015). SF conducted significant monitoring and stock assessment projects in 1984 and 1989 (Minard and Lisac 1984; Dunaway 1990b). A creel survey to estimate catch and harvest rates in the sport fishery was conducted in 1999 (Gryska and Naughton 2000). When weather and water conditions permit, CF estimates annual spawning escapement of Togiak River coho salmon by conducting aerial escapement index counts.
Since 1972, the bag and possession limit for coho salmon on the Togiak River has been 5 per day with no size limit6. For years when spawner escapements have been adequate, such as 1996, the current bag limit of 5 has been satisfactory, but in poor years ADF&G has responded with emergency order restrictions to restrict the bag limit and reduce overall harvest. Prior to 1999, the limit was restricted 4 times in response to conservation concerns. There were no inseason restrictions placed on this fishery from 2010 through 2014.
2015 season Sport fishing effort, catch, and harvest will not be available until 2016. Anglers reported better than average sport fishing success throughout the season. No inseason restrictions were made and the sport fishery was allowed to proceed normally. Aerial surveys were not conducted in 2015 (Matt Jones, Assistant Area Management Biologist, ADF&G CF, Dillingham, personal communication).
6 Alaska sport fishing regulations summary––Bristol Bay drainages (effective April 15, 2015 through April 14,
2016) Alaska Department of Fish and Game, Division of Sport Fish, Anchorage.

39
Table 16.–Coho salmon commercial, subsistence, and sport harvest plus escapement for the Togiak River, 1995–2015, with 1977–1994 average.
Harvest
Year Commercial Subsistence Sport Total Escapement a Total run 1995 8,871 703 408 9,982 NA 1996 58,978 199 1,382 60,559 64,980 125,539 1997 2,970 260 780 4,010 20,625 24,635 1998 58,688 310 1,020 60,018 25,335 85,353 1999 2,653 217 1,109 3,979 3,855 NA 2000 2,758 342 840 3,940 NA NA 2001 284 388 1,004 1,676 NA NA 2002 754 241 1,475 2,470 NA NA 2003 1,047 883 2,086 4,016 NA NA 2004 15,463 204 2,321 17,988 NA NA 2005 8 295 1,959 2,262 NA NA 2006 449 408 2,214 3,071 NA NA 2007 157 110 1,970 2,237 NA NA 2008 1,159 541 3,420 5,120 NA NA 2009 9,209 272 1,556 11,037 NA NA 2010 24,065 514 772 25,351 NA NA 2011 7,605 545 1,232 9,382 NA NA 2012 15,977 293 2,506 18,776 NA NA 2013 11,420 208 1,534 13,162 NA NA 2014 32,131 366 3,319 35,816 NA NA Average 1977–1994 37,484 1,233 543 39,260 42,045 83,752 1995–2014 12,732 365 1,645 14,743 28,699 78,509 2010–2014 18,240 385 1,873 20,497 NA NA Percent 1995–2014 86% 2% 11% 2010–2014 89% 2% 9% 2015 21,999 NA NA NA NA NA Source: Commercial and subsistence harvest and escapement: Elison et al. (2015). Sport: Alaska Sport Fishing Survey database
[Intranet]. 1996– . Anchorage, AK: Alaska Department of Fish and Game, Division of Sport Fish (cited October 14, 2015). Available from: https://intra.sf.adfg.state.ak.us/swhs_est/ (custom query details available upon request from ADF&G, Division of Sport Fish, Research and Technical Services).
a Escapement estimates are based on fixed wing aerial surveys. Peak counts are expanded by a factor of 3 to account for missed fish. In 1985–1987, expansion factors were greater due to incomplete surveys or poor survey conditions.
SOCKEYE SALMON FISHERIES Sockeye salmon is the most numerous of the Pacific salmon species to spawn in Bristol Bay, which is the world’s largest producer of sockeye salmon. Their prized eating qualities make sockeye salmon the most popular species of salmon on the commercial market. Sockeye salmon are often indifferent to most fishing lures, making them difficult to catch. Since the late 1960s however, anglers have discovered innovative ways to legally catch sockeye salmon with customary sport gear, and the species has rapidly gained favor as a hard-fighting and delectable game fish. The most popular fisheries exist in the Naknek and Kvichak river drainages, but effort is growing in other waters of the BBMA as well (Figure 5).

40
Figure 5.–Popular sockeye salmon sport fisheries (delineated with dark square dots) in the Bristol Bay
Management Area.
Harvest of sockeye salmon in the BBMA has averaged 14,845 from 2009 through 2013 (Table 17) with a peak estimate of nearly 17,874 fish taken in 2009 and a low of 13,218 fish in 2013. The most active sport fisheries occur in the Eastern section of the management area, where an average (2009–2013) of 12,358 fish or about 85% of the annual harvest was taken. The Central section fishery harvest has averaged 2,258 sockeye per year and harvest in the Western section has averaged just over 200 fish annually (Table 17). Even at its highest levels, the sport harvest is approximately 0.05% of the 2004 through 2013 average annual run of 37.6 million sockeye salmon (Elison et al. 2015). Subsistence fishermen have harvested approximately 0.3% of the annual sockeye salmon run from 2004 through 2013 (Elison et al. 2015).
Sockeye salmon share the same bag and possession limit with all salmon except Chinook salmon: 5 salmon per day with no size limit. This regionwide limit has been in effect since 1972. ADF&G’s ability to manage for sustained yield is essentially unaffected by the recreational harvest of sockeye salmon. No adjustments were made to the bag and possession limits through the 2015 season. Sockeye salmon continue to play an important role in the development and expansion of the recreational fishery in the BBMA.
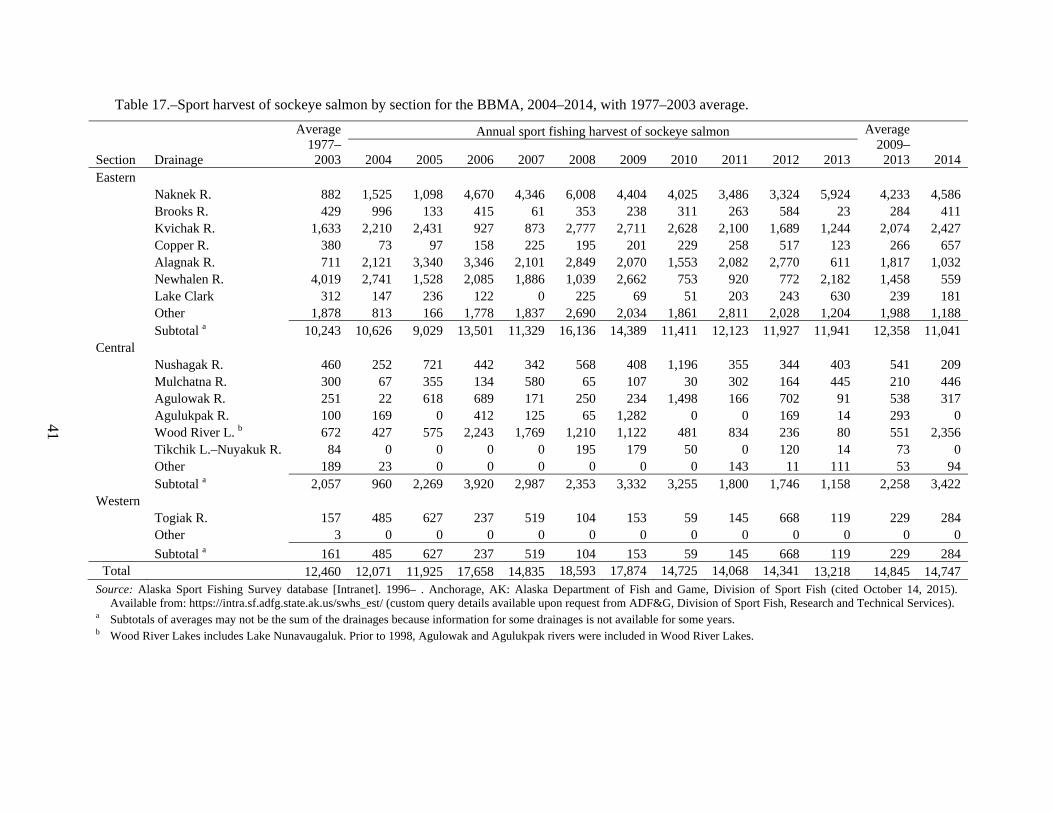
41
Table 17.–Sport harvest of sockeye salmon by section for the BBMA, 2004–2014, with 1977–2003 average.
Average 1977–
2003
Annual sport fishing harvest of sockeye salmon Average 2009–
2013
Section Drainage 2004 2005 2006 2007 2008 2009 2010 2011 2012 2013 2014 Eastern
Naknek R. 882 1,525 1,098 4,670 4,346 6,008 4,404 4,025 3,486 3,324 5,924 4,233 4,586 Brooks R. 429 996 133 415 61 353 238 311 263 584 23 284 411 Kvichak R. 1,633 2,210 2,431 927 873 2,777 2,711 2,628 2,100 1,689 1,244 2,074 2,427 Copper R. 380 73 97 158 225 195 201 229 258 517 123 266 657 Alagnak R. 711 2,121 3,340 3,346 2,101 2,849 2,070 1,553 2,082 2,770 611 1,817 1,032 Newhalen R. 4,019 2,741 1,528 2,085 1,886 1,039 2,662 753 920 772 2,182 1,458 559 Lake Clark 312 147 236 122 0 225 69 51 203 243 630 239 181 Other 1,878 813 166 1,778 1,837 2,690 2,034 1,861 2,811 2,028 1,204 1,988 1,188 Subtotal a 10,243 10,626 9,029 13,501 11,329 16,136 14,389 11,411 12,123 11,927 11,941 12,358 11,041
Central Nushagak R. 460 252 721 442 342 568 408 1,196 355 344 403 541 209 Mulchatna R. 300 67 355 134 580 65 107 30 302 164 445 210 446 Agulowak R. 251 22 618 689 171 250 234 1,498 166 702 91 538 317 Agulukpak R. 100 169 0 412 125 65 1,282 0 0 169 14 293 0 Wood River L. b 672 427 575 2,243 1,769 1,210 1,122 481 834 236 80 551 2,356 Tikchik L.–Nuyakuk R. 84 0 0 0 0 195 179 50 0 120 14 73 0 Other 189 23 0 0 0 0 0 0 143 11 111 53 94 Subtotal a 2,057 960 2,269 3,920 2,987 2,353 3,332 3,255 1,800 1,746 1,158 2,258 3,422
Western Togiak R. 157 485 627 237 519 104 153 59 145 668 119 229 284 Other 3 0 0 0 0 0 0 0 0 0 0 0 0 Subtotal a 161 485 627 237 519 104 153 59 145 668 119 229 284
Total 12,460 12,071 11,925 17,658 14,835 18,593 17,874 14,725 14,068 14,341 13,218 14,845 14,747 Source: Alaska Sport Fishing Survey database [Intranet]. 1996– . Anchorage, AK: Alaska Department of Fish and Game, Division of Sport Fish (cited October 14, 2015).
Available from: https://intra.sf.adfg.state.ak.us/swhs_est/ (custom query details available upon request from ADF&G, Division of Sport Fish, Research and Technical Services). a Subtotals of averages may not be the sum of the drainages because information for some drainages is not available for some years. b Wood River Lakes includes Lake Nunavaugaluk. Prior to 1998, Agulowak and Agulukpak rivers were included in Wood River Lakes.

42
BROOKS RIVER Fishery Description The Brooks River, which drains Brooks Lake into Naknek Lake (Figure 5), is a 2-mile long stretch of water located within the boundaries of Katmai National Park and Preserve. This river is cherished by some anglers because of its classic pool-and-riffle structure and excellent fishing opportunities. Brooks Camp, located on Naknek Lake, was established in 1960 by Northern Consolidated Airlines as primarily a sport fishing facility, but in recent years it has also become popular with tourists for hiking and bear viewing opportunities. Access to Brooks River and Brooks Camp is by float-equipped aircraft or boat. Beside guest cabins, a campground facility is available for overnight visitors. At the lower end of Brooks River is a footbridge that allows visitors to cross between the south and north shores without wading. The sport fishery for sockeye salmon generally takes place below the bridge in the lower quarter mile of the river where it empties into Naknek Lake. The sockeye salmon fishery begins in late June when the first salmon arrive and peaks over the Fourth of July weekend. The recreational fishery occupies waters also used by brown bears fishing for salmon. This overlap has caused management problems and conflicts for ADF&G and the National Park Service. At issue is the safety of visitors and the priority in access that different groups (bear viewers, sport fishermen, hikers) should have.
Since 2004, annual estimates of sport harvests of Brooks River sockeye salmon have ranged from a low of 23 in 2013 to a high of 996 in 2004 (Table 17). The recent 5-year (2009–2013) average annual harvest of 284 fish is easily sustained by this run, which is part of the Naknek escapement of about 1 million fish (Table 17).
Based on freshwater logbook data from 2009 through 2013, guided effort has been slowly increasing with an average of 936 angler-days (Table 2).
Fishery Management and Objectives The abundance of sockeye salmon at Brooks River is a function of the escapement into the Naknek River. The Naknek River drainage escapement goal is 800,000 to 1.4 million sockeye salmon (Elison et al. 2015). The magnitude of the escapement is such that variations in inriver abundance have little effect on sport fishery performance in the Brooks River.
Sport fishery harvests and effort are estimated through the SWHS and reported in the ADF&G Fishery Data Series (Mills 1979–1980, 1981a, 1981b, 1982–1994; Howe et al. 1995, 1996, 2001 a, 2001b, 2001c, 2001d; Walker et al. 2003; Jennings et al. 2004, 2006a, 2006b, 2007, 2009a, 2009b, 2015; Romberg et al. In prep). Commercial and subsistence harvests are monitored by CF and are reported in the ADF&G Annual Management Report series (Elison et al. 2015). SF has not conducted any significant monitoring or stock assessment projects for this fishery in recent seasons. Forecasts of next season’s run are provided by CF and are reported in a statewide salmon forecast summary (Geiger and Hart 1999). Escapement of sockeye salmon in the Brooks River is estimated from fixed-wing aerial surveys during the presumed peak of spawning. There has been a complicated history of regulations regarding this sport fishery. The current regulations are the result of a total revamping of the regulations in 1990 as part of the development of a rainbow trout management plan for the area. The regulation allowing catch-and-release fishing only for all species for the Brooks River from Brooks Lake downstream to the foot bridge was adopted during the fall of 1997 in an effort to address bear–human concerns raised by the

43
National Park Service. From the bridge downstream to Naknek Lake, anglers may keep 1 fish per day and in possession except rainbow trout, which are managed for catch-and-release fishing for the entire river7. Anglers are restricted to single-hook artificial lures below the footbridge and unbaited single-hook artificial flies above the bridge. Over the years, significant concessions of sport fishing opportunity have been made under the premise of ensuring the safety of sport anglers using the Brooks River. These concessions include reductions in bag limits from 5 sockeye salmon to 1, restrictions in terminal tackle to include single-hook artificial lures below the bridge, and the previously mentioned catch-and-release only, fly-fishing-only above the bridge.
The Brooks River is managed to provide a diversity of angling opportunity by providing a special management area restricted to unbaited, single-hook, artificial flies.
2015 season In 2015, escapement of sockeye salmon into the Naknek River drainage totaled 1,920,954, exceeding the goal of 800,000 to 1.4 million fish (Brookover et al. In prep). The large sockeye salmon escapement into the Naknek River system provided plenty of fish for anglers in the Brooks River and for anglers throughout the Naknek River drainage. No inseason restrictions were imposed on the sport fishery.
KVICHAK RIVER Fishery Description The Kvichak River drainage (Figure 5) hosts the single largest sockeye salmon run in the world and the river itself is a popular destination for anglers targeting this species. Two locations within the drainage support the biggest sport fisheries for sockeye salmon in Bristol Bay. The first location is the fishery on the Kvichak River at the outlet of Lake Iliamna. The other, often larger, fishery occurs on the Newhalen River near the community of Iliamna. Smaller tributaries within the drainage are fished much less intensively and sport harvests there are relatively minor in comparison to the 2 large fisheries.
Sockeye salmon first appear in the Kvichak River during the last week of June. The run peaks in the first week of July, then declines steadily until late July or early August. In peak years, the sport fishery may be active for much of the month of July.
A modern airstrip and trail system in the village of Igiugig provides easy access to the river where it drains out of Lake Iliamna and floatplanes can land on the lake or on the river. Although much of the sport fishing effort is from nonresident guided anglers, a growing component is the resident unguided angler arriving from Anchorage in private, chartered, or scheduled aircraft. The Igiugig Native Corporation owns most of the uplands along the upper Kvichak River, and charges anglers modest daily fees for access. Commercial operators are charged more substantial fees for annual leases.
Historically, the Bristol Bay commercial salmon fleet harvests roughly half of the annual Kvichak River sockeye salmon run and until 1995, the subsistence fishery took an average of
7 Alaska sport fishing regulations summary––Bristol Bay drainages (effective April 15, 2015 through April 14,
2016) Alaska Department of Fish and Game, Division of Sport Fish, Anchorage.

44
nearly 78,000 fish annually, or about 1% of the total run (Table 18). Since 2010, the annual subsistence harvest has averaged 45,272.
Since 1995, estimates of the sport harvest of sockeye salmon from the Kvichak River drainage ranged from 1,244 sockeye salmon in 2013 to 15,023 in 1995 (Table 18). From 2009 through 2013, the annual sport harvest averaged 2,074 sockeye salmon from the Kvichak River alone (Table 17). On average, sport harvest accounts for less than 0.1% of the total harvest. From 2009 through 2013, total effort was about 5,503 angler-days (effort is for all species, although anglers mainly fish for rainbow trout and sockeye salmon at the Kvichak River; Table 1). At such low levels, the sport fishery has little effect on ADF&G’s ability to manage for sustained yield.
Based on freshwater logbook data from 2009 through 2013, guided effort averaged 1,518 angler-days (Table 2).
Fishery Management and Objectives Kvichak River sockeye salmon stocks are managed to achieve a sustainable escapement goal (SEG) range of 2 million to 10 million fish (Elison et al. 2015).
The sport fishery is managed in accordance with Kvichak Drainage Sockeye Salmon Management Plan (5 AAC 67.025). The goal of the plan is to provide increased participation and opportunity and to reduce the potential for conflicts between sport and subsistence users. The level of participation in this fishery could grow quickly by improving access to desirable fishing sites, promoting the fishery as a destination, and working to assure necessary facilities are provided to accommodate the growth in a responsible manner. To this end, ADF&G has worked closely with the Igiugig City Council on a project to build trails to desirable fishing locations close to the village airfield. For example, a trail was completed from the village road system to a prime sockeye salmon fishing site along the Kvichak River in fall 2001.
Sport fishery harvests and effort are estimated through the SWHS and reported in the ADF&G Fishery Data Series (Mills 1979–1980, 1981a, 1981b, 1982–1994; Howe et al. 1995, 1996, 2001 a, 2001b, 2001c, 2001d; Walker et al. 2003; Jennings et al. 2004, 2006a, 2006b, 2007, 2009a, 2009b, 2015; Romberg et al. In prep). Commercial and subsistence harvests are monitored by CF and are reported in the ADF&G Annual Management Report series (Elison et al. 2015).
2015 season The 2015 sockeye salmon run to the Kvichak River achieved the minimum SEG of 2.0 million fish. Approximately 7.3 million sockeye salmon were counted at the Igiugig tower. Although no estimate is available at this time, we expect the subsistence harvest to be within the normal historical range of 40,000 to 60,000 sockeye salmon. Due to a large forecast and no inseason emergency orders restricting the sport fishery, the number of anglers targeting sockeye salmon in the Iliamna drainage during 2015 was likely near or above the recent 20-year average and it is therefore anticipated that the sport fishery harvest will be similar to or greater than the recent 20-year average. Estimates of recreational effort, catch, and harvest will not be available until 2016.

45
Table 18.–Historical sockeye salmon harvests and escapements for the Kvichak River, 1995–2015, with 1974–1994 average.
Harvest Year Commercial a Subsistence b Sport c Total Escapement d 1995 20,279,581 54,679 15,023 20,349,283 10,038,720 1996 8,215,028 54,872 6,078 8,275,978 1,450,578 1997 589,311 59,508 7,875 656,694 1,503,732 1998 2,595,439 53,656 13,119 2,662,214 2,296,074 1999 9,452,972 57,723 12,760 9,523,455 6,196,914 2000 4,727,061 36,990 8,479 4,772,530 1,827,780 2001 5,280,538 32,808 4,538 5,317,884 1,095,348 2002 1,418,938 33,001 2,256 1,454,195 703,884 2003 3,348,504 38,495 3,068 3,390,067 1,687,000 2004 4,715,070 53,225 5,098 4,773,393 5,500,134 2005 6,728,469 48,263 4,292 6,781,024 2,320,332 2006 7,151,741 49,850 4,398 7,205,989 3,068,422 2007 9,022,511 47,473 3,697 9,073,681 3,068,226 2008 10,381,844 49,563 9,274 10,440,681 2,810,208 2009 8,514,944 46,772 2,711 8,564,427 2,757,912 2010 10,858,209 40,688 2,628 10,901,525 2,266,140 2011 9,016,321 45,226 2,100 9,063,647 4,207,410 2012 10,152,917 52,370 1,689 10,206,976 2,264,352 2013 4,853,030 42,556 1,244 4,896,830 4,164,444 2014 13,791,057 45,522 2,427 13,839,006 2,088,576 Average 1974–1994 9,111,460 78,014 7,384 6,573,107 6,230,000 1995–2014 7,554,674 47,162 5,638 7,607,474 3,065,809 2010–2014 9,734,307 45,272 2,018 9,781,597 2,998,184 Percent 1995–2014 99% <1% <1% 2010–2014 100% <1% <1% 2015 16,304,723 NA NA NA 4,458,540 Source: Commercial: 1995–2014 Elison et al (2015: Appendix A3), 1974–1994 Browning and Miller (1995: Appendix 5).
Subsistence: 1995–2014 Elison et al (2015: Appendix A28), 1974-1994 Browning and Miller (1995: Appendix 40). Sport: Alaska Sport Fishing Survey database [Intranet]. 1996– . Anchorage, AK: Alaska Department of Fish and Game, Division of Sport Fish (cited October 14, 2015). Available from: https://intra.sf.adfg.state.ak.us/swhs_est/ (custom query details available upon request from ADF&G, Division of Sport Fish, Research and Technical Services). Escapement: 1995–2014 Elison et al (2015: Appendix A1), 1974–1994 Browning and Miller (1995: Appendix Table 1).
a Estimated Kvichak River fish captured in Naknek–Kvichak District commercial fishery. b Harvests are extrapolated for all permits issued, based on those returned. Harvest estimates prior to 1991 are rounded to the
nearest hundred fish. Harvest estimates prior to 1990 are based on the community where the permit was issued; estimates from 1990 to the present are based on community of residence and include fish caught only in the Kvichak District.
c Kvichak River sport harvest only. d Tower counts conducted at Igiugig.

46
NEWHALEN RIVER Fishery Description The Newhalen River is the major tributary in the Kvichak River drainage. It flows from Lake Clark into the north side of Lake Iliamna near the communities of Iliamna and Newhalen (Figure 5). Because it is farther inland, sockeye salmon reach the Newhalen River a few days later than the Kvichak River, and the best angling usually occurs during the middle 2 weeks of July.
The Newhalen River is more easily accessed than the Kvichak River and supports a large run of sockeye salmon. Several businesses and lodges in the town of Iliamna cater to anglers’ needs, and a large runway serviced by regularly scheduled commercial airlines provides economical access from Anchorage. From the runway, a mile-long trail leads to the river. The trail ends near a series of cascades where large numbers of sockeye salmon congregate on their way to spawning grounds in the Lake Clark drainage. The sockeye salmon entering the Newhalen River are one segment of the large Kvichak River run. Hence, comments on the character of the commercial and subsistence harvests for the Kvichak River apply equally for the Newhalen River stocks. The sport fishery on the Newhalen River is unique in the BBMA due to the large component of unguided anglers and for its history of regularly producing 25% to over 40% of the entire BBMA’s annual sport harvest of sockeye salmon (Tables 17). For the period 2009 through 2013, the annual sport harvest averaged 1,458 sockeye salmon (Table 17). ADF&G has not conducted any onsite studies of this fishery to evaluate angler catch and harvest distribution, angler demographics, or to conduct bag limit analysis.
Based on freshwater logbook data from 2009 through 2013, guided effort has remained fairly stable with an average of 146 angler-days (Table 2).
Fishery Management and Objectives Newhalen River sockeye salmon escapement is addressed by achieving the biological escapement goal (BEG) for the Kvichak River.
Sport fishery harvests and effort are estimated through the SWHS and reported in the ADF&G Fishery Data Series (Mills 1979–1980, 1981a, 1981b, 1982–1994; Howe et al. 1995, 1996, 2001a, 2001b, 2001c, 2001d; Walker et al. 2003; Jennings et al. 2004, 2006a, 2006b, 2007, 2009a, 2009b, 2015; Romberg et al. In prep). Commercial and subsistence harvests are monitored by CF and are reported in the ADF&G Annual Management Report series (Elison et al. 2015). SF has not conducted any significant monitoring or stock assessment projects for this fishery. Escapement is estimated by counts made from towers at the village of Igiugig as the salmon migrate up the Kvichak River. Escapement distribution is assessed by aerial index surveys of drainage tributaries by Division of Commercial Fisheries.
2015 season The preceding segment on the Kvichak River sockeye salmon sport fishery thoroughly describes the 2015 season run. Sport fishing was reported as average to above-average throughout the season.
CENTRAL SECTION SOCKEYE SALMON FISHERIES About 15% of Bristol Bay sockeye salmon return to the Central section. Anglers do not fish this section heavily for sockeye salmon, and sport harvests average 2,300 fish, or 15% of the area’s

47
total annual sport harvest (Table 17). Angler harvest of sockeye salmon from the Central Section in 2014 totaled 3,422 fish, and was the highest reported since 20068. The stocks are generally abundant enough to be virtually unaffected by the recreational harvest, and there is a lot of potential for this fishery to grow. The subsistence and sport harvests are each less than 1% of the run. The waters most commonly used by sport anglers are the Nushagak River, Mulchatna River, and the Wood River Lakes system.
RAINBOW TROUT FISHERIES AREAWIDE FISHERY DESCRIPTION Wild rainbow trout stocks are a cornerstone to the multimillion-dollar recreational fishing industry of the BBMA. Sport fishing opportunity for both guided and unguided anglers occurs primarily during the ice-free season, generally from June through October, although fisheries in early and late winter are gaining some popularity. Found throughout the area, the most popular rainbow trout waters include tributaries of the Kvichak River drainage, the Naknek River drainage, portions of the Nushagak–Mulchatna drainage, and streams of the Wood River Lakes system (Figure 6).
The rainbow trout fisheries within the BBMA underwent rapid growth from the late 1970s to mid-1980s, with annual harvests averaging 4,905 fish from 1977 through 2003 (Table 19). From 2009 through 2013, annual harvests averaged 833 fish (Table 19). The importance of this species to the recreational fisheries is not adequately described by estimates of harvest. Results of the SWHS, as well as field studies, show clearly that during the last 20 to 25 years the retention rate, or the number of fish kept from total catch, has declined steadily while the total effort and catch have remained stable or increased (Mills 1979–1980, 1981a, 1981b, 1982–1994; Howe et al. 1995, 1996, 2001a, 2001b, 2001c, 2001d; Walker et al. 2003; Jennings et al. 2004, 2006a, 2006b, 2007, 2009a, 2009b, 2015; Romberg et al. In prep; Minard 1989b, 1990; Brookover 1989; Dunaway 1993). Estimates of catch (number of fish kept plus fish released) were first available from the SWHS in 1991 and have averaged 247,060 annually through 2003. From 2009 through 2013, the annual catch averaged 169,485 rainbow trout (Appendix A4, Figure 7). It is evident the angling public has embraced the concept of catch-and-release for rainbow trout and has voluntarily reduced their harvests throughout the area.
Prior to 1993, rainbow trout were explicitly excluded from harvest under the subsistence priority. The status of rainbow trout as a subsistence species was changed in 1993 when the BOF allowed rainbow trout caught incidentally to other species to be retained by subsistence users. In 1994, the BOF recognized subsistence use of rainbow trout among all other finfish in Bristol Bay (5 AAC 01.336). The subsistence taking of rainbow trout from non-navigable waters located within federal land holdings (National Wildlife Refuges and National Parks) has been allowed since December 1991. In 2002, the Federal Subsistence Board adopted regulations allowing rod and reel subsistence harvest of rainbow trout in federally managed subsistence fisheries in the Bristol Bay area.
Many quality rainbow trout sport fisheries exist throughout the BBMA. Other smaller rainbow trout fisheries not discussed below include Brooks River, Moraine, and Funnel creeks, American
8 Alaska Sport Fishing Survey database [Intranet]. 1996– . Anchorage, AK: Alaska Department of Fish and Game, Division of Sport Fish [cited
October 14, 2015]

48
Creek, Gibraltar River, Copper River, Upper Talarik Creek, Tazimina River, Mulchatna River and Togiak River.
Figure 6.–Popular rainbow trout sport fisheries (delineated with black dots) in the Bristol Bay Sport
Fish Management Area.

49
Table 19.–Sport harvest of rainbow trout by section and drainage in the BBMA, 2004–2014, with 1977–2003 average.
Average 1977–
2003
Annual sport fishing harvest of rainbow trout Average 2009–
2013
Section Drainage 2004 2005 2006 2007 2008 2009 2010 2011 2012 2013 2014 Eastern
Naknek R. 1,012 272 175 196 307 175 60 226 589 48 47 194 78 Brooks R. 74 0 358 22 152 0 0 0 0 0 22 4 0 Kvichak R. 269 193 221 0 457 136 38 60 20 0 0 24 102 Copper R. 69 14 0 0 0 0 0 0 0 133 0 27 320 Alagnak R. 220 163 413 47 20 66 0 0 20 0 124 29 64 Newhalen R. 248 89 77 72 10 272 0 87 0 21 35 29 0 Lake Clark 19 27 0 0 0 0 0 0 0 0 24 5 0 Other 1,375 212 31 191 677 430 187 57 971 0 13 246 32 Subtotal a 3,286 970 1,275 528 1,623 1,079 285 430 1,600 202 265 556 596
Central Nushagak R. 228 164 74 39 243 32 105 99 98 17 0 64 0 Mulchatna R. 371 37 36 298 262 25 23 186 96 309 0 123 0 Agulowak R. 4 397 22 72 76 77 9 0 67 17 58 30 52 Agulukpak R. 2 0 21 0 0 0 0 0 0 0 0 0 0 Wood River L. b 378 156 55 104 169 31 17 34 33 50 0 27 0 Tikchik L.–Nuyakuk R. 72 0 0 0 0 0 10 0 0 0 0 2 0 Other 479 117 132 67 0 0 0 17 20 0 0 7 0 Subtotal a 1,534 871 340 580 750 165 164 336 314 393 58 253 52
Western Togiak R. 77 102 287 0 152 11 13 0 47 57 0 23 0 Other 9 0 0 0 0 0 0 0 0 0 0 0 0 Subtotal a 86 102 287 0 152 11 13 0 47 57 0 23 0
Total 4,905 1,943 1,902 1,108 2,525 1,255 462 766 1,961 652 323 833 648 Source: Alaska Sport Fishing Survey database [Intranet]. 1996– . Anchorage, AK: Alaska Department of Fish and Game, Division of Sport Fish (cited October 14, 2015).
Available from: https://intra.sf.adfg.state.ak.us/swhs_est/ (custom query details available upon request from ADF&G, Division of Sport Fish, Research and Technical Services). a Subtotals of averages may not be the sum of the drainages because information for some drainages is not available for some years. b Wood River Lakes includes Lake Nunavaugaluk. Prior to 1998, Agulowak and Agulukpak rivers were included in Wood River Lakes.

50
Figure 7.–Sport catch of rainbow trout by section for the Bristol Bay Sport Fish Management Area,
2004–2014, with averages for 1991–2003 and 2009–2013.
SOUTHWEST ALASKA RAINBOW TROUT MANAGEMENT PLAN In February 1990, the BOF adopted regulations implementing a comprehensive management plan for rainbow trout in the area previously known as the Southwest Alaska Management Area. This area included the BBMA, the waters flowing into Kuskokwim Bay from Cape Newenham to the outlet of the Kuskokwim River, and the Kuskokwim River and tributaries from the Aniak River to Kuskokwim Bay9. Still in force, this plan is not a regulation but is used as a policy for guiding the BOF and the public. It provides a clear understanding of the underlying principles by which rainbow trout stocks are to be managed and provides guidance for the BOF in developing future regulations. In 1998, the BOF adopted Criteria for Establishing Special Management Areas for Trout (5 AAC 75.013). This regulation embodies most of the criteria that originated, and are still used, in the Southwest Alaska Rainbow Trout Management Plan.
Philosophy of the Plan The overriding philosophy of the Southwest Alaska Rainbow Trout Management Plan is one of conservative wild stock management. Conservative wild stock management does not necessarily preclude limited harvest of rainbow trout for food or trophies. However, maximum yield principles that emphasize harvest are ruled out. Additionally, under a philosophy that emphasizes wild trout management, mitigating losses of wild stocks through enhancement or stocking is not considered a desirable management alternative. 9 ADF&G. 1990. Southwest Alaska rainbow trout management plan. Located at: Alaska Department of Fish and
Game, Division of Sport Fish, 333 Raspberry Road, Anchorage.
0
50,000
100,000
150,000
200,000
250,000
300,000
91‐03Avg
2004 2005 2006 2007 2008 2009 2010 2011 2012 2013 09‐13Avg
2014
Spor
t cat
ch (n
umbe
r of r
ainb
ow tr
out)
Year
Western
Central
Eastern

51
Conservative wild stock management is guided by both biological considerations and social concerns. Growth in the region’s rainbow trout sport fisheries is inevitable, but by managing the area’s wild rainbow trout stocks conservatively, the potential for serious long-term resource problems is minimized. From a social perspective, conservative wild stock management is consistent with the priorities of most of the public presently using the resource. The Southwest Alaska Rainbow Trout Management Plan contains 3 policies that are intended to protect the biological integrity of the region's wild trout stocks and maximize their recreational benefit and economic potential. The policies guide the development of sport fishing regulations and provide ADF&G management biologists, BOF members, and the public with clear direction as to how rainbow trout fisheries in the BBMA should be managed. The 3 policies are as follows:
1) Native rainbow trout populations will be managed to maintain historic size and age compositions and at stock levels sufficient such that stocking is not needed to enhance or supplement the wild population.
2) A diversity of sport fishing opportunities for wild rainbow trout should be provided through establishment of special management areas by regulation. Selection of areas for special management will be based on criteria to be adopted by the BOF.
3) Management strategies should be consistent with the prudent economic development of the state's recreational sport fishing industry while at the same time acknowledging the intrinsic value of this fishery resource to the people of Alaska.
Plan Implementation Regulations based on the Southwest Alaska Rainbow Trout Management Plan were adopted by the BOF in February 1990. These regulations were designed to implement the 3 management policies contained in the rainbow trout management plan. Specifically, BOF did as follows:
1) Expanded the Wild Trout Zone from the Iliamna drainage to include the drainages of Bristol Bay and Kuskokwim Bay and the Kuskokwim River from Aniak River downstream.
2) Established 8 catch-and-release areas in the BBMA and 3 catch-and-release areas in the Lower Kuskokwim Management Area (Figure 8).
3) Established 6 artificial fly-only, catch-and-release-only areas (Figure 9).
4) Established 11 unbaited single-hook artificial lure only areas to protect rainbow trout stocks (Figure 10).
Adoption of regulations implementing the management policies contained in this plan was not expected to be a one-time effort. Rather, policy implementation was understood to be a long-term process, with the policies used as the framework to develop a very important and unique resource. Special management regulations have since been adopted using this process for the Kvichak River in Bristol Bay, and the Kanektok, Kwethluk, Kasigluk, and Kisaralik rivers in the Kuskokwim area during the BOF meetings held in the fall and winter of 1997. This plan has also proved to be a useful guide for rainbow trout management in other parts of the state.

52
Figure 8.–Catch-and-release special management areas for rainbow trout in the Bristol Bay Sport Fish
Management area.

53
Figure 9.–Fly-only, catch-and-release special management areas for rainbow trout in the Bristol Bay
Sport Fish Management Area.

54
Figure 10.–Unbaited single-hook artificial lure special management areas for rainbow trout in the
Bristol Bay Sport Fish Management Area.

55
LOWER TALARIK CREEK Fishery Description Lower Talarik Creek, located at the northwest corner of Lake Iliamna, is renowned for its high quality rainbow trout sport fishery. The creek is relatively small and most anglers only fish along the first 2 miles above its entrance into Lake Iliamna. The large fish, for which Lower Talarik Creek is so famous, enter the creek from Iliamna Lake to feed on salmon eggs and carcasses in the fall. The sport fishery takes advantage of this migration and is most active from mid-August until late September or October. Most anglers fishing Lower Talarik Creek are guided nonresidents who make daily fly-in trips from the many lodges operating in the Lake Iliamna area (Table 2). As many as 30 anglers can be accommodated at any given time in the lower portion of the creek that is commonly fished.
In 1992, a Native land claim had the potential to eliminate public access to this world-class rainbow trout fishery. Through an agreement with the claimant, the Nature Conservancy (TNC) obtained the land and coordinated a land management agreement with ADF&G and the Alaska Department of Natural Resources (DNR). One stipulation of the agreement was to create a Special Use Area along the lower reaches of Lower Talarik Creek that would allow public access. After extensive discussions with local leaders, the Special Use Area was created in August 1999. In the spring of 2001, TNC initiated a process to convey these lands to the state for management. The DNR-Realty Section has finalized the transfer.
Fisheries managers first estimated angler effort and harvest on Lower Talarik Creek rainbow trout with onsite creel surveys from 1970 through 1976. Annual harvest ranged from a high of 433 fish in 1971 to 73 fish in 1974. Since 1977, effort has been estimated from the SWHS and has been measured in angler-days (Mills 1979–1980, 1981a, 1981b, 1982–1994; Howe et al. 1995, 1996, 2001a, 2001b, 2001c, 2001d; Walker et al. 2003; Jennings et al. 2004, 2006a, 2006b, 2007, 2009a, 2009b, 2015; Romberg et al. In prep). Onsite creel surveys conducted during the fall fisheries of 1989, 1990, 1991, and 1993 through 2001 found effort has been at the upper range of, but not significantly different from, the levels observed in the 1970s. Note the small estimates of catch and effort in 1997 and 2001 are due to the short duration of those surveys.
Based on freshwater logbook data from 2009 through 2013, guided effort has remained fairly stable with an average of 124 angler-days (Table 2).
Fishery Management and Objectives The Lower Talarik Creek rainbow trout fishery is managed to maintain historical age and size composition and a diversity of angling opportunity by maintaining the special management designation with artificial fly-only, catch-and-release.
Lower Talarik Creek was designated a special management area in 1990 as part of the implementation of the Southwest Alaska Rainbow Trout Management Plan. Sport fishing is restricted to unbaited artificial flies, and the area is catch-and-release only for rainbow trout. A season closure from April 10 through June 7 provides protection for spawning rainbow trout during this critical life stage.
Sport fishery harvests and effort are estimated through the SWHS and reported in the ADF&G Fishery Data Series (Mills 1979–1980, 1981a, 1981b, 1982–1994; Howe et al. 1995, 1996, 2001a, 2001b, 2001c, 2001d; Walker et al. 2003; Jennings et al. 2004, 2006a, 2006b, 2007,

56
2009a, 2009b, 2015; Romberg et al. In prep). Subsistence harvest data are collected by CF onsite surveys that yield detailed estimates of angler use and success. Biological information and demographic information are also collected. Significant stock assessment and creel survey results are reported by Russell (1977), Minard (1990), Minard et al. (1992).
Lower Talarik Creek’s small size, accessibility, and abundant large rainbow trout garnered early regulatory attention. A synopsis of significant regulation changes can be found in Table 20.
Table 20.–A chronology of significant regulation changes for Lower Talarik Creek.
Effective year Regulation
1965 Spawning season closure imposed on Lower Talarik Creek. Lower Talarik Creek closed to all fishing from April 10 to June 8.
1968 Lower Talarik Creek was included in the "Bristol Bay Trophy Fish Area." 1969 Bag and possession limits reduced to 5 trout, only 1 over 20 inches in length. Helicopter access was
forbidden, single hooks were required on tackle. 1974 The use of bait was prohibited during the summer months. 1977 Trophy Fish Area renamed the Bristol Bay Wild Trout Area, retaining the regulations accumulated
since 1965. 1981 Gear was limited to single-hook artificial flies from June to October. 1984 Reduced the bag and possession limit to 2 rainbow trout, 1 over 20 inches. 1985 Reduced the bag limit to 1 rainbow trout during the summer. 1990 Adopted the Southwest Alaska Rainbow Trout Management Plan. Lower Talarik Creek was designated
as a special management area to be managed under fly-fishing-only, catch-and-release restrictions.
1999 Alaska Department of Natural Resources (DNR) designated as a Special Use Area, the 5 sections of state owned land immediately surrounding the lower reaches of Lower Talarik Creek. Guidelines for overnight camping and commercial activities were established. Also, the ADNR entered into an Interagency Land Management Agreement (ILMA) for approximately 2 acres of land on which stands the Division of Sport Fish (SF) cabin.
2001 The Nature Conservancy initiated a transfer of its privately held lands to the DNR with management responsibilities to be delegated ADF&G SF.
A Native Allotment claim that could have jeopardized public access to the Lower Talarik Creek fishery has recently been resolved. TNC of Alaska acquired title to the claim, which included the land adjacent to the most popular fishing sites along Lower Talarik Creek, through a special agreement with the claimant. In December 1995, TNC coordinated a 3-way land management agreement with ADF&G and DNR. One stipulation of the agreement was to establish a Special Use Area (SUA) for the lower reaches of Lower Talarik Creek and nearby uplands. This was completed in August 1999 with some controversy, and after extensive discussions with local municipalities and leaders. Finalizing the SUA allowed the DNR to enter into an Interagency Land Management Agreement (ILMA) with ADF&G for the land area on which the ADF&G-owned cabin sits. The ILMA was completed at about the same time as the SUA. The next steps in the agreement are to obtain Critical Habitat status for the drainage and the eventual conveyance of the TNC holdings to the State of Alaska for long-term management. During the spring of 2001, TNC advised the State of Alaska of its interest in conveying its lands to the state but there was little movement until late in the year. The conveyance is now complete.

57
Research From 2009 through 2015, a weir was operated each season from breakup in April or May until approximately June 7. Consecutive years of weir data were collected to assess spawning abundance, length composition, and life history of Lower Talarik Creek rainbow trout. Upstream and downstream weir counts of spawning rainbow trout from 2009 through 2015 ranged from 49 to 181 and 163 to 794, respectively (Table 21). A comparison of weir counts, visual counts, and length compositions with past data indicate fewer mature rainbow trout and fewer large rainbow trout than in data collected in the 1970s and 1997.
2015 Season Estimates of sport fishing effort, catch, and harvest will not be available until 2016; however, anglers reported that sport fishing for rainbow trout was good in 2015.
Table 21.–Lower Talarik Creek rainbow trout weir counts 2009–2015.
Upstream passage Downstream passage Year Spawner Nonspawner Total Spawner Nonspawner Total
2009 98 86 184 271 261 532
2010 78 99 177 511 152 663
2011 103 125 228 330 169 499
2012 99 27 126 456 745 1,201
2013 49 169 218 163 170 333
2014 32 39 71 435 983 1,418
2015 181 63 244 794 857 1,651
KVICHAK RIVER Fishery Description The Kvichak River (Figure 1) is recognized around the world for its large rainbow trout. Presently the river is one of the few waters in Southwest Alaska where anglers may still harvest large rainbow trout. Recent studies of rainbow trout in the Kvichak River provide a unique opportunity to examine changes in abundance, recruitment, survival, and age and length compositions of a moderately exploited wild Alaskan rainbow trout population. Additionally, as part of a regionwide comprehensive management planning exercise, SF is developing concise, measurable management objectives for this important fishery. Stock status information is needed to develop specific management objectives for this fishery.
In late winter and spring, rainbow trout aggregate in the upper Kvichak River near the outlet of Lake Iliamna. From 1987 through 1997, ADF&G conducted a mark–recapture study to estimate the abundance and survival of fish in this aggregation. Findings from this study have raised questions about the nature of the aggregation (i.e., whether it is composed of overwintering fish from several natal streams or prespawning fish from the Kvichak River only). If some rainbow trout marked at the upper Kvichak River during a spring sampling event subsequently emigrate and spawn in other streams in future years, then survival estimates from the mark–recapture study are a measure of both mortality and emigration. Radiotelemetric data from sexually mature Lower Talarik Creek rainbow trout suggest the majority of rainbow trout that spawn in Lower

58
Talarik Creek are not susceptible to angling pressure on the Kvichak River and do not appear to significantly contribute to the prespawning population of rainbow trout in the Kvichak River.
Fishery Management and Objectives Sport fishery harvests and effort are estimated through the SWHS and reported in the ADF&G Fishery Data Series (Mills 1979–1980, 1981a, 1981b, 1982–1994; Howe et al. 1995, 1996, 2001a, 2001b, 2001c, 2001d; Walker et al. 2003; Jennings et al. 2004, 2006a, 2006b, 2007, 2009a, 2009b, 2015; Romberg et al. In prep).
The Kvichak River rainbow trout fishery is managed to maintain historical abundance and size composition of rainbow trout.
2015 Season Estimates of sport fishery effort, catch, and harvest will not be available until 2016; however, anglers reported that sport fishing for rainbow trout was good to excellent in 2015.
ALAGNAK (BRANCH) RIVER Fishery Description The Alagnak River, frequently referred to locally as the Branch River, is located in the eastern section of the BBMA and flows into the Kvichak River approximately 40 miles north of King Salmon. The Alagnak River arises in Katmai National Park and Preserve and the upper 55 miles have been designated a Wild and Scenic River.
Two large lakes, Kukaklek and Nonvianuk, feed this drainage. Kukaklek Lake is drained by the Alagnak River while the Nonvianuk River flows 11 miles from Nonvianuk Lake to join the Alagnak River from the south. The Nonvianuk River is a wide, relatively gently flowing river (class two or less) that provides the most convenient float trip access to the upper drainage. The upper Alagnak River is characterized by a narrow canyon and class two rapids that provide a more rigorous boating experience. Below its confluence with the Nonvianuk River, the Alagnak is slower and easily navigated. At the proper water levels, both rivers can be navigated their entire lengths with power boats. The water is clear throughout its length, though the lower 20 miles are colored lightly from silt and bog-stained runoff.
In the lower portion of the drainage, anglers pursue Chinook, sockeye, chum, and coho salmon. In the upper reaches, rainbow trout are the big attraction, with some lake trout (Salvelinus namaycush) at headwater lakes and Arctic char and Arctic grayling in the river, adding diversity to the angling experience. The fisheries are accessed with power boats, particularly the lower one-half to two-thirds of the river, while float trips are the most common access in the upper reaches. Several lodges are based along the river and many other lodges from the surrounding area fly clients to the river for day-trip fishing.
The easy access and abundant fish populations of the Alagnak River are major reasons the popularity of this river has grown so quickly. Rainbow trout from the Alagnak River drainage are similar to fish of the nearby Kvichak and Naknek rivers drainages and are known for their abundance and large size.
In terms of angler effort, the Alagnak River is among the top 3 most popular fishing destinations in Southwest Alaska, along with the Naknek and Nushagak rivers (Tables 1 and 2). Estimates of effort and harvest for rainbow trout from the Alagnak River were first available in 1981 from the

59
SWHS. Historically, effort averaged 6,573 angler days annually from 1977 through 2003 (Table 1). In the last 10 years, effort peaked at 11,747 angler-days in 2006 and has since decreased with a recent 5-year average from 2009 through 2013 of 5,516 angler-days; in 2014, effort was up slightly with 6,013 angler-days (Table 1). Since estimates of catch were first made in 1991, the annual average sport catch (fish released plus fish kept) of rainbow trout from 1991 through 2003 was estimated at 34,518 fish, giving the sport fishery in the Alagnak River the largest catch of rainbow trout in the BBMA during that time (Appendix A4). Harvest rates have dropped dramatically since 1998, when catch-and-release only regulations were instituted to address concerns for the rainbow trout population.
Fishery Management and Objectives The Alagnak River rainbow trout fishery is managed to maintain historical abundance and size composition.
Sport fishery effort, catch, and harvest are estimated through the SWHS and reported in the ADF&G Fishery Data Series (Mills 1979–1980, 1981a, 1981b, 1982–1994; Howe et al. 1995, 1996, 2001a, 2001b, 2001c, 2001d; Walker et al. 2003; Jennings et al. 2004, 2006a, 2006b, 2007, 2009a, 2009b, 2015; Romberg et al. In prep). Subsistence harvests are considered slight but are not well monitored. Onsite surveys yield detailed estimates of angler use and success as well as data on angler demographics and biological samples from the catch. Significant stock assessment and creel survey results, focused on the lower river salmon fisheries but containing some rainbow trout data, have been collected and reported by Brookover (1989), Dunaway (1990a, 1994), and by Naughton and Gryska (2000). Surveys of the spring sport fisheries were conducted jointly with the National Park Service and ADF&G in 1996 at the outlet of Nonvianuk Lake and at the outlet of Kukaklek Lake in 1997 (Jaenicke 1998a, 1998b).
Located between the Kvichak and Naknek rivers drainages, management of the Alagnak and Nonvianuk rivers rainbow trout fisheries has been much the same as outlined for those adjacent fisheries. For quite some time, the sport fishing season has featured a spring spawning closure from April 10 through June 7 and single-hook artificial lure only restrictions. Until 1998, regulations for the open water season allowed the retention of 1 rainbow trout per day with no size limit.
In the 1997 fall BOF meeting, the Alagnak River rainbow trout fishery was restricted by regulation to catch-and-release only out of concerns for the stock status. This no-harvest regulation has been in effect ever since for the period of June 8 through October 31 in the Alagnak and Nonvianuk rivers10. From November 1 through April 9, anglers may retain 5 rainbow trout less than 18 inches in length. The new regulations were generally well received by anglers and are expected to provide a measure of protection to this population until better information becomes available. The relatively large rainbow trout and salmon fisheries, coupled with significant float trip and motor boat use, has been a concern of the NPS, nearby communities, and some anglers. NPS has designated the 55-mile portion of the river as a wild and scenic river. Human impacts to uplands, stock status of fish populations, and boat wake erosion are high priority issues.
2015 Season 10 Alaska sport fishing regulations summary––Bristol Bay drainages (effective April 15, 2015 through April 14,
2016) Alaska Department of Fish and Game, Division of Sport Fish, Anchorage.

60
Estimates of sport fishing effort, catch, and harvest will not be available until 2016; however, anglers reported that sport fishing for rainbow trout was above average in 2015.
UPPER NUSHAGAK RIVER Fishery Description The upper Nushagak River consists of the stretch of river upstream of the confluence with the Nuyakuk River. The upper Nushagak River provides an attractive alternative to more crowded rainbow trout fisheries in the area. The rainbow trout are not as large as those in other rivers of the area, but they are abundant. There are approximately 5 camps situated in this section of river that are operated by sport guide services. In addition, this section of the river is popular for float trips.
Sport fishing effort in the Nushagak River upstream of the Mulchatna River has averaged 1,376 angler days from 2009 through 2013 with a low of 955 angler days in 2011. In 2014, effort was up from recent years with 3,006 angler days11.
Fishery Management and Objectives Sport fishery effort, catch, and harvest are estimated through the SWHS and reported in the ADF&G Fishery Data Series (Mills 1979–1980, 1981a, 1981b, 1982–1994; Howe et al. 1995, 1996, 2001a, 2001b, 2001c, 2001d; Walker et al. 2003; Jennings et al. 2004, 2006a, 2006b, 2007, 2009a, 2009b, 2015; Romberg et al. In prep).
The upper Nushagak River rainbow trout fishery is managed to maintain historical abundance and size composition of rainbow trout.
The upper Nushagak River upstream of Harris Creek, including the King Salmon River, has been designated as a special management area, restricted to unbaited single hook tackle and catch-and-release for rainbow trout since 1990. Sport fishery effort, catch, and harvest are estimated via the SWHS. Subsistence harvests are not well monitored and the best information is obtained from a household survey of freshwater fish harvest conducted by the Division of Subsistence.
Size composition data for rainbow trout between Harris Creek and the Chichitnok River was collected by SF in 1999 and 2006. The average size of fish was approximately 16 inches, and no fish larger than 23 inches were sampled.
2015 Season Estimates of sport fishing effort, catch, and harvest will not be available until 2016; however, anglers reported that sport fishing for rainbow trout was average in 2015.
NAKNEK RIVER Fishery Description The first significant recreational use of Naknek River rainbow trout stocks occurred in the mid-1950s when 2 recreational camps were constructed by the military for use by military personnel. The camps, one located at the outlet of Naknek Lake (Lake Camp) and one at the lower reach of the rapids (Rapids Camp) provided a base for significant sport fishing opportunity until 1974. 11 Alaska Sport Fishing Survey database [Intranet]. 1996– . Anchorage, AK: Alaska Department of Fish and Game, Division of Sport Fish [cited
October 14, 2015]

61
During that time period, civilians discovered the bountiful resources, and effort continued to grow. By the mid-1980s there were approximately 12 guiding services working the river regularly, with others less frequently. Boat rental and lodging services, available in King Salmon, provided the necessary support needed by the unguided angler.
The majority of the rainbow trout sport fishery takes place in the upper reach of the river from Rapids Camp upstream to the outlet of Naknek Lake and has 3 periods of activity: March to April 10, June 8 to June 30, and August 15 to freeze-up in October. While rainbow trout may be found during July and early August, the huge influx of salmon during this time tends to depress rainbow trout angling. A few determined anglers seek rainbow trout whenever there is open water, and fishing through the ice is a popular activity for some anglers and some subsistence users.
Guided sport fishing effort on the Naknek River has been relatively stable since 2006, ranging from a low of 3,160 angler-days in 2010 to a high of 4,273 angler-days in 2008 and averaging 3,695. Total sport fishing effort in the Naknek River has remained relatively stable with a historical average from 1977 through 2003 of 13,980 angler days and a recent average from 2009 through 2013 of 14,714 angler-days. Rainbow trout catch in the Naknek River in the last 10 years has ranged from a low of 15,555 fish in 2006 to a high of 31,097 fish in 2009 and has remained stable relative to effort (Table 22).
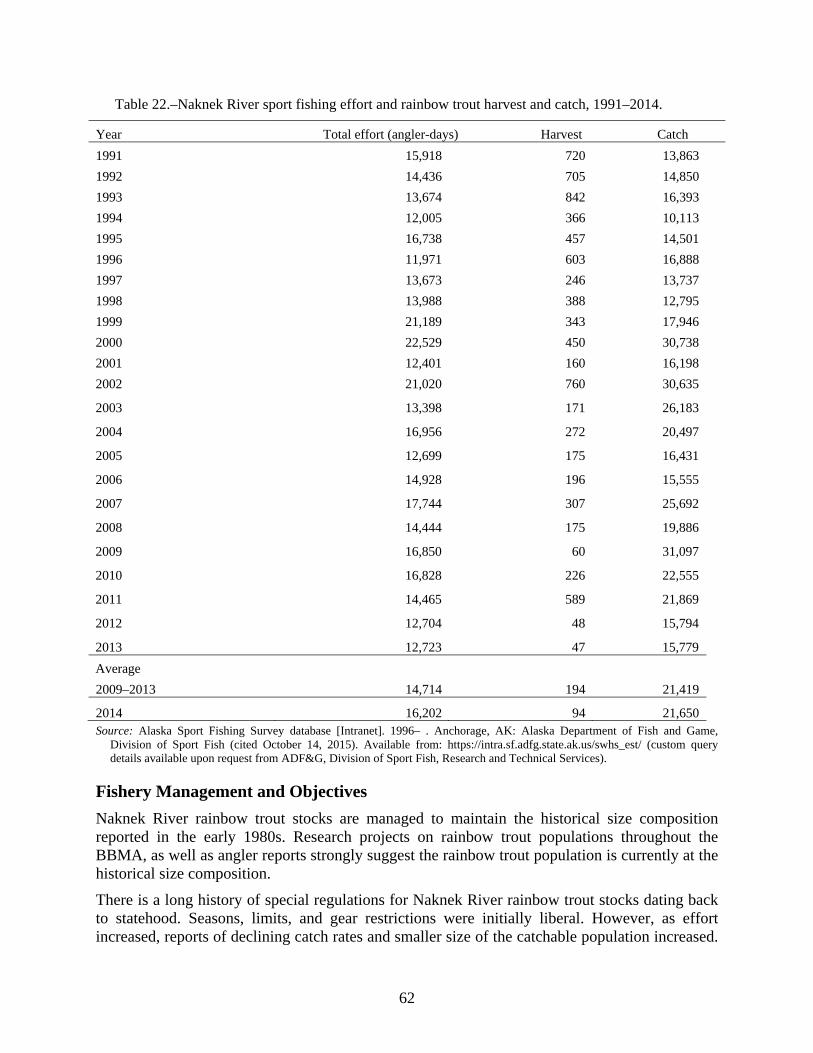
62
Table 22.–Naknek River sport fishing effort and rainbow trout harvest and catch, 1991–2014.
Year Total effort (angler-days) Harvest Catch 1991 15,918 720 13,863 1992 14,436 705 14,850 1993 13,674 842 16,393 1994 12,005 366 10,113 1995 16,738 457 14,501 1996 11,971 603 16,888 1997 13,673 246 13,737 1998 13,988 388 12,795 1999 21,189 343 17,946 2000 22,529 450 30,738 2001 12,401 160 16,198 2002 21,020 760 30,635
2003 13,398 171 26,183
2004 16,956 272 20,497
2005 12,699 175 16,431
2006 14,928 196 15,555
2007 17,744 307 25,692
2008 14,444 175 19,886
2009 16,850 60 31,097
2010 16,828 226 22,555
2011 14,465 589 21,869
2012 12,704 48 15,794
2013 12,723 47 15,779 Average 2009–2013 14,714 194 21,419
2014 16,202 94 21,650 Source: Alaska Sport Fishing Survey database [Intranet]. 1996– . Anchorage, AK: Alaska Department of Fish and Game,
Division of Sport Fish (cited October 14, 2015). Available from: https://intra.sf.adfg.state.ak.us/swhs_est/ (custom query details available upon request from ADF&G, Division of Sport Fish, Research and Technical Services).
Fishery Management and Objectives Naknek River rainbow trout stocks are managed to maintain the historical size composition reported in the early 1980s. Research projects on rainbow trout populations throughout the BBMA, as well as angler reports strongly suggest the rainbow trout population is currently at the historical size composition.
There is a long history of special regulations for Naknek River rainbow trout stocks dating back to statehood. Seasons, limits, and gear restrictions were initially liberal. However, as effort increased, reports of declining catch rates and smaller size of the catchable population increased.

63
ADF&G studies conducted in the late 1980s verified the suspected decline. Available data supported by public opinion indicate the stocks have recovered. Current regulations still reflect the remedial actions adopted in 1990 and allow for harvest of 1 rainbow trout per day less than 18 inches in length during summer and fall, and a winter season harvest of 5 per day less than 18 inches in length. The spawning season closure is in effect from April 10 to June 7, and only single-hook artificial lures may be used in the area above Rapids Camp. In 1997, the BOF restricted hook gap size to one-half inch or less from March 1 through April 9 and June 8 through July 31 to protect rainbow trout.
In the late 1990s, growing interest in the spring fishery that occurs prior to April 9 sparked heated public requests for more intensive management during this time period. Some anglers supported managing portions of the river for quality of experience by advocating restrictions to angler access. Other management suggestions included managing for a particular size composition in the sport catch with emphasis on providing very large fish. Another group of anglers was convinced that growth of the rainbow trout fishery on the Naknek River required a spawning season closure earlier than April 10 to maintain the biological integrity of the population. Regardless of the perspective, it appears clear that the angling public is extremely interested in maintaining and enhancing this fishery.
Strong fishery performance seems to have allayed the concerns of some individuals. Angler success throughout the recent seasons has been good and there are numerous accounts of large rainbow trout being caught.
2015 Season Estimates of sport fishing effort, catch, and harvest will not be available until 2016; however, anglers reported that sport fishing for rainbow trout was good to excellent throughout the 2015 season.
OTHER SPECIES FISHERIES The BBMA offers diverse sport fishing opportunity for a large variety of species that often go unnoticed because of the publicity given to the more popular species. Arctic char or Dolly Varden, Arctic grayling, lake trout, northern pike, and chum and pink salmon are 6 species that contribute to the sport fishing enjoyment of many anglers who fish the area. Catch and harvest estimates are made annually for these other species and trends are followed for the more popular sport species (Appendices A5 and A6).
WOOD RIVER LAKES SYSTEM ARCTIC CHAR Fishery Description The Wood River Lake system is a series of 5 large connected lakes north of Dillingham that drain into Wood River and the Nushagak Bay at Dillingham (Figure 1). All of the lakes except the eastern two-thirds of Lake Aleknagik are included in the boundaries of the Wood–Tikchik State Park. This lake system sustains large populations of Dolly Varden and Arctic char, which are very popular with sport anglers and subsistence users. The most popular angling sites are the Agulowak River, which connects Lake Nerka with Lake Aleknagik, and the Agulukpak River connecting Lake Beverly with Lake Nerka (Figure 1). There are many other good fishing spots throughout the system but these 2 rivers (often called the ”wak” and ”pak”) and the outlets of

64
other tributaries into Lake Aleknagik likely support the great majority of Arctic char angling effort in the system.
When viewed by estimated catch and harvest, the sport fishery for Dolly Varden and Arctic char in the Wood River Lakes is the largest fishery for these species in the BBMA (Table 23, Appendix A5). Between 1977 and 2003, sport fishing effort in the Wood River Lakes averaged 5,706 angler-days per year, and the most recent 5-year average from 2009 through 2013 is 5,599 angler-days (Table 1). Much of the effort is aimed at Arctic char and Dolly Varden, and the bulk of the sport harvest for these 2 species occurs at the mouths of the Agulowak and Agulukpak rivers.
A stock assessment project conducted in 1993 found the abundance of Arctic char at the mouth of the Agulowak River had declined from 12,000 to 5,000 fish over a 10-year period (Minard and Hasbrouck 1994). Sport harvests during the period of decline are thought to have been excessive. This prompted emergency order reduction in bag limits for the 1994 season. Restrictive regulations addressing this fishery were adopted by the BOF in January 1995. The new regulations reduced the daily bag limit from 10 to 2 fish per day and in possession and required the use of single-hook artificial lures. Additionally, a single-hook artificial lure restriction was adopted for the portion of Lake Aleknagik within a half-mile radius of the outlet of the Agulowak River. These restrictions have been in place since the 1994 season (by emergency order in 1994, and by regulation since 1995). Public acceptance and compliance has been good. Overall, the Arctic char stocks at the Agulowak River appear to have recovered, suggesting that the regulatory changes have been sufficient to allow recovery to previous levels. High effort at the outlet of the Agulowak River continues and may require ongoing attention.
Since the BOF action, harvests of Dolly Varden and Arctic char for the Wood River Lake system (Wood River Lakes, Agulowak River, and Agulupak River) have remained fairly stable, with less than 1,000 fish per year since 2005 (Table 23). The vast majority of the harvest comes from the Agulowak River stock; the fishery at the Agulukpak is primarily catch-and-release.
Fishery Management and Objectives The management objective for this fishery is to maintain the Agulukpak and Agulowak rivers stocks at the abundance and sizes previously documented in the 1980s. Sport fishery effort, catch, and harvest are estimated through the SWHS and reported in the ADF&G Fishery Data Series (Mills 1979–1980, 1981a, 1981b, 1982–1994; Howe et al. 1995, 1996, 2001a, 2001b, 2001c, 2001d; Walker et al. 2003; Jennings et al. 2004, 2006a, 2006b, 2007, 2009a, 2009b, 2015; Romberg et al. In prep). Subsistence harvests are not well monitored and are managed by the Division of Commercial Fisheries. Onsite surveys yield detailed estimates of angler use and success. Biological information and demographic information are also collected. Significant stock assessment and creel survey results have been reported by Minard (1989b), and Minard and Hasbrouck (1994).
2015 Season Estimates of sport fishery effort, catch, and harvest will not be available until 2016; however, anglers reported that sport fishing for Dolly Varden and Arctic char was excellent throughout the 2015 season.

65
Table 23.–Sport harvest of Dolly Varden and Arctic char from the waters of the BBMA by fishery, 2004–2014, with 1977–2003 average.
Average 1977–
2003
Annual sport fishing harvest of Dolly Varden and Arctic char Average 2009–
2013
Section Drainage 2004 2005 2006 2007 2008 2009 2010 2011 2012 2013 2014 Eastern
Ugashik 198 148 27 14 29 0 0 15 434 0 44 99 0 Egegik-Becharof 154 136 12 111 38 117 0 152 46 24 0 44 225 Naknek R. 654 372 93 207 845 93 66 244 269 122 49 150 86 Naknek L. 67 0 24 14 26 0 0 92 0 32 0 25 30 Bay of Islands 107 13 0 70 0 45 16 12 0 0 0 6 0 Brooks R. 22 0 0 0 0 0 0 195 0 16 0 42 0 Brooks L. 4 0 0 0 0 0 0 0 0 0 0 0 0 American Cr. 76 316 81 28 215 0 152 304 123 88 0 133 107 King Salmon R. (Ugashik) 28 0 0 0 0 0 0 0 0 0 0 0 0 Kvichak R. 79 40 0 53 18 0 42 15 48 16 16 27 17 Copper R. 20 30 0 0 0 30 0 0 0 0 0 0 389 Alagnak R. 97 0 13 26 71 0 22 84 0 27 99 46 81 Newhalen R. 210 0 37 37 69 137 22 70 44 0 0 27 0 L Talarik Cr. 16 0 0 0 0 0 0 0 0 0 0 0 0 Lake Clark 125 53 0 0 0 0 0 29 58 11 0 20 49 Lake Iliamna 111 205 212 83 201 131 0 0 455 0 0 91 0 Kulik R. 0 0 0 0 0 0 22 0 0 0 0 4 0 Tazimina R. 19 0 0 0 0 0 0 0 0 0 0 0 0 Moraine Cr. 2 0 0 0 0 33 0 0 0 0 0 0 17 Other 447 154 224 109 30 44 34 14 0 0 87 27 15
Subtotal a 2,243 1,467 723 752 1,542 630 376 1,226 1,477 336 295 742 1,016 -continued-

66
Table 23.–Part 2 of 2.
Average 1977–
2003
Annual sport fishing harvest of Dolly Varden and Arctic char Average 2009–
2013
Section Drainage 2004 2005 2006 2007 2008 2009 2010 2011 2012 2013 2014 Central
Nushagak R. 226 842 161 228 254 63 308 211 235 163 197 223 61 Mulchatna R. 166 273 120 124 180 121 162 81 83 32 53 82 135 Agulowak R. 207 296 74 433 153 222 103 166 112 53 88 104 132 Agulukpak R. 84 53 81 0 9 0 30 308 48 11 16 83 0 Wood River L. b 1,191 2,539 790 468 664 476 770 542 319 279 154 413 381 Tikchik L.–Nuyakuk R. 194 341 120 0 18 15 166 29 0 0 0 39 68 Koktuli R. 43 0 24 41 30 0 62 0 0 159 0 44 61 Other 216 53 118 0 0 11 163 244 97 391 47 188 61 Subtotal a 2,055 4,397 1,488 1,294 1,308 908 1,764 1,581 894 1,088 555 1,176 899
Western Togiak R. 357 501 190 167 256 375 287 90 196 33 153 152 122 Other 5 0 0 0 0 17 0 0 27 13 37 15 0 Subtotal a 564 501 190 167 256 392 287 90 223 46 190 167 122
Total 4,862 6,365 2,401 2,213 3,106 1,930 2,427 2,897 2,594 1,470 1,040 2,086 2,037 Source: Alaska Sport Fishing Survey database [Intranet]. 1996– . Anchorage, AK: Alaska Department of Fish and Game, Division of Sport Fish (cited October 14, 2015).
Available from: https://intra.sf.adfg.state.ak.us/swhs_est/ (custom query details available upon request from ADF&G, Division of Sport Fish, Research and Technical Services). a Subtotals of averages may not be the sum of the drainages because information for some drainages is not available for some years. b Wood River Lakes includes Lake Nunavaugaluk. Prior to 1998, Agulowak and Agulukpak rivers were included in Wood River Lakes.

67
UGASHIK LAKES ARCTIC GRAYLING The Ugashik Lakes are located on the Alaska Peninsula, 560 km southwest of Anchorage, and are within the Alaska Peninsula National Wildlife Refuge. Two popular sport fishery areas are the Ugashik Narrows, which connect the Upper and Lower Ugashik lakes, and the Outlet, which includes the upper 2 km of the Ugashik River between Lower Ugashik Lake and a large lagoon. The Ugashik Narrows is approximately 0.5 km long, and consists of 2 main channels with moderately fast water. The Outlet consists of shallow, braided channels with moderately fast water. The Ugashik Lakes area is accessible only by float plane or by boat from the village of Ugashik and Pilot Point, 40 km downstream from the Outlet.
Fishery Description Angler effort in the Ugashik Lakes area is concentrated at the Narrows and Outlet, with limited effort expended in other parts of the drainage. Due to the inclement weather of the Alaska Peninsula and the remote nature of the Ugashik Narrows, fishing pressure is moderate. Three active lodges and 1 inactive sport fishing lodge are located in the Ugashik Lakes area. In addition, a number of lodges in the King Salmon area fly guests to the Ugashik Lakes for day fishing trips.
Species of interest in the sport fishery include Arctic grayling, coho salmon, and sockeye salmon, Arctic char and Dolly Varden, and lake trout. Annual sport fishery harvest and catch are estimated for the drainage through the SWHS and reported in the ADF&G Fishery Data Series (Mills 1979–1980, 1981a, 1981b, 1982–1994; Howe et al. 1995, 1996, 2001a, 2001b, 2001c, 2001d; Walker et al. 2003; Jennings et al. 2004, 2006a, 2006b, 2007, 2009a, 2009b, 2015; Romberg et al. In prep). Rainbow trout have never been officially documented in the drainage, but reports of catches and harvests of this species routinely appear in the sport fish harvest and participation survey.
The primary attraction in the drainage has been the Ugashik Narrows, which harbors a population of very large Arctic grayling. Studies indicate that the Arctic grayling at this site are an accumulation of old large fish (Meyer 1991). From 1967 through 1998, 66 trophy fish certificates or honorary catch-and-release certificates were issued for Arctic grayling in the Ugashik River drainage (Havens, ADF&G, Division of Sport Fish, Juneau, personal communication). From 2009 through 2013, the Ugashik drainage fisheries for all species have an average annual effort of 1,466 angler-days and an average catch of 649 grayling (Appendix A6). Harvest statistics are given in Table 24.
Fishery Management and Objectives Annual sport fishery harvest and effort are estimated through the SWHS and reported in the ADF&G Fishery Data Series (Mills 1979–1980, 1981a, 1981b, 1982–1994; Howe et al. 1995, 1996, 2001a, 2001b, 2001c, 2001d; Walker et al. 2003; Jennings et al. 2004, 2006a, 2006b, 2007, 2009a, 2009b, 2015; Romberg et al. In prep).
Sport fishing regulations have been geared to assure the sport fishery does no harm to Arctic grayling populations and gives the populations sufficient opportunity to reproduce and possibly increase in abundance.
Management of the sport fishery for Arctic grayling in the Ugashik River drainage has been conservative since 1969, when the bag limit was reduced to 2 fish per day. The entire drainage
68
was closed to the taking of Arctic grayling during 1990 through 1994 after studies found declining and very low grayling populations with old fish and poor recruitment (Meyer 1991; Villegas 1993). In 1995, the BOF allowed a sport harvest in portions of the drainage again, with a 5 fish per day daily bag limit in the Ugashik River drainage, excluding the Ugashik Narrows and Ugashik River, for the period of 1995 through 1997. The Ugashik Narrows has been designated as a catch-and-release Arctic grayling fishery since 1995. The Ugashik River has been closed to Arctic grayling fishing since 1990. During their 1997 winter meeting, the BOF reduced the daily limit where harvest is allowed to 2 fish per day, with no size restrictions12.
During much of the early and mid-1990s, the Ugashik Narrows was the site of a controversy regarding public access easements for this popular angling site. The state sought to preserve a site easement on Lower Ugashik Lake and a trail easement running north along the west side of the Narrows to public lands along Upper Ugashik Lake. Fly-in anglers had a tradition of getting dropped off on the shores of one lake, angling along the shores of the Narrows and then getting picked up at the other lake at the end of the day. Frequent and rapid weather changes often made the different drop-off and pick-up sites a necessity for safe air travel. A Native corporation sought to obtain control of the lands along the Narrows and objected to establishment of the easements. From 1992 through 1997, there were extensive legal discussions. The state accumulated extensive documentation establishing historical use of the site and trail, and showed its determination to secure these easements through litigation or a negotiated agreement. In August 1997, the Native corporation chose to relinquish its selection of these lands thereby allowing the lands to remain as public lands under the management of the Alaska Peninsula–Becharof National Wildlife Refuge. The Narrows and landing sites at both lakes continue to be accessible to the public. Note that a portion of land on the southeast side of the outlet has been conveyed to a private, Native allotment applicant.
2015 Season Estimates of sport fishing effort, catch, and harvest will not be available until 2016; however, anglers reported that sport fishing for Arctic grayling was average in 2015.
12Alaska sport fishing regulations summary––Bristol Bay drainages (effective April 15, 2015 through April 14,
2016) Alaska Department of Fish and Game, Division of Sport Fish, Anchorage.

69
Table 24.–Sport harvest of Arctic grayling from the waters of BBMA by fishery, 2004–2014, with 1977–2003 average.
Average 1977–
2003
Annual sport fishing harvest of Arctic grayling Average 2007–
2011
Average 2009–
2013
Section Drainage 2004 2005 2006 2007 2008 2009 2010 2011 2012 2013 2014 Eastern
Naknek R. 110 27 76 80 526 33 35 14 0 122 0 0 10 10 Brooks R. 5 0 0 0 0 26 0 0 0 5 0 0 0 0 Kvichak R. 246 0 48 137 220 464 130 295 49 232 0 0 95 21 Copper R. 4 0 0 0 0 0 0 23 0 5 0 0 5 0 Alagnak R. 69 33 119 33 65 0 0 0 0 13 0 0 0 10 Newhalen R. 232 405 64 96 15 107 17 65 97 60 14 67 52 24 Lake Clark 294 198 110 58 82 180 241 205 96 161 70 42 131 41 Other 311 193 0 93 85 81 74 161 99 100 0 72 81 465 Subtotal a 1,264 856 417 497 993 891 497 763 341 697 84 181 373 571
Central Nushagak R. 662 1,507 210 100 339 243 122 176 261 228 380 37 195 98 Mulchatna R. 271 154 39 216 103 256 205 191 139 179 251 22 162 60 Agulowak R. 3 0 0 0 19 0 0 0 14 7 0 0 3 0 Agulukpak R. 15 0 0 0 0 0 0 0 0 0 0 17 3 0 Wood River L. b 75 296 119 0 27 31 10 0 215 57 66 254 109 19 Tikchik L.–Nuyakuk R. 176 114 22 69 236 320 262 267 0 217 0 56 117 21 Other 300 34 32 77 121 0 0 14 0 27 0 45 12 20 Subtotal a 1,494 2,105 422 462 845 850 599 648 629 714 697 431 601 218
Western Togiak R. 32 49 0 0 25 67 33 0 0 25 0 9 8 10 Other 5 0 0 0 0 28 0 0 29 11 28 0 11 0 Subtotal a 38 49 0 0 25 95 33 0 29 36 28 9 20 10
Total 2,796 3,010 839 959 1,863 1,836 1,129 1,411 999 1,448 809 621 994 799 Source: Alaska Sport Fishing Survey database [Intranet]. 1996– . Anchorage, AK: Alaska Department of Fish and Game, Division of Sport Fish (cited October 14, 2015).
Available from: https://intra.sf.adfg.state.ak.us/swhs_est/ (custom query details available upon request from ADF&G, Division of Sport Fish, Research and Technical Services). a Subtotals of averages may not be the sum of the drainages because information for some drainages is not available for some years. b Wood River Lakes includes Lake Nunavaugaluk. Prior to 1998, Agulowak and Agulukpak rivers were included in Wood River Lakes.

70
ACKNOWLEDGEMENTS We would like to thank several people who were instrumental to the completion of this report including Dillingham Program Technician Lola Carpenter who updated numerous tables for this report and Regional Management Biologist Dan Bosch who contributed significant edits to this report. Thanks also go to the people credited with personal communications throughout this report.
REFERENCES CITED ADF&G (Alaska Department of Fish and Game). 1990. Southwest Alaska rainbow trout management plan. Alaska
Department of Fish and Game, Division of Sport Fish, Anchorage. Brookover, T. E., III. 1989. Creel and escapement statistics for the Alagnak River during 1988. Alaska
Department of Fish and Game, Fishery Data Series No. 89, Juneau. http://www.adfg.alaska.gov/FedAidPDFs/fds-089.pdf
Brookover, T. E., D. L. Bill, R. B. Russell, J. R. Skrade, B. E. Cross, J. Woolington, B. Stratton, and K. A. Rowel. 2015 Bristol Bay salmon season summary. Alaska Department of Fish and Game, Division of Commercial Fisheries, Anchorage.
Browning, J., and J. D. Miller. 1995. Bristol Bay area annual management report, 1994. Alaska Department of Fish and Game, Division of Commercial Fisheries, Regional Information Report 2A95-11, Anchorage. http://www.adfg.alaska.gov/FedAidPDFs/RIR.2A.1995.11.pdf
Cappiello, T., and J. E. Dye. 2006. Survey of the Chinook salmon sport fishery in the lower Nushagak River, Alaska, 2001. Alaska Department of Fish and Game, Fishery Data Series No. 06-68, Anchorage. http://www.adfg.alaska.gov/FedAidPDFs/fds06-68.pdf
Coggins, L. G. 1992. Creel and escapement statistics for the Chinook and coho salmon fisheries in the lower Naknek River, Alaska, during 1991. Alaska Department of Fish and Game, Fishery Data Series No. 92-15, Anchorage. http://www.adfg.alaska.gov/FedAidPDFs/fds92-15.pdf
Coggins, L. G., Jr., and A. E. Bingham. 1993. Stock assessment of the Chinook salmon return to the Naknek River, Alaska, during 1992. Alaska Department of Fish and Game, Fishery Data Series No. 93-26, Anchorage. http://www.adfg.alaska.gov/FedAidPDFs/fds93-26.pdf
Collins, C. N., and J. E. Dye. 2003. Survey of the Chinook and coho salmon sport fishery in the Alagnak River, Alaska, 2001 and 2002. Alaska Department of Fish and Game, Fishery Data Series No. 03-12, Anchorage. http://www.adfg.alaska.gov/FedAidPDFs/fds03-12.pdf
Dunaway, D. O. 1990a. Creel and escapement statistics for the Alagnak River, Alaska during 1989. Alaska Department of Fish and Game, Fishery Data Series No. 90-9, Anchorage. http://www.adfg.alaska.gov/FedAidPDFs/fds90-09.pdf
Dunaway, D. O. 1990b. Creel and escapement statistics for the Togiak River during 1989. Alaska Department of Fish and Game, Fishery Data Series No. 90-26, Anchorage. http://www.adfg.alaska.gov/FedAidPDFs/fds90-26.pdf
Dunaway, D. O. 1993. Status of rainbow trout stocks in the Agulowak and Agulukpak rivers of Alaska during 1992. Alaska Department of Fish and Game, Fishery Data Series No. 93-41, Anchorage. http://www.adfg.alaska.gov/FedAidPDFs/fds93-41.pdf
Dunaway, D. O. 1994. Surveys of the Chinook and coho salmon sport fisheries in the Alaganak River Alaska, 1993. Alaska Department of Fish and Game, Fishery Data Series No. 94-24, Anchorage. http://www.adfg.alaska.gov/FedAidPDFs/fds94-24.pdf
Dunaway, D. O., and A. E. Bingham. 1992. Creel surveys on the Chinook salmon sport fishery on the lower Nushagak River and Mid-Mulchatna River, Alaska, 1991. Alaska Department of Fish and Game, Fishery Data Series No. 92-16, Anchorage. http://www.adfg.alaska.gov/FedAidPDFs/fds92-16.pdf
Dunaway, D. O., A. E. Bingham, and R. E. Minard. 1991. Effort, catch, and harvest statistics for the Chinook salmon sport fishery in the middle Mulchatna River, Alaska, during 1990. Alaska Department of Fish and Game, Fishery Data Series No. 91-40, Anchorage. http://www.adfg.alaska.gov/FedAidPDFs/fds91-40.pdf
Dunaway, D. O., and S. J. Fleischman. 1995. Surveys of the Chinook and coho salmon sport fisheries in the Nushagak and Mulchatna rivers, Alaska 1994. Alaska Department of Fish and Game, Fishery Data Series No. 95-18, Anchorage. http://www.adfg.alaska.gov/FedAidPDFs/fds95-18.pdf

71
REFERENCES CITED (Continued) Dunaway, D. O., and S. J. Fleischman. 1996a. Surveys of the Chinook and coho salmon sport fisheries in the
Lower Naknek River, Alaska, 1995. Alaska Department of Fish and Game, Fishery Data Series No. 96-10, Anchorage. http://www.adfg.alaska.gov/FedAidPDFs/fds96-10.pdf
Dunaway, D. O., and S. J. Fleischman. 1996b. Surveys of the sockeye salmon sport fishery in the Upper Kvichak River, Alaska, 1995. Alaska Department of Fish and Game, Fishery Data Series No. 96-18, Anchorage. http://www.adfg.alaska.gov/FedAidPDFs/fds96-18.pdf
Dunaway, D. O., and S. Sonnichsen. 2001. Area management report for the recreational fisheries of the Southwest Alaska Sport Fish Management Area, 1999. Alaska Department of Fish and Game, Fishery Management Report No. 01-06, Anchorage. http://www.adfg.alaska.gov/FedAidPDFs/fmr01-06.pdf
Dye, J. E. 2005. Survey of the Chinook salmon sport fishery in the lower Nushagak River, Alaska, 2000. Alaska Department of Fish and Game, Fishery Data Series No. 05-23, Anchorage. http://www.adfg.alaska.gov/FedAidPDFs/fds05-23.pdf
Dye, J. E. 2012. Monitoring the Chinook salmon sport fishery on the Nushagak River drainage, Alaska, 2007. Alaska Department of Fish and Game, Fishery Data Series No. 12-67, Anchorage. http://www.adfg.alaska.gov/FedAidPDFs/FDS12-67.pdf
Elison, T., P. Salomone, T. Sands, M. Jones, C. Brazil, G. Buck, F. West, T. Krieg, and T. Lemons. 2015. 2014 Bristol Bay area annual management report. Alaska Department of Fish and Game, Fishery Management Report No. 15-24, Anchorage. http://www.adfg.alaska.gov/FedAidPDFs/FMR15-24.pdf
Geiger, H. J., and D. Hart. 1999. Run forecasts and harvest projections for 1999 Alaska salmon fisheries and review of the 1998 season. Alaska Department of Fish and Game, Division of Commercial Fisheries, Regional Information Report 5J99-06, Juneau.
Gryska, A. D., and G. P. Naughton. 2000. Surveys of the 1998 Chinook and 1999 coho salmon sport fisheries in the lower Togiak River, Alaska. Alaska Department of Fish and Game, Fishery Data Series No. 00-42, Anchorage. http://www.adfg.alaska.gov/FedAidPDFs/fds00-42.pdf
Gryska, A. D., and G. P. Naughton. 2001. Surveys of the Chinook and coho salmon sport fisheries in the lower Naknek River, Alaska, 1999. Alaska Department of Fish and Game, Fishery Data Series No. 01-01, Anchorage. http://www.adfg.alaska.gov/FedAidPDFs/fds01-01.pdf
Howe, A. L., G. Fidler, A. E. Bingham, and M. J. Mills. 1996. Harvest, catch, and participation in Alaska sport fisheries during 1995. Alaska Department of Fish and Game, Fishery Data Series No. 96-32, Anchorage. http://www.adfg.alaska.gov/FedAidPDFs/fds96-32.pdf
Howe, A. L., G. Fidler, and M. J. Mills. 1995. Harvest, catch, and participation in Alaska sport fisheries during 1994. Alaska Department of Fish and Game, Fishery Data Series No. 95-24, Anchorage. http://www.adfg.alaska.gov/FedAidPDFs/fds95-24.pdf
Howe, A. L., R. J. Walker, C. Olnes, K. Sundet, and A. E. Bingham. 2001a. Revised Edition. Harvest, catch, and participation in Alaska sport fisheries during 1996. Alaska Department of Fish and Game, Fishery Data Series No. 97-29 (revised), Anchorage. http://www.adfg.alaska.gov/FedAidPDFs/fds97-29(revised).pdf
Howe, A. L., R. J. Walker, C. Olnes, K. Sundet, and A. E. Bingham. 2001b. Revised Edition. Harvest, catch, and participation in Alaska sport fisheries during 1997. Alaska Department of Fish and Game, Fishery Data Series No. 98-25 (revised), Anchorage. http://www.adfg.alaska.gov/FedAidPDFs/fds98-25(revised).pdf
Howe, A. L., R. J. Walker, C. Olnes, K. Sundet, and A. E. Bingham. 2001c. Revised Edition. Participation, catch, and harvest in Alaska sport fisheries during 1998. Alaska Department of Fish and Game, Fishery Data Series No. 99-41 (revised), Anchorage. http://www.adfg.alaska.gov/FedAidPDFs/fds99-41(revised).pdf
Howe, A. L., R. J. Walker, C. Olnes, K. Sundet, and A. E. Bingham. 2001d. Participation, catch, and harvest in Alaska sport fisheries during 1999. Alaska Department of Fish and Game, Fishery Data Series No. 01-08, Anchorage. http://www.adfg.alaska.gov/FedAidPDFs/fds01-08.pdf
Jaenicke, M. 1998a. Survey of the rainbow trout sport fishery on the Nonvianuk and Alagnak rivers, 1996. Alaska Department of Fish and Game, Fishery Data Series No. 98-13, Anchorage. http://www.adfg.alaska.gov/FedAidPDFs/fds98-13.pdf
Jaenicke, M. 1998b. Survey of the rainbow trout sport fishery on the upper Alagnak River, Alaska during June 1997. Alaska Department of Fish and Game, Fishery Data Series No. 98-27, Anchorage. http://www.adfg.alaska.gov/FedAidPDFs/fds98-27.pdf
Jennings, G. B., K. Sundet, and A. E. Bingham. 2015. Estimates of participation, catch, and harvest in Alaska sport fisheries during 2011. Alaska Department of Fish and Game, Fishery Data Series No. 15-04, Anchorage. http://www.adfg.alaska.gov/FedAidPDFs/FDS15-04.pdf

72
REFERENCES CITED (Continued) Jennings, G. B., K. Sundet, and A. E. Bingham. 2007. Participation, catch, and harvest in Alaska sport fisheries
during 2004. Alaska Department of Fish and Game, Fishery Data Series No. 07-40, Anchorage. http://www.adfg.alaska.gov/FedAidPDFs/fds07-40.pdf
Jennings, G. B., K. Sundet, and A. E. Bingham. 2009a. Estimates of participation, catch, and harvest in Alaska sport fisheries during 2005. Alaska Department of Fish and Game, Fishery Data Series No. 09-47, Anchorage. http://www.adfg.alaska.gov/FedAidPDFs/FDS09-47.pdf
Jennings, G. B., K. Sundet, and A. E. Bingham. 2009b. Estimates of participation, catch, and harvest in Alaska sport fisheries during 2006. Alaska Department of Fish and Game, Fishery Data Series No. 09-54, Anchorage. http://www.adfg.alaska.gov/FedAidPDFs/FDS09-54.pdf
Jennings, G. B., K. Sundet, and A. E. Bingham. 2010. Estimates of participation, catch, and harvest in Alaska sport fisheries during 2007. Alaska Department of Fish and Game, Fishery Data Series No. 10-02, Anchorage.
Jennings, G. B., K. Sundet, A. E. Bingham, and D. Sigurdsson. 2006a. Participation, catch, and harvest in Alaska sport fisheries during 2002. Alaska Department of Fish and Game, Fishery Data Series No. 06-34, Anchorage. http://www.adfg.alaska.gov/FedAidpdfs/fds06-34.pdf
Jennings, G. B., K. Sundet, A. E. Bingham, and D. Sigurdsson. 2006b. Participation, catch, and harvest in Alaska sport fisheries during 2003. Alaska Department of Fish and Game, Fishery Data Series No. 06-44, Anchorage. http://www.adfg.alaska.gov/FedAidpdfs/fds06-44.pdf
Jones, M., T. Sands, C. Brazil, G. Buck, F. West, P. Salomone, S. Morstad, and T. Krieg. 2014. 2013 Bristol Bay area annual management report. Alaska Department of Fish and Game, Fishery Management Report No. 14-23, Anchorage. http://www.sf.adfg.state.ak.us/FedAidPDFs/FMR14-23.pdf
Jones, M., T. Sands, S. Morstad, T. Baker, G. Buck, F. West, P. Salomone, and T. Krieg. 2012. 2011 Bristol Bay area annual management report. Alaska Department of Fish and Game, Fishery Management Report No. 12-21, Anchorage. http://www.adfg.alaska.gov/FedAidpdfs/FMR12-21
Meyer, S. C. 1991. Estimates of sport fishing effort, catch, and harvest at Ugashik Narrows and Outlet, 1987–1988. Alaska Department of Fish and Game, Fishery Data Series No. 91-03, Anchorage. http://www.adfg.alaska.gov/FedAidPDFs/fds91-03.pdf
Mills, M. J. 1979. Alaska statewide sport fish harvest studies. Alaska Department of Fish and Game, Federal Aid in Fish Restoration, Annual Performance Report 1978–1979, Project F-9-11(20)SW-I-A, Juneau. http://www.adfg.alaska.gov/FedAidPDFs/FREDf-9-11(20)SW-I-A.pdf
Mills, M. J. 1980. Alaska statewide sport fish harvest studies. Alaska Department of Fish and Game. Federal Aid in Fish Restoration, Annual Performance Report, 1979–1980, Project F-9-12(21) SW-I-A, Juneau. http://www.adfg.alaska.gov/FedAidPDFs/FREDf-9-12(21)SW-I-A.pdf
Mills, M. J. 1981a. Alaska statewide sport fish harvest studies - 1980 data. Alaska Department of Fish and Game, Federal Aid in Fish Restoration and Anadromous Fish Studies, Annual Performance Report 1980–1981, Project F-9-13, 22 (SW-I-A), Juneau. http://www.sf.adfg.state.ak.us/FedAidPDFs/f-9-13(22b)SW-I-A.pdf
Mills, M. J. 1981b. Alaska statewide sport fish harvest studies. 1979 data. Alaska Department of Fish and Game, Federal Aid in Fish Restoration, Annual Performance Report 1980–1981, Project F-9-13(22a)SW-I-A, Juneau. http://www.adfg.alaska.gov/FedAidPDFs/FREDf-9-13(22a)SW-I-A.pdf
Mills, M. J. 1982. Alaska statewide sport fish harvest studies. Alaska Department of Fish and Game, Federal Aid in Fish Restoration, Annual Performance Report 1981–1982, Project F-9-14(23)SW-I-A, Juneau. http://www.adfg.alaska.gov/FedAidPDFs/FREDf-9-14(23)SW-I-A.pdf
Mills, M. J. 1983. Alaska statewide sport fish harvest studies. Alaska Department of Fish and Game, Federal Aid in Fish Restoration, Annual Performance Report 1982–1983, Project F-9-15(24)SW-I-A, Juneau. http://www.adfg.alaska.gov/FedAidPDFs/FREDf-9-15(24)SW-I-A.pdf
Mills, M. J. 1984. Alaska statewide sport fish harvest studies. Alaska Department of Fish and Game, Federal Aid in Fish Restoration, Annual Performance Report 1983–1984, Project F-9-16(25)SW-I-A, Juneau. http://www.adfg.alaska.gov/FedAidPDFs/FREDf-9-16(25)SW-I-A.pdf
Mills, M. J. 1985. Alaska statewide sport fish harvest studies. Alaska Department of Fish and Game, Federal Aid in Fish Restoration, Annual Performance Report 1984–1985, Project F-9-17(26)SW-I-A, Juneau. http://www.adfg.alaska.gov/FedAidPDFs/FREDf-9-17(26)SW-I-A.pdf
Mills, M. J. 1986. Alaska statewide sport fish harvest studies. Alaska Department of Fish and Game, Federal Aid in Fish Restoration, Annual Performance Report 1985–1986, Project F-10-1(27)RT-2, Juneau. http://www.adfg.alaska.gov/FedAidPDFs/FREDf-10-1(27)RT-2.pdf

73
REFERENCES CITED (Continued) Mills, M. J. 1987. Alaska statewide sport fisheries harvest report, 1986. Alaska Department of Fish and Game,
Fishery Data Series No. 2, Juneau. http://www.adfg.alaska.gov/FedAidPDFs/fds-002.pdf Mills, M. J. 1988. Alaska statewide sport fisheries harvest report, 1987. Alaska Department of Fish and Game,
Fishery Data Series No. 52, Juneau. http://www.adfg.alaska.gov/FedAidPDFs/fds-052.pdf Mills, M. J. 1989. Alaska statewide sport fisheries harvest report, 1988. Alaska Department of Fish and Game,
Fishery Data Series No. 122, Juneau. http://www.adfg.alaska.gov/FedAidPDFs/fds-122.pdf Mills, M. J. 1990. Harvest and participation in Alaska sport fisheries during 1989. Alaska Department of Fish and
Game, Fishery Data Series No. 90-44, Anchorage. http://www.adfg.alaska.gov/FedAidPDFs/fds90-44.pdf Mills, M. J. 1991. Harvest, catch, and participation in Alaska sport fisheries during 1990. Alaska Department of
Fish and Game, Fishery Data Series No. 91-58, Anchorage. http://www.adfg.alaska.gov/FedAidPDFs/fds91-58.pdf
Mills, M. J. 1992. Harvest, catch, and participation in Alaska sport fisheries during 1991. Alaska Department of Fish and Game, Fishery Data Series No. 92-40, Anchorage. http://www.adfg.alaska.gov/FedAidPDFs/fds92-40.pdf
Mills, M. J. 1993. Harvest, catch, and participation in Alaska sport fisheries during 1992. Alaska Department of Fish and Game, Fishery Data Series No. 93-42, Anchorage. http://www.adfg.alaska.gov/FedAidPDFs/fds93-42.pdf
Mills, M. J. 1994. Harvest, catch, and participation in Alaska sport fisheries during 1993. Alaska Department of Fish and Game, Fishery Data Series No. 94-28, Anchorage. http://www.adfg.alaska.gov/FedAidPDFs/fds94-28.pdf
Minard, R. E. 1987. Effort and catch statistics for the Chinook salmon (Oncorhynchus tshawytscha) sport fishery in the lower Nushagak River, 1986. Alaska Department of Fish and Game, Fishery Data Series No. 15, Juneau. http://www.adfg.alaska.gov/FedAidPDFs/fds-015.pdf
Minard, R. E. 1989a. Creel and escapement statistics for the Naknek River, Alaska, during 1988. Alaska Department of Fish and Game, Fishery Data Series No. 91, Juneau. http://www.adfg.alaska.gov/FedAidPDFs/fds-091.pdf
Minard, R. E. 1989b. Effort, catch, and harvest statistics for the sport fisheries on the Agulukpak and Agulowak River, Wood River Lake system, Alaska, 1986–1988. Alaska Department of Fish and Game, Fishery Data Series No. 90, Juneau. http://www.adfg.alaska.gov/FedAidPDFs/fds-090.pdf
Minard, R. E. 1990. Rainbow trout stock status. Bristol Bay and Lower Kuskokwim Management Area. Report to the Alaska Board of Fisheries. Alaska Department of Fish and Game, Dillingham.
Minard, R. E., M. Alexandersdottir, and S. Sonnichsen. 1992. Estimation of abundance, seasonal distribution, and size and age composition of rainbow trout in the Kvichak River, Alaska, 1986 to 1991. Alaska Department of Fish and Game, Fishery Data Series No. 92-51, Anchorage. http://www.adfg.alaska.gov/FedAidPDFs/fds92-51.pdf
Minard, R. E., and T. E. Brookover III. 1988a. Effort and catch statistics for the sport fishery for Chinook in the lower Nushagak River, 1987. Alaska Department of Fish and Game, Fishery Data Series No. 43, Anchorage. http://www.adfg.alaska.gov/FedAidPDFs/fds-043.pdf
Minard, R. E., and T. E. Brookover III. 1988b. Effort and catch statistics for the sport fishery in the Naknek River, 1987. Alaska Department of Fish and Game, Fishery Data Series No. 49, Anchorage. http://www.adfg.alaska.gov/FedAidPDFs/fds-049.pdf
Minard, R. E., D. O. Dunaway, and M. J. Jaenicke. 1998. Area management report for the recreational fisheries of the Southwest Alaska Sport Fish Management Area, 1997. Alaska Department of Fish and Game, Fishery Management Report No. 98-03, Anchorage. http://www.adfg.alaska.gov/FedAidPDFs/fmr98-03.pdf
Minard, R. E., and J. J. Hasbrouck. 1994. Stock assessment of arctic char in the Agulowak and Agulukpak rivers of the Wood River lake system, 1993. Alaska Department of Fish and Game, Fishery Data Series No. 94-42, Anchorage. http://www.adfg.alaska.gov/FedAidPDFs/fds94-42.pdf
Minard, R. E., and M. Lisac. 1984. Togiak River sportfishing studies, 1984. Alaska Department of Fish and Game, Bristol Bay Data Report 84-18, Dillingham.
Naughton, G. P., and A. D. Gryska. 2000. Survey of the Chinook salmon sport fishery in the lower Alagnak River, Alaska, 1998. Alaska Department of Fish and Game, Fishery Data Series No. 00-26, Anchorage. http://www.adfg.alaska.gov/FedAidPDFs/fds00-26.pdf

74
REFERENCES CITED (Continued) Romberg, W. J., G. B. Jennings, K. Sundet, and A. E. Bingham. In prep. Estimates of participation, catch, and
harvest in Alaska sport fisheries during 2012. Alaska Department of Fish and Game, Fishery Data Series, Anchorage.
Russell, R. 1977. Rainbow trout life history studies in Lower Talarik Creek-Kvichak drainage. Alaska Department of Fish and Game, Sport Fish Division, Federal Aid in Sport Fish Restoration, Annual Performance Report 1976–1977, Project F-9-9(18)G-II-E, Juneau. http://www.adfg.alaska.gov/FedAidPDFs/fredF-9-9(18)G-II-E.pdf
Schwanke, C. J., and D. J., Reed. In prep. Stock assessment of Lower Talarik Creek rainbow trout, 2009–2013. Alaska Department of Fish and Game, Fishery Data Series, Anchorage.
Sigurdsson, D., and B. Powers. 2009. Participation, effort, and harvest in the sport fish business/guide licensing and logbook reporting programs, 2006–2008. Alaska Department of Fish and Game, Special Publication No. 09-11, Anchorage. http://www.adfg.alaska.gov/FedAidPDFs/SP09-11.pdf
Sigurdsson, D., and B. Powers. 2010. Participation, effort, and harvest in the sport fish business/guide licensing and logbook programs, 2009. Alaska Department of Fish and Game, Fishery Data Series No. 10-65, Anchorage. http://www.adfg.alaska.gov/FedAidpdfs/Fds10-65.pdf
Sigurdsson, D., and B. Powers. 2011. Participation, effort, and harvest in the sport fish business/guide licensing and logbook programs, 2010. Alaska Department of Fish and Game, Fishery Data Series No. 11-31, Anchorage. http://www.sf.adfg.alaska.gov/FedAidpdfs/FDS11-31.pdf
Sigurdsson, D., and B. Powers. 2012. Participation, effort, and harvest in the sport fish business/guide licensing and logbook programs, 2011. Alaska Department of Fish and Game, Fishery Data Series No. 12-27, Anchorage. http://www.adfg.alaska.gov/FedAidpdfs/FDS12-27
Sigurdsson, D., and B. Powers. 2013. Participation, effort, and harvest in the sport fish business/guide licensing and logbook programs, 2012. Alaska Department of Fish and Game, Fishery Data Series No. 13-37, Anchorage. http://www.adfg.alaska.gov/FedAidPDFs/FDS13-37.pdf
Sigurdsson, D., and B. Powers. 2014. Participation, effort, and harvest in the sport fish business/guide licensing and logbook programs, 2013. Alaska Department of Fish and Game, Fishery Data Series No. 14-23, Anchorage. http://www.adfg.alaska.gov/FedAidpdfs/FDS14-23
Stuby, L. 2002. An investigation of how catch-and-release mortality of coho salmon in the Unalakleet River varies with distance from Norton Sound. Alaska Department of Fish and Game, Fishery Data Series 02-26, Anchorage. http://www.adfg.alaska.gov/FedAidPDFs/fds02-26.pdf
Vincent-Lang, D., M. Alexandersdottir, and D. McBride. 1993. Mortality of coho salmon caught and released using sport tackle in the Little Susitna River, Alaska. Fisheries Research 15:339–356.
Walker, R. J., C. Olnes, K. Sundet, A. L. Howe, and A. E. Bingham. 2003. Participation, catch, and harvest in Alaska sport fisheries during 2000. Alaska Department of Fish and Game, Fishery Data Series No. 03-05, Anchorage. http://www.adfg.alaska.gov/FedAidPDFs/fds03-05.pdf

75
APPENDIX A: CATCH TABLES

76
Appendix A1.–Sport catch of Chinook salmon from the BBMA by fishery, 2004–2014, with 1994–2003 average.
Average 1994–
2003
Annual sport fishing catch of Chinook salmon Average 2009–
2013
Section Drainage 2004 2005 2006 2007 2008 2009 2010 2011 2012 2013 2014 Eastern
Ugashik 471 113 31 408 86 26 151 0 0 69 74 59 109 Egegik-Becharof 328 790 147 638 16 69 26 78 277 65 148 119 564 Naknek R. 7,742 10,495 5,664 6,548 3,746 3,067 5,294 4,374 5,667 5,731 2,846 4,782 3,482 Naknek L. 36 0 a 0 a 0 0 a 0 0 39 0 0 29 14 0 Bay of Islands 8 0 a 42 a 313 a 0 a 13 0 0 17 0 0 3 216 Brooks R. 14 0 0 0 47 0 10 116 45 0 0 34 264 Brooks L. 6 0 a 0 a 0 a 0 a 0 0 0 0 0 0 0 0 King Salmon R. (Ugashik) 556 160 a 125 a 66 a 34 a 0 0 32 0 0 0 6 0 Kvichak R. 394 90 452 384 612 900 680 365 246 70 372 347 79 Copper R. 11 27 15 0 0 104 0 0 0 755 15 154 0 Alagnak R. 3,184 6,600 6,526 8,383 4,772 1,898 2,609 2,842 4,416 1,249 3,502 2,924 4,265 Newhalen R. 6 67 0 0 0 207 0 0 0 0 0 0 0 Lake Clark 11 0 0 0 0 55 0 0 0 0 0 0 0 Lake Iliamna 75 0 154 0 154 13 0 59 0 0 0 12 109 Kulik R. 33 0 0 143 0 0 10 830 0 0 0 168 0 Tazimina R. 6 0 a 0 a 48 a 0 a 0 0 0 0 0 15 3 0 Other 942 212 416 579 169 299 72 268 170 340 0 170 47 Subtotal 13,822 18,554 13,572 17,510 9,636 6,651 8,852 9,003 10,838 8,279 7,001 8,795 9,135
Central Nushagak R. 36,368 67,341 62,433 49,268 49,999 44,471 32,038 18,199 37,959 33,974 30,807 30,595 24,465 Mulchatna R. 3,233 1,070 1,959 1,408 1,193 438 391 118 1,477 1,254 997 847 1,034 Agulowak R. 36 27 0 115 0 13 26 0 0 0 0 5 31 Agulukpak R. 17 0 15 0 0 0 0 0 245 0 0 49 0 Wood River L. 560 756 483 1,016 1,045 158 235 159 42 56 184 135 357 Tikchik L.–Nuyakuk R. 554 801 647 32 1,758 272 308 255 703 2,097 350 743 659 Koktuli R. 476 66 a 50 a 48 a 683 a 0 365 0 0 151 0 103 0 Other 1,059 770 1,707 746 291 103 691 29 1,253 0 0 395 20
Subtotal 42,304 70,831 67,294 52,633 55,174 45,455 34,054 18,760 41,679 37,532 32,338 32,873 26,566 -continued-

77
Appendix A1.–Page 2 of 2.
Average 1994–
2003
Annual sport fishing catch of Chinook salmon Average 2009–
2013
Section Drainage 2004 2005 2006 2007 2008 2009 2010 2011 2012 2013 2014 Western
Togiak R. 4,177 10,043 10,084 13,766 8,319 2,453 4,765 5,213 9,096 6,719 6,392 6,437 10,671 Other 98 0 0 0 205 0 88 0 545 0 106 148 69 Subtotal 4,275 10,043 10,084 13,766 8,319 2,453 4,853 5,213 9,641 6,719 6,498 6,585 10,740
Total 60,400 99,428 90,950 83,909 73,129 54,559 47,759 32,976 62,158 52,530 45,837 48,252 46,441 Source: Alaska Sport Fishing Survey database [Intranet]. 1996– . Anchorage, AK: Alaska Department of Fish and Game, Division of Sport Fish (cited October 14, 2015).
Available from: https://intra.sf.adfg.state.ak.us/swhs_est/ (custom query details available upon request from ADF&G, Division of Sport Fish, Research and Technical Services). a Unpublished estimates from SWHS for sites with less than 12 responses.

78
Appendix A2.–Sport catch of coho salmon from the BBMA by fishery, 2004–2014, with 1994–2003 average.
Average 1994–
2003
Annual sport fishing catch of coho salmon Average 2009–
2013
Section Drainage 2004 2005 2006 2007 2008 2009 2010 2011 2012 2013 2014 Eastern
Ugashik 2,016 4,086 4,486 2,285 2,178 258 2,205 1,062 688 893 1,187 1,207 2,426 Egegik-Becharof 1,139 1,929 4,203 3,033 3,040 2,414 1,976 4,962 3,693 4,281 2,309 3,444 4,797 Naknek R. 6,609 12,985 5,824 9,182 7,278 9,723 9,065 10,863 6,416 6,391 3,359 7,219 10,130 Naknek L. 88 54 a 877 a 133 194 157 25 34 a 0 39 114 42 28 Bay of Islands 30 0 a 0 a 0 128 59 0 0 a 0 0 31 6 120 Brooks R. 457 466 29 296 189 388 460 132 18 29 61 140 293 Brooks L. 37 0 a 0 a 136 266 0 0 0 a 0 0 0 0 0 American Cr. 33 0 132 62 67 303 0 0 0 0 240 48 0 King Salmon R. (Ugashik) 480 0 a 0 a 0 0 0 0 0 a 27 0 11 8 386 Kvichak R. 1,327 2,237 3,334 4,455 1,648 3,959 2,443 2,496 3,797 2,734 2,828 2,860 1,493 Copper R. 234 0 0 27 631 115 247 82 181 14 101 125 521 Alagnak R. 3,616 3,699 4,885 13,128 3,780 4,582 3,914 2,287 3,551 2,958 5,446 3,631 10,663 Newhalen R. 457 1,005 15 30 48 93 40 47 60 0 144 58 52 L Talarik Cr. 119 167 44 18 27 19 0 0 a 0 0 172 34 10 Lake Clark 135 196 0 0 288 192 15 22 27 0 15 16 179 Lake Iliamna 249 91 292 429 192 48 507 310 202 27 0 209 31 Kulik R. 63 39 0 62 48 106 128 286 27 127 229 159 112 Tazimina R. 0 11 a 0 a 0 0 0 0 0 a 0 0 0 0 0 Moraine Cr. 52 0 0 0 0 19 61 17 27 0 0 21 153 Other 2,149 1,387 292 142 412 1,461 450 1,540 678 647 486 760 20
Subtotal 19,291 28,352 24,413 33,418 20,414 23,896 21,356 24,140 19,257 18,140 16,733 19,925 31,414 -continued-

79
Appendix A2.–Page 2 of 2.
Average 1994–
2003
Annual sport fishing catch of coho salmon Average 2009–
2013
Section Drainage 2004 2005 2006 2007 2008 2009 2010 2011 2012 2013 2014 Central
Nushagak R. 4,690 11,721 7,251 7,566 4,521 19,761 15,619 7,518 5,981 10,220 9,811 9,830 14,124 Mulchatna R. 1,290 1,260 1,445 2,639 2,075 1,171 520 411 563 389 1,717 720 1,900 Agulowak R. 209 225 0 639 238 484 879 42 237 156 106 284 198 Agulukpak R. 136 131 27 158 306 29 61 0 36 0 275 74 593 Wood River L. 1,508 5,673 2,538 2,723 2,050 630 989 1,965 1,350 627 2,864 1,559 2,036 Tikchik L.–Nuyakuk R. 601 2,207 88 471 67 1,717 122 1,426 846 0 122 503 204 Other 1,431 2,365 1,881 4,125 1,273 3,708 881 979 369 97 92 484 254 Subtotal 9,891 23,582 13,230 18,321 10,530 27,500 19,071 12,341 9,382 11,489 14,987 13,454 19,309
Western Togiak R. 6,243 21,279 15,072 16,359 11,712 22,234 5,422 6,471 5,007 17,424 4,258 7,716 10,051 Other 220 0 0 0 0 163 0 0 2,860 764 984 922 778 Subtotal 6,463 21,279 15,072 16,359 11,712 22,397 5,422 6,471 7,867 18,188 5,242 8,638 10,829
Total 35,645 73,213 52,715 68,098 42,656 73,793 45,849 42,952 36,506 47,817 36,962 42,017 61,552 Source: Alaska Sport Fishing Survey database [Intranet]. 1996– . Anchorage, AK: Alaska Department of Fish and Game, Division of Sport Fish (cited October 14, 2015).
Available from: https://intra.sf.adfg.state.ak.us/swhs_est/ (custom query details available upon request from ADF&G, Division of Sport Fish, Research and Technical Services). a Unpublished estimates from SWHS for sites with less than 12 responses.

80
Appendix A3.–Sport catch of sockeye salmon from the BBMA by fishery, 2004–2014, with 1994–2003 average.
Average 1994–
2003
Annual sport fishing catch of sockeye salmon Average 2009–
2013
Section Drainage 2004 2005 2006 2007 2008 2009 2010 2011 2012 2013 2014 Eastern
Ugashik 2,290 1,884 133 321 1,472 70 349 1,025 932 1,824 1,022 1,030 504 Egegik-Becharof 945 840 109 430 973 13 214 128 641 397 178 312 2,116 Naknek R. 2,183 4,050 3,054 11,518 9,456 12,356 14,134 8,681 7,739 8,610 6,977 9,228 8,521 Naknek L. 626 0 a 0 a 96 189 a 363 694 0 158 138 445 287 1,065 Bay of Islands 130 451 a 46 a 940 a 46 a 168 a 0 a 0 a 153 a 0 114 53 0 Brooks R. 3,877 2,884 2,027 3,341 1,736 3,729 2,350 2,819 1,725 2,119 2,103 2,223 5,032 Brooks L. 308 124 a 61 220 a 305 a 342 a 101 a 149 a 47 a 261 303 172 890 American Cr. 868 0 291 664 89 479 1,357 276 572 240 719 754 2,089 King Salmon R. (Ugashik) 179 0 a 0 a 0 a 0 a 0 a 0 a 0 a 0 a 0 19 4 0 Kvichak R. 6,199 4,245 4,064 6,063 4,244 11,003 7,165 7,621 8,911 4,478 3,367 6,308 7,076 Copper R. 2,822 625 1,113 2,372 1,235 1,085 1,590 2,355 2,296 1,864 2,145 2,050 3,118 Alagnak R. 11,333 7,876 15,260 8,612 10,971 12,446 10,973 7,235 5,900 8,730 5,107 7,589 2,280 Newhalen R. 11,895 4,714 3,533 4,566 3,270 3,409 3,920 1,675 1,406 2,553 3,913 2,693 1,295 L Talarik Cr. 458 248 0 353 a 0 a 0 0 73 a 67 a 68 256 93 427 Lake Clark 1,008 1,388 503 350 141 864 0 a 238 429 471 1,024 432 734 Lake Iliamna 2,505 1,915 1,333 3,398 986 2,407 1,375 2,260 1,171 811 0 1,123 4,828 Kulik R. 485 1,335 463 1,090 561 563 1,072 505 799 1,405 264 809 1,227 Tazimina R. 200 45 a 0 a 651 a 0 a 0 a 124 a 0 a 0 a 0 530 131 0 Moraine Cr. 384 1,306 897 574 893 884 662 1,022 945 1,765 1,958 1,270 704 Other 5,380 2,649 4,009 1,752 3,351 4,192 5,033 3,119 67 1,186 2,157 2,312 1,070
Subtotal 54,075 36,579 36,896 47,311 39,918 54,373 51,113 39,181 21,991 36,920 32,601 30,301 42,976 -continued-

81
Appendix A3.–Page 2 of 2.
Average 1994–
2003
Annual sport fishing catch of sockeye salmon Average 2009–
2013
Section Drainage 2004 2005 2006 2007 2008 2009 2010 2011 2012 2013 2014 Central
Nushagak R. 2,281 1,103 2,054 1,956 1,492 1,543 555 2,144 576 954 786 1,003 753 Mulchatna R. 1,593 564 1,794 1,038 205 221 668 140 1,164 686 720 676 464 Agulowak R. 241 1,539 3,943 2,025 1,466 2,374 3,355 784 1,276 600 1,678 2,063 Agulukpak R. 1,465 351 2,571 1,006 629 1,316 312 2,323 310 203 893 347 Wood River L. 4,718 2,536 1,680 7,506 5,513 2,923 2,868 2,653 3,222 982 3,423 2,630 6,575 Tikchik L.–Nuyakuk R. 514 169 0 11 91 765 254 65 277 614 204 283 583 Koktuli R. 967 260 a 0 a 184 a 513 a 61 a 101 a 0 a 0 a 27 0 26 0 Other 1,076 181 412 303 50 1,408 77 0 1,165 112 132 297 348 Subtotal 11,149 6,519 7,830 17,512 10,895 9,016 8,213 8,669 9,511 4,961 6,068 6,237 11,133
Western Togiak R. 1,144 3,690 2,452 835 2,424 653 920 290 654 2,110 191 833 636 Other 30 0 0 0 0 28 0 0 0 50 360 82 435 Subtotal 1,174 3,690 2,452 835 2,424 681 920 290 654 2,160 551 915 1,071
Total 66,398 46,788 47,178 65,658 53,237 64,070 60,246 48,140 32,156 44,041 39,220 31,972 55,180 Source: Alaska Sport Fishing Survey database [Intranet]. 1996– . Anchorage, AK: Alaska Department of Fish and Game, Division of Sport Fish (cited October 14, 2015).
Available from: https://intra.sf.adfg.state.ak.us/swhs_est/ (custom query details available upon request from ADF&G, Division of Sport Fish, Research and Technical Services). a Unpublished estimates from SWHS for sites with less than 12 responses.

82
Appendix A4.–Sport catch of rainbow trout from the BBMA by fishery, 2004–2014, with 1991–2003 average.
Average 1991–
2003
Annual sport fishing catch of rainbow trout Average 2009–
2013
Sect. Drainage 2004 2005 2006 2007 2008 2009 2010 2011 2012 2013 2014 East
Naknek R. 25,609 20,497 16,431 15,555 25,692 19,886 31,097 22,555 21,869 15,794 15,779 21,419 19,876 Brooks R. 15,793 9,728 8,804 13,399 14,284 15,891 14,648 13,127 16,144 14,896 15,513 14,866 12,243 Kvichak R. 18,104 25,564 13,435 31,293 30,912 24,545 23,644 18,739 13,753 11,429 16,827 16,878 19,837 Copper R. 23,179 15,164 8,273 13,571 14,548 14,644 18,751 25,418 18,247 29,479 30,317 24,442 30,138 Alagnak R. 34,518 19,371 37,195 40,008 39,564 22,194 19,153 6,711 12,536 6,735 9,411 10,909 8,483 Newhalen R. 4,702 2,720 2,600 2,654 1,615 1,696 357 1,209 1,317 31 1,317 846 603 Lake Clark 690 2,043 415 47 2,309 13 1,233 151 20 177 383 393 178 Other 57,544 48,673 36,884 63,275 59,502 72,946 76,422 89,016 48,267 36,002 49,384 59,818 70,949 Subtotal a 180,139 143,760 124,037 179,802 188,426 171,815 185,305 176,926 132,153 114,543 138,931 149,572 162,307
Cent. Nushagak R. 15,323 11,956 6,638 5,609 6,616 5,478 11,785 2,926 3,937 5,256 3,497 5,480 3,302 Mulchatna 6,559 5,201 2,001 4,046 4,429 2,365 1,954 901 795 735 419 961 735 Agulowak 10,734 5,230 6,885 7,465 10,760 8,026 5,281 2,517 2,567 1,726 2,292 2,877 5,079 Agulukpak 13,799 8,335 4,966 6,130 5,965 4,767 5,374 3,413 5,744 1,803 1,902 3,647 4,526
Wood River L. b 10,532 4,575 7,270 6,773 5,784 4,058 2,221 3,293 5,403 578 3,344 2,968 3,015 Tikchik L.–Nuyakuk R. 2,901 5,167 1,038 588 1,426 1,016 695 720 1,083 813 1,116 885 1,135 Other 4,583 5,018 2,538 3,331 1,329 1,014 460 277 841 352 269 440 748 Subtotal a 64,431 45,482 31,336 33,942 36,309 26,724 27,770 14,047 20,370 11,263 12,839 17,258 18,540
West
Togiak R. 2,339 5,716 3,475 2,261 2,282 3,977 3,638 2,256 3,242 2,741 1,318 2,639 1,889 Other 151 445 0 0 0 121 0 0 0 27 58 17 0 Subtotal a 2,490 6,161 3,475 2,261 2,282 4,098 3,638 2,256 3,242 2,768 1,376 2,656 1,889
Total 247,060 195,403 158,848 216,005 227,017 202,637 216,713 193,229 155,765 128,574 153,146 169,485 182,736 Source: Alaska Sport Fishing Survey database [Intranet]. 1996– . Anchorage, AK: Alaska Department of Fish and Game, Division of Sport Fish (cited October 14, 2015).
Available from: https://intra.sf.adfg.state.ak.us/swhs_est/ (custom query details available upon request from ADF&G, Division of Sport Fish, Research and Technical Services). a Subtotals of averages may not be the sum of the drainages because information for some drainages is not available for some years. b Wood River Lakes includes Lake Nunavaugaluk. Prior to 1998, Agulowak and Agulukpak rivers were included in Wood River Lakes.

83
Appendix A5.–Sport catch of Dolly Varden and Arctic char from the BBMA by fishery, 2004–2014, with 1991–2003 average.
Average
1991–2003
Annual sport fishing catch of Dolly Varden and Arctic char Average 2009–
2013
Section Drainage 2004 2005 2006 2007 2008 2009 2010 2011 2012 2013 2014 Eastern
Ugashik 3,229 8,393 1,838 338 3,150 5,097 5,923 7,327 3,846 2,277 3,153 4,505 11,013 Egegik-Becharof 3,416 5,353 2,125 1,194 3,388 975 2,245 4,268 4,402 8,180 3,698 4,559 12,144 Naknek R. 2,994 8,661 6,361 4,439 4,640 3,817 10,259 7,729 5,665 5,465 5,837 6,991 5,673 Naknek L. 431 227 0 14 281 332 646 445 128 1,151 1,522 778 1,969 Bay of Islands 250 797 177 70 106 258 204 66 400 0 56 145 0 Brooks R. 584 296 219 1,333 1,763 431 1,632 917 1,112 1,892 2,131 1,537 1,094 Brooks L. 93 0 0 0 150 0 163 74 62 182 0 96 0 American Cr. 5,292 7,795 4,917 5,164 5,063 10,465 9,664 14,725 9,651 5,584 9,848 9,894 8,260 King Salmon R. (Ugashik) 478 0 0 0 264 0 0 44 0 0 70 23 0 Kvichak R. 1,457 2,657 599 2,276 1,156 744 2,973 2,040 1,130 1,205 1,232 1,716 1,511 Copper R. 1,232 642 645 665 406 956 162 413 1,326 5,873 2,055 1,966 7,131 Alagnak R. 1,792 1,312 2,864 1,602 2,817 2,877 2,694 723 1,118 1,137 1,919 1,518 2,248 Newhalen R. 1,152 203 463 866 653 169 22 212 180 0 431 169 17 L Talarik Cr. 114 61 108 0 0 73 0 83 21 0 0 21 67 Lake Clark 642 810 208 76 232 278 517 29 409 1,207 133 459 717 Lake Iliamna 685 800 1,539 1,248 175 940 1,092 1,393 749 2,854 347 1,287 4,145 Kulik R. 143 531 768 903 386 1,191 896 1,234 207 689 678 741 745 Tazimina R. 236 13 0 66 0 0 0 0 0 0 106 21 0 Moraine Cr. 133 24 269 79 62 1,685 875 571 435 806 750 687 1,724 Other 8,727 406 2,627 0 1,243 1,286 3,023 878 2,882 410 9,742 3,387 4,602
Subtotal 33,003 38,981 25,727 20,333 25,935 31,574 42,990 43,171 33,723 38,912 43,708 40,501 63,060 -continued-

84
Appendix A5.–Page 2 of 2.
Average
1991–2003
Annual sport fishing catch of Dolly Varden and Arctic char Average 2009–
2013
Section Drainage 2004 2005 2006 2007 2008 2009 2010 2011 2012 2013 2014 Central
Nushagak R. 6,785 12,353 8,358 3,791 5,385 5,997 9,753 3,804 4,329 7,170 9,724 6,956 11,001 Mulchatna R. 1,439 3,588 1,584 935 2,458 2,099 1,072 844 1,439 121 504 796 338 Agulowak R. 4,777 3,776 5,133 3,743 5,198 7,037 3,298 4,243 2,241 861 2,551 2,639 4,129 Agulukpak R. 2,884 6,074 2,128 3,088 3,802 3,279 3,416 7,124 4,486 1,612 2,395 3,807 1,560 Wood River L. 13,133 22,536 14,528 10,971 8,215 13,148 7,812 9,602 6,793 4,710 14,260 8,635 5,479 Tikchik L.–Nuyakuk R. 2,742 6,712 1,723 2,158 1,217 1,567 2,152 4,079 1,662 310 828 1,806 2,178 Koktuli R. 534 327 657 148 74 24 410 0 41 558 0 202 1,218 Other 1,517 4,043 824 2,034 447 2,003 511 737 263 2,043 346 780 307 Subtotal 30,233 59,409 34,935 26,868 26,796 35,154 28,424 30,433 21,254 17,385 30,608 25,621 26,210
Western Togiak R. 3,439 11,432 8,450 5,586 4,127 8,667 6,568 2,512 9,087 4,165 2,085 4,883 7,528 Other 125 0 235 0 0 335 132 0 213 308 322 195 322 Subtotal 3,564 11,432 8,685 5,586 4,127 9,002 6,700 2,512 9,300 4,473 2,407 5,078 7,850
Total 66,800 109,822 69,347 52,787 56,858 75,730 78,114 76,116 64,277 60,770 76,723 71,200 97,120 Source: Alaska Sport Fishing Survey database [Intranet]. 1996– . Anchorage, AK: Alaska Department of Fish and Game, Division of Sport Fish (cited October 14, 2015).
Available from: https://intra.sf.adfg.state.ak.us/swhs_est/ (custom query details available upon request from ADF&G, Division of Sport Fish, Research and Technical Services).

85
Appendix A6.–Sport catch of Arctic grayling from the waters of the BBMA by fishery, 2004–2014, with 1991–2003 average.
Average 1991–
2003
Annual sport fishing catch of Arctic grayling Average 2009–
2013
Section Drainage 2004 2005 2006 2007 2008 2009 2010 2011 2012 2013 2014 Eastern
Ugashik 1,698 1,317 3,139 459 884 559 946 763 766 207 561 649 708 Egegik-Becharof 1,491 1,920 716 652 1,193 296 541 2,683 2,021 857 2,847 1,790 1107 Naknek R. 2,566 1,054 1,803 419 2,345 1,261 3,985 2,171 1,369 1,886 2,100 2,302 1811 Naknek L. 110 488 0 63 15 0 50 92 0 81 144 73 89 Bay of Islands 41 0 0 39 58 0 0 0 0 0 23 5 0 Brooks R. 812 325 132 0 248 360 465 237 89 315 1,429 507 204 Brooks L. 16 0 0 0 47 0 0 14 118 0 0 26 89 American Cr. 214 373 119 256 344 1,048 210 189 261 31 423 223 110 King Salmon R. (Ugashik) 313 0 0 0 0 0 0 0 0 0 0 0 0 Kvichak R. 5,351 4,028 3,241 3,499 7,362 8,483 6,816 6,276 3,876 7,873 6,091 6,186 6,746 Copper R. 382 195 0 174 295 27 112 1,089 49 151 515 383 955 Alagnak R. 4,736 2,429 5,580 5,252 5,856 6,176 5,525 732 3,333 4,274 7,114 4,196 1,588 Newhalen R. 4,932 1,648 1,855 2,108 2,096 1,466 138 171 274 211 1,888 536 706 L Talarik Cr. 469 0 70 790 76 98 301 99 245 0 36 136 203 Lake Clark 4,716 7,400 3,438 1,385 3,929 4,873 4,172 2,821 3,647 1,501 3,799 3,188 2,496 Lake Iliamna 633 16 22 24 314 67 229 30 196 637 273 4,266 Kulik R. 55 49 206 496 175 14 429 59 0 172 1,489 430 48 Tazimina R. 1,593 68 2,015 750 0 352 220 166 49 344 1,606 477 91 Moraine Cr. 425 290 303 109 241 648 284 1,309 396 1,204 969 832 1,143 Other 5,647 5,092 937 1,235 2,452 1,784 2,238 4,816 2,172 632 969 2,165 4,499
Subtotal 36,017 26,692 23,576 17,710 27,930 27,512 26,661 23,717 18,861 20,376 32,003 24,324 23,144 -continued-

86
Appendix A6.–Page 2 of 2.
Average 1991–
2003
Annual sport fishing catch of Arctic grayling Average 2009–
2013
Section Drainage 2004 2005 2006 2007 2008 2009 2010 2011 2012 2013 2014 Central
Nushagak R. 14,178 22,537 11,400 7,659 7,395 6,399 10,965 3,840 3,423 7,034 7,801 6,613 4,926 Mulchatna R. 3,965 2,402 1,485 3,434 1,056 2,273 855 2,008 1,771 1,360 504 1,300 292 Agulowak R. 2,315 1,458 2,450 1,520 4,800 1,322 2,001 991 1,157 275 1,065 1,098 1,563 Agulukpak R. 2,135 4,042 1,916 1,748 1,192 1,235 960 1,008 1,191 1,206 1,453 1,164 872 Wood River L. 4,836 6,143 5,119 1,133 7,235 4,025 2,142 2,405 3,446 2,052 6,873 3,384 1,732 Tikchik L.–Nuyakuk R. 7,128 11,271 3,721 1,303 6,442 7,861 3,698 8,098 1,904 2,688 4,174 4,112 2,840 Koktuli R. 1,335 91 603 743 341 0 328 0 29 0 22 76 426 Other 4,155 5,840 1,598 2,564 2,440 2,250 2,394 103 1,628 1,370 23 1,104 290 Subtotal 37,891 53,784 28,292 20,104 30,901 25,365 23,343 18,453 14,549 15,985 21,915 18,849 12,941
Western Togiak R. 1,456 1,772 1,101 454 1,130 7,482 955 301 2,503 208 1,256 1,045 2,005 Other 45 0 0 0 0 0 0 0 0 0 187 37 0 Subtotal 1,501 1,772 1,101 454 1,130 7,482 955 301 2,503 208 1,443 1,082 2,005
Total 75,409 82,248 52,969 38,268 59,961 60,359 50,959 42,471 35,913 36,569 55,361 44,255 38,090 Source: Alaska Sport Fishing Survey database [Intranet]. 1996– . Anchorage, AK: Alaska Department of Fish and Game, Division of Sport Fish (cited October 14, 2015).
Available from: https://intra.sf.adfg.state.ak.us/swhs_est/ (custom query details available upon request from ADF&G, Division of Sport Fish, Research and Technical Services).