Reconstruction of NDVI time-series datasets of MODIS based ...
17
1007-4619 (2010) 04-725-17 Journal of Remote Sensing 遥感学报 Received: 2009-04-29; Accepted: 2009-10-16 Foundation: Talent Plan of the Chinese Academy of Sciences (No. 08R2130130) and 973 National Basic Research Program of China (No. 2006CB403301). First author biography: BIAN Jinhu (1984— ), male, graduate student of the Institute of Mountain Hazards and Environment, Chinese Academy of Sci- ences. E-mail: [email protected] Corresponding author: LI Ainong, E-mail: [email protected] Reconstruction of NDVI time-series datasets of MODIS based on Savitzky-Golay filter BIAN Jinhu 1,2 , LI Ainong 1,3 , SONG Mengqiang 1 , MA Liqun 1,2 , JIANG Jingang 1,4 1. Institute of Mountain Hazards and Environment, Chinese Academy of Sciences, Sichuan Chengdu 610041, China; 2. Graduate University of Chinese Academy of Sciences, Beijing 100039, China; 3. Department of Geography, University of Maryland, College Park, MD 20742, USA; 4. Department of Environmental Engineering, Chengdu University of Information Technology, Sichuan Chengdu 610225, China Abstract: This paper uses Savitzky-Golay filter method to reconstruct MODIS 16d NDVI time-series product of Ruoergai plateau wetland from 2000 to 2009, and the results are compared with other two methods— Mean Value Iteration filter and Fou- rier method. As a result, reconstructing method based on Savitzky-Golay filter has got a better result in both image visual effects and NDVI temporal profiles. High-quality long time-series NDVI which is reconstructed based on this method offers a good foundation for the monitoring of ecosystem of Ruoergai wetland. Key words: Savitzky-Golay filter, NDVI, time-serie, MODIS CLC number: TP751.1 Document code: A 1 INTRODUCTION Calculated from multi-spectral remote sensing data, Vegeta- tion index (VI) is a certain sense of value which indicates the growth or biomass of vegetation (Zhao, 2003). VI has a close relationship with bio-physical parameters such as LAI, chloro- phyll content, vegetation coverage and biomass, and it is also one of the important parameters of land surface eco-environ- mental systems such as climate change, plant evapotranspira- tion and soil moisture (Lu, 2005; Moreau et al., 2003; Tong & Zhang, 2007). Time-series VI data derived from high temporal resolution satellite sensors such as NOAA/AVHRR, SPOT/ VEGETATION or MODIS have been widely used in monitor- ing of vegetation dynamics, macro-vegetation cover classifica- tion and inversion of the plant bio-physical parameters (Gu et al., 2007). Previous studies focused mainly on different vegeta- tion types or different climate zones. The quantitative study on the land cover change from the temporal aspect has become a hot point in recent years. Temporal profile of NDVI time-series is the best indicating factor which is able to reflect changes between vegetation bio-physics and time; it is also an important indicator of sea- sonal change or human impact (Zhao, 2003). In theory, curve of NDVI should be a continuous and smooth curve due to the little change range of canopy within certain time period. However, there are always some points up or plunge suddenly because of the interrupt of cloud, data transmission errors, bio-directional effects or the ice/snows cover (Ma & Veroustraete, 2006). Al- though maximum value composite and cloud detection method are often used in the processing of NDVI time series dataset, residual noise in the dataset still impedes further analysis and has a risk to generating erroneous results (Chen et al., 2004; Bethany et al., 2007). For this reason, a number of methods for reducing noise and constructing high-quality NDVI time series dataset for further analysis have been developed and evaluated. These methods can be classified into two types: treatment on time domain such as the best index slope extraction algorithm (BISE) (Viovy et al., 1992; Lovell & Graetz, 2001), Mean-Value Iteration Filter (MVI) method (Ma & Veroustraete, 2006), Savitzky-Golay filter method (Chen et al., 2004)); and the frequency domain such as Fourier method (Wang et al., 2005; Wen et al., 2004; Poerink & Menentir, 2000; Zheng & Zhuang, 2003). All these methods have both merits and demerit. Xiao (2003) used BISE method to reconstruct SPOT-4 VEGETATION (VGT) time series data, and classified forest type in northeastern China based on the reconstructed result. Ma (2006) used mean-value iteration filter method to recon- struct AVHRR NDVI time-series dataset of northwest of China. Wang (2005) used HANTS method based on Fourier transfor- Citation format: Bian J H, Li A N, Song M Q, Ma L Q and Jiang J G. 2010. Reconstruction of NDVI time-series datasets of MODIS based on Savitzky-Golay filter. Journal of Remote Sensing. 14(4): 725—741
Transcript of Reconstruction of NDVI time-series datasets of MODIS based ...

1007-4619 (2010) 04-725-17 Journal of Remote Sensing 遥感学报
Received: 2009-04-29; Accepted: 2009-10-16 Foundation: Talent Plan of the Chinese Academy of Sciences (No. 08R2130130) and 973 National Basic Research Program of China (No.
2006CB403301). First author biography: BIAN Jinhu (1984— ), male, graduate student of the Institute of Mountain Hazards and Environment, Chinese Academy of Sci-
ences. E-mail: [email protected] Corresponding author: LI Ainong, E-mail: [email protected]
Reconstruction of NDVI time-series datasets of MODIS based on
Savitzky-Golay filter
BIAN Jinhu1,2, LI Ainong1,3, SONG Mengqiang1, MA Liqun1,2, JIANG Jingang1,4
1. Institute of Mountain Hazards and Environment, Chinese Academy of Sciences, Sichuan Chengdu 610041, China;
2. Graduate University of Chinese Academy of Sciences, Beijing 100039, China;
3. Department of Geography, University of Maryland, College Park, MD 20742, USA;
4. Department of Environmental Engineering, Chengdu University of Information Technology, Sichuan Chengdu 610225, China
Abstract: This paper uses Savitzky-Golay filter method to reconstruct MODIS 16d NDVI time-series product of Ruoergai
plateau wetland from 2000 to 2009, and the results are compared with other two methods— Mean Value Iteration filter and Fou-rier method. As a result, reconstructing method based on Savitzky-Golay filter has got a better result in both image visual effects and NDVI temporal profiles. High-quality long time-series NDVI which is reconstructed based on this method offers a good foundation for the monitoring of ecosystem of Ruoergai wetland.
Key words: Savitzky-Golay filter, NDVI, time-serie, MODIS
CLC number: TP751.1 Document code: A
1 INTRODUCTION
Calculated from multi-spectral remote sensing data, Vegeta-
tion index (VI) is a certain sense of value which indicates the
growth or biomass of vegetation (Zhao, 2003). VI has a close
relationship with bio-physical parameters such as LAI, chloro-
phyll content, vegetation coverage and biomass, and it is also
one of the important parameters of land surface eco-environ-
mental systems such as climate change, plant evapotranspira-
tion and soil moisture (Lu, 2005; Moreau et al., 2003; Tong &
Zhang, 2007). Time-series VI data derived from high temporal
resolution satellite sensors such as NOAA/AVHRR, SPOT/
VEGETATION or MODIS have been widely used in monitor-
ing of vegetation dynamics, macro-vegetation cover classifica-
tion and inversion of the plant bio-physical parameters (Gu et
al., 2007). Previous studies focused mainly on different vegeta-
tion types or different climate zones. The quantitative study on
the land cover change from the temporal aspect has become a
hot point in recent years.
Temporal profile of NDVI time-series is the best indicating
factor which is able to reflect changes between vegetation
bio-physics and time; it is also an important indicator of sea-
sonal change or human impact (Zhao, 2003). In theory, curve of
NDVI should be a continuous and smooth curve due to the little
change range of canopy within certain time period. However,
there are always some points up or plunge suddenly because of
the interrupt of cloud, data transmission errors, bio-directional
effects or the ice/snows cover (Ma & Veroustraete, 2006). Al-
though maximum value composite and cloud detection method
are often used in the processing of NDVI time series dataset,
residual noise in the dataset still impedes further analysis and
has a risk to generating erroneous results (Chen et al., 2004;
Bethany et al., 2007). For this reason, a number of methods for
reducing noise and constructing high-quality NDVI time series
dataset for further analysis have been developed and evaluated.
These methods can be classified into two types: treatment on
time domain such as the best index slope extraction algorithm
(BISE) (Viovy et al., 1992; Lovell & Graetz, 2001),
Mean-Value Iteration Filter (MVI) method (Ma & Veroustraete,
2006), Savitzky-Golay filter method (Chen et al., 2004)); and
the frequency domain such as Fourier method (Wang et al.,
2005; Wen et al., 2004; Poerink & Menentir, 2000; Zheng &
Zhuang, 2003). All these methods have both merits and demerit.
Xiao (2003) used BISE method to reconstruct SPOT-4
VEGETATION (VGT) time series data, and classified forest
type in northeastern China based on the reconstructed result.
Ma (2006) used mean-value iteration filter method to recon-
struct AVHRR NDVI time-series dataset of northwest of China.
Wang (2005) used HANTS method based on Fourier transfor-
Citation format: Bian J H, Li A N, Song M Q, Ma L Q and Jiang J G. 2010. Reconstruction of NDVI time-series datasets of MODIS based on
Savitzky-Golay filter. Journal of Remote Sensing. 14(4): 725—741

726 Journal of Remote Sensing 遥感学报 2010, 14(4)
mation to reconstruct AVHRR NDVI time-series dataset in
China. However, these methods still have some demerits which
restrain their uses. The BISE method needs a size of the slide
window and an acceptable threshold, but these parameters
should be adjusted according to different climate zones or dif-
ferent vegetation characteristics, and it makes the credibility of
this method not very high. Setting of optimal threshold is very
important when there is no pixel reliability data for cloud de-
tection using the MVI method. Fourier method can make a very
smooth time series NDVI curve. However, compared with
original NDVI curve, the result value has a great offset.
Savitzky-Golay method fits a polynomial according to the
selected point and its nearby fixed number points, and then uses
the polynomial to give the smooth value of selected points. This
method does not have strict requirements of scale of NDVI or
type of sensors. Given a fitting effect index, Savitzky-Golay
filter will iterate until the fitting effect index reach local mini-
mum value; and it indicates that fitting progress yields the op-
timum results. This paper uses Savitzky-Golay filter method to
reconstruct MODIS 16d NDVI time-series product of Ruoergai
plateau wetland from 2000 to 2009, and the results are com-
pared with the results by the other two methods—Mean Value
Iteration filter and Fourier method. As a result, reconstructing
method based on Savitzky-Golay filter yields a better result in
both image visual effects and NDVI time curves. High quality
NDVI time-series which is reconstructed based on this method
offers a good foundation for the monitoring of the ecosystem of
Ruoergai wetland and also can provide a reference for the user
of this dataset.
2 MODIS NDVI TIME-SERIES DATASET
MODerate-resolution Imaging Spectroradiometer (MODIS)
is the new generation optical remote sensor currently for its
data has medium spatial resolution, fine spectral resolution,
high temporal resolution and a large covering area. It has shown
good application prospects in the eco-environmental assessment
and monitoring. VI products of MODIS mainly include
Normalized Difference Vegetation Index (NDVI) and Enhanced
Vegetation Index (EVI). Compared with the VI product of
NOAA-AVHRR, VI products of MODIS get rid of the vapor
absorption zone in near-infrared band, and its red channel
(620—670nm) are narrower which are more sensitive to chlo-
rophyll and easier to detect rare vegetation (Liu & Cheng,
2003). When composed by the MVC method, VI products of
MODIS take the bio-direction reflection into consideration and
convert NDVI value of a certain solar zenith angle into its
equivalent value of nadir observation (Huete et al., 1999). It is
helpful for improving the comparability of VI acquired in dif-
ferent time periods. NDVI is calculated from the reflectance
near-infrared channel and the red channel:
nir red
nir red
NDVI=+
(1)
where nir is the reflectance of near-infrared channel, and red
is the reflectance of red channel.
The development team of MODIS has dedicated to research
and development of products and algorithms. Through a series
of processing and handling, there are currently 44 standard
products of MODIS such as land surface temperature (MOD11),
vegetation index (MOD13), albedo (MOD43). These products
have been widely used in researches of atmosphere, oceans and
land. Data source used in this research is the MOD13Q1 prod-
uct of MODIS which is composed by the 16d MVC method
from Feb 18, 2000 to Feb 18, 2009, and the spatial resolution is
250 m. There are 23 scenes in one year and 208 scenes in the
study period.
There are 12 bands in the MOD13Q1 product, and the first
band is the NDVI. The twelfth band of MOD13Q1 is pixel
reliability summary QA layer which marks the summary reli-
ability corresponding to the NDVI pixels. It is helpful to detect
cloud or ice/snow in our study. The setting of this layer is
shown in Table 1 (Huete et al., 1999).
Table 1 MOD13Q1 Pixel Reliability
Rank key Summary QA Description
1 Fill/No data Not processed
0 Good data Use with confidence
1 Marginal data Useful, but depard on other QA information
2 Snow/Ice Target covered with snow/ice
3 Cloudy Target not visible, covered with cloud
In this table, the pixel values equaling 2 or 3 represent tar-
gets covered by snow/ice or cloud, so the snow/ice or cloud can
be easily detected using this pixel reliability layer.
In the data pre-processing period of this study, we firstly
used the MODIS Reprojection Tool (MRT) to convert the
original Sinusolidal projection of the MOD13Q1 dataset into
Standard Abert projection, and then repaired the filling data in
the image. Finally, NDVI value is calculated through multiply-
ing the original value by the scale factor. Base on land use, 10
points were chose as NDVI curve validation points. As shown
in Fig.1, the original NDVI curve is not very smooth, and some
points in the temporal profile drop significantly. These points
which are unreasonable in the cycle of vegetation growth are
shown as ice/snow pixels in their pixel reliability layer and
should be amended as noise.
3 METHODOLOGY
3.1 Study area
Most of the Ruoergai wetland locates in the Ruoergai
County of Sichuan province, China. Ruoergai wetland covers a
total of four protected areas which are Ganqiao provincial na-
ture reserve and Ruoergai national nature reserve in Sichuan
province, and Shouqu provincial nature reserve and Gahai-
Zecha national nature reserve in Gansu province. We chose the
Ruoergai County as our study area for the Ruoergai national

BIAN Jinhu et al.: Reconstruction of NDVI time-series datasets of MODIS based on Savitzky-Golay filter 727
Fig. 1 NDVI temporal profile and its pixel reliability of a validation point (a) NDVI temporal profile in 2002; (b) NDVI temporal profile in 2006; (c) NDVI temporal profile from 2000 to 2009; (d) Pixel reliability of this point
nature reserve completely locates in this county. Vegetation in
our study area is mainly alpine meadow and marsh vegetation.
Alpine meadow vegetation with sand cephalotus, grass her-
banceous plants mainly distributed in the hilly slopes, river
floodplain and terraces with better drainage conditions. Marsh
vegetation of Tibetan kobresia Muli carex mainly distributed in
the hilly terrain, depression of lakeside and the valley marshes
(Chai et al., 1965). NDVI response of alpine meadow is similar
to vegetation on the plain and NDVI signal of marsh vegetation
is a little weak for it blended with signals of water and soil
(Silva et al., 2008). Fig. 2 shows the boundary of Ruoergai
Fig. 2 Ruoergai County and its national wetland reserve area
County and its national nature reserve.
3.2 Algorithm model
3.2.1 Savizky-Golay fliter
Savizky and Golay (1964) proposed a simplified least-
squares-fit convolution for smoothing and computing deriva-
tives of a set of consecutive values. The design concept of
Savizky-Golay filter is to find a suitable filter coefficient to
protect the high-order moment. It uses a high-order polynomial
instead of a constant to achieve the least-squares fitting within
the sliding window to approximate the base function. Taking a
fixed number of points in the vicinity point to fit a polynomial,
it gives the smooth value of the vicinity point according to the
polynomial during the fitting progress. Based on the principle
of Savizky-Golay filter, the general equation of fitting progress
can be given as follows:
*i m
i j ij
i m
C YY
N
(2)
where Yj* is the resultant NDVI value, Yj+i is the original NDVI
value, Ci is the coefficient given by the Savizky-Golay filter
and N is the number of convoluting integers which is equal to
the smoothing window size (2m+1) (Luo et al., 2005; Zhu &
Bao, 2008).
3.2.2 Algorithm process
Based on the assumption that curve of NDVI should be

728 Journal of Remote Sensing 遥感学报 2010, 14(4)
smooth during the vegetation growing season and its annual
recycle, and supposed that cloud or ice/snow will reduce or
impede sensors to receive vegetation reflectance signals and
depress NDVI values, cloud or ice/snow pixels were identified
by the pixel reliability data layer of MOD13 and were replaced
by a linearly interpolated value using the adjacent points that
are not identified as noise points. Long-term change curve
which represents the gradual process of annual vegetation cycle
was fitted by the Savizky-Golay filter, and then fitted by local
circulation to make the curve of NDVI approach the upper
NDVI envelope. The main steps for implementing the method
were shown in Fig.3.
Fig. 3 Flowchart of the Savitzky-Golay filter method
There have been some researches on the utilization of
Savizky-Golay filter to conduct filtering of time-series remote
sensing data. This study mainly focused on the use of this fil-
tering algorithm for the NDVI products of MODIS. Consider-
ing the characteristics of MODIS NDVI dataset, this study first
get the index of the pixel reliability layer array whose pixel
value equals 2 or 3 which represent cloud or ice/snow pixel in
the NDVI time-series. Then the noise pixel can be replaced by a
linearly interpolated value using the adjacent points that are not
identified as noise points, and the new time-series is (ti, Ni0).
0 , 2 3( , 1) ( , 1)( , )
0 1( , ),R R
R R
DN orDNaN i t bN i tN i t
DN orDNN i t
(3)
where DNR is the value of pixel reliability and N(i, t) is the
value of NDVI of the ith pixel in the ith time.
Filtering and reconstructing phase will begin when the linear
interpolation finished. There have been some studies about
reconstruction of NDVI time-series using the Savizky-Golay
filter which is similar with the flowchart shown in Fig.3 in re-
cent years (Gu, 2003; Chen et al., 2004).
4 RESULTS AND ANALYSIS
4.1 Analysis of NDVI time-series curve of validation
point
The fitting process in this study has been achieved based on
Saviziky-Golay filter function provided by Interactive Data
Language (IDL) and r208 scenes of MODIS NDVI time-series
are reconstructed from 2000 to 2009. After 15 fittings, the best
fitting effect has been yielded. Fitting step of one example
NDVI curve in the process is shown as Fig. 4.
It can be seen from Fig.4(a) that noise points in the original
time-series dataset have been fitted, and the fitted curve which
in line with growth pattern of vegetation is smoother.
Those sudden drops in the NDVI time-series dataset which
have been identified as noise points by the pixel reliability layer
are replaced by a linearly interpolated value using adjacent
points. As shown in Fig.4(b), values of those noise points have
increased after linear interpolation. However, it still cannot
represent real condition of vegetation growth because there are
NDVI time-series Pixel reliability
Linear interpolation of cloud
Long-term change trend fitting by S-G filter
Weight of each point (Wi)
Generation of a new NDVI time-series
Fitting the new NDVI time series by S-G filter
Caculation of a fitting effect index
(Fk1>Fk<Fk+1)?
High quality NDVI time-series
NDVI=0.0001DN
NO
YES
Identification and interpolation of cloud
S—G filter
Reconstruction of NDVI time-series

BIAN Jinhu et al.: Reconstruction of NDVI time-series datasets of MODIS based on Savitzky-Golay filter 729
Fig. 4 Fitting effect of an example validation point (a) The whole fitting effect from 2000 to 2009; (b) Comparison between original curve and the linear interpolated result; (c) Comparison between original curve
and the long-term change trend curve; (d) Comparing between linear interpolated and fitting result
still some jagged up or drop suddenly in the curve after linear interpolation. Points which are not identified in the pixel reli-ability layer are same as the original value.
NDVI time-series should follow the gradual process of sea-sonal and annual vegetation cycle, so sudden falls which are inconsistent with this trend should be regarded as noise points affected by clouds or some other reasons. Long-time change trend curve is got after fitting the linear interpolated curve. Most of the noise points should be below the long-term change trend for clouds or poor atmospheric conditions making NDVI a negative bias. The long-term change trend is smoother than the original curve and can represent the gradual process of an-nual vegetation cycle, but there are still some errors in the local part especially in the noise points. Some none cloud/snow points deviate from its original value in the long-term change trend and there are large errors if reconstructed by long-term change trend.
After linear interpolated curve fitted by Savizky-Golay filter, a new smoother time-series representing the NDVI long-term change trend is obtained. Those points which are lower than the trend curve are replaced by the trend value and those points
which are higher than the trend curve keep the original value. Then it makes the first reconstruction between linear interpola-tion and long-term change trend. Setting fitting effect index and calculating each time fitting effect, the program reaches best fitting effects after 15 fitting. The result makes noise points reach the upper envelope and keeps non-clouds points its origi-nal value. It also reflects the growth condition of vegetation well. As can be seen in Fig.4(d), the points identified as noise points increased and those fall points which were not identified as noise points were also increased because they also should be noise points.
Table 2 shows the value of NDVI before and after recon-struction of the first validation point. It can be seen from the table that values of ice/snow pixel have increased, and they can reflect condition of vegetation for that the curve of NDVI has reached the upper envelope after reconstruction. However, the results will not be very satisfactory when there is a continuous period of clouds, snow or ice. Taking the 19, 20, 21 and 22 time point as example, date of these four time points is from December, 2000 to January, 2001, and the target is covered by ice/snow shown in the pixel reliability layer. Value of NDVI is nearly 0
730 Journal of Remote Sensing 遥感学报 2010, 14(4)
Table 2 Value of NDVI before and after reconstruction of the first validation point
Time point Value of pixel reliability Original NDVI Reconstructed
NDVI Relative deviation of mean
before reconstruction Relative deviation of mean
after reconstruction
19 2 0.0096 0.11378 0.1434 0.0392
20 2 0.0167 0.070264 0.0274 0.026
21 2 0.0345 0.082741 0.0005 0.049
22 2 0.015 0.20601 0.1167 0.07
45 2 0.0262 0.247337 0.2276 0.006
133 2 0.0012 0.274644 0.28435 0.01
183 2 0.0097 0.187966 0.12125 0.057
184 2 0.0395 0.21375 0.0841 0.09
205 2 0.0132 0.22859 0.22795 0.01256
and there will not be significantly increase through linear in-
terpolation.
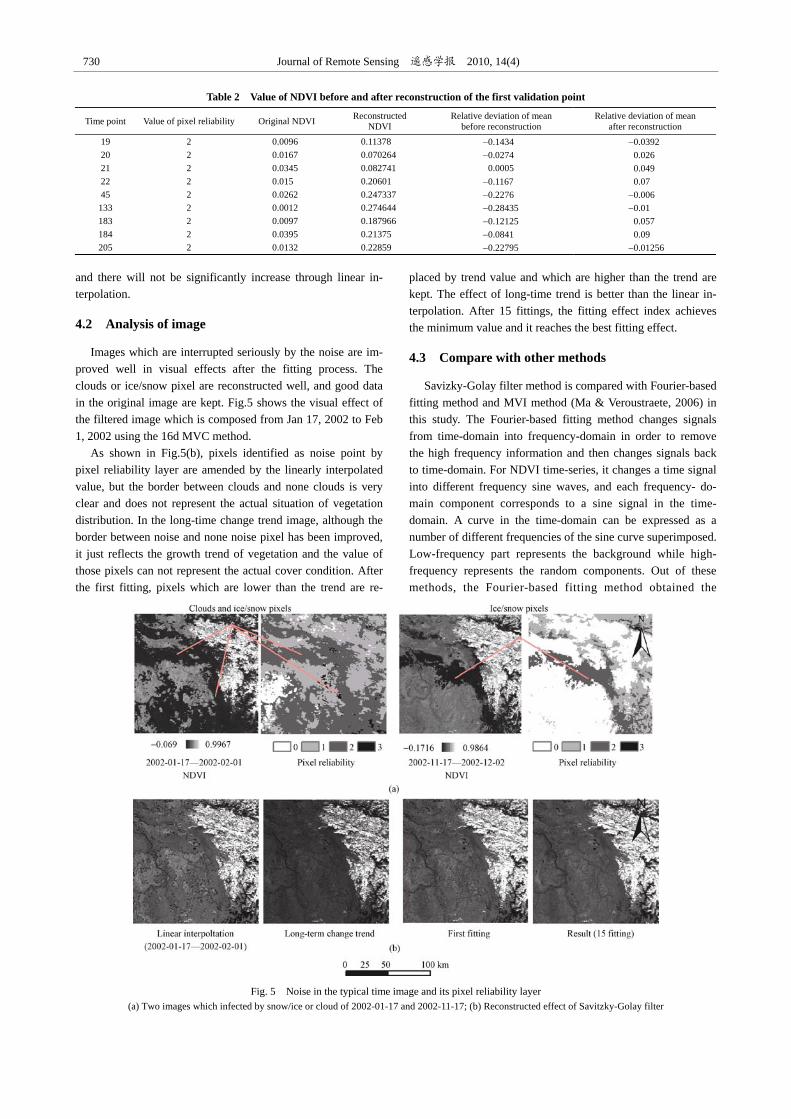
4.2 Analysis of image
Images which are interrupted seriously by the noise are im-
proved well in visual effects after the fitting process. The
clouds or ice/snow pixel are reconstructed well, and good data
in the original image are kept. Fig.5 shows the visual effect of
the filtered image which is composed from Jan 17, 2002 to Feb
1, 2002 using the 16d MVC method.
As shown in Fig.5(b), pixels identified as noise point by
pixel reliability layer are amended by the linearly interpolated
value, but the border between clouds and none clouds is very
clear and does not represent the actual situation of vegetation
distribution. In the long-time change trend image, although the
border between noise and none noise pixel has been improved,
it just reflects the growth trend of vegetation and the value of
those pixels can not represent the actual cover condition. After
the first fitting, pixels which are lower than the trend are re-
placed by trend value and which are higher than the trend are
kept. The effect of long-time trend is better than the linear in-
terpolation. After 15 fittings, the fitting effect index achieves
the minimum value and it reaches the best fitting effect.
4.3 Compare with other methods
Savizky-Golay filter method is compared with Fourier-based
fitting method and MVI method (Ma & Veroustraete, 2006) in
this study. The Fourier-based fitting method changes signals
from time-domain into frequency-domain in order to remove
the high frequency information and then changes signals back
to time-domain. For NDVI time-series, it changes a time signal
into different frequency sine waves, and each frequency- do-
main component corresponds to a sine signal in the time-
domain. A curve in the time-domain can be expressed as a
number of different frequencies of the sine curve superimposed.
Low-frequency part represents the background while high-
frequency represents the random components. Out of these
methods, the Fourier-based fitting method obtained the
Fig. 5 Noise in the typical time image and its pixel reliability layer (a) Two images which infected by snow/ice or cloud of 2002-01-17 and 2002-11-17; (b) Reconstructed effect of Savitzky-Golay filter

BIAN Jinhu et al.: Reconstruction of NDVI time-series datasets of MODIS based on Savitzky-Golay filter 731
smoothest fitted curve, but a large displacement away from the original NDVI values was shown. The MVI fitting method got a similar result with S-G filter method. However, it uses the mean value of points which are adjacent to the drop points to determine noise points, so the setting of threshold is important to improve fitting effect.
As shown in Fig.7, the fitting effect of Savizky-Golay filter is better, and image is clearer, also the transition between clouds and none-clouds area is better. The result image of Fou-rier-based fitting method and MVI method has a clear border between the noise and none-noise areas. There is an image quality evaluation method based on the analysis of image defi-
nition. Image definition refers to the differences on both sides of the border or near the gray-hatched of the image and it means the change rate of gray level which can be expressed as the gradient. It reflects the contrast change rate on minimal image detail and represents the relative clarity of the image. Quantitative contrast among the three methods is made basing on the clarity index of the image which can be expressed as:
2 21 1
1 1
1
( 1)( 1)
( ( , ) ( 1, )) ( ( , ) ( , 1))
2
M N
i j
gM N
D i j D i j D i j D i j
(4)
Fig. 6 Comparison of the fitting effect of three different methods
Fig. 7 Image fitting effects of the three methods (a) Effect of Fourier-based fitting method; (b) Effect of the MVI method; (c) Effect of Savizky-Golay filter method
where D(i, j) means the gray value of ith row jth column pixel. M and N means the total row and column of the image. Gener-ally, g is larger and then the image is clearer. After calculation, the g of Fourier-based fitting image is 0.021, and g of the MVI method is 0.03 while g of S-G filter method is 0.039. So it can be seen that the clarity of Savizky-Gloay filter result is better.
5 DISCUSSION
When NDVI time-series is fitted, width of the sliding win-dow and order of the polynomial is critical to ensure the fitting accuracy of the NDVI time-series. There will be a large number of redundant data if the width of sliding window is relatively small and the long-term change trend of the dataset can not be gotten, and it will miss some correct information in details on the contrary. So when fitting the long-term change trend, low- level and wider sliding window should be selected to reflect the
change trend while narrower window should be chosen to fit the local part so as to emphasize local information.
With a continuous period of time affected by clouds or in-terfered with snow or ice, although these pixels can be identi-fied well using the pixel reliability layer in the pre-processing stage, it is not an ideal results to replace those pixels by a line-arly interpolated value using adjacent points. In addition, Savitzky-Golay filter needs a fixed number of points near the noise point to give the smooth value of this point. Therefore, it requires an equal time interval of the time-series data. Non-equidistant time series data and frequent clouds and at-mospheric effects need to be further studied.
There have been a series of algorithms developed for recon-struction of NDVI time-series dataset. Whether from the fre-quency-domain or time-domain starting, aim of reconstruction is to remove any pseudo-data points in the NDVI time-series curve

732 Journal of Remote Sensing 遥感学报 2010, 14(4)
and reconstruct high quality dataset which can reflect the true growth condition and coverage of vegetations. The performance of each method is different in the different application areas (Liu et al., 2009). However, some algorithms are subjective for their set-ting a threshold or using experience parameter. Setting a fitting effect index which is similar with the Savizky-Golay filter can help to reduce influence on personal and improve the accuracy.
After removing the impact factor of clouds ice or bio-direc- tion effectively, time-series NDVI dataset will be able to respond health of terrestrial ecosystem better. In recent years, due to land reclamation and overgrazing, eco-environment of Ruoergai wet-land has faced serious threats. China has enlarged the protection ability for the eco-environment of Ruoergai wetland. However, for the complexity of the eco-environment of wetland, biomass which is an important index for the growth condition of vegeta-tion is hard to determine. Remote sensing has provided conven-ient for large-scale biomass surveys. In the follow-up works, we will work on the NPP and biomass of Ruoergai wetland based on this reconstruction dataset and other meteorological data, and we will establish database for the inter-annual biomass to pro-vide basic resources for the surveying of vegetation, evaluation and protection resource of Ruoergai wetland.
Though processed by Maximum Value Composition (MVC) methods, there are still lots of residual noises in the NDVI time-series data and these residual noises disturbed further analysis and may lead to false results. The Savizky-Golay filter used in this paper is an efficient method to improve quality of time-series dataset. High quality NDVI time-series which is reconstructed based on this method can reflect long-term change trend and local information during the growth season and offers a good foundation for the monitoring of the ecosys-tem of the Ruoergai wetland.
REFERENCES
Bradley B A, Jacob R W, Hermance J F and Mustard J F. 2007. A curve fitting procedure to derive inter-annual phonologies from time series of noisy satellite NDVI data. Remote Sensing of Envi-ronment, 106: 137—145
Chai X, Lang H Q and Jin S R. 1965.The Swamp of Ruoergai Plateau. Beijing: Science Press
Chen J, Jonsson P, Tamura M. Gu Z H, Matsushita B and Eklundh L. 2004. A simple method for reconstructing a high quality NDVI time-series data set based on the Savitzky–Golay filter. Remote Sensing of Environment, 91: 332—344
Gu J, Li X and Huang C L. 2006. Research on the reconstructing of time-series NDVI data. Remote Sensing Technology and Applica-tion, 21(4): 391—395
Gu Z. 2003. A Study of Calculating Multiple Cropping Index of Crop in China Using SPOT /VGT Multi-temporal NDVI Data. Beijing: Beijing Normal Universiity
Holben B N. 1986. Characteristics of maximux-value composite images for temporal AVHRR data.International Journal of Remote Sens-ing, 7: 1435—1445
Huete A, Justice C and Leeuwen W V. 1999. MODIS vegetation index (MOD 13)algorithm theoretical basis document. Version 3.http:// modis.gsfc.nasa.gov/data/abtd/abtd_mod1-3.pdf [2009-05-05]
Jiang X G, Wang D, Tang L L, Hu J and Xi X H. 2008. Analysing the vegetation cover variation of China from AVHRR-NDVI data. International Journal of Remote Sensing, 29(17/18): 5301—5311
Jun W, Zhong B and Ma Y M. 2004. Reconstruction of a cloud free
vegetation index time series for the Tibetan Plateau. Mountain Research and Development, 24(4): 348—353
Li R, Zhang X, Liu B, Zhang B. 2009. Review on methods of remote sensing time-series data reconstruction. Journal of Remote Sens-ing, 13(2): 335—341
Liu F and Cheng W Z. 2003. A new data source of satellite thermal infrared remote sensing information: EOS/MODIS data. Recent Developments in World Seismology, 8: 1—6
Lovell J L and graetz R D. 2001. Filtering pathfinder AVHRR land NDVI data for Australia. International Journal of Remote Sensing, 22(13): 2649—2654
Lu L, Li X, Huang C L, Ma M G, Che T, Bogaert J, Veroustraete F, Dong Q H and Ceulemans R. 2005. Investigating the relationship between ground measured LAI and vegetat ion indices in an al-pine meadow, north-west China. International Journal of Remote Sensing, 26(20): 4471—4484
Luo J W, Ying K and Bai J. 2005. Savitzky–Golay smoothing and differen-tiation filter for even number data. Signal Process, 85: 1429—1434
Ma M G and Veroustraete F. 2006. Reconstructing pathfinder AVHRR land NDVI time-series data for the Northwest of China. Advances in Space Research, 37: 835—840
Moreau S, Bossenob R, Fa X and Baret F. 2003. Assessing the biomass dynamics of Andean bofedal and totora high-protein wetland grasses from NOAA/AVHRR. Remote Sensing of Environment, 85: 516—529
Na X D, Zhang X Q, Li X F and Qin X W. 2007. Application of MODIS NDVI time series to extracting wetland vegetation infor-mation in the sanjiang plain. Wetland Science, 5(3): 227—236
Poerink G J, Menentir M and Verhoef W. 2000. Reconstructing cloud-free NDVI composites using Fourier analysis of time series. In-ternational Journal of Remote Sensing, 21(9): 1911—1917
Savitzky A and Golay M J E. Smoothing and differentiation of data by simplified least squares Procedure. Analytical Chemistry, 1964, 36: 1627—1639
Silva T S F, Costa M P F, Melack M J and Novo E M L M. 2008. Re-mote sensing of aquatic vegetation: theory and applications. Envi-ronmental Monitoring and Assessment, 140: 131—145
Tong Z Y and Zhang W C.2007. Progress of soil moisture monitoring by remote sensing. Bulletin of Soil and Water Conservation, 27(4): 107—113
Viovy N, Arino O and Belward A S. 1992. The Best index slope extrac-tion (BISE): A method for reducing noise in NDVI time-series. International Journal of Remote Sensing, 13(8): 1585—1590
Wang D, Jiang X G, Tang L L and Xi X H. 2005.The application of time-series fourier analysis to reconstructing cloud-free NDVI images.Remote Sensing of Land & Resources, 2: 29—32
Wang H L, Huang J F, Xu J F and Peng D L. 2008. Research on culti-
vated land extraction based on MODIS NDVI time series match-
ing analysis-a case in middle part of Zhejiang. Journal of Zhejiang
University(Agriculture & Life Science), 34(3): 334—340
Wen J, Zhong B and Ma Y M. 2004. Reconstruction of a cloud-free
vegetation index time series for the Tibetan Plateau. Mountain
Research and Development, 24(4): 348—353
Xiao X M, Boles S, Liu J Y, Zhuang D F and Liu M L. 2002. Charac-
terization of forest types in Northeastern China, using multi-tem-
poral SPOT-4 VEGETATION sensor data. Remote Sensing of En-
vironment, 82: 335—348
Zhao Y S. 2003. Principles and Methods of Remote Sensing Applica-
tions and Analysis. Beijing: Science Press Zheng Y K and Zhuang D F. 2003. Fourier analysis of muti-temporal
AVHRR data. Journal of the Graduate School of the Chinese Academy of Sciences, 20(1): 62—67
Zhu M Z and Bao X. 2008. Application of outlier detection and savitzky-golay filter in handwritten systems. Mechanical & Elec-trical Engineering Magazine, 25(8): 5—7

边金虎等: MODIS植被指数时间序列 Savitzky-Golay滤波算法重构 733
收稿日期: 2009-04-29; 修订日期: 2009-10-16
基金项目: 中国科学院“西部之光”重点项目 (编号:08R2130130)和国家“973”项目 (编号:2006CB403301)。
第一作者简介: 边金虎(1984— ), 男, 2007年毕业于四川农业大学。现为中国科学院成都山地灾害与环境研究所地图学与地理信息系统专
业硕士研究生,主要从事定量遥感模型和 GIS应用方面的研究; E-mail:[email protected]。
通讯作者: 李爱农, E-mail: [email protected]。
MODIS植被指数时间序列 Savitzky-Golay
滤波算法重构
边金虎1,2, 李爱农1,3, 宋孟强1, 马利群1,2, 蒋锦刚1,4
1. 中国科学院和水利部 成都山地灾害与环境研究所, 四川 成都 610041;
2. 中国科学院 研究生院, 北京 100039;
3. Department of Geography, University of Maryland, College Park, MD 20742, USA;
4. 成都信息工程学院 环境工程系, 四川 成都 610225
摘 要: 利用 Savitzky-Golay(S-G)滤波方法对若尔盖高原湿地区 2000—2009年 MODIS 16 d最大值合成的 NDVI
时间序列数据进行了重构, 并与中值迭代滤波法、傅里叶变换法进行了比较。结果表明, 基于 S-G滤波的时间序列
重构方法重构后的 NDVI 时间序列在直观及像元的时间序列曲线上均取得了较好的效果, 对提高该数据产品质量
有很大帮助, 通过该方法重构后的高质量的 NDVI 时间序列对利用该数据源对若尔盖湿地生态系统监测提供了良
好的基础。
关键词: S-G滤波, NDVI, 时间序列, MODIS
中图分类号: TP751.1 文献标识码: A
1 引 言
植被指数是指通过选用多光谱遥感数据经过分
析运算(加、减、乘、除等线性或非线性组合方式)
产生某些对植被长势、生物量等有一定指数意义的
数值(赵英时, 2003), 其与叶面积指数、叶绿素含量、
植被覆盖度、生物量等植被的生物物理参数之间有
密切的关系, 同时也是气候参数、植物蒸散、土壤
水分等地表生态环境参数的指标之一 (Lu, 2005;
Moreau 等, 2003; 仝兆远等, 2007)。基于 NOAA/
AVHRR、SPOT/VEGETATION 以及 MODIS 等高时
间分辨率的卫星传感器得到的植被指数时间序列资
料已经在植被动态变化监测、宏观植被覆盖分类和
植物生物物理参数反演方面得到了广泛的应用(顾
娟等, 2007)。以往的研究多从不同的植被类型或在
不同的气候区进行, 近年来从时间域上定量的研究
陆地覆盖变化成为热点(Jiang 等 ,2008; 王红说等 ,
2008; 那晓东等, 2007)。
NDVI 曲线是 NDVI 时间序列数据构成的反映
植被生物学特征相随时间变化的最佳指示因子, 也
是季节变化和人为活动影响的重要指示器(赵英时,
2003)。理论上, 由于植被冠层随时间变化幅度较小,
该曲线应该是一条连续平滑的曲线。然而, 由于云
层干扰、数据传输误差、二向性反射或地面冰雪的
影响, 在 NDVI 曲线中总是会有明显的突升或突降
(Ma & Veroustraete,2006)。尽管在 NDVI时间序列数
据集中经常采用 8 d或 10 d的最大值合成法(Holben,
1986)及云层检测算法进行处理, 其数据产品中仍然
存在较大的残差, 阻碍了对数据的进一步分析利用
并可能导致错误的结论(Bethany 等, 2007; Chen等,
引用格式: 边金虎, 李爱农, 宋孟强, 马利群, 蒋锦刚. 2010. MODIS 植被指数时间序列 Savitzky-Golay 滤波算法重构. 遥感学
报, 14(4): 725—741
Bian J H, Li A N, Song M Q, Ma L Q and Jiang J G. 2010. Reconstruction of NDVI time-series datasets of MODIS based onSavitzky-Golay filter. Journal of Remote Sensing. 14(4): 725—741

734 Journal of Remote Sensing 遥感学报 2010, 14(4)
2004)。当前, 发展了一些算法用于降低噪声水平及
对 NDVI 时间序列数据集进行重构。这些方法主要
分为两类:时间域上的处理, 包括最佳指数斜率提
取法(BISE) (Viovy等, 1992; Lovell & Graetz, 2001)、
中值迭代滤波法(MIF) (Ma & Veroustraete, 2006)、
S-G 滤波法(Chen 等, 2004)及频率域上的处理(如傅
里叶变换(王丹等, 2005; Wen 等, 2004; Poerink &
Menentir, 2000; 郑玉坤等, 2003)。对这些方法的比
较表明, 每一种方法有其优势及缺点。Xiao等(2002)
利用 BISE法对 SPOT-4 Vegetation(VGT)时间序列数
据进行了重构, 并基于重构结果对中国东北的森林
类型进行了分类。Ma等(2006)采用中值迭代滤波法
对中国西北部 AVHRR NDVI 时间序列数据集进行
了重构 , 王丹等 (2005)采用基于傅里叶变换的
HANTS算法对中国地区 AVHRR NDVI时间序列数
据进行了重构。然而, 这些方法还是存在一些缺点
而限制了使用(Chen 等, 2004)。BISE算法要求确定
一个滑动窗口的大小及可接受度的阈值, 而这些参
数根据不同气候区或不同的植被特征根据研究人员
的经验和技术进行调整, 使得该方法结果可信度不
是很强。利用中值滤波进行研究时, 在没有像元可
信度为云层识别的情况下, 对最佳阈值的设定十分
关键。傅里叶变换法可以获取非常平滑的时间序列
曲线, 但滤波结果与原始 NDVI 值相比发生了很大
的偏移。
S-G 滤波法通过选取某个点附近固定个数的点
拟合一个多项式, 通过该多项式拟合出这个点的平
滑值。此方法对 NDVI 的尺度及传感器类型没有严
格的要求。通过设置拟合效果指数, 利用 S-G 滤波
不断的进行迭代, 当该指数达到局部最小时, 标志
这一序列点的拟合效果最佳。本文采用 S-G 滤波的
方法对若尔盖高原湿地 2000—2009 年的 MODIS
16d NDVI 最大值合成时间序列数据进行了分析与
重构, 并与中值迭代滤波法和傅里叶变换法进行了
比较。基于该方法重构的高质量 MODIS NDVI时间
序列数据, 为进一步利用该数据源进行若尔盖湿地
生态系统监测提供了较好的基础, 同时也可为使用
该数据集的用户提供参考。
2 MODIS NDVI时间序列数据集
MODIS(MODerate-resolution Imaging Spectro-radiometer)是当前世界上新一代“图谱合一”的光学
遥感器, 其数据具有空间分辨率中等、光谱分辨率
良好、时间分辨率较高以及单幅影像覆盖范围广阔
等优点, 在生态环境评价和监测等方面体现出良好
的适用性和强大的应用前景。MODIS的植被指数产
品主要包括 NDVI 和 EVI, 其 NDVI 产品与 NOAA-
AVHRR 植被指数产品相同, 但在光谱范围避开了
近红外的水汽吸收带 , 且红通道 (620—670nm)比
AVHRR的(580—680nm)更窄, 对叶绿素的吸收更敏
感, 提高了对稀疏植被探测的能力(刘放等, 2003)。
MODIS 植被指数(VI)进行最大值合成(MVC)时, 考
虑到了地表二向性反射的影响, 对单期植被指数采
用了 Walthall BRDF 模型将某一太阳天顶角的
NDVI 值转化成了天底观测的等效值 (Huete 等 ,
1999), 对于提高数据可比性有很大帮助。NDVI 主
要通过近红外通道与红光通道的反射率计算得到。
公式如下:
nir red
nir redNDVI=
+
(1)
式中 , nir 为近红外通道的反射率 , 计算时对应
MODIS 的 2 通道; red 为红光通道的反射率, 计算
时对应 MODIS的1通道。
MODIS 的开发小组一直以来致力于产品和算
法的研究开发。通过一系列加工和处理, 目前共形
成了包含陆地表面温度 (MOD11)、植被指数
(MOD13)、反照率(MOD43)等在内的 44个标准产品。
这些数据产品已经广泛应用于大气、海洋、陆地等
方面的研究。本研究中采用的数据源是 2000-02-18
至 2009-02-18 MODIS MOD13Q1产品数据集, 空间
分辨率 250m, 16d 最大值法合成。该数据集全年共
计 23景, 全部时间段内共计 208景。
MOD13Q1 数据产品共有 12 个波段, 第 1 波段
为 NDVI 波段, 第 12 波段为像元可信度波段(pixel
reliability)。像元可信度波段标记了此数据集中对应
NDVI 像元的可信度概况, 在本研究中对云层识别
有很大帮助 , 其具体像元值设置见表 1(Huete 等 ,
1999):
表 1 MOD13Q1 像元可信度
像元值 说明 描述
1 填充/无值 未处理
0 良好数据 可直接使用
1 边缘数据 有用, 但需查询像元质量数据层
2 冰/雪 目标被冰雪覆盖
3 云层 目标被云层覆盖, 不可见
由表 1 可知, 像元值 2 和 3 分别代表冰雪和云
层。因此可以充分利用此数据层对影像中的冰雪、
云层数据进行识别。

边金虎等: MODIS植被指数时间序列 Savitzky-Golay滤波算法重构 735
对全部数据进行预处理, 首先采用 MODIS 网
站上提供的 MRT(MODIS Reprojection Tool)重投影
工具对研究区影像进行重投影, 影像的原始投影方
式为 Sinusoidal投影, 重投影为 Abert标准投影。再
对影像中填充值进行修补, 然后乘以尺度因子以获
取每个像元的 NDVI值。以研究区土地利用为基础,
结合预处理后的 NDVI时间序列随机选取 10个点作
为NDVI曲线验证点。部分验证点NDVI曲线如图 1。
由图 1 可以看出, 验证点的时间曲线并不是十分圆滑,
且部分时间段 NDVI值发生突降。部分突降点对应其
像元可信度中的冰雪像元。这些突降点在植被生长的
周期中是不合理的, 应该作为噪声点给予修正。
图 1 验证点的 NDVI曲线及其像元可信度
(a) 验证点 2002年 NDVI的时间序列曲线; (b) 验证点 2006年的 NDVI时间序列曲线; (c) 验证点 2000年至 2009年的整体时间序列
曲线; (d) 该验证点时间序列曲线对应的像元可信度。其中, 第 1期 NDVI时间序号为 1, 最后一期 NDVI时间序号为 208
3 研究方法
3.1 研究区
若尔盖高原湿地大部分区域位于若尔盖县境内,
其湿地范围共包括 4 个保护区, 四川省境内有干乔
省级自然保护区和若尔盖国家级自然保护区, 甘肃
省境内主要有首曲省级自然保护区和尕海则岔国
家级自然保护区。本研究中以若尔盖县为研究区域,
若尔盖国家自然保护区整体位于研究区内。研究区
地表植被覆盖主要以高山草甸、沼泽植被为主。高
山草甸植被以沙草科、禾本科草本植物为主, 分布
在丘陵的坡地及排水条件较好的河漫滩和阶地上 ;
沼泽植被以西藏蒿草、木里苔草为主, 分布在丘陵
之间以及地势低平的伏流宽谷、湖滨洼低和河谷的
沼泽中(柴岫等, 1965)。高山草甸的 NDVI响应与陆
地植被 NDVI 响应机制类似, 但沼泽植被的光谱信
号由于是植被、水及土壤等信号的叠加, 导致了沼
泽植被 NDVI光谱信号的减弱(Silva等, 2008)。图 2
给出了若尔盖县及其国家湿地保护区的范围。
3.2 算法模型
3.2.1 S-G滤波算法原理
Savitzky和 Golay(1964)提出的 S-G滤波器, 又
称最小二乘法或数据平滑多项式滤波器。S-G 滤波
的设计思想是能够找到合适的滤波系数(Ci)以保护
高阶距, 即在对基础函数进行近似时, 不是常数窗
口, 而是使用高阶多项式, 实现滑动窗内的最小二
乘拟合。其基本原理是:通过取点 xi 附近固定个数
的点拟合一个多项式, 多项式在 xi 的值, 就给出了

736 Journal of Remote Sensing 遥感学报 2010, 14(4)
图 2 若尔盖县及其国家级湿地保护区范围
它的光滑数值 gi。基于 S-G滤波原理, NDVI时间序
列数据的 S-G滤波过程可由下式描述:
*i m
i j ij
i m
C YY
N
(2)
式中, *jY 为合成序列数据, Yj+i 代表原始序列数据,
Ci 为滤波系数。N 为滑动窗口所包括的数据点
(2m+1)(Luo等, 2005; 朱墨子等, 2008)。
3.2.2 算法流程
基于植被在其生长季节及年际变化中其 NDVI
曲线应较为平滑及云层、冰雪等会降低或阻碍卫星
传感器接收植被反射光谱信息的假设, 研究中首先
利用像元可信度波段对云层、冰雪像元进行识别及
线性内插, 然后采用 S-G 滤波方法模拟整个 NDVI
时间数据获取长期变化趋势, 再通过局部循环 S-G
滤波的方法使拟合的数据更接近于 NDVI 时间序列
的上包络线, 获取较为合理的结果。具体计算流程
如图 3。
关于利用 S-G 滤波的方法进行遥感时序数据滤
波, 已经做了一些研究。本研究中主要是利用该算
法对 MODIS的 NDVI数据产品进行滤波重构。针对
MODIS NDVI数据集的特点, 首先要对数据进行预
处理, 程序开始阶段获取像元可信度数据层中像元
值为 2 或 3 的像元数组下标, 该数值下标即标识了
对应的 NDVI 数据集中该下标像元的属性。对此部
分像元采用线性内插的方法, 利用临近时间段像元
值进行线性内插, 替代云、雪像元值。替代后新的
时间序列为 0( , )i it N 。
0 ( , 1) ( , 1) , 2 3( , )
( , ) , 0 1R
R
aN i t bN i t DNN i t
N i t DN
或
或 (3)
式中, RDN 为像元可信度的像元值。 ( , )N i t 为 t
时间段的第 i个像元的 NDVI值。
图 3 S-G滤波方法流程图
NDVI时间序列 像元可信度
对云层像元线性内插
通过 S-G滤波获取长期趋势
计算像元的可接受度(Wi)
获取新的时间序列(N1)
再次进行滤波
计算拟合效果指数(Fk)
(Fk1>Fk<Fk+1)?
重构后的高质量 NDVI
NDVI=0.0001 DN
否
云层识别与内插
S-G滤波
NDVI时序重构
是

边金虎等: MODIS植被指数时间序列 Savitzky-Golay滤波算法重构 737
线性内插完毕以后, 便进入了滤波及重构阶段,
近年来对采用 S-G 滤波进行时序重构的方法很多,
大多是采用图 2 流程的方式进行的(辜智慧, 2003;
chen等, 2004)。
4 结果与分析
4.1 验证点时间序列曲线分析
本研究在 IDL平台上基于其提供的 S-G滤波函
数进行了以上步骤的程序实现。并对若尔盖地区
2000—2009年共计 208景的MODIS NDVI时间序列
影像进行了重构。程序运行经过 15 次迭代拟合后,
最终达到最佳拟合效果。拟合后的NDVI曲线如图 4。
由验证点的 NDVI 总体曲线(图 4(a))可以看出,
原始 NDVI 曲线中的突降点被给予了很好的纠正。
曲线整体较为平滑, 符合植被的生长规律。
发生突降的 NDVI 像元点由于通过像元可信度
数据层被标识为云雪像元, 程序中对该部分像元采
用邻近时间段的像元值进行线性内插。由图 4(b)中
可以看出, 被标识为云雪像元的 NDVI 值经线性内
插后其 NDVI 值有所提高。但线性内插后获取的曲
线整体仍有部分锯齿型突升或突降, 并不能很好的
代表真实植被生长状况。在未被标识的时间点处的
NDVI值与原始值是一致的。
NDVI 曲线的季节变化及年际变化理论上应该
是连续平滑的, 因此, 与总体趋势不协调的突降点
可以被认为是云层或其他原因导致的噪声。算法对
内插后 NDVI 时间序列进行滤波获取了长期变化趋
势, 由于大部分云层或其他天气状况的影响会使得
NDVI值发生负偏差, 因此, 大多数噪声点低于长期
变化的趋势。滤波构成的长期变化趋势能够代表植
被长期的生长趋势, 曲线有了一定的平滑, 但在局
图 4 部分验证点 NDVI曲线拟合效果
(a) 验证点 2000—2009年整体的曲线滤波效果; (b) 原始 NDVI与线性内插后的比较; (c) 线性内插效果与
S—G滤波后获得的总体趋势比较; (d) 线性内插结果与最终滤波效果的比较

738 Journal of Remote Sensing 遥感学报 2010, 14(4)
部尤其是原始 NDVI 中标示为云层的时间段处的
NDVI 值仍然存在一定的误差, 总体趋势中部分非
云雪像元的 NDVI 偏离了其原始值, 也不能很好的
代表植被的生长状况(图 4(c)), 采用总体趋势进行重
构会产生很大的误差。
经滤波获取总体趋势后, 低于总体趋势的 NDVI
值被认为是噪声点, 采用总体趋势进行代替, 而高
于总体趋势的像元则认为是正常的像元 , 给予保
留。这样便构成了由线性内插结果和总体趋势结果
共同进行的第一次重构。在以后的滤波过程中, 通
过设置拟合效果指数, 不断的拟合, 计算每次拟合
后的效果, 最终经过 15次拟合后构成的 NDVI曲线
较为平滑, 在保证非云层像元处的原始 NDVI 值后
也使得云层像元 NDVI 值接近其上包络线。很好的
反映了植被的生长状况。由图 4(d)中可以看出, 标识
为云雪像元的时间点, NDVI值有了一定的提高, 而
其余几个没有被标识为云雪像元的像元点, 由于其
在前后相邻像元中为波谷状态, 也应为误差点。最
终的滤波结果中这部分误差点的值有了一定的提高。
表 2 给出了第一个验证点受云、冰雪影响的像
表 2 第一个验证点云雪像元 NDVI 重构前后情况
时间点 像元可信度值 原始 NDVI 重构后 NDVI 重构前与前后两期均值的相对偏差 重构后与前后两期均值的相对偏差
19 2 0.0096 0.11378 0.1434 0.0392
20 2 0.0167 0.070264 0.0274 0.026
21 2 0.0345 0.082741 0.0005 0.049
22 2 0.015 0.20601 0.1167 0.07
45 2 0.0262 0.247337 0.2276 0.006
133 2 0.0012 0.274644 0.28435 0.01
183 2 0.0097 0.187966 0.12125 0.057
184 2 0.0395 0.21375 0.0841 0.09
205 2 0.0132 0.22859 0.22795 0.01256
元及其滤波后的 NDVI 值。由表 2 可以看出, 云、
冰雪像元点重构以后 NDVI 值有所提高, 由于重构
后的 NDVI 曲线达到了正常 NDVI 的上包络线, 可
知该重构后的 NDVI 值能够反映植被的信息。但由
于滤波之前采用邻近像元线性内插的方法进行的替
代, 当出现连续时间段被云、冰雪影响时, 重构效果
不是很理想。以 19, 20, 21, 22这 4个时间点为例, 这
4 个时间点的影像合成时间为 2000 年 12 月至 2001
年 1月, 由像元可信度层可知, 目标被冰雪覆盖, 其
原始 NDVI 值较低, 接近于 0, 因此, 即使通过前后
两个时间段内的 NDVI 值进行内插 , 该段时间内
NDVI值也不会有较大的提高。
4.2 基于研究区的图像分析
经滤波后噪声干扰较为严重的时间段影像在
影像直观效果得到了较好的改善。云层或冰雪覆
盖像元得到了很好的重构 , 原始影像中的良好数
据(像元可信度中标记为 0 的像元)得以保留, 保证
了重构影像的精度。图 5以 2002-01-17—2002-02-01
的 16d 合成影像为例 , 给出了滤波后的影像直观
效果。
由图 5 看出, 在线性内插后, 被标识为云雪的
像元采用邻近时间段的像元值进行了修补, 但云层
与非云层有很明显的边界, 不符合植被生长的实际
情况。经滤波获取后的总体趋势中, 边界得到了一
定的改善, 但其仅反映了植被生长的趋势, 像元值
并不代表植被真实覆盖状况。经第一次滤波后 ,
NDVI 值低于总体趋势的像元被总体趋势替代, 而
像元值高于总体趋势的则仍然保留原始的 NDVI,
效果较线性内插有了很大改善。最终在经过 15次拟
合后, 拟合效果指数收敛, 达到了最佳的拟合效果。
4.3 与常用方法的比较
本研究分别采用了中值迭代滤波法和傅里叶分
析法与 S-G 滤波法进行了对比分析。傅里叶滤波法
通过将信号从时间域变换到频率域, 在频率域去除
高频信息, 再通过傅里叶逆变换为时间域, 对 NDVI
时序数据而言, 它是将一个时间信号分解为不同频
率的正弦波, 每一个频域分量对应着时域空间的一
个正弦信号。时域中的一条曲线可以表示成若干条
不同频率的正弦曲线的叠加。低频的部分代表背景,
高频的部分代表随机部分, 即噪声。通过傅里叶变
换使得 NDVI 曲线变得圆滑, 但由于其对与 NDVI
中的一些伪高值和伪低值较为敏感, 其获取的 NDVI

边金虎等: MODIS植被指数时间序列 Savitzky-Golay滤波算法重构 739
曲线对其较原始曲线产生了很大的偏移。中值迭代
滤波法与 S-G 滤波效果相近, 但其在判断低值时采
用某一像元的像元值与其前后两期的均值进行比较
确定, 因此阈值设定是提高滤波效果的关键。
由图 6 不同滤波方法的拟合曲线可以看出, 傅
里叶变换的方法滤波或获取的曲线较为平滑, 但整
体位移较大。中值迭代滤波获取的时序曲线与 S-G
方法获取的曲线相近。图 7 分别给出了 3 种方法对
2002-01-17至 2002-02-01的合成影像滤波效果。
由图 7 看出, 直观上 S-G 滤波的效果较好, 影
像清晰, 云层干扰区域与非干扰区域过渡较好。而
傅里叶变换的结果与中值迭代滤波的结果均有明显
的边界。基于影像清晰度的分析是评价影像质量的
一种方法, 影像清晰度是指影像的边界或影线两侧
附近灰度有明显差异, 即灰度变化率, 这种变化率
的大小可用梯度表示。它反映了图像微小细节反差
变化的速率, 表征图像的相对清晰度, 本研究中基
于影像清晰度对 3种重构方法的拟合效果进行定量
对比, 可定义为(赵英时,2003):
2 21 1
1 1
1
( 1)( 1)
( ( , ) ( 1, )) ( ( , ) ( , 1))
2
M N
i j
gM N
D i j D i j D i j D i j
(4)
式中, ( , )D i j 为 NDVI第 i行、第 j列的灰度值; M, N
分别为遥感影像的总行列数。一般来说, g越大, 图
图 5 典型时间段影像噪声情况及重构后的效果
(a) 给出了 2002-01-17— 2002-02-01及 2002-11-17—2002-12-02的两期影像受云或冰雪干扰的情况;
(b) 给出了 2002-01-17—2002-02-01该期影像重构后的直观效果
图 6 3种不同滤波方法拟合效果比较

740 Journal of Remote Sensing 遥感学报 2010, 14(4)
图 7 3种滤波方法影像拟合效果比较
(a) 傅里叶变换方法结果; (b) 中值滤波结果; (c) S-G滤波法结果
像越清晰。经过计算, 傅里叶变换影像 g值为 0.021,
中值迭代滤波结果影像 g值为 0.03, S-G滤波影像 g
值为 0.039, 可知, S-G滤波获取的影像清晰度较好。
5 讨 论
在采用 S-G 滤波方法进行滤波时, 滑动窗口的
宽度以及平滑多项式的阶数是保证 NDVI 数据拟合
准确性的关键。如果活动窗口宽度设置偏小, 容易
产生大量冗余数据, 不易获取数据集的长期趋势。
相反, 容易遗漏一些细节所描述的正确信息。因此,
在拟合长期变化趋势时, 应选择低阶且较宽的滤波
窗口, 以便尽量反映总体变化。而在进行局部迭代
拟合时, 窗口设定应较小, 以便突出局部信息。
当出现连续时间段内受云层或冰雪干扰较为严
重时, 在数据预处理阶段虽然能够很好的利用像元
可信度识别出此部分像元, 但采用线性内插的方法
利用邻近时间段像元值进行云层、冰雪像元的替代
效果也不理想。另外, 由于 S-G 滤波器通过选取某
个点附近固定个数的点拟合多项式, 进而给出该点
的光滑值, 因此, 也要求时序数据的时间间隔是等
间距的。对非等间距的时序数据及受云和大气影响
较为频繁的数据处理办法有待于进一步研究。
目前关于遥感时间序列数据的重构发展了一系
列算法。无论从频率域或时间域出发, 重构的目的
均是去除每个像元时间序列曲线中的伪值点, 通过
算法拟合, 重构高质量数据集, 使得其曲线整体接
近于植被的真实生长状况, 反映植被的覆盖特征。
不同应用领域各种算法表现的不同(刘儒等, 2009),
然而由于部分算法通过阈值设置或经验参数设置等,
主观性较大。在这些方法中加入与 S-G 滤波中类似
的拟合效果指数 , 进行迭代至拟合效果最佳为止 ,
可在一定程度上避免个人主观影响, 提高拟合精度。
在有效的去除云层、各向异性等影响 NDVI 时
序应用的因素后, 时间序列的 NDVI 能更好的反应
陆地生态系统健康状况。近年来由于受到土地开垦
及过渡放牧的影响, 若尔盖湿地生态环境受到了严
重的干扰。目前国家加大了对若尔盖湿地生态系统
的保护, 然而由于湿地生态系统的复杂性, 植被生
长健康状况的重要指标——生物量, 较难测定。遥感
给大面积生物量调查提供了便捷。在后续的工作中,
笔者将基于该重构后的 NDVI 数据集及各项气象数
据, 开展湿地 NPP、生物量估算及分析的研究工作,
建立植被生物量年际空间数据库, 为若尔盖湿地植
被调查、评价及合理保护湿地资源提供依据。
由高时间分辨率MODIS获取的NDVI时间序列
产品, 尽管在采用最大值合成法合成后, 其数据集
中的仍然存在残差。本文中采用的 S-G 滤波是一种
有效提高该时序产品数据质量的方法。重构后的时
序数据集能够清晰的描述时间序列的长期变化趋势
以及局部的突变信息, 可为植被生长状况及生态系
统健康状况的监测提供高质量基础数据。
REFERENCES
Bradley B A, Jacob R W, Hermance J F and Mustard J F. 2007. A
curve fitting procedure to derive inter-annual phonologies
from time series of noisy satellite NDVI data. Remote Sensing
of Environment, 106: 137—145
Chai X, Lang H Q and Jin S R. 1965.The Swamp of Ruoergai Pla-
teau. Beijing: Science Press
Chen J, Jonsson P, Tamura M. Gu Z H, Matsushita B and Eklundh
L. 2004. A simple method for reconstructing a high quality
NDVI time-series data set based on the Savitzky–Golay filter.
Remote Sensing of Environment, 91: 332—344
Gu J, Li X and Huang C L. 2006. Research on the reconstructing of
time-series NDVI data. Remote Sensing Technology and Ap-
plication, 21(4): 391—395
Gu Z. 2003. A Study of Calculating Multiple Cropping Index of
Crop in China Using SPOT /VGT Multi-temporal NDVI Data.

边金虎等: MODIS植被指数时间序列 Savitzky-Golay滤波算法重构 741
Beijing: Beijing Normal Universiity
Holben B N. 1986. Characteristics of maximux-value composite
images for temporal AVHRR data.International Journal of
Remote Sensing, 7: 1435—1445
Huete A, Justice C and Leeuwen W V. 1999. MODIS vegetation index
(MOD 13)algorithm theoretical basis document. Version 3.http://
modis.gsfc.nasa.gov/data/abtd/abtd_mod1-3.pdf [2009-05-05]
Jiang X G, Wang D, Tang L L, Hu J and Xi X H. 2008. Analysing
the vegetation cover variation of China from AVHRR-NDVI
data. International Journal of Remote Sensing, 29(17/18):
5301—5311
Jun W, Zhong B and Ma Y M. 2004. Reconstruction of a cloud free
vegetation index time series for the Tibetan Plateau. Mountain
Research and Development, 24(4): 348—353
Li R, Zhang X, Liu B, Zhang B. 2009. Review on methods of re-
mote sensing time-series data reconstruction. Journal of Re-
mote Sensing, 13(2): 335—341
Liu F and Cheng W Z. 2003. A new data source of satellite thermal
infrared remote sensing information: EOS/MODIS data. Re-
cent Developments in World Seismology, 8: 1—6
Lovell J L and graetz R D. 2001. Filtering pathfinder AVHRR land
NDVI data for Australia. International Journal of Remote
Sensing, 22(13): 2649—2654
Lu L, Li X, Huang C L, Ma M G, Che T, Bogaert J, Veroustraete F,
Dong Q H and Ceulemans R. 2005. Investigating the relation-
ship between ground measured LAI and vegetat ion indices in
an alpine meadow, north-west China. International Journal of
Remote Sensing, 26(20): 4471—4484
Luo J W, Ying K and Bai J. 2005. Savitzky–Golay smoothing and
differentiation filter for even number data. Signal Process, 85:
1429—1434
Ma M G and Veroustraete F.2006.Reconstructing pathfinder AVH
RR land NDVI time-series data for the Northwest of China.
Advances in Space Research, 37: 835—840
Moreau S, Bossenob R, Fa X and Baret F. 2003. Assessing the
biomass dynamics of Andean bofedal and totora high-protein
wetland grasses from NOAA/AVHRR. Remote Sensing of En-
vironment, 85: 516—529
Na X D, Zhang X Q, Li X F and Qin X W. 2007. Application of
MODIS NDVI time series to extracting wetland vegetation
information in the sanjiang plain. Wetland Science, 5(3):
227—236
Poerink G J, Menentir M and Verhoef W. 2000. Reconstructing
cloudfree NDVI composites using Fourier analysis of time series.
International Journal of Remote Sensing, 21(9): 1911—1917
Savitzky A and Golay M J E. Smoothing and differentiation of data
by simplified least squares Procedure. Analytical Chemistry,
1964, 36: 1627—1639
Silva T S F, Costa M P F, Melack M J and Novo E M L M. 2008.
Remote sensing of aquatic vegetation: theory and applications.
Environmental Monitoring and Assessment, 140: 131—145
Tong Z Y and Zhang W C.2007. Progress of soil moisture moni-
toring by remote sensing. Bulletin of Soil and Water Conser-
vation, 27(4): 107—113
Viovy N, Arino O and Belward A S. 1992. The Best index slope
extraction (BISE): A method for reducing noise in NDVI
time-series. International Journal of Remote Sensing, 13(8):
1585—1590
Wang D, Jiang X G, Tang L L and Xi X H. 2005.The application of
time-series fourier analysis to reconstructing cloud-free NDVI
images.Remote Sensing of Land & Resources, 64(2): 29—32
Wang H L, Huang J F, Xu J F and Peng D L. 2008. Research on
cultivated land extraction based on MODIS NDVI time series
matching analysis-a case in middle part of Zhejiang. Journal
of Zhejiang University(Agriculture & Life Science), 34(3):
334—340
Wen J, Zhong B and Ma Y M. 2004. Reconstruction of a cloud-free
vegetation index time series for the Tibetan Plateau. Mountain
Research and Development, 24(4): 348—353
Xiao X M, Boles S, Liu J Y, Zhuang D F and Liu M L. 2002. Char-
acterization of forest types in Northeastern China, using
multi-temporal SPOT-4 VEGETATION sensor data. Remote
Sensing of Environment, 82: 335—348
Zhao Y S. 2003. Principles and Methods of Remote Sensing
Applications and Analysis. Beijing: Science Press
Zheng Y K and Zhuang D F. 2003. Fourier analysis of muti-tem-
poral AVHRR data. Journal of the Graduate School of the
Chinese Academy of Sciences, 20(1): 62—67
Zhu M Z and Bao X. 2008. Application of outlier detection and
savitzky-golay filter in handwritten systems. Mechanical &
Electrical Engineering Magazine, 25(8): 5—7
附中文参考文献 柴岫, 郎惠卿, 金树仁. 1965. 若尔盖高原的沼泽. 北京: 科学出
版社
顾娟, 李新, 黄春林. 2006. NDVI时间序列数据集重建方法述评.
遥感技术与应用, 21(4): 391—395
辜智慧 . 2003. 中国农业复种指数的遥感估算方法研究 . 北京:
北京师范大学
李儒, 张霞, 刘波, 张兵. 2009. 遥感时间序列数据滤波重建算
法发展综述. 遥感学报, 13(2): 335—341
那晓东, 张树清, 李晓峰, 秦喜文. 2007. MODIS NDVI时间序列
在三江平原湿地植被信息提取中的应用 . 湿地科学 , 5(3):
227—236
仝兆远, 张万昌. 2007. 土壤水分遥感监测的研究进展. 水土保
持通报, 4(7): 107—113
王丹, 姜小光, 唐伶俐, 习晓环. 2005. 利用时间序列傅里叶分
析重构无云 NDVI图像. 国土资源遥感, 64(2): 29—32
王红说, 黄敬峰, 徐俊锋, 彭代亮. 2008. 基于 MODIS NDVI时
间序列谱匹配的耕地信息提取研究——以浙中地区为例. 浙
江大学学报:农业与生命科学版, 34(3): 334—340
赵英时. 2003. 遥感应用分析原理与方法. 北京:科学出版社.
郑玉坤, 庄大方. 2003. 多时相AVHRR数据的傅里叶分析. 中国
科学院研究生院学报, 20(1): 62—68
朱墨子, 包鑫. 2008. 异常点检测与 Savitzky-Golay 滤波算法在
手写系统中的应用. 机电工程, 25(8): 5—8