Reconstructing Ecological Baselines: Toward Improved ...€¦ · 3.6 Connections to Europe; fishing...
200
Reconstructing Ecological Baselines: Toward Improved Management in Aquatic Ecosystems Heidi Katya Alleway Thesis submitted for the Degree of Doctor of Philosophy School of Biological Sciences University of Adelaide November 2015
Transcript of Reconstructing Ecological Baselines: Toward Improved ...€¦ · 3.6 Connections to Europe; fishing...

Reconstructing Ecological Baselines:
Toward Improved Management in
Aquatic Ecosystems
Heidi Katya Alleway
Thesis submitted for the Degree of Doctor of Philosophy
School of Biological Sciences
University of Adelaide
November 2015

Table of contents
Abstract 1
Declaration 3
Acknowledgements 4
Chapter 1: Introduction
1.1 Shifting baselines 6 1.2 Change in temperate marine environments 7 1.3 Historical ecological research 9 1.4 Reconstructing shifted ecological baselines 10 1.5 Aims of research 11
Chapter 2: Historical changes in mean trophic level of southern Australian
fisheries
2.1 Preface 14 2.2 Statement of authorship 15 Publication 16 Supplementary material 26
Chapter 3: ‘Neo-Europe’ and its ecological consequences: the example of
systematic degradation in Australia’s inland fisheries
3.1 Preface 31 3.2 Statement of authorship 32 3.3 Abstract 33 3.4 Introduction 34 3.5 South Australian fisheries, 1900-2011 35 3.6 Connections to Europe; fishing and ecological imperialism 44 3.7 Shifting baselines in aquatic ecosystems 45 3.8 Acknowledgements 46 3.9 Supplementary material 47
Chapter 4: Historical ecology changes the options for management of
invading species
4.1 Preface 76 4.2 Statement of authorship 77 4.3 Abstract 78 4.4 Introduction 79 4.5 Materials and methods 81 4.6 Results 87 4.7 Discussion 98
Chapter 5: Loss of ecological baseline through the eradication of oyster
reefs from coastal ecosystems and human memory
5.1 Preface 102 5.2 Statement of authorship 103 Publication 104 Supporting information 114
Chapter 6: Incorporating historical data into aquaculture planning
6.1 Preface 134 6.2 Statement of authorship 135 Publication 136 Supporting information 146
Chapter 7: Discussion
7.1 Summary of thesis 162 7.2 Future research 164 7.3 Conclusions 166
References 168
Appendix A 188
Appendix B 189
Appendix C 195

Abstract
Human disturbances that alter ecosystems are distinct from natural disturbances that drive
variation, and are critical to separate in the study of ecological change. Patterns created by
a combination of anthropogenic and natural drivers are often ambiguous so that existing
patterns can be mistakenly considered a function of natural or anthropogenic processes.
Consequently, a notable challenge in ecology and in natural resource management is not
only to recognise ‘change’, but also its causes. This thesis explored shifts in ecological
patterns, and human perception of them, in aquatic ecosystems across historical time scales
of decades to hundreds of years. Particular emphasis was given to the activities of fishing
and European colonisation, which are renowned drivers of alterations. Research methods
encompassing ecology, fisheries science and history, were used to generate time series for
select hypotheses of change. Fisheries production and catch data were combined with
historical data from the Adelaide Fish Market to reconstruct several baselines for fisheries
in South Australia from colonisation in 1836 through present. Using the conceptual models
of fishing down and ‘neo-Europe’ to account for change, key shifts in fisheries were
identified. These were the modern addition and expansion of fisheries at lower trophic
levels and the historical predilection of European settlers toward exploiting inland species.
Though there is strong evidence of critical changes in ecosystems due to resource
extraction, the addition or introduction of new species to ecosystems can also be
influential. The effect of contemporary concern of society toward a cryptogenic oyster
species and its management was assessed from a historical perspective. Field experiments
were used to evaluate the impact of this species as an epibiont on a native bivalve. These
established that the species might bring positive benefits, which contrasted the negative
societal perception of unwanted ‘invasion’. A factor contributing to this negative
perspective was diminished general memory of the past presence of oyster reefs, which
have been lost from that locality. A baseline of lost oyster reefs across the South Australian
coastline was reconstructed through recovering fisheries catch and effort data and building
a time line of change, including declines in perceived and actual abundance of this habitat
due to overexploitation during the 1800s and early- to mid-1900s. The past distribution of
oyster reefs was established, along with their eradication across more than 1,500 km of the
11
nearshore environment and loss of this knowledge through intergenerational amnesia. To
account for such shifts scientists and managers can incorporate past baselines into their
practice and to test this approach historical data were used to inform several aspects of
planning for aquaculture. This thesis demonstrated that ecological baselines in temperate
aquatic ecosystems have shifted and that more accurate representations of past states can
be retrospectively reconstructed. Also, it illustrated the influence that change can have on
societal and administrative perspectives and, accordingly, advocates for wider
consideration of the shifting baseline syndrome. Without better representation of the past
we risk misinterpreting change, negative and positive, which could perpetuate reduced
expectations for the environment and its deterioration.
22

Declaration
I certify that this work contains no material which has been accepted for the award of any
other degree or diploma in my name, in any university or other tertiary institution and, to
the best of my knowledge and belief, contains no material previously published or written
by another person, except where due reference has been made in the text. In addition, I
certify that no part of this work will, in the future, be used in a submission in my name, for
any other degree or diploma in any university of other tertiary institution without the prior
approval of the University of Adelaide and where applicable, any partner institution
responsible for the joint-award of this degree.
I give consent to this copy of my thesis when deposited in the University Library, being
made available for loan and photocopying, subject to the provisions of the Copyright Act
1968.
The author acknowledges that copyright of published works contained within this
thesis resides with the copyright holder(s) of those works.
I also give permission for the digital version of my thesis to be made available on the
web, via the University’s digital research repository, the Library Search and also through
web search engines, unless permission has been granted by the University to restrict access
for a period of time.
Heidi Katya Alleway
33

Acknowledgements
Foremost, I thank and acknowledge my supervisors Prof. Sean Connell and Prof. Bronwyn
Gillanders for their encouragement for this work and their support and guidance
throughout. They have been teachers, but enabled me to learn in my own right. I am
especially grateful to Prof. Sean Connell, I always enjoy our conversations and appreciate
his patience, as well as interest, on the regular occasions with which I open them saying;
“I’ve gone off on a bit of a tangent.”
Primary Industries and Regions SA has provided the primary support and funding for
this thesis and I thank Will Zacharin, Executive Director, Biosecurity SA and my
Managers, John Virtue and Vic Neverauskas for assisting me to pursue these studies. I also
thank David Peacock, Greg Mutze and Peter Bird, for listening to my stories and
frustrations over lunch and for sharing stories in return. Staff from PIRSA have aided field
work, data collection and analyses and I thank Alex Chalupa, Marty Deveney, Peter Lauer,
Kathryn Wiltshire, Alex Dobrovolskis, Luke Fraser, Shane Roberts, and John Kovaliski for
their assistance.
I am grateful to Keith (Doc) Jones and Scoresby Shepherd for being living
bibliographies of South Australian historical data. I hope that this thesis assists us to
recognise and address the changes they have observed and that it serves as a reminder that
we must not let knowledge become overlooked by time. I am also grateful to Ruth
Thurstan for our many conversations, which I look forward to pursuing in the future.
The local community of Port Augusta, in particular the Port Augusta Coastal Homes
Association Inc. through R. Sharp and A. Morgan, have tirelessly advocated for the
research in chapter four and assisted with field work and community consultation. Our
conversations have not always been easy and I acknowledge, and am grateful, that they
hold considerable concern for the marine environment. Their endorsement for this research
and their continued interest and enthusiasm is appreciated.
A significant shift in my thinking and focus was generated through my participation in
the National Environmental History PhD Workshop, May 2014, hosted by the Australian
National University (ANU) and sponsored by the Centre for Environmental History
44
(ANU), the Fenner School of Environment and Society (ANU), the National Museum of
Australia, and the Mellon Australia-Pacific Observatory (University of Sydney). Prof. Tom
Griffiths, Prof. Libby Robin, and Prof. Heather Goodall provided a sympathetic and
motivating space in which I was able to more fully explore links between ecology and
history. Prior to this workshop I had not heard of ‘neo-Europe’, ‘Crosby’, ‘ecological
imperialism’ and because of their support I found my niche, which I look forward to
exploring further through the fields of ecology as well as environmental history.
My knowledge and experience in the practice of historical ecology has been greatly
improved by my involvement in the Oceans Past Initiative (OPI) and previously the
History of Marine Animal Populations (HMAP). I acknowledge OPI and HMAP for the
organisation of several events, in particular the Oceans Past Conferences, and I thank the
International Convention for the Exploration of the Sea for enabling me to participate in
Oceans Past V in Estonia, May 2015, by providing me with a travel grant.
My heartfelt thanks to my family, for being the type of people who believe in doing
what you love and encouraging me to pursue my passion. Throughout my studies my
brother, Sam Bartram, has provided feedback on my work, taught me statistics and bought
me Steinbeck for inspiration, and my parents, Tony and Phyll Bartram, have made me
believe that I can do anything. Their confidence in me has been the reason I have been able
to achieve what I have. Especially, I thank my husband, Clinton Alleway, for being patient
and supportive but, most importantly for being irrepressibly proud of me. Lastly, I thank
and dedicate this thesis to my grandmother, Muriel Downing, who built our family by the
sea, because her story of rowing the blue line for fish for lunch undoubtedly started it all.
55
Chapter 1: Introduction
1.1 Shifting baselines
Change in ecosystems has occurred over multiple time-scales, from tens of years to tens of
thousands of years, which can be studied from the perspectives of palaeoecology,
archaeology, history and ecology (Lotze and Worm, 2009). These disciplines can assist us
to discern shifts in ecological states and natural disturbances that drive cyclical patterns of
variation or long term ecosystem change. Discerning change that has occurred as a result
of human activity, however, as opposed to change that has occurred naturally, can be
challenging (Dayton et al., 1998, Willis and Birks, 2006). For example, natural patterns of
climatic variability can be a driver of population structure in fish stocks (Finney et al.,
2002), but climate change has induced alterations in their distribution, recruitment success
and growth (Rijnsdorp et al., 2009). Coral reefs have experienced major episodic changes
throughout geological time, but have also been impacted by climate change, and
additionally overexploitation and pollution (Pandolfi et al., 2011).
The human use of natural resources has especially resulted in substantial declines in
species and habitats. Exploitation began when humans first colonised new areas
(Erlandson et al., 2009, Erlandson and Rick, 2010), but their persistent and more recent
industrial scale utilization means that many ecosystems are now fundamentally different
because of overfishing as well as habitat degradation and the incidence of invasive species
(Jackson et al., 2001, Pauly et al., 1998, Mooney and Cleland, 2001). However, even
profound to changes to ecosystems, such as habitat shifts or the regional extinction of
species, can go unnoticed (Dayton et al., 1998, Turvey et al., 2009).
Alongside ecological change cognitive baselines can change over time when an
accurate basis for comparison is not available (Papworth et al., 2009). Scientists and
managers sometimes accept their own recent experience as their benchmark for ‘natural’
and where well-defined or documented baselines are not known or readily available they
may use this perspective as their basis for comparison (Jackson, 2001, Willis and Birks,
2006, Connell et al., 2008). Measuring change against this contemporary benchmark can
66

result in an intergenerational decline of the past and more accurate baseline through the
shifting baseline syndrome (Pauly, 1995). Losing knowledge of the past can contribute to
the loss and acceptance of further ecological change, including unobserved declines in
species and potentially species extinction (Dulvy et al., 2003, Sadovy and Cheung, 2003,
Sáenz-Arroyo et al., 2006). Thus, whilst ecological baselines are used in contemporary
management they may not adequately characterise a more natural state of the ecosystem of
interest or draw attention to the changes that have occurred. Through a ratchet-like action
targets that poorly reflect past states of species or habitats can perpetuate declines (Dayton
et al., 1998, Pitcher, 2001).
1.2 Change in temperate aquatic environments
Temperate aquatic ecosystems have been impacted by overfishing, pollution and the
alteration of habitats through destructive fishing practices or changes in environmental
flows. Worldwide more than 85% of oyster reefs – a highly valuable and engineering
habitat – have been lost due to overexploitation, declines in water quality and disease
(Airoldi and Beck, 2007, Beck et al., 2011). Overfishing has reduced abundances of higher
trophic guilds such as marine mammals, sharks and billfish and these animals now
represent some of the oceans most impacted species (Pauly et al., 1998, Baum et al., 2003,
Worm et al., 2005). In some instances the loss of higher trophic level species has induced
broader ecosystems shifts, for example, the incidence of regime shifts in kelp forests where
the removal of predators enables increased abundances of sea urchins leading to the
creation of urchin barrens (Jackson et al., 2001). Land-based activities have also
contributed to impacts including pollution from runoff, which has led to declines in water
quality and the loss of habitats such as seagrasses and wetlands (Lotze et al., 2006, Marbà
et al., 2014).
Southern Australia is regarded for having extensive areas of remote, ‘untouched’
coastline that supports marine biodiversity and a high degree of biological endemism
(Edyvane, 1999b, Fitzsimons et al., 2015), which is consistent with other isolated
temperate regions, such as New Zealand (Gordon et al., 2010). But this region has been
inhabited and affected by humans for tens of thousands of years. Aboriginal communities
77

have occupied coastal areas of southern Australia for millenia and developed fishing
techniques that have enabled them to exploit marine resources and to adapt to periods of
regional stress to continue fishing (Luebbers, 1978). The more recent period of European
colonisation and occupation also relied on fisheries resources and has precipitated
landscape-scale transformations through other ‘imperial’ behaviours such as the
introduction of exotic species to “renovate the biota” (Crosby, 1986, Griffiths and Robin,
1997, Osborne, 2001). Extensive harvesting of Arctocephalus forsteri (fur seals) began
with the arrival of settlers and the impacts of this resource use have been so substantial that
conservation measures have only recently realised a recovery in the population
(Shaughnessy et al., 1995). Industrial fishing has brought on catastrophic declines of
nearshore shellfish species (Edgar and Samson, 2004) and affected species stocks and
assemblage structures offshore, within remote areas of the Southern Ocean (Ainley and
Blight, 2009).
Throughout New South Wales, Victoria and South Australia the adjustment of
freshwater environmental flows through river regulation has greatly reduced the viability
of inland fishing (Humphries and Winemiller, 2009). Argyrosomus japonicus (mulloway),
a large-bodied and late-maturing species, were historically a dominant part of estuarine
fish assemblages and important to Aboriginal subsistence (Disspain et al., 2011) and
European settlers (Duffield, 1909), but the implementation of weirs in 1940 and long term
overfishing has since led to significant declines in their abundance (Ferguson et al., 2013).
Commercial exploitation has also led to changes in the stock structure of some species. For
example, Fowler and Ling (2010) compared the age of samples of Hyporhamphus
melanochir (southern sea garfish), inferred from otoliths obtained 50 years apart, finding
severe truncation in current South Australian populations as a result of fishing.
Estuaries, in particular, have been impacted by land-based anthropogenic pressures
(Creighton et al., 2015, Fitzsimons et al., 2015). In the large, inverse estuary of Gulf St.
Vincent pollution from wastewater treatment plants, stormwater, and agricultural runoff,
together with prawn trawling, has transformed benthic habitats. Substantial changes to
Malleus malleus (hammer oyster) and Pinna bicolor (razorfish) beds have occurred along
with an 80% decline in byrozoan communities (Shepherd and Sprigg, 1976, Tanner, 2005).
88

Broadscale loss of seagrasses have been identified (Bryars and Rowling, 2009) and
wetlands formed by mangroves and salt marshes have been degraded (Edyvane, 1999a).
Connell et al. (2008) examined long term patterns of change in canopy-forming algae to
test contemporary versus historical patterns of their occurrence at successive regional and
biogeographical scales. In the past, areas along the metropolitan coastline of Adelaide were
indistinguishable from contemporary unaffected sites, but as much as 70% of algal cover is
now gone (Connell et al., 2008).
1.3 Historical ecological research
Since anthropogenic impacts can occur over considerable periods of time there is value in
constructing data sets to have a temporal span commensurate with that of their influence
(Baum et al., 2003, Willis and Birks, 2006, McClenachan, 2009). In the past, explicit
evaluation of temporal scales of measurement have been somewhat limited by availability
of methods and a perceived lack of availability of data. Focus on the ecology of the past
has recently contributed a unique, multi-disciplinary approach to address this gap through
historical ecological research (e.g. Rick and Lockwood, 2012). An agenda for historical
ecology is growing, driven by a growing body of knowledge and evidence that a wide
range of information sources can be drawn upon to generate quantifiable data sets and time
series, from present through past (McClenachan et al., 2012, Schwerdtner Máňez et al.,
2014).
The ‘historical’ element to historical ecology denotes data spanning hundreds of years,
usually aligned to written sources such as diaries and fisheries catch returns, or illustrated
material including maps and photographs (Pinnegar and Engelhard, 2008, Lotze and
Worm, 2009). Whilst these sources have often been documented or archived, they can also
be used to retrospectively evaluate past ecosystem states and patterns of change. Fisheries
occurring in the past can be measured by modeling production, catch or market data (e.g.
Klaer, 2001). Notably, fisheries data already in use can still contribute ‘new data’ because
a different lens, through the method or model used, can be applied (Rosenberg et al., 2005,
Josephson et al., 2008). For example, Baum et al. (2003) used log book data from the U.S.
pelagic longline fleet in the Northwest Atlantic to resolve that the majority of recorded
99
shark species have declined by more than 50% over the last two decades. The authors used
well-known logbooks and simple empirical models, but the data had not previously been
used to assess non-target species, in this case sharks.
Qualitative information can be a further source of data and forms a unique but
challenging part of historical ecology. The dismissal of qualitative or historical records as
“methodologically naïve” and not for scientific application is mistaken (Pitcher, 2001),
because historical records and anecdotes are in fact early interpretations of data (Pauly,
1995, Pitcher, 2001, Pinnegar and Engelhard, 2008) and can contribute quantitative series
to evaluate changes in species, ecosystems and human activities (Holm, 2003, Pinnegar
and Engelhard, 2008, MacKenzie et al., 2011). These data can also detail important or
anomalous environmental events and provide much needed context to anthropological
influences and their consequences. Qualitative data can stem from information within
diaries or reports of the accounts of early explorers, settlers, fishers or communities, as
well as photographs and artwork (Sáenz-Arroyo et al., 2006, Pinnegar and Engelhard,
2008) and a precedent for its use in ecology has recently been set through the development
of novel methods. Rigorous data sets can now be generated from qualitative sources
through the use of methods that enable anecdotal statements to be coded and converted
into semi-quantitative or quantitative measures of species abundances (Sáenz-Arroyo et al.,
2005a, Sáenz-Arroyo et al., 2006). More alternative sources, such as newspaper articles
(Thurstan et al., 2014) and interviews with fishers (Sáenz-Arroyo et al., 2005b, Thurstan et
al., 2015), can also be used in this way. However, historical sources of data cannot always
be accessed through conventional literature searches and are not always easily found, and a
cross-disciplinary appreciation for this type of research is valuable, because it can inform
identification of data and the choice and design of the methods to be used. An approach
that incorporates perspectives from the discipline of history can also provide context to
cultural aspects of change that might otherwise be lacking (Bolster, 2006, Szabó, 2010).
1.4 Reconstructing shifted ecological baselines
Using synopses or analyses that do not accurately reflect an ecosystem can lead to
erroneous or misleading targets being applied to management. Incorporating historical data
1010

into management practices usually increases estimates of past maximum population
abundances and indicates that ecosystems can have higher productive capability than is
often presumed (McClenachan et al., 2012). Despite the fact that fisheries species in
Australia have been commercially exploited for more than 150 years (Duffield, 1903a,
Wallace-Carter, 1987), and there is knowledge of anthropogenic impacts and long term
change in ecosystems (e.g. Connell et al., 2008, Humphries and Winemiller, 2009, Fowler
and Ling, 2010), the ecological baselines used as the basis for management are
disparagingly short. In particular, fisheries statistics and reference limits (targets) for
fisheries management are based on data beginning in the 1980s (Fowler et al., 2014).
Hence, there is a need to address this gap, between the onset of fishing and contemporary
ecological baselines. Measuring species and habitats over longer periods of time will take
greater account of natural cycles of variability as well as long term change induced by
human activity. It is likely that this will generate more accurate points of reference, which
could predicate the need for alternative management regimes or assist to overcome barriers
to ecological restoration (Pitcher, 2005, Manning et al., 2006, Higgs et al., 2014).
Returning ecosystems to former or ‘original’ states through conservation or restoration
is challenging where multiple shifted baselines interact to create complex trajectories
(Duarte et al., 2009a) and, in fact, it may be impossible to fully recover past losses under a
future of non-analogue environments (Hobday, 2011). But a future of complexity could
make the definition of accurate historical baselines more important. Accurate definitions of
past ecological states could assist us to predict and interpret future states (Pandolfi et al.,
2011) and guide our choices for the historical legacies that must be protected, such as
critical ecological processes or cultural values (Higgs et al., 2014). Historical baselines
could also assist us to confront uncertainty, adding confidence to decision-making (Ludwig
et al., 1993), and establish a stronger mandate for the repair of species or habitats to rebuild
lost productivity (Worm et al., 2009).
1.5 Aims of research
The aims of this research were: to ascertain whether aquatic ecological baselines have
shifted, using the temperate region of Australia as the focus; and to reconstruct more
1111

representative measures of past ecosystem states that can be used in ecology and
management. To differentiate between natural versus anthropogenic effects I explicitly
focused on measurement of human activity, testing whether fisheries and European
colonisation have induced shifts in ecological states. I also examined the influence that
these activities and societal perspectives have had on our definition of contemporary
environments and the means through which historical baselines could be effectively
integrated into management.
Each data chapter (two to six) is written in the form of a stand-alone scientific
manuscript suitable for publication in a peer-reviewed journal. Therefore, each chapter
includes a separate introduction, methods, results, discussion and supplementary material;
references for unpublished manuscripts are appended at the end of the thesis. All chapters
are co-authored, hence there is a use of plural, and a statement of authorship is included
preceding the chapter. All tables and figures are embedded within the text and the
numbering of figures and tables begins at one for each chapter, however, all are tied to the
overarching aims of this research, the development of which I discuss in the Discussion
(chapter seven). The following is a brief synopsis of each chapter.
In chapter two historical fisheries production data were used to reevaluate calculations
of the mean trophic level (MTL) of fisheries catches in South Australia. Previous
calculations had been indeterminate (Pauly et al., 1998, Watson et al., 2004, Pauly and
Watson, 2005) but the use of disaggregated, regionally specific data enabled a more
accurate interpretation of change, since 1936, to be made. This chapter also fitted a novel
source of data to the model, this being quantities of fish sold at the Adelaide Fish Market,
to consider whether alternative data that extends further back in time could be more widely
applied to calculations of MTL, which predominantly start at 1950.
Chapter three used the model ‘neo-Europe’ (Crosby, 1986), from the discipline of
history, to lengthen the time series used to evaluate changes induced by fisheries to 1900.
A latent source of historical data from the Adelaide Fish Market was identified, through
which a pattern of societal preferences for species was observed. Patterns of change and
the influence of expectations of European settlers were substantiated through qualitative
1212
anecdotal statements contained within government reports at that time, then compared to
the earlier experiences of fisheries in Europe.
Over the past 50 years our appreciation and understanding of the impacts of non-native
species has grown and ‘invasion ecology’ is now widely studied (Richardson and Pyšek,
2008, Caluya, 2014). Chapter four assessed the concern of a community toward a
cryptogenic oyster species and its management, which happened to be within a locality of
oyster reef loss. The effect of the new species on a native bivalve and associated epifauna
was quantified using field and experimental data. Potential ecological gains were identified
which contrasted the community perception that the population was driving environmental
degradation. The implications of this for management of the species were explored through
the development of a decision-making model.
Chapter five further investigated oyster reef loss through the use of archival material to
reconstruct the past occurrence, distribution and abundance of native oyster reefs formed
by Ostrea angasi across the South Australian coastline. This evaluation recovered a shifted
baseline, which indicated oyster reefs were historically characteristic of much of the
coastline but have been extirpated by commercial fishing and overexploitation. Oyster
fishing hastened the state’s first fisheries legislation, including the implementation of
seasonal and spatial closures and reserves to protect declining oyster beds, but there was
little contemporary knowledge or consideration of this species, oyster fishing, or oyster
reefs.
Integration of historical data into contemporary assessments is needed and can ensure
the best data available is used to establish baselines, rather than it being lost in the future
(McClenachan et al., 2012, Ban et al., 2015). In chapter six, the use of historical data to
prescribe management actions was tested and demonstrated. Past catch data from the
fishery for O. angasi and anecdotal records of activity associated with this fishery were
used to inform contemporary aquaculture planning. Aspects of spatial planning and
‘zoning’, non-native species risk assessment and consultation with industry and
government were informed by the data, the conclusion being that historical information
and past ecological baselines can be integrated into contemporary planning and used
effectively to assist the prescription of management actions.
1313
Chapter 2: Historical changes in mean trophic level of
southern Australian fisheries
2.1 Preface
‘Fishing down of food webs’ can occur when fishing pressure is disproportionately applied
to higher trophic level species leading to a lowering of the overall mean trophic level
(MTL) of fisheries catches. Underlying patterns of ecosystem change, however, can be
obscured by the use of over aggregated catch statistics or the voluntary expansion and
sequential addition of fisheries for lower trophic level species. This chapter uses
disaggregated catch statistics to calculate annual MTL of catch in South Australian
fisheries and evaluate patterns and drivers of change. The analysis illustrates that the
model of MTL must be interpreted with care because declines may not always be the result
of ‘fishing down’, i.e. disproportionate declines in higher trophic level species. This
chapter has been published in Marine and Freshwater Research and is reprinted here with
permission from CSIRO Publishing (Appendix A). The original manuscript can be sourced
from the publishers website: http://www.publish.csiro.au/?paper=MF13246.
1414

2.2 Statement of authorship
Principal Author
Name of Principal Author (Candidate) Heidi K. Alleway
Contribution to the Paper
Designed the research, collated and analysed the data, interpreted the results and wrote and
edited the manuscript.
Overall percentage (%) 75%
Signature
Date 24/07//2015
Co-Author Contributions
By signing the Statement of Authorship, each author certifies that:
i. the candidate’s stated contribution to the publication is accurate (as detailed above);
ii. permission is granted for the candidate in include the publication in the thesis; and
iii. the sum of all co-author contributions is equal to 100% less the candidate’s stated contribution.
Name of Co-Author Sean D. Connell
Contribution to the Paper Assisted with the design of the research and analyses, and editing the manuscript.
Signature
Date 15/07/2015
Name of Co-Author Tim M. Ward
Contribution to the Paper Assisted with the analyses and interpretation of results, and editing the manuscript.
Signature
Date 14/07/2015
Name of Co-Author Bronwyn M. Gillanders
Contribution to the Paper Assisted with the analyses and interpretation of results, and editing the manuscript.
Signature
Date 14/07/2015
Title of Paper Historical changes in mean trophic level of southern Australian fisheries
Publication Status Published Accepted for Publication
Submitted for Publication Publication Style
Publication Details Marine and Freshwater Research. 65(10):884-893. DOI: 10.1071/MF13246
1515

Historical changes in mean trophic levelof southern Australian fisheries
Heidi K. AllewayA,C, Sean D. ConnellA, Tim M. WardB
and Bronwyn M. GillandersA
ASouthern Seas Ecology Laboratories, School of Earth and Environmental Sciences,
University of Adelaide, SA 5005, Australia.BSouth Australian Research and Development Institute (Aquatic Sciences),
PO Box 120, Henley Beach, SA 5024, Australia.CCorresponding author. Email: [email protected]
Abstract. Decreases in the mean trophic level (MTL) of fishery catches have been used to infer reductions in theabundance of high trophic level species caused by fishing pressure. Previous assessments of southern Australian fisheries
have been inconclusive. The objectives of the present study were to provide more accurate estimates of MTL usingdisaggregated taxonomic and spatial data. We applied the model of MTL to fisheries catch statistics for the state ofSouth Australia from 1951 to 2010 and a novel set of historical market data from 1936 to 1946. Results show that from
1951 to 2010, MTL declined by 0.16 of a trophic level per decade; a rate greater than the global average of 0.10 butequivalent to similar regional investigations in other areas. This change is mainly attributable to large increases in catchesof sardine, rather than reductions in the catches of high trophic level species. The pattern is maintained when the historical
data is included, providing a time line from1936 to 2010. Our results show a broadening of the catch of lower trophic levelsand suggest care in interpretation of MTL of catches because reductions do not necessarily reflect change in high trophiclevel species by fishing pressure.
Additional keywords: fisheries, fisheries catch, ‘fishing down’ marine food webs, South Australia.
Received 17 September 2013, accepted 27 December 2013, published online 7 July 2014
Introduction
Fisheries can generate reductions in stock biomass or distri-
bution (Baum andMyers 2004; Christensen et al. 2003; Poulsenet al. 2007), alterations in species composition and trophiccascades (Benoıt and Swain 2008; Daskalov 2002; Pinnegar
et al. 2000), even extinction (Dulvy et al. 2003; Roberts 2003).Predatory species can be disproportionately affected byexploitation (Christensen et al. 2003; Jackson et al. 2001; WardandMyers 2005) and the systematic fishing of these species can
also indirectly induce other impacts, including a lowering of theoverall catch-related trophic level. The ‘fishing down’ ofmarinefood webs was identified when Pauly et al. (1998) observed an
average decline of 0.05–0.10 of a trophic level (TL) per decadesince 1950 in global fisheries within the Large Fishing Areas(LFAs) of the Food and Agriculture Organisation (FAO). This
pattern was attributed to repeated overfishing of higher trophiclevels and a reduced contribution from these species to overallfisheries production (Pauly et al. 1998; Pauly et al. 2002).
Subsequent development of this model suggested that a
portion of the decline may reflect the expansion of catch oflower trophic level fisheries and the sequential addition of newfisheries (Caddy et al. 1998; Essington et al. 2006). Discussion
has focused on whether reductions in the mean trophic level
(MTL) of catch, also referred to as the marine trophic index(MTI) (Butchart et al. 2010; Pauly and Watson 2005), is as
widespread as initially thought andwhether it accurately reflectsunderlying trends in the ecosystem structure (Branch et al.
2010). High trophic level species may not always be more
vulnerable to fishing than low trophic level species (Pinskyet al. 2011) and concern about the effectiveness of catch-basedMTL as an indicator of ecosystem structure is ongoing (Branch2012; Hornborg et al. 2013; Pauly and Froese 2012).
Continued application has also demonstrated there are chal-lenges to achieving a sound picture of estimates of MTL due toa lack of accurate data. Inaccuracies in reporting (Jacquet et al.
2010; Watson and Pauly 2001; Zeller et al. 2011) coupled withover aggregation of catch data spatially and taxonomically(Pauly and Palomares 2005; Watson et al. 2004) may have
affected the accuracy of estimates of MTL. As a result, inves-tigations ofMTL are being repeated at more refined scales usingsource data, including the Exclusive Economic Zones (EEZs) ofindividual countries (Watson et al. 2005) and Large Marine
Ecosystems (LMEs) (Watson et al. 2004), as well as regionalunits, for example: the states and territories of India (Bhathal andPauly 2008) and Brazil (Freire and Pauly 2010); areas of the
Mediterranean (Pinnegar et al. 2003); coastal and inland waters
CSIRO PUBLISHING
Marine and Freshwater Research, 2014, 65, 884–893
http://dx.doi.org/10.1071/MF13246
Journal compilation � CSIRO 2014 www.publish.csiro.au/journals/mfr
1616

of Canada (Pauly et al. 2001); and the Gulf of Thailand(Christensen 1998) (comprehensive list provided by Freireand Pauly (2010)).
The sheer size of Australia’s tropical and temperate marineenvironments mean that the scale at which the MTL of catcheshas previously been investigated in Australia has been coarse. It
is also likely that for southern Australia the current estimates areambiguous because the LFA encompassing this region (LFA57)also spans the eastern Indian Ocean, north to the southernextent of Asia (Fig. 1). Previous assessments for this LFA,
which covers an area of 31 100 000 km2, and the south-westand south-east Australian Shelf LMEs, 1 046 368 km2 and1 199 787 km2, respectively, have indicated no clear trends over
time, with some periods of increasing MTL (Pauly et al. 1998;Pauly and Watson 2005; Watson et al. 2004). In comparison,the jurisdictional waters of South Australia, which extend to
3 nautical miles offshore, covers an area of 60 282 km2. Severalfisheries, including those for Sardinops sagax, Chrysophrys
auratus and crustaceans, operate over a larger area throughaccess to the Commonwealth waters adjoining South Australia.
Previous results may reflect the broad fishing areas used toassess fishing down in southern Australian waters.
Using finer scale geographic and taxonomic data from1951 to
2010 for the jurisdictional state of South Australia, we hypothe-sise that the phenomenon of fishing down can be demonstrated infisheries along the southern Australian coastline. Because catch-
based estimates can be influenced by mechanisms other thanvariations in stock, including regulatory changes, market pre-ferences, technological improvements and attributes related topotential for profit (Branch et al. 2011; Sethi et al. 2010), we also
sought to understand the potential causes of changes inMTLovertime. South Australia has jurisdictional responsibility for thecentral southern coastal margin of Australia. Catches of several
offshore species are included but nearshore and continental shelffisheries are the focus of reporting. Changes in MTL have beenfound apparent at the spatial scale of ‘state’ (units within a
country) but not when a country was treated as a whole (Bhathaland Pauly 2008; Freire and Pauly 2010).
In the present study, we emphasise that patterns inMTLmaynot just reflect changes in the underlying ecosystem MTL
(Branch et al. 2010; Hornborg et al. 2013), but show that thesepatterns are useful in understanding how fisheries change overtime. This is relevant to recent suggestions that a greater focus is
required on how components of ecosystems are fished in relationto one another; i.e. that fishing a broad range of species from arange of trophic levels may be preferable to selective fishing of a
few species (Pinsky et al. 2011; Smith et al. 2011; Zhou et al.
2010). Modelling changes in the MTL of southern Australianfisheries across a longer time period than previously investigat-
ed may provide important insights into patterns within thisregion that would have previously been obscured.
Using this refined spatial scale may mean that changes tofisheries through management have greater effects on trends in
MTL than would otherwise be observed. As a result, wecombine the model with a more explicit investigation of keytaxonomic groups and also test the use of an alternative data
source. Identifying whether alternative datasets can be includedwhen calculating MTL may increase both the available infor-mation through which profiles could be built and the time series
over which they are interpreted. A set of data comprisingquantities of fish passing through a local market from 1936 to1946 are combined with contemporary catch and productionstatistics to provide two time series for comparison. Market data
are not catch based, but it is assumed that market data reflect theproportions of species caught; i.e. the preference for certaintypes and amounts of fish would in part be proportionate to
the quantities caught in the fishery. Identifying whether alterna-tive datasets can be included when calculating MTL mayincrease the time series of information that is available to build
profiles of MTL, which would improve the comprehensivenessof the model and the time series over which it can be interpreted.
Materials and methods
Fisheries Statistics
Commercial wild-caught production statistics recorded and
reported by the Department of Fisheries for the State of South
Southwest AustralianShelf LME
South Australia
Southeast AustralianShelf LME
FAO Large FishingArea 57
Fig. 1. Reporting zones for fisheries catch along the southern Australian
coastline: Australia’s Exclusive Economic Zone (EEZ); Food and Agricul-
ture Organization (FAO) Major Fisheries Areas; Sea Around Us Large
Marine Ecosystems (LMEs); and the Australian State Government bound-
aries (shape files courtesy of Food and Agriculture Organisation of the
United Nations, Fisheries and Aquaculture Department (http://www.fao.
org/fishery/area/search/en); National Oceanic and Atmospheric Adminis-
tration (http://www.lme.noaa.gov/); and the Australian Government (http://
data.gov.au/data/).
MTL in southern Australian fisheries catches Marine and Freshwater Research 885
1717

Australia (Fig. 1) were sourced from publicly availableproduction reports. Contemporary catch quantities of indivi-
dual taxonomic groups from 1986 to 2010 were translatedfrom electronic copies of the fisheries reports of the SouthAustralian Research and Development Institute (Knight and
Tsolos 2011; Knight et al. 2006), South Australia’s fisheriesresearch provider.
For the period 1973 to 1985, annual production statistics
for taxonomic groups were translated from hard copies of the‘Magazine of the Department of Fisheries and the FishingIndustry Council in South Australia’, retained in the StateLibrary of South Australia. Mandatory returns for species
specific fisheries were variously introduced through the mid-1900s and voluntary catch statistics were available in a rawstatistics book of the Department of Fisheries, which recorded
annual quantities of commercially important species from 1951to 1971. This information represented the only source in thedataset that is not publicly accessible and the South Australian
Research and Development Institute made these statistics avail-able. It was recognised that, being based on voluntary submis-sion, these data, and potentially a portion of reporting for minorspecies from 1973 to 1985, may not have represented complete
production quantities for all species caught across the state butthe length of time over which the statistics were considered wasbelieved to be appropriate for patterns of variability to override
short-term inconsistencies in reporting.It was also assumed that catch quantities that were volun-
tarily reported would represent the largest portion of overall
production because the most popular and highly sought afterspecies would be reported first and in more detail. Catch ofmarginal or commercially less significant species may have
been under-reported, but voluntary data were considered validfor the purposes of assessing MTL because the process offishing down is driven by changes in the greatest proportionsof total catch; that is, the largest quantities of species caught.
Variation in species that contribute a small portion to the totalcatchwill haveminimal influence onMTL fromyear to year, butthe long-term patterns of change will remain.
Across the full data period, there was a significant altera-tion in the reporting of ‘tuna’, specifically Thunnus maccoyii
(southern bluefin tuna). Although caught within South
Australian waters through Offshore Constitutional Settlement(OCS), the management of this species was transferred to theCommonwealth (Australian Government) in 1979 and the catchof tuna was then reported through the Australian Bureau of
Agricultural and Resource Economics – Bureau of RuralSciences (ABARE-BRS) (ABARE 1993; ABARE 1994;ABARE 1997; ABARE 2004; ABARE 2006; ABARE 2010).
Catch quantities of tuna from 1951 to 1986 were translated fromthe state-based reporting sources and, from 1991 to 2010, theCommonwealth reporting source. Inconsistencies in the report-
ing of tuna are known to induce a ‘masking effect’, obscuringunderlying or more subtle patterns of change (Bhathal and Pauly2008; Pauly and Palomares 2005). Masking was tested by
treating tuna as a key driving species, retaining and removingcatch quantities from analyses of MTL.
A similar situation existed in some trawl-related fisherieswith an OCS also impacting several other species, in particular
Galeorhinus galeus (school shark) and Mustelus antarcticus
(gummy shark). The various OCS were negotiated in 1997 and2000 (Noell et al. 2006) and apportioned management,
and therefore reporting, to the Commonwealth fisheries agency.This transfer was not as clear as that of tuna and a portion ofshark legally retained as by-catch remained reported through
state-based statistics from 1997 onwards. Commonwealthdata for species caught within each state are not availablethrough ABARE-BRS public reports and because the transfer
of responsibility was comparatively recent, shark quantitieswere not re-adjusted. The restructure of shark managementand reporting in 1979 induced a drop of state-based catchquantities of 1200 tonne, followed by a further 100 tonne in
2000. Influence of this variation was tested for by also treatingshark as a key driving species and quantities of shark wereincluded and removed from analyses of MTL.
Adelaide Fish Market quantities
Prior to 1951, catch statistics for fisheries were not available.
Parliamentary Papers of the Government of South Australia,archived in the State Records of South Australia and open to thepublic, provided annual reports on the ‘Operations of the Fish-eries and Game Department’. For the financial years 1936 to
1946, a contiguous set of papers reported ‘Quantities of FishPassing through the Adelaide Fish Market’. During those years,the Adelaide Fish Market was the pre-eminent market and
outlet for fish sales in the region (Wallace-Carter 1987).Fish market statistics were not comparable with catch statis-
tics and were known to be significantly lower than total
production quantities as the papers also tabled sizeable consign-ments of total quantities of fish by railway to New South Walesand Victoria. These figures and catch quantities for the regional
sale of fish to processors, canneries or at the wharf were notavailable and we applied the equivalent assumption to thesedata as that applied to voluntary fisheries statistics. It wasconsidered that fish market quantities represent favoured spe-
cies caught at that time and the proportions of species soldwouldtherefore reflect the proportions of species caught.
The use of these types of data (non-catch or production
quantity) was an extension of existing fishing downmodels. Thedata were included here to test its ability to maintain the samepatterns in MTL observed through contemporary fisheries
production statistics and its potential as a further data type foruse in fishing down analyses.
Taxonomic trophic level
Trophic levels (TL) of taxonomic finfish groups were takenfrom FishBase (the global online database listing specificbiological and ecological traits of species, Froese and Pauly
2012), which has previously been used to calculate profiles ofMTL (e.g. Bhathal and Pauly 2008; Watson et al. 2004). Forinvertebrates, the equivalent database, SeaLifeBase (Palomares
and Pauly 2012), was used and where data were not avail-able, the aggregate family TLs used by Watson et al. (2005)and available through the Sea Around Us Project (http://
www.seaaroundus.org/) were applied.Significant disaggregation of common groupings was
achieved through the state-based catch statistics, which pro-vided specific lists of the species caught. These lists were
reconciled across the various data sources, correcting for
886 Marine and Freshwater Research H. K. Alleway et al.
1818

changes in synonymy and common names, to identify themost appropriate TL across the time series. Several genericgroupings remained and where more than one species was
included in a grouping, or where a grouping could not confi-dently be separated to species or genus, the average of allavailable TLs was used (see Supplementary Material).
Mean trophic level
The MTL of fisheries catch and market data for each year y wascalculated using the original method of Pauly et al. (1998):
MTLy ¼X
iðTLi�YiyÞ=
XiYiy
where TLi is the trophic level of the taxonomic group, deter-mined as described above, and Yiy is the catch of the species ortaxonomic group i in the year y (Pauly and Palomares 2005).
MTL quantifies the contribution of a specific taxonomic groupto the total catch for a specified time, in this case a fiscal year.
We assessed the model to determine if the voluntary addition
and expansion of new low trophic level fisheries can drivedeclines in MTL of a magnitude similar to the systematicdepletion of high trophic level species (Caddy et al. 1998;Essington et al. 2006) by assessing only species with a
TL. 3.25 (Pauly and Watson 2005). MTL was also calculatedexcluding all invertebrate species, and then invertebrates as wellas Sardinops sagax (sardine), because the expansion of these
fisheries in recent years may represent an alternative scenario,including ‘fishing through’ foodwebs rather than ‘fishing down’
(Branch et al. 2010; Essington et al. 2006). The sardine alsohad the potential to mask trends in MTL through its contribu-tion in recent years of over 70% to the State’s total wild catch
production (Knight and Tsolos 2011) and using the sameapproach as that of tuna and shark, the sardine was retainedand removed from all analyses of MTL to test this influence.
Trends in MTL were quantified through linear regressionand an assessment of the goodness of fit through the coefficientof determination, R2. For each assessment of MTL, a trend linewas fitted to fisheries production statistics (1951 to 2010) and a
trend line extrapolated for comparison to the second trend lineof fisheries statistics and fishmarket data (1936 to 2010).R2 wasnot used as an absolute measure of fit but as a guide to the
appropriateness of a linear trend across time. The statisticalsignificance of trends was also analysed (P-value).
The contribution of the most important species (catch vol-
ume) to total annual catch was further investigated for theirindividual pattern of change over time. The percentage that aspecies contributed to overall catch was calculated and
displayed as a 2-dimensional area graph, for species with aTL. 3.25 and for species with a TL, 3.25, to illustrate a moredetailed profile for understanding the variation that occurred todrive the patterns observed.
Results
MTL all species
The MTL of South Australia’s fisheries has declined throughtime by an average of 0.14 of a trophic level per decade (Fig. 2a).
1.51936 1946 1956 1966 1976 1986 1996 2006 1936 1946 1956 1966 1976 1986 1996 2006
2.5
3.5
4.51.5
2.5
(a) (c)
(b) (d )
Mea
n tr
ophi
c le
vel
3.5
4.5
1.5
Year
2.5
3.5
4.51.5
2.5
3.5
4.5
Fig. 2. Trends in mean trophic level (MTL) for (a) all species (b) all species excluding tuna, (c) all species
excluding tuna and shark, and (d) all species excluding tuna, shark and sardine in South Australian fisheries catch
and production statistics, 1951 to 2010 (�) and quantities of fish passing through theAdelaide FishMarket, 1936–46
(J). Linear regression lines extrapolated for comparison.
MTL in southern Australian fisheries catches Marine and Freshwater Research 887
1919

This rate of decline increased to 0.18 per decade when tunawas removed (Fig. 2b) and 0.16 when both tuna and sharks were
removed (Fig. 2c). All three relations showed a good level of fitto a linear model, with R2¼ 0.8226, 0.8694 and 0.9161,respectively (Table 1). When the sardine was removed from thedata, a drop in the rate of decline to 0.10 per decade was
observed (Fig. 2d) (R2¼ 0.8285). All trends for MTL of allspecies were statistically significant (P, 0.001) (Table 1).
Tuna was not found to mask trends in the present study but
MTL excluding tuna and shark was considered to be moreaccurate because of inconsistencies in reporting and difficultiesin obtaining good estimates from historical fisheries. A levelling
out of MTL from ,2002 onwards was seen, which may havereflected no new development in low trophic level fisheriessince that time, and drops in trophic level were observed forthe years around 1966, 1985 and 2000 (Fig. 2a–d), a reflection of
the recalibration of the species reported against. Each recalibra-tion generally expanded the list of species being reported,leading to greater resolution in taxonomy and catch quantities.
MTL in trophic levels.3.25
When calculations were restricted to species with a TL. 3.25,a stable and comparably unchanged trend was observed
(Fig. 3a–b). MTL from 1936 to 2010 decreased 0.01 per decadeon average for all species or decreased 0.04 when tuna and sharkwere removed. A negligible portion of this pattern fitted the
linear trend, R2¼ 0.0080 and 0.3525, respectively, and the trendonly became significant when tuna and shark were excluded,P, 0.001 versus P¼ 0.480 for all species (Table 1).
MTL excluding invertebrate species
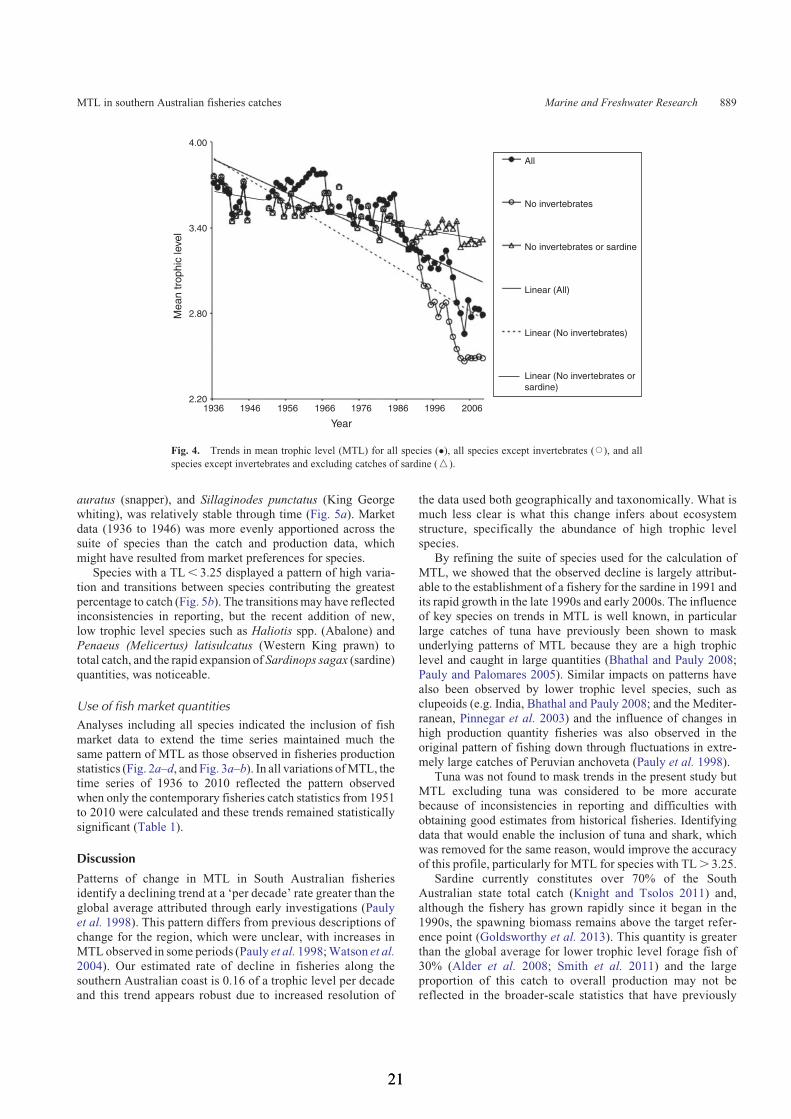
Removing invertebrate species, and then invertebrates as well assardines (tuna and shark removed for both calculations), indi-cated that a small portion of the overall decline reflected the
addition and expansion of fisheries for these species but thatthe greatest portion of change in MTL was still driven by theinclusion of quantities of sardine (Fig. 4). When invertebrate
fisheries were removed, the rate of decline in trophic levelwas 0.18 per decade, with a significant trend (R2¼ 0.7043,P, 0.001).With the removal of both invertebrates and sardines,
the rate of decline dropped to 0.05 per decade, but the signifi-cance of the trend remained (R2¼ 0.6259 and P, 0.001). Theinfluence of catches in sardines was particularly noticeable fromthe early 1990s onwards when there was a divergence in the
patterns of MTL excluding invertebrates, either including orexcluding sardine (Fig. 4).
Proportions of significant species
Key species contributing to total annual catch were illustratedthrough their percentage contribution across time. In specieswith a TL. 3.25, the contribution of several species, including
Jasus edwardsii (southern rock lobster), Pseudocaranx geor-
gianus and Pseudocaranx wrighti (trevally), Chrysophrys
Table 1. Measures of patterns in mean trophic level (MTL) over time, in fisheries data (1951–2010) and with the inclusion of
market data (1936–2010), R2 values of linear trend lines, and the significance of the trend, P-value
1951–2009 1936–2009
Analysis Per decade
TL change
Linear
trend R2
P Per decade
TL change
Linear
trend R2
P
All �0.14 0.8226 0.000 �0.11 0.6896 0.000
All (no tuna) �0.18 0.8694 0.000 �0.15 0.8010 0.000
All (no tuna or shark) �0.16 0.9161 0.000 �0.14 0.9027 0.000
All (no tuna, shark or sardine) �0.10 0.8285 0.000 �0.09 0.8730 0.000
TL. 3.25 �0.01 0.1307 0.007 �0.01 0.0080 0.480
TL. 3.25 (no tuna or shark) �0.01 0.0173 0.339 �0.04 0.3525 0.000
2.51936
(b)
(a)
1946 1956 1966 1976
Year1986 1996 2006
3.5
3.5
4.5
Mea
n tr
ophi
c le
vel
2.5
4.5
Fig. 3. Trends in mean trophic level (MTL) for (a) all species with trophic
level. 3.25 and (b) species. 3.25, excluding tuna and shark, in South
Australian fisheries catch and production statistics, 1951 to 2010 (�) andquantities of fish passing through the Adelaide Fish Market, 1936–46 (J).
Linear regression lines extrapolated for comparison.
888 Marine and Freshwater Research H. K. Alleway et al.
2020
auratus (snapper), and Sillaginodes punctatus (King Georgewhiting), was relatively stable through time (Fig. 5a). Market
data (1936 to 1946) was more evenly apportioned across thesuite of species than the catch and production data, whichmight have resulted from market preferences for species.
Species with a TL, 3.25 displayed a pattern of high varia-tion and transitions between species contributing the greatestpercentage to catch (Fig. 5b). The transitions may have reflectedinconsistencies in reporting, but the recent addition of new,
low trophic level species such as Haliotis spp. (Abalone) andPenaeus (Melicertus) latisulcatus (Western King prawn) tototal catch, and the rapid expansion of Sardinops sagax (sardine)
quantities, was noticeable.
Use of fish market quantities
Analyses including all species indicated the inclusion of fish
market data to extend the time series maintained much thesame pattern of MTL as those observed in fisheries productionstatistics (Fig. 2a–d, and Fig. 3a–b). In all variations ofMTL, the
time series of 1936 to 2010 reflected the pattern observedwhen only the contemporary fisheries catch statistics from 1951to 2010 were calculated and these trends remained statistically
significant (Table 1).
Discussion
Patterns of change in MTL in South Australian fisheriesidentify a declining trend at a ‘per decade’ rate greater than the
global average attributed through early investigations (Paulyet al. 1998). This pattern differs from previous descriptions ofchange for the region, which were unclear, with increases inMTLobserved in some periods (Pauly et al. 1998;Watson et al.
2004). Our estimated rate of decline in fisheries along thesouthern Australian coast is 0.16 of a trophic level per decadeand this trend appears robust due to increased resolution of
the data used both geographically and taxonomically. What ismuch less clear is what this change infers about ecosystem
structure, specifically the abundance of high trophic levelspecies.
By refining the suite of species used for the calculation of
MTL, we showed that the observed decline is largely attribut-able to the establishment of a fishery for the sardine in 1991 andits rapid growth in the late 1990s and early 2000s. The influenceof key species on trends in MTL is well known, in particular
large catches of tuna have previously been shown to maskunderlying patterns of MTL because they are a high trophiclevel and caught in large quantities (Bhathal and Pauly 2008;
Pauly and Palomares 2005). Similar impacts on patterns havealso been observed by lower trophic level species, such asclupeoids (e.g. India, Bhathal and Pauly 2008; and the Mediter-
ranean, Pinnegar et al. 2003) and the influence of changes inhigh production quantity fisheries was also observed in theoriginal pattern of fishing down through fluctuations in extre-
mely large catches of Peruvian anchoveta (Pauly et al. 1998).Tuna was not found to mask trends in the present study but
MTL excluding tuna was considered to be more accuratebecause of inconsistencies in reporting and difficulties with
obtaining good estimates from historical fisheries. Identifyingdata that would enable the inclusion of tuna and shark, whichwas removed for the same reason, would improve the accuracy
of this profile, particularly for MTL for species with TL. 3.25.Sardine currently constitutes over 70% of the South
Australian state total catch (Knight and Tsolos 2011) and,
although the fishery has grown rapidly since it began in the1990s, the spawning biomass remains above the target refer-ence point (Goldsworthy et al. 2013). This quantity is greaterthan the global average for lower trophic level forage fish of
30% (Alder et al. 2008; Smith et al. 2011) and the largeproportion of this catch to overall production may not bereflected in the broader-scale statistics that have previously
2.201936 1946 1956 1966 1976
Year
1986 1996
All
No invertebrates
No invertebrates or sardine
Linear (All)
Linear (No invertebrates)
Linear (No invertebrates orsardine)
2006
2.80
3.40
Mea
n tr
ophi
c le
vel
4.00
Fig. 4. Trends in mean trophic level (MTL) for all species (�), all species except invertebrates (J), and all
species except invertebrates and excluding catches of sardine (W).
MTL in southern Australian fisheries catches Marine and Freshwater Research 889
2121

been used to model fishing down in the southern AustralianLMEs (Watson et al. 2004).
As is the case with sardine, there has been an emergenceand augmentation of new fisheries in South Australia thathas also contributed to a decline in MTL. For example, thegrowth of an extensive fishery for Penaeus (Melicertus) latisul-
catus (Western King prawn), crab fisheries for Portunus pelagi-cus (blue crab), Pseudocarcinus gigas (king crab) and Ovalipes
australiensis (sand crab), and the catch of cockles Donax del-
toides (the Goolwa cockle) and Katelysia spp. (mud cockle), hascontributed to the reduction inMTL. This trend in expanding lowtrophic level fisheries, especially for invertebrate species, is
consistent with a worldwide growth in these fisheries (Alderet al. 2008; Anderson et al. 2011). There is no evidence to suggestthat the growth of these new South Australian fisheries reflects
an overall decline in the abundance of high trophic level species.The trend in higher trophic level species remained stable
across time. Unlike Bhathal and Pauly (2008), who found theprocess of fishing down to only be identifiable when lower
trophic level species were excluded, and Pauly and Watson
(2005), who used TL. 3.25 to indicate greater rates ofdecline in higher order species than when considering all
species, our results do not show a prevailing pattern of fishingdown of higher trophic levels. The influence of the expansion inthe fisheries for low trophic level species was recognised byinvestigating MTL only for species with a TL. 3.25, which
remains constant, while MTL for all species declines. Wesuggest that the MTL of fisheries catches does not alwaysreflect declines in high trophic levels within the ecosystem,
and that more explicit calculations testing the influence of keydriving species and the addition of new fisheries are required tounderstand the causes of changes in MTL.
Broader consideration of the drivers of change also providenecessary context to patterns observed in MTL. In our example,the expansion of the sardine fishery has been voluntary and in
part based on an increase in demand for this species as fodder forthe aquaculture of Thunnus maccoyii (southern bluefin tuna)(Shanks 2005). The development of tuna aquaculture is drivenby export markets in Asia, specifically Japan, and catches of
sardine have been influenced by multiple external drivers
1936–370
20
40
60
80
100
Per
cent
of t
otal
ann
ual c
atch
(%
)
0
20
40
60
80
100
Trevally
Mulloway
Snook
Australian salmon
Australian herring
Squid, Octopus & Cuttlefish
King George whiting
Snapper
Rock lobster
(a)
(b)
1961–62
Year
1985–86 2005–06
Cockle (Goolwa, mud)
Crab (blue, king, sand)
Abalone
Western King prawn
Sardine
All leather jackets
Yellowfin whiting
Southern Garfish
Mullet (inc. yellow-eye)
Fig. 5. Species contributions (%) to total annual fisheries catch and production (1951 to 2010) and quantities of fish
passing through the Adelaide Fish Market, (1936–46), for main species (a) with a TL. 3.25, and (b) with a
TL, 3.25.
890 Marine and Freshwater Research H. K. Alleway et al.
2222
rather than variation in the underlying ecosystem (Goldsworthyet al. 2013). Changes in the catch quantities of the high value
marine species rock lobster and abalone, for which the majo-rity of product is exported to Hong Kong and China, can also beinfluenced by market access and demand. Western King prawn
was previously a key export fishery but has most recently beensold increasingly within domestic markets. Although manage-ment controls regulate catch quantities, anticipated growth in
the export of Australian seafood products to Asia may continueto drive changes in existing fisheries and the addition andexpansion of new fisheries. Evaluation of broader and non-ecosystem-based drivers of change might be essential for future
models of MTL.
The geographical scale of ‘state’
Averaging occurs when catch data are pooled across largespatial units, such that patterns may be masked or emerge as afunction of a few highly variable or abundant species. In thepresent study, we reduced this potential bias by focusing the
geographic and taxonomic scales at units that were more rep-resentative of the local fisheries and fish stocks, these being thestate of South Australia and the classification of species. A
consequence of focusing investigations at smaller spatial scalesmay be the increased influence of catches in dominant species,as well the impact of management and regulatory controls.
The influence of changes in large fisheries was observed inthe original pattern of MTL when extremely large catches ofPeruvian anchoveta occurred (Pauly et al. 1998) and this effect islikely exacerbated at small spatial scales. Management controls
aim to regulate species-specific catches, which contributes to theabsence of reductions inMTL of high trophic level species and arecent levelling out of MTL, particularly because there has been
no contemporary development of new fisheries. The addition ofsmall bodied and invertebrate species are not reflected well inglobal, industrial fisheries data (Pinsky et al. 2011) and using
small scale, regional calculations of MTL may be more appro-priate for some areas rather than relying on global estimates.
State-based data also reflects periods of recalibration. When
the list of species reported against changes, the modificationleads to greater resolution, specificity or accuracy in the taxo-nomic groups reported against and the MTL may noticeablydiffer from the previous year. We identified three observable
recalibrations impacting upon periods around 1966, 1985 and2000, but while these drops were noticeable, the long-termpattern of decline remained because of the length of the dataset
and the ongoing development of new fisheries for low trophiclevel species. This suggests that taxonomy can be retrospective-ly refined in the existing or historical data with minimal impact
on the long-term trend of MTL (Jacquet et al. 2010).
The use of alternative data
Future investigations of the MTL of catches may be assisted bybroadening the types of data used in the model, particularly
where there is a strong influence from large catches of few newspecies, short timelines for conventional fisheries data or long-term changes to fisheries through alternative management
arrangements. A novel extension of previous work was thesuccessful inclusion of an alternative data source, namely
quantities of fish passing through a commercial fish market,which increased the timeline of observation back to 1936. In
analyses of MTL for all species, market data were evenly dis-tributed across a trend comparable to that of the fisheries sta-tistics. We suggest that this approach needs further assessment
and that, at least initially, alternative data should run alongsidecontemporary and already validated sources (fisheries statis-tics). However, this method addresses the need for the inclusion
and acceptance of a broader range of information to reconstructfisheries catch identified elsewhere (e.g. Hardt 2009; Jacksonet al. 2001; Jacquet et al. 2010).
We redress a knowledge gap in southern Australian fisheries
by identifying a declining trend in the MTL of fisheries at a rateof 0.16 of a trophic level per decade. However, this reduction inMTL does not appear to be driven by declines in the abundance
of high trophic level species, which have sustained importantfisheries throughout the study period, but by the development ofnew fisheries for low trophic level species that are also provid-
ing sustainable catches, in particular sardines. Over-aggregationof data, which has obscured patterns of fishing down in otherareas, is considered to be the reason that this reduction in MTLhas been unobserved previously and the spatial scale used
should be taken into account when interpreting calculations.We also show that historical market information, which is notalways treated as a useful or valid source of data, may be
important in continuing to reconstruct changes in fisheries,particularly where the data may be able to extend the timelinebefore 1950; the current starting point for most investigations.
Our results not only show a broadening of the catch of lowertrophic levels, but also reveal care is necessary when interpret-ing the MTL of catches because reductions do not necessarily
reflect change in the abundance of high trophic level species byfishing pressure.
Acknowledgements
The work was funded by the Department of Primary Industries and Regions
South Australia. SDC and BMG acknowledge ARC grants and Future
Fellowships for support. We are also grateful to Dr Keith Jones of the South
Australian Research and Development Institute for the use of historical
fisheries statistics, and his perspective on changes to the fisheries of South
Australia, and Vic Neverauskas for his ongoing commitment to this work.
References
ABARE (1993) Australian Fisheries Statistics 1993. Australian Bureau
of Agricultural and Resource Economics, Canberra.
ABARE (1994) Australian Fisheries Statistics 1994. Australian Bureau of
Agricultural and Resource Economics, Canberra.
ABARE (1997) Australian Fisheries Statistics 1997. Australian Bureau
of Agricultural and Resource Economics, Caberra.
ABARE (2004) Australian Fisheries Statistics 2003. Australian Bureau of
Agricultural and Resource Economics, Canberra.
ABARE (2006) Australian Fisheries Statistics 2005. Australian
Government, Canberra.
ABARE (2010) Australian fisheries statistics 2009. Australian Government,
Canberra.
Alder, J., Campbell, B., Karpouzi, V., Kaschner, K., and Pauly, D. (2008).
Forage fish: from ecosystems tomarkets.Annual Review of Environment
and Resources 33, 153–166. doi:10.1146/ANNUREV.ENVIRON.33.
020807.143204
MTL in southern Australian fisheries catches Marine and Freshwater Research 891
2323
Anderson, S. C., Flemming, J. M., Watson, R., and Lotze, H. K. (2011).
Rapid global expansion of invertebrate fisheries: trends, drivers, and
ecosystem effects. PLoS ONE 6, e14735.
Baum, J. K., and Myers, R. (2004). Shifting baselines and the decline of
pelagic sharks in the Gulf of Mexico. Ecology Letters 7, 135–145.
doi:10.1111/J.1461-0248.2003.00564.X
Benoıt, H. P., and Swain, D. P. (2008). Impacts of environmental change and
direct and indirect harvesting effects on the dynamics of a marine fish
community. Canadian Journal of Fisheries and Aquatic Sciences 65,
2088–2104. doi:10.1139/F08-112
Bhathal, B., and Pauly, D. (2008). ‘Fishing down marine food webs’ and
spatial expansion of coastal fisheries in India, 1950–2000. Fisheries
Research 91, 26–34. doi:10.1016/J.FISHRES.2007.10.022
Branch, T. A. (2012). FAO’s state of fisheries and aquaculture: correcting
some misrepresentations by Pauly and Froese. Marine Policy 36,
1191–1192. doi:10.1016/J.MARPOL.2012.02.026
Branch, T. A., Watson, R., Fulton, E. A., Jennings, S., McGilliard, C. R.,
Pablico,G. T., Ricard,D., andTracey, S.R. (2010). The trophic fingerprint
of marine fisheries. Nature 468, 431–435. doi:10.1038/NATURE09528
Branch, T. A., Jensen, O. P., Ricard, D., Ye, Y., and Hilborn, R. (2011).
Contrasting global trends in marine fishery status obtained from
catches and from stock assessments. Conservation Biology 25(4),
777–786. doi:10.1111/J.1523-1739.2011.01687.X
Butchart, S. H. M., Walpole, M., Collen, B., van Strien, A.,
Scharlemann, J. P. W., Almond, R. E. A., Baillie, J. E. M.,
Bomhard, B., Brown, C., Bruno, J., Carpenter, K. E., Carr, G. M.,
Chanson, J., Chenery, A. M., Csirke, J., Davidson, N. C., Dentener, F.,
Foster, M., Galli, A., Galloway, J. N., Genovesi, P., Gregory, R. D.,
Hockings, M., Kapos, V., Lamarque, J.-F., Leverington, F., Loh, J.,
McGeoh, M. A., McRae, L., Minasyan, A., Hernandez Morcillo, M.,
Oldfield, T. E. E., Pauly, D., Quader, S., Revenga, C., Sauer, J. R.,
Skolnik, B., Spear, D., Stanwell-Smith, D., Stuart, S. N., Symes, A.,
Tierney, M., Tyrrell, T. D., Vie, J.-C., and Watson, R. (2010). Global
biodiversity: indicators of recent declines. Science 328, 1164–1168.
doi:10.1126/SCIENCE.1187512
Caddy, J. F., Csirke, J., Garcia, S. M., and Grainger, R. J. R. (1998).
How pervasive is ‘‘Fishing down marine food webs’’? Science 282,
1383. doi:10.1126/SCIENCE.282.5393.1383A
Christensen, V. (1998). Fishery-induced changes in a marine ecosystem:
insight from models of the Gulf of Thailand. Journal of Fish Biology 53
(Supplement A), 128–142. doi:10.1111/J.1095-8649.1998.TB01023.X
Christensen, V., Guenette, S., Heymans, J. T., Walters, C. J., Watson, R.,
Zeller, D., and Pauly, D. (2003). Hundred-year decline of North Atlantic
predatory fishes. Fish and Fisheries 4, 1–24. doi:10.1046/J.1467-2979.
2003.00103.X
Daskalov, G. M. (2002). Overfishing drives a trophic cascade in the Black
Sea. Marine Ecology Progress Series 225, 53–63. doi:10.3354/
MEPS225053
Dulvy, N. K., Sadovy, Y., and Reynolds, J. D. (2003). Extinction vulnera-
bility in marine populations. Fish and Fisheries 4, 25–64. doi:10.1046/
J.1467-2979.2003.00105.X
Essington, T. E., Beaudreau, A. H., and Wiedenmann, J. (2006). Fishing
through marine food webs. Proceedings of the National Academy of
Sciences of the United States of America 103, 3171–3175. doi:10.1073/
PNAS.0510964103
Freire, K. M. F., and Pauly, D. (2010). Fishing down Brazilian marine food
webs, with emphasis on the east Brazilian large marine ecosystem.
Fisheries Research 105, 57–62. doi:10.1016/J.FISHRES.2010.02.008
Froese, R., and Pauly, D. (2012) FishBase. Vol. 2011. 02/2012 edn. (Eds.
R Froese and D Pauly). Available from: http://www.fishbase.org
Goldsworthy, S. D., Page, B., Rogers, P. J., Bulman, C., Wiebkin, A.,
McLeay, L. J., Einoder, L., Baylis, A. M. M., Braley, M., Caines, R.,
Daly, K., Huveneers, C., Peters, K., Lowther, A. D., and Ward, T. M.
(2013). Trophodynamics of the eastern Great Australian Bight
ecosystem: ecological change associated with the growth of
Australia’s largest fishery. Ecological Modelling 255, 38–57.
doi:10.1016/J.ECOLMODEL.2013.01.006
Hardt, M. J. (2009). Lessons from the past: the collapse of Jamaican
coral reefs. Fish and Fisheries 10, 143–158. doi:10.1111/J.1467-2979.
2008.00308.X
Hornborg, S., Belgrano, A., Bartolino, V., Valentinsson, D., and Ziegler, F.
(2013). Trophic indicators in fisheries: a call for re-revaluation. Biology
Letters 9. doi:10.1098/RSBL.2012.1050
Jackson, J. B. C., Kirby, M. X., Berger, W. H., Bjorndal, K. A., Botsford,
L. W., Bourque, B. J., Bradbury, R. H., Cooke, R., Erlandson, J. A.,
Hughes, T. P., Kidwell, S., Lange, C. B., Lenihan, H. S., Pandolfi, J. M.,
Peterson, C. H., Steneck, R. S., Tegner, M. J., andWarner, R. R. (2001).
Historical overfishing and the recent collapse of coastal ecosystems.
Science 293, 629–637. doi:10.1126/SCIENCE.1059199
Jacquet, J., Fox, H., Motta, H., Ngusaru, A., and Zeller, D. (2010). Few
data butmany fish:marine small-scale fisheries catches forMozambique
and Tanzania. African Journal of Marine Science 32(2), 197–206.
doi:10.2989/1814232X.2010.501559
Knight, M. A., and Tsolos, A. (2011) South Australian Wild Fisheries
Information and Statistics Report 2009/10. South Australian Research
and Development Institute (Aquatic Sciences), Adelaide.
Knight, M. A., Tsolos, A., and Doonan, A. M. (2006) South AustralianWild
Fisheries Information and Statistics Report. South Australian Research
and Development Institute, Adelaide, South Australia.
Noell, C., Presser, J., and Jones, K. (2006) Management Plan for the South
Australian Marine Scalefish Fishery. Primary Industries and Resources
South Australia, Adelaide, South Australia.
Palomares, M. L., and Pauly, D. (2012) SeaLifeBase. Vol. 2011. 02/2012
edn. (Eds. ML Palomares and D Pauly). Available from: http://
www.sealifebase.org
Pauly, D., and Froese, R. (2012). Comments on FAO’s State of Fisheries
and Aquaculture, or ‘SOFIA 2010’. Marine Policy 36, 746–752.
doi:10.1016/J.MARPOL.2011.10.021
Pauly, D., and Palomares, M. L. (2005). Fishing down marine food web:
it is far more pervasive than we thought. Bulletin of Marine Science 76,
197–211.
Pauly, D., and Watson, R. (2005). Background and interpretation of the
‘Marine Trophic Index’ as a measure of biodiversity. Philosophical
Transactions of the Royal Society of London. Series B, Biological
Sciences 360, 415–423. doi:10.1098/RSTB.2004.1597
Pauly, D., Christensen, V., Dalsgaard, J., Froese, R., and Torres, F., Jr
(1998). Fishing down marine food webs. Science 279, 860–863.
doi:10.1126/SCIENCE.279.5352.860
Pauly, D., Palomares, M. L., Froese, R., Sa-a, P., Vakily, M., Preikshot, D.,
and Wallace, S. (2001). Fishing down Canadian aquatic food webs.
Canadian Journal of Fisheries and Aquatic Sciences 58, 51–62.
Pauly, D., Christensen, V., Guenette, S., Pitcher, T. J., Sumaila, R., and
Walters, C. J. (2002). Towards sustainability in world fisheries. Nature
418, 689–695. doi:10.1038/NATURE01017
Pinnegar, J. K., Polunin, N. V. C., Francour, P., Badalamenti, F.,
Chemello, R., Harmelin-Vivien, M. L., Hereu, B., Milazzo, M.,
Zabala, M., D’Anna, G., and Pipitone, C. (2000). Trophic cascades
in benthic marine ecosystems: lessons for fisheries and protected-
area management. Environmental Conservation 27, 179–200.
doi:10.1017/S0376892900000205
Pinnegar, J. K., Polunin, N. V. C., and Badalamenti, F. (2003). Long-term
changes in the trophic level of western Mediterranean fishery and
aquaculture landings. Canadian Journal of Fisheries and Aquatic
Sciences 60, 222–235. doi:10.1139/F03-016
Pinsky, M. L., Jensen, O. P., Ricard, D., and Palumbi, S. R. (2011).
Unexpected patterns of fisheries collapse in the world’s oceans. Pro-
ceedings of the National Academy of Sciences of the United States of
America 103(9), 3171–3175. doi:10.1073/PNAS.1015313108
892 Marine and Freshwater Research H. K. Alleway et al.
2424

Poulsen, B., Holm, P., and MacKenzie, B. R. (2007). A long-term
(1667–1860) perspective on impacts of fishing and environmental
variability on fisheries for herring, eel, and whitefish in the Limfjord,
Denmark. Fisheries Research 87, 181–195. doi:10.1016/J.FISHRES.
2007.07.014
Roberts, C. M. (2003). Our shifting perspectives on the oceans. Oryx 37,
166–177. doi:10.1017/S0030605303000358
Sethi, S. A., Branch, T. A., and Watson, R. (2010). Global fishery develop-
ment patterns are driven by profit but not trophic level. Proceedings of
the National Academy of Sciences of the United States of America 107,
12163–12167. doi:10.1073/PNAS.1003236107
Shanks, S. (2005) Management Plan for the South Australian Pilchard
Fishery. Primary Industries and Resources South Australia, Adelaide,
South Australia.
Smith, A. D. M., Brown, C. J., Bulman, C. M., Fulton, E. A., Johnson, P.,
Kaplan, I. C., Lozano-Montes, H., Mackinson, S., Marzloff, M.,
Shannon, L. J., Shin, Y., and Tam, J. (2011). Impacts of fishing
low-trophic level species on marine ecosystems. Science. doi:10.1126/
SCIENCE.1209395
Wallace-Carter, E. (1987) ‘For They Were Fisheries: The History of the
Fishing Industry in SA.’ (Amphitrite Publishing House: Adelaide)
Ward, P., and Myers, R. A. (2005). Shifts in open-ocean fish communities
coinciding with the commencement of commercial fishing. Ecology 86,
835–847. doi:10.1890/03-0746
Watson, R., and Pauly, D. (2001). Systematic distortions in world fisheries
catch trends. Nature 414, 534–536. doi:10.1038/35107050
Watson, R., Kitchingman, A., Gelchu, A., and Pauly, D. (2004). Mapping
global fisheries: sharpening our focus. Fish and Fisheries 5, 168–177.
doi:10.1111/J.1467-2979.2004.00142.X
Watson, R., Alder, J., Kitchingman, A., and Pauly, D. (2005). Catching some
needed attention.Marine Policy 29, 281–284. doi:10.1016/J.MARPOL.
2004.06.006
Zeller, D., Rossing, P., Harper, S., Persson, L., Booth, S., and Pauly, D.
(2011). The Baltic Sea: estimates of total fisheries removals 1950–2007.
Fisheries Research 108, 356–363. doi:10.1016/J.FISHRES.2010.10.024
Zhou, S., Smith, A. D. M., Punt, A. E., Richardson, A. J., Gibbs, M.,
Fulton, E. A., Pascoe, S., Bulman, C., Bayliss, P., and Sainsbury, K.
(2010). Ecosystem-based fisheries management requires a change
to the selective fishing philosophy. Proceedings of the National
Academy of Sciences of the United States of America 107, 9485–9489.
doi:10.1073/PNAS.0912771107
www.publish.csiro.au/journals/mfr
MTL in southern Australian fisheries catches Marine and Freshwater Research 893
2525
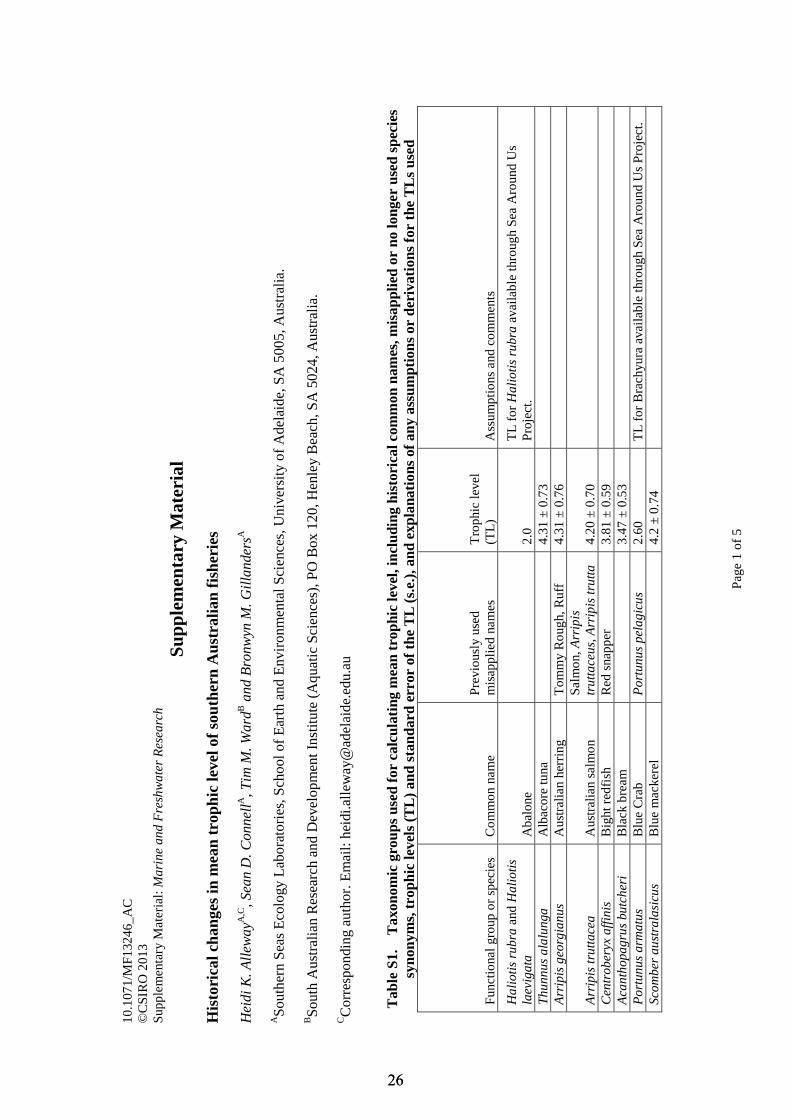
Pa
ge 1
of 5
10
.107
1/M
F1
324
6_A
C
©C
SIR
O 2
01
3 S
upp
lem
ent
ary
Ma
teri
al: M
arin
e an
d F
resh
wat
er R
esea
rch
Supp
lem
enta
ry M
ater
ial
His
tori
cal c
hang
es in
mea
n tr
ophi
c le
vel o
f so
uthe
rn A
ustr
alia
n fi
sher
ies
Hei
di K
. All
eway
A,C
, Sea
n D
. Con
nell
A, T
im M
. War
dB a
nd B
ronw
yn M
. Gil
land
ersA
AS
outh
ern
Sea
s E
colo
gy L
abor
ator
ies,
Sch
ool o
f E
arth
and
Env
iron
men
tal S
cien
ces,
Uni
vers
ity o
f A
dela
ide,
SA
500
5, A
ustr
alia
.
BS
outh
Aus
tral
ian
Res
earc
h an
d D
evel
opm
ent
Inst
itute
(A
quat
ic S
cien
ces)
, PO
Box
120
, Hen
ley
Bea
ch, S
A 5
024,
Aus
tral
ia.
CC
orre
spon
ding
aut
hor.
Em
ail:
heid
i.alle
way
@ad
elai
de.e
du.a
u
T
able
S1.
T
axon
omic
gro
ups
used
for
calc
ulat
ing
mea
n tr
ophi
c le
vel,
incl
udin
g hi
stor
ical
com
mon
nam
es, m
isap
plie
d or
no
long
er u
sed
spec
ies
syno
nym
s, tr
ophi
c le
vels
(TL
) an
d st
anda
rd e
rror
of
the
TL
(s.e
.), a
nd e
xpla
nati
ons
of a
ny a
ssum
ptio
ns o
r de
riva
tion
s fo
r th
e T
Ls
used
Fu
nctio
nal g
roup
or
spe
cie
s C
om
mo
n na
me
P
revi
ous
ly u
sed
m
isa
pp
lied
na
me
s T
rop
hic
leve
l (T
L)
Ass
um
ptio
ns a
nd c
om
me
nts
Hal
ioti
s ru
bra
and
Hal
ioti
s la
evig
ata
Ab
alo
ne
2
.0
TL
for
Hal
ioti
s ru
bra
ava
ilab
le th
roug
h S
ea
Aro
und
Us
Pro
ject
. T
hunn
us a
lalu
nga
A
lba
core
tuna
4.3
1 ±
0.7
3
Arr
ipis
geo
rgia
nus
Aus
tra
lian
herr
ing
T
om
my
Ro
ugh,
Ru
ff 4
.31
± 0
.76
Arr
ipis
trut
tace
a A
ustr
alia
n sa
lmo
n
Sa
lmo
n, A
rrip
is
trut
tace
us, A
rrip
is tr
utta
4
.20
± 0
.70
C
entr
ober
yx a
ffin
is
Big
ht r
ed
fish
R
ed
sna
pp
er
3.8
1 ±
0.5
9
Aca
ntho
pagr
us b
utch
eri
Bla
ck b
rea
m
3
.47
± 0
.53
P
ortu
nus
arm
atus
B
lue
Cra
b
Por
tunu
s pe
lagi
cus
2.6
0 T
L fo
r B
rach
yura
ava
ilab
le th
roug
h S
ea
Aro
und
Us
Pro
ject
. Sc
ombe
r au
stra
lasi
cus
Blu
e m
ack
ere
l
4.2
± 0
.74
2626
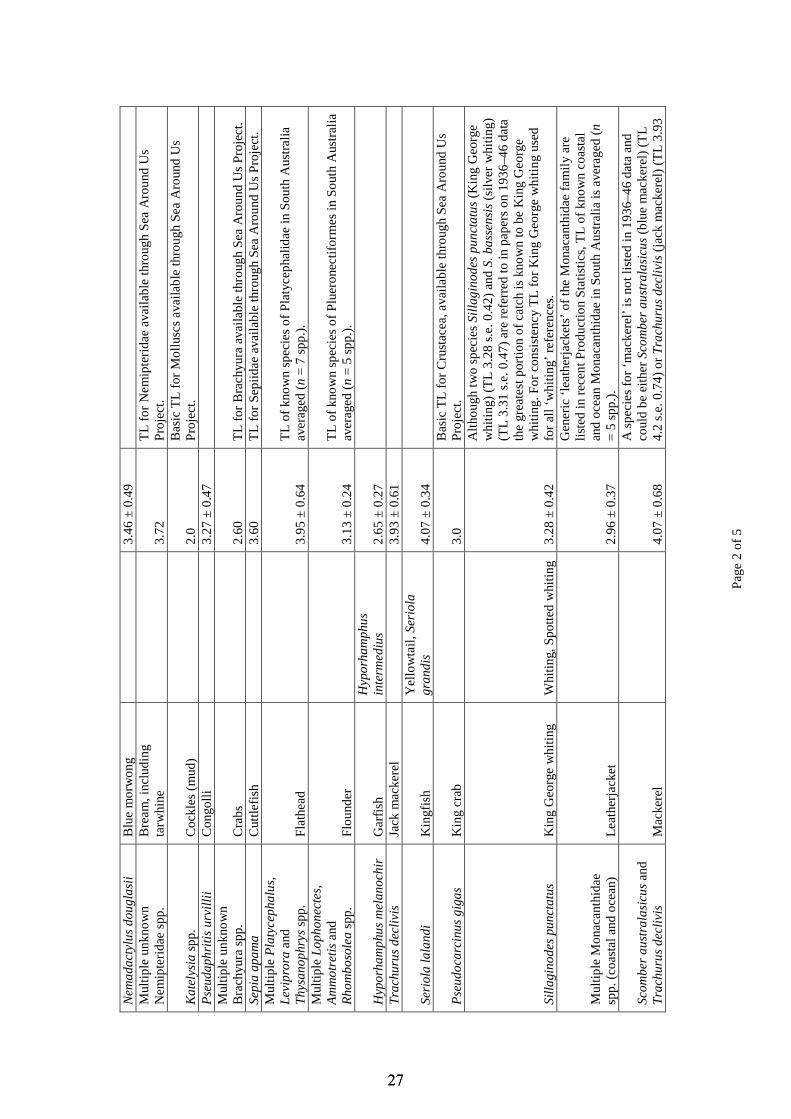
Pa
ge 2
of 5
Nem
adac
tylu
s do
ugla
sii
Blu
e m
orw
on
g
3
.46
± 0
.49
M
ultip
le u
nkn
ow
n N
em
ipte
rid
ae
sp
p.
Bre
am
, in
clud
ing
tarw
hine
3.7
2 T
L fo
r N
em
ipte
rid
ae
ava
ilab
le th
roug
h S
ea
Aro
und
Us
Pro
ject
.
Kat
elys
ia s
pp
. C
ock
les
(mud
)
2.0
B
asi
c T
L fo
r M
ollu
scs
ava
ilab
le th
rou
gh S
ea
Aro
und
Us
Pro
ject
. P
seud
aphr
itis
urv
illi
i C
on
golli
3.2
7 ±
0.4
7
Mul
tiple
un
kno
wn
Bra
chyu
ra s
pp
. C
rab
s
2.6
0 T
L fo
r B
rach
yura
ava
ilab
le th
roug
h S
ea
Aro
und
Us
Pro
ject
. Se
pia
apam
a C
uttle
fish
3.6
0 T
L fo
r S
ep
iida
e a
vaila
ble
thro
ugh
Se
a A
rou
nd U
s P
roje
ct.
Mul
tiple
Pla
tyce
phal
us,
Lev
ipro
ra a
nd
Thy
sano
phry
s sp
p.
Fla
the
ad
3.9
5 ±
0.6
4 T
L o
f kno
wn
sp
eci
es
of P
laty
cep
halid
ae
in S
ou
th A
ustr
alia
a
vera
ged
(n =
7 s
pp
.).
Mul
tiple
Lop
hone
ctes
, A
mm
otre
tis
and
R
hom
boso
lea
spp
. F
lou
nde
r
3.1
3 ±
0.2
4 T
L o
f kno
wn
sp
eci
es
of P
lue
rone
ctifo
rme
s in
So
uth
Aus
tra
lia
ave
rage
d (n
= 5
sp
p.)
.
Hyp
orha
mph
us m
elan
ochi
r G
arf
ish
H
ypor
ham
phus
in
term
ediu
s 2
.65
± 0
.27
T
rach
urus
dec
livi
s Ja
ck m
ack
ere
l
3.9
3 ±
0.6
1
Seri
ola
lala
ndi
Kin
gfis
h
Ye
llow
tail,
Ser
iola
gr
andi
s 4
.07
± 0
.34
Pse
udoc
arci
nus
giga
s K
ing
cra
b
3
.0
Ba
sic
TL
for
Cru
sta
cea
, a
vaila
ble
thro
ugh
Se
a A
rou
nd U
s P
roje
ct.
Sill
agin
odes
pun
ctat
us
Kin
g G
eo
rge
wh
iting
W
hitin
g, S
po
tted
whi
ting
3
.28
± 0
.42
Alth
oug
h tw
o s
pe
cie
s Sill
agin
odes
pun
ctat
us (
Kin
g G
eo
rge
w
hiti
ng)
(T
L 3
.28
s.e
. 0
.42
) an
d
S. b
asse
nsis
(si
lve
r w
hiti
ng
) (T
L 3
.31
s.e
. 0
.47
) a
re r
efe
rred
to in
pa
pe
rs o
n 1
936
–46
da
ta
the
gre
ate
st p
ort
ion
of c
atc
h is
kno
wn
to b
e K
ing
Ge
org
e
wh
itin
g. F
or
cons
iste
ncy
TL
for
Kin
g G
eo
rge
wh
itin
g us
ed
fo
r a
ll ‘w
hiti
ng’
re
fere
nce
s.
Mul
tiple
Mo
naca
nthi
da
e
spp
. (c
oa
sta
l and
oce
an)
Le
ath
erj
ack
et
2
.96
± 0
.37
Ge
neri
c ‘le
ath
erj
ack
ets
’ of t
he M
ona
cant
hid
ae
fam
ily a
re
liste
d in
re
cen
t Pro
duc
tion
Sta
tistic
s, T
L o
f kn
ow
n c
oa
sta
l a
nd o
cea
n M
ona
can
thid
ae
in S
out
h A
ustr
alia
is a
vera
ged
(n
= 5
sp
p.)
.
Scom
ber
aust
rala
sicu
s a
nd
Tra
chur
us d
ecli
vis
Ma
cke
rel
4
.07
± 0
.68
A s
pe
cie
s fo
r ‘m
ack
ere
l’ is
no
t lis
ted
in 1
93
6–
46
da
ta a
nd
coul
d b
e e
ithe
r Scom
ber
aust
rala
sicu
s (b
lue
ma
cke
rel)
(T
L 4
.2 s
.e.
0.7
4)
or Tr
achu
rus
decl
ivis
(ja
ck m
ack
ere
l) (
TL
3.9
3
2727

Pa
ge 3
of 5
s.e
. 0
.61
). A
ltho
ugh S
. aus
tral
asic
us is
re
po
rte
d in
sm
all
qua
ntiti
es
in r
ece
nt P
rod
uctio
n S
tatis
tics
the
TL
of b
oth
p
oss
ible
sp
eci
es
is a
vera
ged
for
all
refe
renc
es
to ‘m
ack
ere
l’ fo
r co
nsis
tenc
y.
Dac
tylo
phor
a ni
gric
ans
and
N
emad
acty
lus
doug
lasi
i M
orw
on
g
3
.18
± 0
.44
‘Mo
rwo
ng’ i
s lis
ted
in r
ece
nt P
rod
uctio
n S
tatis
tics
with
tw
o
spe
cie
s na
me
s p
rovi
de
d
Dac
tylo
phor
a ni
gric
ans
(dus
ky
mo
rwo
ng)
(TL
2.8
9 s
.e.
0.3
8)
and
N
emad
acty
lus
doug
lasi
i (b
lue
mo
rwo
ng)
(T
L 3
.46
s.e
. 0.4
9).
The
re is
no
d
ete
rmin
atio
n o
f w
hic
h sp
eci
es
cont
rib
ute
s w
hat c
om
po
nen
t o
f a c
atc
h a
nd t
he T
L o
f bo
th s
pe
cie
s is
ave
rage
d.
Ald
rich
etta
fors
teri
, Liz
a ar
gent
ea, U
pene
icht
hys
vlam
ingi
i a
nd M
ugil
ce
phal
us
Mul
let
Upe
neic
hthy
s po
rosu
s a
nd U
pene
icht
hys
line
atus
2
.75
± 0
.33
Thr
ee
sp
eci
es
of
mu
llet a
re li
ste
d in
19
36
–46
da
ta a
nd
‘mul
let’
ma
y a
lso
re
fer
to Ald
rich
etta
fors
teri
(ye
llow
-eye
m
ulle
t),
this
sp
eci
es
has
the
refo
re b
ee
n in
clud
ed
, T
L o
f all
four
sp
eci
es
ave
rage
d fo
r h
isto
rica
l re
fere
nce
s to
‘mu
llet’.
Arg
yros
omus
japo
nicu
s M
ullo
wa
y B
utte
rfis
h, Sc
iaen
a an
tarc
tica
4
.48
± 0
.72
M
usse
ls
2
.0
Ba
sic
TL
for
Mo
llusc
s a
vaila
ble
thro
ugh
Se
a A
roun
d U
s P
roje
ct.
Oct
opus
sp
p.
Oct
op
us
3
.58
TL
for
Oct
op
od
a a
vaila
ble
thro
ugh
Se
a A
rou
nd U
s P
roje
ct.
Mul
tiple
La
bri
da
e s
pp
. P
arr
otfi
sh
3
.46
± 0
.50
Ge
neri
c ‘p
arr
otfi
sh’ o
f the
La
bri
da
e fa
mily
are
list
ed
in t
he
rece
nt P
rod
uctio
n S
tatis
tics.
The
TL
of k
now
n co
ast
al a
nd
oce
an
Lab
rid
ae
sp
p.
in S
out
h A
ustr
alia
is a
vera
ged
(N
= 1
0
spp
.)
Don
ax d
elto
ides
P
ipi
2
.0
Ba
sic
TL
for
Mo
llusc
s a
vaila
ble
thro
ugh
Se
a A
roun
d U
s P
roje
ct.
Mul
tiple
un
kno
wn
Ra
jifo
rme
sp
p.
Ra
ys &
ska
tes
3
.61
TL
for
Ra
jifo
rmes
ava
ilab
le th
roug
h S
ea
Aro
und
Us
Pro
ject
.
Pin
na b
icol
or
Ra
zor
fish
2.0
B
asi
c T
L fo
r M
ollu
scs
ava
ilab
le th
rou
gh S
ea
Aro
und
Us
Pro
ject
. U
pene
icht
hys
vlam
ingi
i R
ed
mul
let
3
.46
± 0
.54
Jasu
s ed
war
dsii
R
ock
lob
ste
r C
rayf
ish,
Jasu
s la
land
ii
3.5
0
TL
for
Jasu
s no
vaeh
olla
ndia
e o
nly
ava
ilab
le th
roug
h S
ea
A
rou
nd U
s P
roje
ct, T
L o
f J. n
ovae
holl
andi
ae a
pp
lied
as
surr
oga
te T
L fo
r J. e
dwar
dsii
. O
vali
pes
aust
rali
ensi
s S
and
cra
bs
2
.60
TL
for
Bra
chyu
ra a
vaila
ble
thro
ugh
Se
a A
rou
nd U
s P
roje
ct.
Sard
inop
s sa
gax
Sa
rdin
e
Pilc
hard
, Sar
dini
a 2
.43
± 0
.12
2828

Pa
ge 4
of 5
neop
ilch
ards
Pe
ctin
ida
e s
pp
. S
callo
ps
2
.0
TL
for
Pe
ctin
ida
e s
pp
. a
vaila
ble
thro
ugh
Se
a A
roun
d U
s P
roje
ct.
Mul
tiple
sp
eci
es
Sha
rk
4
.31
± 0
.53
Sp
eci
es
of s
hark
are
no
t lis
ted
in 1
93
6–
46 d
ata
. ‘S
we
et
will
iam
’ (gu
mm
y sh
ark
) a
nd ‘s
hark
’ are
re
po
rte
d a
gain
st,
bu
t ne
ver
in th
e s
am
e y
ea
r. I
t is
the
refo
re a
ssu
me
d th
at i
n th
e
yea
rs r
ep
ort
ing
und
er
‘sha
rk’ a
ma
jori
ty o
f the
ca
tch
wa
s in
fa
ct s
we
et
will
iam
, a
ltho
ugh
it is
like
ly t
hat l
arg
e q
uant
itie
s o
f oth
er
spe
cie
s w
ere
als
o m
ark
ete
d.
Fo
r co
nsis
tenc
y a
cro
ss
time
, w
itho
ut k
now
ing
all
spe
cie
s ca
ugh
t, th
e T
L fo
r sw
ee
t w
illia
m (
TL
4.3
1 s
.e.
0.5
3)
is a
pp
lied
to a
ll re
fere
nce
s o
f ‘s
hark
’. T
his
has
negl
igib
le im
pa
ct o
n o
vera
ll T
L a
s 4
.31
s.e
. 0
.53
is a
re
lativ
e m
ed
ian
for
oth
er
sha
rk s
pe
cie
s, e
.g.
Car
char
hinu
s sp
p.
(bro
nze
wh
ale
r) (
TL
4.4
9 s
.e. 0
.76
) a
nd
Gal
eorh
inus
gal
eus
scho
ol s
hark
(T
L 4
.21
s.e
. 0
.65
).
Kat
suw
onus
pel
amis
S
kip
jack
Tun
a
3
.75
± 0
.61
C
hrys
ophr
ys a
urat
us
Sna
pp
er
Pag
rus
aura
tus
3.3
2 ±
0.4
7
Sphy
raen
a no
vaeh
olla
ndia
e S
noo
k
4.5
0 ±
0.8
0
Thu
nnus
mac
coyi
i S
out
hern
blu
efin
tuna
3.9
3 ±
0.5
3
Alth
oug
h th
ree
sp
eci
es
of t
una
T
hunn
us m
acco
yii
(So
uthe
rn
Blu
efin
Tun
a)
(TL
3.9
3 s
.e. 0
.53
),
Thu
nnus
ala
lung
a (A
lba
core
) (T
L 4
.31
s.e
. 0.7
3),
and
K
atsu
won
us p
elam
is
(Ski
pja
ck tu
na)
(TL
3.7
5 s.
e.
0.6
1)
are
re
ferr
ed
to in
pa
pe
rs
on
19
36
–46
da
ta th
e s
tatis
tics
mo
re o
fte
n lis
t ‘b
lue
fin’ o
r ‘s
out
hern
blu
efin
’ qua
ntiti
es.
Fo
r co
nsis
tenc
y T
L fo
r so
uthe
rn b
lue
fin t
una
use
d fo
r a
ll ‘tu
na’ r
efe
renc
es.
Se
piot
euth
is a
ustr
alis
S
out
hern
ca
lam
ary
S
qui
d
4.1
3 T
L fo
r T
eut
hid
a a
vaila
ble
thro
ugh
Se
a A
rou
nd U
s P
roje
ct.
Oct
opus
sp
p.
and
Sepi
a ap
ama
S
qui
d,
oct
op
us &
cu
ttle
fish
3.7
7 A
ggr
ega
te o
f thr
ee
TLs
. P
elat
es o
ctol
inea
tus
S
trip
ed
pe
rch
2
.59
± 0
.14
Mul
tiple
Sco
rpis
sp
p.
Sw
ee
p
3
.32
± 0
.41
Scor
pis
geor
gian
us is
list
ed
in 1
93
6–3
8 d
ata
; ho
we
ver,
ge
neri
c sw
ee
p o
f the
Sco
rpid
ida
e fa
mily
are
list
ed
in r
ece
nt
Pro
duc
tion
Sta
tistic
s. F
or
cons
iste
ncy
TL
of k
now
n
Scor
pis
spp
. in
So
uth
Au
stra
lia is
ave
rage
d (
n =
3 s
pp.
).
Mus
telu
s an
tarc
ticu
s S
we
et W
illia
m
4
.31
± 0
.53
Gu
mm
y sh
ark
P
seud
ocar
anx
geor
gian
us
Tre
vally
3.6
4 ±
0.5
8 T
reva
lly is
the
co
mm
on
nam
e f
or
Pse
udoc
aran
x ge
orgi
anus
2929
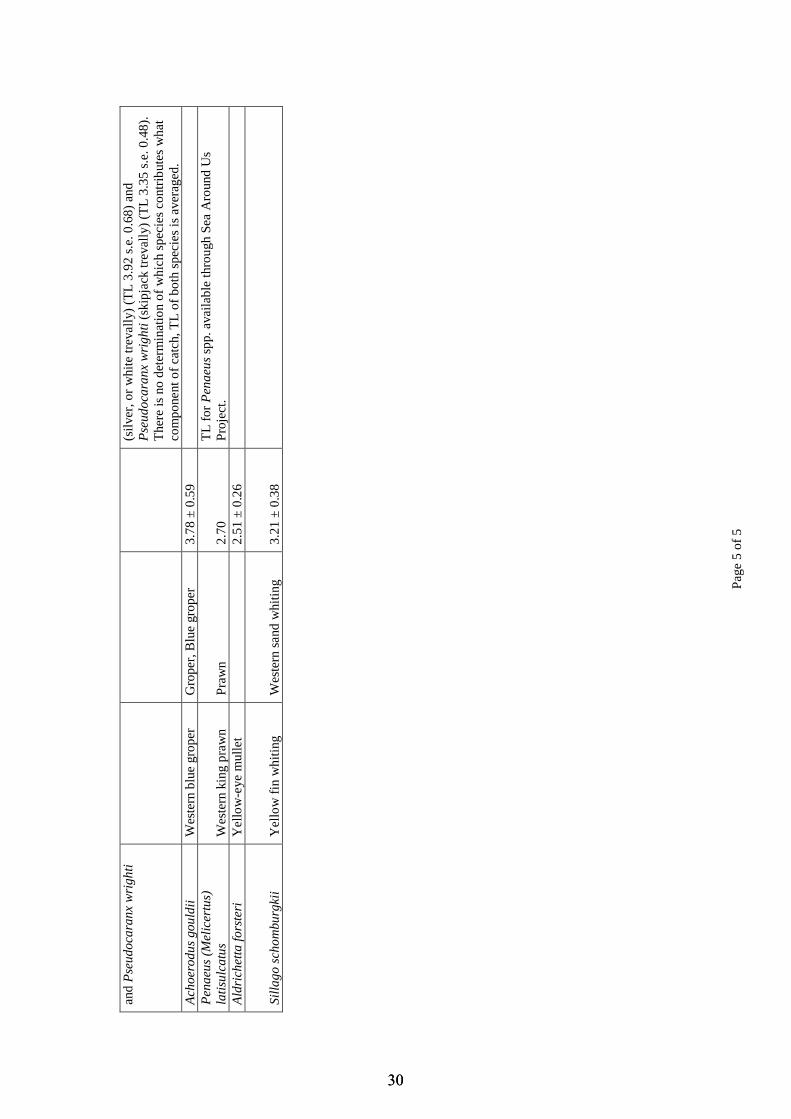
Pa
ge 5
of 5
and
Pse
udoc
aran
x w
righ
ti
(silv
er,
or
whi
te tr
eva
lly)
(TL
3.9
2 s
.e. 0
.68
) a
nd
Pse
udoc
aran
x w
righ
ti (
skip
jack
tre
vally
) (T
L 3
.35
s.e
. 0.4
8).
T
here
is n
o d
ete
rmin
atio
n o
f w
hic
h sp
eci
es
cont
rib
ute
s w
ha
t co
mp
one
nt o
f ca
tch,
TL
of b
oth
sp
eci
es
is a
vera
ged
. A
choe
rodu
s go
uldi
i W
est
ern
blu
e g
rop
er
Gro
pe
r, B
lue
gro
pe
r 3
.78
± 0
.59
P
enae
us (
Mel
icer
tus)
la
tisu
lcat
us
We
ste
rn k
ing
pra
wn
P
raw
n
2.7
0 T
L fo
r P
enae
us s
pp.
ava
ilab
le th
rou
gh S
ea
Aro
und
Us
Pro
ject
. A
ldri
chet
ta fo
rste
ri
Ye
llow
-eye
mul
let
2
.51
± 0
.26
Sill
ago
scho
mbu
rgki
i Y
ello
w f
in w
hiti
ng
We
ste
rn s
and
whi
ting
3
.21
± 0
.38
3030

Chapter 3: ‘Neo-Europe’ and its ecological
consequences: the example of systematic degradation in
Australia’s inland fisheries
3.1 Preface
Societal expectations can underpin the nature and scale of human activities and, as a result,
the influence they have on the environment. The colonisation of new lands by European
settlers established behavioural patterns that provide an explanation for change in
ecosystems, such as the intentional introduction of plants and animals that are now
widespread invasive species. In this chapter historical fish market data are used to illustrate
that inland fisheries species were traditionally favoured by European settlers. Inland
species were highly popular and large quantities were supplied to market, however, their
popularity contributed to their overexploitation and eventual deterioration; a pattern that
mirrors a demand driven transition from inland to marine-based fisheries in Europe
Consequently, the chapter proposes the systematic overexploitation of inland fisheries
species in the ‘neo-Europes’ was, in part, predicated on the societal expectations of
European settlers. This chapter has been submitted to Biology Letters as an opinion piece,
based on invitation, with the co-authors Bronwyn M. Gillanders and Sean D. Connell.
3131

3.2 Statement of authorship
Principal Author
Name of Principal Author (Candidate) Heidi K. Alleway
Contribution to the Paper
Conceptualised and designed the research and model used, collated and analysed the data,
interpreted the results and wrote and edited the manuscript.
Overall percentage (%) 80%
Signature
Date 24/07/2015
Co-Author Contributions
By signing the Statement of Authorship, each author certifies that:
iv. the candidate’s stated contribution to the publication is accurate (as detailed above);
v. permission is granted for the candidate in include the publication in the thesis; and
vi. the sum of all co-author contributions is equal to 100% less the candidate’s stated contribution.
Name of Co-Author Bronwyn M. Gillanders
Contribution to the Paper Assisted with the interpretation of the model and results, and editing the manuscript.
Signature
Date 14/07/2015
Name of Co-Author Sean D. Connell
Contribution to the Paper Assisted with the interpretation of the model and results, and editing the manuscript.
Signature
Date 15/07/2015
Title of Paper ‘Neo-Europe’ and its ecological consequence: the example of systematic degradation in
Australia’s inland fisheries
Publication Status Published Accepted for Publication
Submitted for Publication Publication Style
Publication Details Biology Letters, submitted 07/09/2015
3232
‘Neo-Europe’ and its ecological consequences: the
example of systematic degradation in Australia’s inland
fisheries
Heidi K. Alleway, Bronwyn M. Gillanders and Sean D. Connell
Southern Seas Ecology Laboratories, School of Biological Sciences, University of
Adelaide, South Australia, 5005, Australia
3.3 Abstract
The antiquity of human impact on ecosystems is increasingly understood, though the
arrival of settlers to new lands remains a defining period. Colonisation of the ‘neo-
Europes’, a reference from the discipline of history, precipitated changes in aquatic
ecosystems through modification of waterways and introductions of non-native species.
We considered historical fisheries records and fish market data from South Australia
(1900-1946) against contemporary production statistics (1987-2011) and described
patterns of change in the species fished over time. Native inland species historically
contributed large quantities to market but have deteriorated such that fishing is now limited
and conservation regulations exist. This pattern mirrors the demand-driven transition from
freshwater to marine fisheries in Europe, hence, we propose this pattern was predicated on
societal expectations and that European settlement led to systematic overexploitation and
degradation of native inland fisheries species in Australia, reflecting a further consequence
of neo-European colonisation to ecology. Accurate interpretation of ecological change, its
drivers and implications can support appropriate management intervention. Models from
alternative disciplines, such as neo-Europe, can enable these descriptions at regional and
global scales.
3333

3.4 Introduction
Human domination of ecosystems after the arrival of people to new lands often set the
foundation for the ecosystems we study today (Erlandson and Rick, 2010). Change
induced by human activity has been pervasive, for example, the effects of overfishing have
been widespread and protracted (Jackson et al., 2001). Between 1820 and 1930, more than
50 million European people migrated to distant colonies – the United States, Canada,
Australia, New Zealand, Argentina, Uruguay – which have been called the ‘neo-Europes’
(Crosby, 1986). When settlers arrived they initiated unprecedented changes in ecosystems,
including the intentional introduction of exotic species (Piper and Sandlos, 2007, Lightfoot
et al., 2013, Crawford and Muir, 2008) to “renovate the biota” (Osborne, 2001). The
behaviours of settlers have been shown to have been vested in their ability to acclimatise to
new surroundings (Piper and Sandlos, 2007, Crosby, 1986). For example, formal
acclimatisation societies were established to contribute ‘colonial science’ (Osborne, 2001)
toward the successful establishment of plants and animals, but these societies introduced
exotic diseases and species (Moorhouse, 1938).
Where ecosystems have been irreparably altered ‘Anthropocene Baselines’ may
provide a more representative basis for management (Keller Kopf et al., 2015). Neo-
Europe is a model for widespread European colonisation of geographically distinct areas
across the world, the behaviours that settlers displayed, and the ecological changes they
initiated (Crosby, 1986). We considered changes to fisheries in South Australia, from 1900
to 2011, and describe the influence of societal expectations on native inland fisheries
species, which mirrored those that occurred in Europe. The reference neo-Europe (Crosby,
1986), well known in social sciences is little known in ecological sciences, can assist
description of why ecosystems look and function the way they do today. Its wider use in
ecology could provide a more rigorous basis for evaluating change associated with
European agency (Lightfoot et al., 2013), reconciliation of the ongoing disparity between
history and ecology (Szabó and Hédl, 2011), and identification of appropriate baselines
and management in human-dominated ecosystems (Keller Kopf et al., 2015).
3434
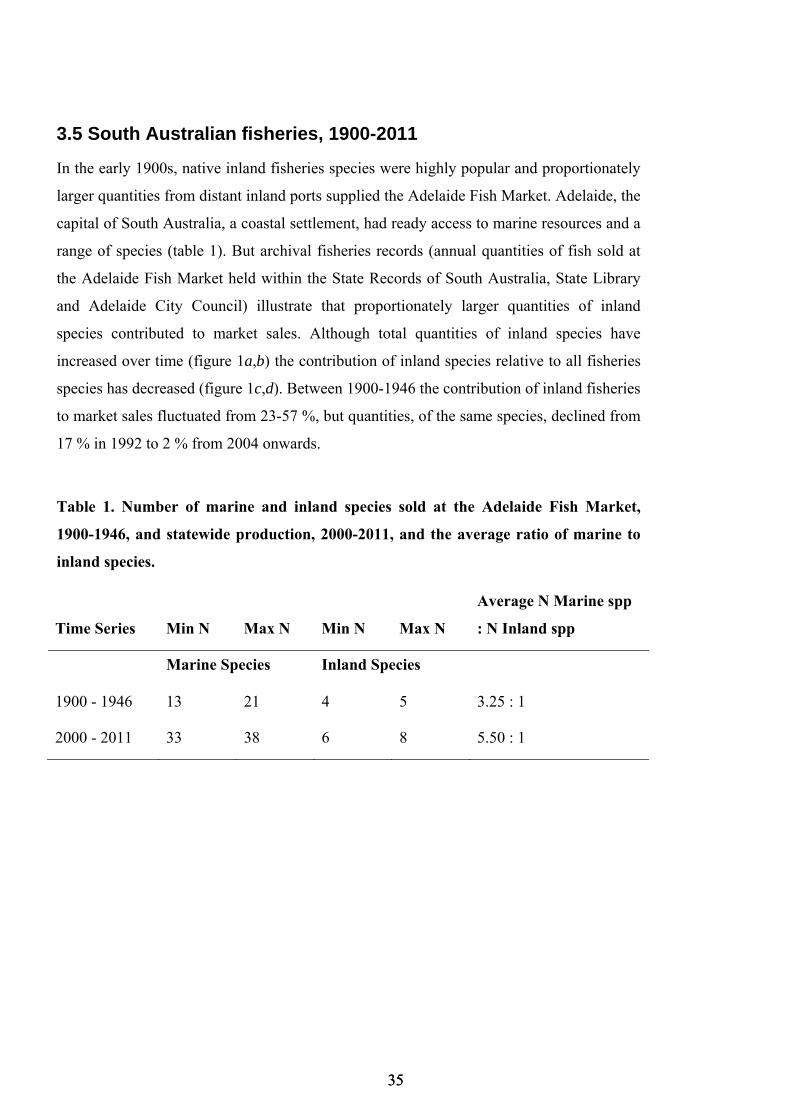
3.5 South Australian fisheries, 1900-2011
In the early 1900s, native inland fisheries species were highly popular and proportionately
larger quantities from distant inland ports supplied the Adelaide Fish Market. Adelaide, the
capital of South Australia, a coastal settlement, had ready access to marine resources and a
range of species (table 1). But archival fisheries records (annual quantities of fish sold at
the Adelaide Fish Market held within the State Records of South Australia, State Library
and Adelaide City Council) illustrate that proportionately larger quantities of inland
species contributed to market sales. Although total quantities of inland species have
increased over time (figure 1a,b) the contribution of inland species relative to all fisheries
species has decreased (figure 1c,d). Between 1900-1946 the contribution of inland fisheries
to market sales fluctuated from 23-57 %, but quantities, of the same species, declined from
17 % in 1992 to 2 % from 2004 onwards.
Table 1. Number of marine and inland species sold at the Adelaide Fish Market,
1900-1946, and statewide production, 2000-2011, and the average ratio of marine to
inland species.
Time Series Min N Max N Min N Max N
Average N Marine spp
: N Inland spp
Marine Species Inland Species
1900 - 1946 13 21 4 5 3.25 : 1
2000 - 2011 33 38 6 8 5.50 : 1
3535

Figure 1. Quantities from inland fisheries (a) sold at the Adelaide Fish Market, 1900-
1946 and (b) statewide production, 1987-2011; the contribution of fisheries (c) to total
sales and (d) total production; and individual quantities of native (N) and introduced
species (I) to (e) market sales, and (f) fisheries production.
Historical governmental reports and photographs attest to the popularity of native
inland fisheries species, and that this popularity influenced their overexploitation and
degradation. Murray cod (Maccullochella peelii peelii) historically supplied large
quantities to market (figure 1e, figure 2a), but in 1996 the species was listed as critically
endangered on the ‘Red List’ of Threatened Species and has recently supported a spatially
3636
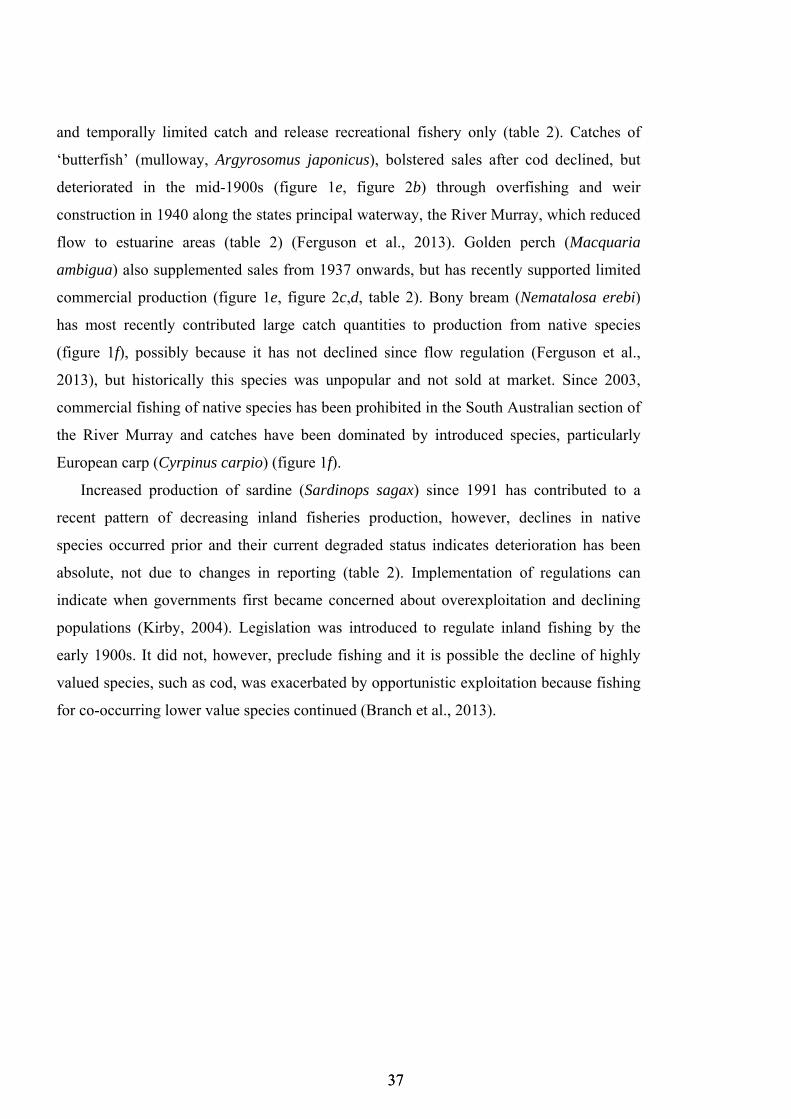
and temporally limited catch and release recreational fishery only (table 2). Catches of
‘butterfish’ (mulloway, Argyrosomus japonicus), bolstered sales after cod declined, but
deteriorated in the mid-1900s (figure 1e, figure 2b) through overfishing and weir
construction in 1940 along the states principal waterway, the River Murray, which reduced
flow to estuarine areas (table 2) (Ferguson et al., 2013). Golden perch (Macquaria
ambigua) also supplemented sales from 1937 onwards, but has recently supported limited
commercial production (figure 1e, figure 2c,d, table 2). Bony bream (Nematalosa erebi)
has most recently contributed large catch quantities to production from native species
(figure 1f), possibly because it has not declined since flow regulation (Ferguson et al.,
2013), but historically this species was unpopular and not sold at market. Since 2003,
commercial fishing of native species has been prohibited in the South Australian section of
the River Murray and catches have been dominated by introduced species, particularly
European carp (Cyrpinus carpio) (figure 1f).
Increased production of sardine (Sardinops sagax) since 1991 has contributed to a
recent pattern of decreasing inland fisheries production, however, declines in native
species occurred prior and their current degraded status indicates deterioration has been
absolute, not due to changes in reporting (table 2). Implementation of regulations can
indicate when governments first became concerned about overexploitation and declining
populations (Kirby, 2004). Legislation was introduced to regulate inland fishing by the
early 1900s. It did not, however, preclude fishing and it is possible the decline of highly
valued species, such as cod, was exacerbated by opportunistic exploitation because fishing
for co-occurring lower value species continued (Branch et al., 2013).
3737
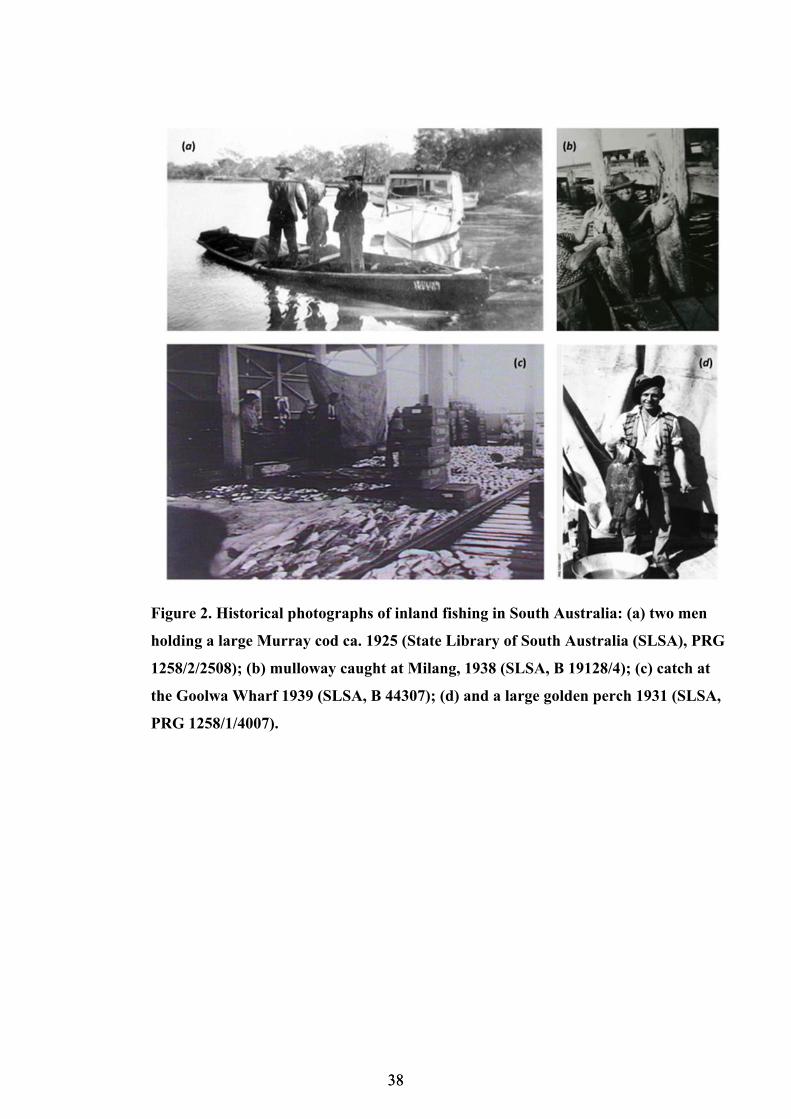
Figure 2. Historical photographs of inland fishing in South Australia: (a) two men
holding a large Murray cod ca. 1925 (State Library of South Australia (SLSA), PRG
1258/2/2508); (b) mulloway caught at Milang, 1938 (SLSA, B 19128/4); (c) catch at
the Goolwa Wharf 1939 (SLSA, B 44307); (d) and a large golden perch 1931 (SLSA,
PRG 1258/1/4007).
3838

Tab
le 2
. L
arge
st p
er a
nn
um
qu
anti
ties
sol
d at
th
e A
del
aid
e F
ish
Mar
ket
, 19
00-1
946,
or
cau
ght
stat
ewid
e, 1
987-
2011
, of
nat
ive
and
intr
odu
ced
inla
nd
sp
ecie
s in
Sou
th A
ust
rali
a, c
urr
ent
regu
lati
on o
r m
anag
emen
t, a
nd
his
tori
cal a
nec
dot
es r
egar
din
g p
ast
stat
us.
Lar
gest
qu
anti
ty
(1,0
00 k
g)
Yea
r of
larg
est
qu
anti
ty
Cu
rren
t st
atu
s
(fis
her
ies
and
con
serv
atio
n)
Exa
mp
le h
isto
rica
l qu
alit
ativ
e st
atem
ents
reg
ard
ing
spec
ies
(ad
dit
ion
al s
tate
men
ts in
su
pp
lem
enta
ry m
ater
ial)
Nat
ive
Sp
ecie
s
Aca
ntho
pagr
us
butc
heri
(bre
am, b
lack
brea
m)
32.0
1 19
02
Com
mer
cial
fis
hing
perm
itte
d an
d oc
curr
ing.
Rec
reat
iona
l fis
hing
perm
itte
d, w
ith
size
and
bag
lim
its.
Insp
ecto
r F
urle
r re
port
s th
at b
ream
fis
hing
at N
oarl
unga
in th
e
Onk
apar
inga
Riv
er h
as b
een
exce
ptio
nall
y go
od, a
nd in
one
wee
k
over
2,0
00 f
ish
wer
e ta
ken
by a
few
ang
lers
. Thi
s st
ream
is a
t
pres
ent s
plen
didl
y st
ocke
d ab
ove
the
susp
ensi
on b
ridg
e, w
here
on
calm
day
s la
rge
shoa
ls c
an b
e se
en (
1914
).
Eua
stac
us a
rmat
us
(Mur
ray
cray
fish
) 0.
76
1907
Ful
ly p
rote
cted
spe
cies
(sta
te le
gisl
atio
n), m
ust b
e
retu
rned
to th
e w
ater
.
Lob
ster
s, e
tc.—
Gre
at f
alli
ng o
ff f
rom
Mor
gan
to th
e co
rner
this
year
, alt
houg
h a
num
ber
wer
e ca
ught
hig
her
up th
e ri
ver.
Lob
ster
s
gene
rall
y ap
pear
in M
ay a
nd g
o aw
ay in
Aug
ust;
they
are
not
sen
t
to m
arke
t; p
erso
nall
y pr
efer
them
to s
alt-
wat
er lo
bste
rs (
1903
).
3939
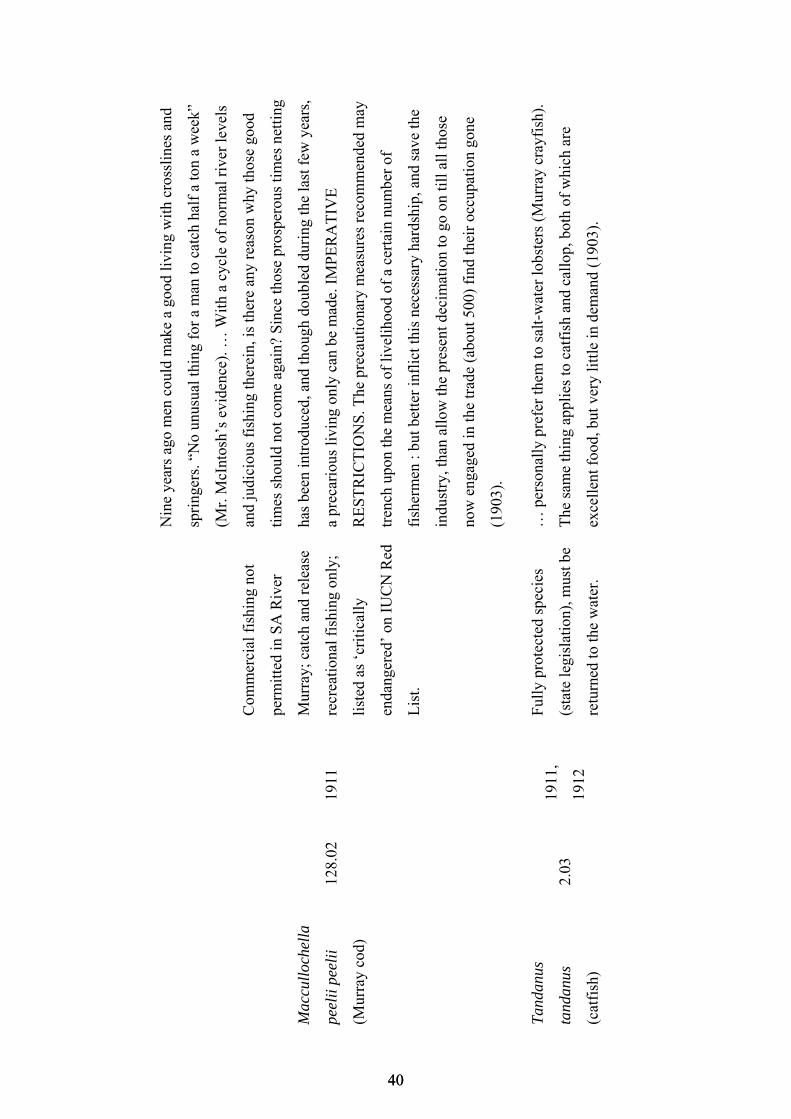
Mac
cull
oche
lla
peel
ii p
eeli
i
(Mur
ray
cod)
128.
02
1911
Com
mer
cial
fis
hing
not
perm
itte
d in
SA
Riv
er
Mur
ray;
cat
ch a
nd r
elea
se
recr
eati
onal
fis
hing
onl
y;
list
ed a
s ‘c
riti
call
y
enda
nger
ed’
on I
UC
N R
ed
Lis
t.
Nin
e ye
ars
ago
men
cou
ld m
ake
a go
od li
ving
wit
h cr
ossl
ines
and
spri
nger
s. “
No
unus
ual t
hing
for
a m
an to
cat
ch h
alf
a to
n a
wee
k”
(Mr.
McI
ntos
h’s
evid
ence
). …
Wit
h a
cycl
e of
nor
mal
riv
er le
vels
and
judi
ciou
s fi
shin
g th
erei
n, is
ther
e an
y re
ason
why
thos
e go
od
tim
es s
houl
d no
t com
e ag
ain?
Sin
ce th
ose
pros
pero
us ti
mes
net
ting
has
been
intr
oduc
ed, a
nd th
ough
dou
bled
dur
ing
the
last
few
yea
rs,
a pr
ecar
ious
livi
ng o
nly
can
be m
ade.
IM
PE
RA
TIV
E
RE
ST
RIC
TIO
NS
. The
pre
caut
iona
ry m
easu
res
reco
mm
ende
d m
ay
tren
ch u
pon
the
mea
ns o
f li
veli
hood
of
a ce
rtai
n nu
mbe
r of
fish
erm
en :
but b
ette
r in
flic
t thi
s ne
cess
ary
hard
ship
, and
sav
e th
e
indu
stry
, tha
n al
low
the
pres
ent d
ecim
atio
n to
go
on ti
ll a
ll th
ose
now
eng
aged
in th
e tr
ade
(abo
ut 5
00)
find
thei
r oc
cupa
tion
gon
e
(190
3).
Tan
danu
s
tand
anus
(cat
fish
)
2.03
19
11,
1912
Ful
ly p
rote
cted
spe
cies
(sta
te le
gisl
atio
n), m
ust b
e
retu
rned
to th
e w
ater
.
… p
erso
nall
y pr
efer
them
to s
alt-
wat
er lo
bste
rs (
Mur
ray
cray
fish
).
The
sam
e th
ing
appl
ies
to c
atfi
sh a
nd c
allo
p, b
oth
of w
hich
are
exce
llen
t foo
d, b
ut v
ery
litt
le in
dem
and
(190
3).
4040

Arg
yros
omus
japo
nicu
s
(but
terf
ish,
mul
low
ay)
608.
99
1939
Com
mer
cial
fis
hing
perm
itte
d an
d oc
curr
ing.
Rec
reat
iona
l fis
hing
perm
itte
d, w
ith
size
and
bag
lim
its.
But
terf
ish,
the
mos
t im
port
ant f
ish
pass
ing
thro
ugh
the
Ade
laid
e
mar
ket a
lso
reac
hed
a pr
oduc
tion
pea
k no
t not
ed f
or m
any
year
s,
wit
h th
e re
sult
that
its
pric
e fe
ll to
as
low
as
1 ½
d. p
er lb
(19
39).
Pse
udap
hrit
is
urvi
llii
(con
goll
i)
50.4
4 19
42
No
man
agem
ent a
scri
bed.
For
tuna
tely
, con
goll
is a
ppea
red
agai
n in
the
Lak
es d
urin
g th
e
win
ter
and
help
ed th
e m
arke
t car
ry o
n th
roug
h th
is d
iffi
cult
seas
on. T
hese
fis
h ha
ve n
ot o
ccur
red
in b
ig n
umbe
rs th
is w
inte
r
(194
3).
Mac
quar
ia
ambi
gua
(cal
lop,
gol
den
perc
h)
299.
00
1994
Com
mer
cial
fis
hing
not
perm
itte
d in
SA
Riv
er
Mur
ray;
com
mer
cial
fish
ing
occu
rrin
g in
Lak
es
and
Coo
rong
. Rec
reat
iona
l
fish
ing
occu
rrin
g, w
ith
size
and
bag
lim
its.
The
Ade
laid
e m
arke
t reg
ular
ly r
ecei
ves
cons
ider
able
qua
ntit
ies
of
Riv
er M
urra
y fi
sh (
cod
and
call
op).
Whe
n fl
oodi
ng o
f th
e ri
ver
occu
rs th
ese
supp
lies
are
oft
en s
o la
rge
as to
ove
r-ta
x th
e m
arke
t
(194
2).
Nem
atal
osa
ereb
i 1,
172.
00
1990
C
omm
erci
al f
ishi
ng
Thi
s fi
sh is
a m
embe
r of
the
herr
ing
fam
ily,
and
is k
now
n in
New
4141
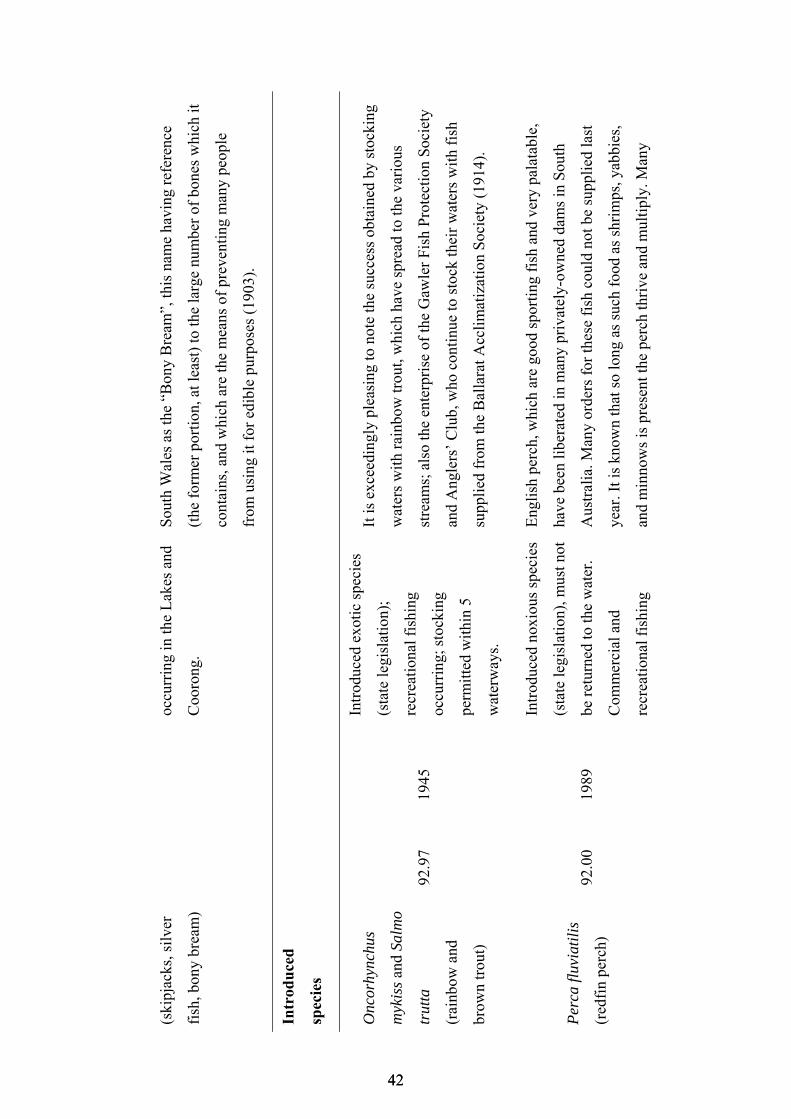
(ski
pjac
ks, s
ilve
r
fish
, bon
y br
eam
)
occu
rrin
g in
the
Lak
es a
nd
Coo
rong
.
Sou
th W
ales
as
the
“Bon
y B
ream
”, th
is n
ame
havi
ng r
efer
ence
(the
for
mer
por
tion
, at l
east
) to
the
larg
e nu
mbe
r of
bon
es w
hich
it
cont
ains
, and
whi
ch a
re th
e m
eans
of
prev
enti
ng m
any
peop
le
from
usi
ng it
for
edi
ble
purp
oses
(19
03).
Intr
odu
ced
spec
ies
Onc
orhy
nchu
s
myk
iss
and
Salm
o
trut
ta
(rai
nbow
and
brow
n tr
out)
92.9
7 19
45
Intr
oduc
ed e
xoti
c sp
ecie
s
(sta
te le
gisl
atio
n);
recr
eati
onal
fis
hing
occu
rrin
g; s
tock
ing
perm
itte
d w
ithi
n 5
wat
erw
ays.
It is
exc
eedi
ngly
ple
asin
g to
not
e th
e su
cces
s ob
tain
ed b
y st
ocki
ng
wat
ers
wit
h ra
inbo
w tr
out,
whi
ch h
ave
spre
ad to
the
vari
ous
stre
ams;
als
o th
e en
terp
rise
of
the
Gaw
ler
Fis
h P
rote
ctio
n S
ocie
ty
and
Ang
lers
’ C
lub,
who
con
tinu
e to
sto
ck th
eir
wat
ers
wit
h fi
sh
supp
lied
fro
m th
e B
alla
rat A
ccli
mat
izat
ion
Soc
iety
(19
14).
Per
ca fl
uvia
tili
s
(red
fin
perc
h)
92.0
0 19
89
Intr
oduc
ed n
oxio
us s
peci
es
(sta
te le
gisl
atio
n), m
ust n
ot
be r
etur
ned
to th
e w
ater
.
Com
mer
cial
and
recr
eati
onal
fis
hing
Eng
lish
per
ch, w
hich
are
goo
d sp
orti
ng f
ish
and
very
pal
atab
le,
have
bee
n li
bera
ted
in m
any
priv
atel
y-ow
ned
dam
s in
Sou
th
Aus
tral
ia. M
any
orde
rs f
or th
ese
fish
cou
ld n
ot b
e su
ppli
ed la
st
year
. It i
s kn
own
that
so
long
as
such
foo
d as
shr
imps
, yab
bies
,
and
min
now
s is
pre
sent
the
perc
h th
rive
and
mul
tipl
y. M
any
4242
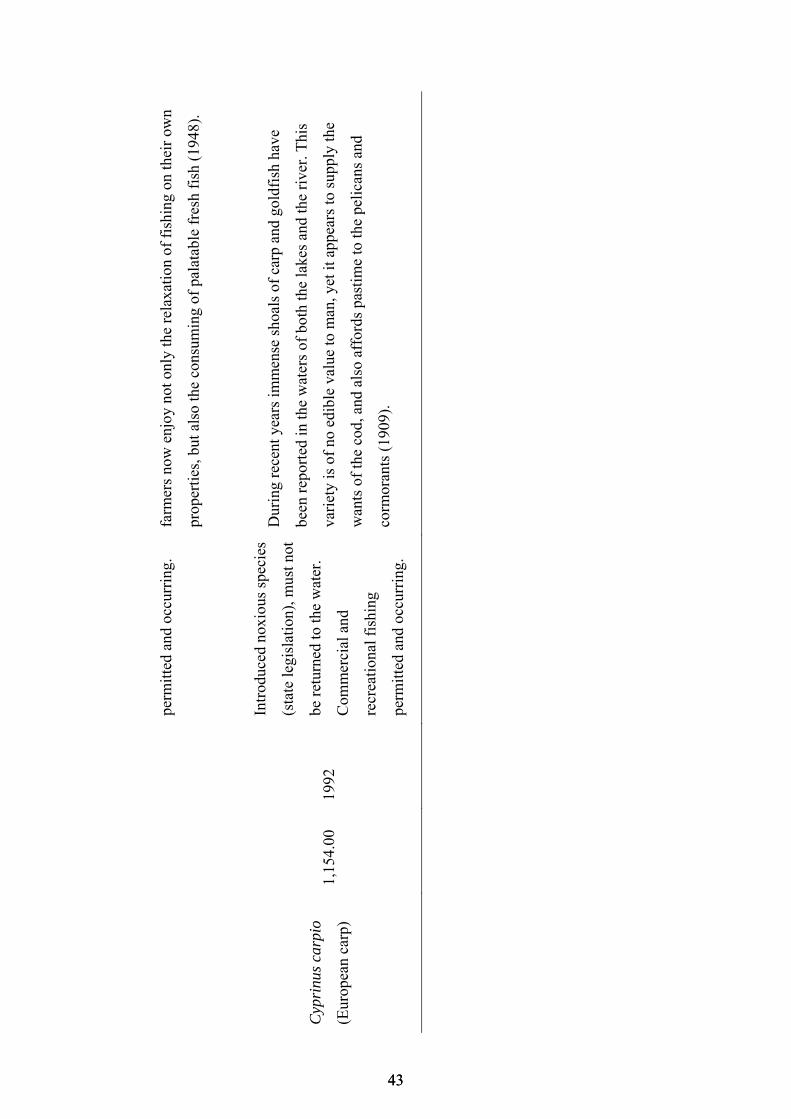
perm
itte
d an
d oc
curr
ing.
fa
rmer
s no
w e
njoy
not
onl
y th
e re
laxa
tion
of
fish
ing
on th
eir
own
prop
erti
es, b
ut a
lso
the
cons
umin
g of
pal
atab
le f
resh
fis
h (1
948)
.
Cyp
rinu
s ca
rpio
(Eur
opea
n ca
rp)
1,15
4.00
19
92
Intr
oduc
ed n
oxio
us s
peci
es
(sta
te le
gisl
atio
n), m
ust n
ot
be r
etur
ned
to th
e w
ater
.
Com
mer
cial
and
recr
eati
onal
fis
hing
perm
itte
d an
d oc
curr
ing.
Dur
ing
rece
nt y
ears
imm
ense
sho
als
of c
arp
and
gold
fish
hav
e
been
rep
orte
d in
the
wat
ers
of b
oth
the
lake
s an
d th
e ri
ver.
Thi
s
vari
ety
is o
f no
edi
ble
valu
e to
man
, yet
it a
ppea
rs to
sup
ply
the
wan
ts o
f th
e co
d, a
nd a
lso
affo
rds
past
ime
to th
e pe
lica
ns a
nd
corm
oran
ts (
1909
).
4343

3.6 Connections to Europe; fishing and ecological imperialism
Ecological changes influenced by European societal preferences are a recurring
phenomenon around the globe. When settlers arrived in the neo-Europes they precipitated
transformations of landscapes altering vegetation histories (Bjorkman and Vellend, 2010)
and introducing exotic species (Osborne, 2001). In inland aquatic ecosystems fish,
including Salmonids, were introduced and their spread encouraged and facilitated (table 2)
(Moorhouse, 1938). Many events reflected ‘seed’ introductions, having the intent of
establishing populations in new ecosystems (Crawford and Muir, 2008). Trout were
introduced to South Australia around 1900 (Duffield, 1903a) and the Inspector of Fisheries
reported in 1909 the occurrence “of immense shoals of carp and goldfish in waters of both
the lakes and the river” (Duffield, 1909).
To assist acclimatisation European settlers carried mechanisation to generate food
surpluses from agriculture (Crosby, 1986). Tools, which were often destructive, were
likewise introduced to South Australia to generate food surpluses from inland fisheries. For
example, the most destructive fishing gear to freshwater species, because of its
indiscriminate nature, “grab-alls”, were drum nets (Duffield, 1903b, Duffield, 1903a).
These nets were introduced in about 1886 by a Norwegian fishermen who used a similar
tool on a larger scale sea-fishing in Norway (Dannevig, 1903). The “cross-line”, another
device common in Europe, was “probably introduced by the many Europeans who
gradually settled along the Murray (River)” (Dannevig, 1903) (supplementary material).
Behaviours associated with ecological imperialism are also prominent in historical
records. Fishermen believed native animals were pests and had a negative impact on fish
species and supplies. Their treatment of these animals was emblematic of this ethic
(Crosby, 1986, Piper and Sandlos, 2007), for example, legislation was introduced in 1903
permitting destruction of fish enemies, including native shags and turtles as neither were
considered to “possess any redeeming features” (Duffield, 1903a). A bounty was paid for
their heads, and for pelicans, because “beyond the sentiment of their being a fine
Australian bird, there appears to be no reason why they should be protected” (Duffield,
1903a).
4444

3.7 Shifting baselines in aquatic ecosystems
South Australian fisheries have experienced a ‘transition’, from fisheries historically
focused on inland species to contemporary industries focused on marine species. Several
distinct changes through history have characterised European fisheries, including a
demand-driven transition from freshwater to marine species partly because of declines in
freshwater populations (Barrett et al., 2011). Inland fisheries in other neo-Europes have
also been systematically depleted; Pacific salmon in the United States and Canada have
deteriorated dramatically since settlement and inland populations have been
disproportionately more impacted than those in coastal areas (Gustafson et al., 2007).
Over one hundred years ago there was concern for shifting baselines and what this
meant for expectations of fisheries. During inquiries into Murray cod fisheries in 1900, the
Australian fisheries superintendent evaluated the number of years’ experience of fishermen
against their response to the question was the supply of cod the “same as before” or
“falling off”. He observed fishers with a greater number of years’ experience more often
considered stocks to be declining, describing their perspective as “drifting” (Dannevig,
1903), i.e. the shifting baseline syndrome (Pauly, 1995). This shift is reflected in loss of
detail in government reporting and erosion of knowledge. Historically, government was
mindful of inland fisheries, for example there were inquiries into fisheries circa. 1900
(Dannevig, 1903) and the impact of destructive fishing gears (Duffield, 1903b, Duffield,
1903a), but the detail of information declined between 1938-1959 (supplementary
material). Though not all regions have been impacted equally (Piper and Sandlos, 2007),
our interpretation is that historical preferences for inland fisheries species and their
subsequent declines, were, to a degree, predicated on societal expectations of settlers.
Hence, we propose the systematic overexploitation and degradation of native inland
fisheries species in Australia reflects the model neo-Europe and is a further consequence of
colonisation.
Since human activity, including colonialism, has had impact over long periods of
time detailed descriptions of ecosystem change are needed to accurately interpret natural
versus human mediated variation (Lightfoot et al., 2013, Jackson et al., 2001). We
illustrate how models from the social sciences could assist identification of past baselines,
including Anthropocene Baselines (Keller Kopf et al., 2015), and reconciliation of history
4545

with ecology (Szabó and Hédl, 2011). Scientists and managers could move beyond
specialist methodologies in fields of fisheries and ecological sciences to use such models to
quantify patterns of change. The perpetuated poor state of aquatic ecosystems has
contributed to a forgotten past prodigiousness (Humphries and Winemiller, 2009). The
model neo-Europe especially, could establish and motivate more accurate baselines for
management intervention.
3.8 Acknowledgments
This work was the outcome of cross-disciplinary encouragement from the Australian
National University. We thank Tom Griffiths, Libby Robin and Heather Goodall for their
support and acknowledge Primary Industries and Regions South Australia, and two
anonymous reviewers for constructive comments that improved this manuscript. SDC and
BMG acknowledge Australian Research Council Future Fellowships and BMG an ARC
Discovery grant.
4646

3.9
Su
pp
lem
enta
ry m
ater
ial
‘Neo
-Eu
rop
e’ a
nd
its
ecol
ogic
al c
onse
qu
ence
s: t
he
exam
ple
of
syst
emat
ic d
egra
dati
on in
Au
stra
lia’
s in
lan
d f
ish
erie
s
Hei
di K
. All
eway
, Bro
nwyn
M. G
illa
nder
s an
d Se
an D
. Con
nell
Au
thor
aff
ilia
tion
s: S
outh
ern
Sea
s E
colo
gy L
abor
ator
ies,
Sch
ool o
f B
iolo
gica
l Sci
ence
s, U
nive
rsity
of
Ade
laid
e, S
outh
Aus
tral
ia, 5
005,
Aus
tral
ia
Au
thor
for
cor
resp
ond
ence
: he
idi.a
llew
ay@
adel
aide
.edu
.au
His
tori
cal r
ecor
ds
of S
outh
Au
stra
lian
fis
her
ies
Tab
le 1
. His
tori
cal s
tate
men
ts m
ade
in r
elat
ion
to th
e fi
shin
g of
inla
nd f
ishe
ries
spe
cies
in S
outh
Aus
tral
ia, t
heir
sta
tus,
man
agem
ent,
obse
rvat
ions
abo
ut th
ese
spec
ies,
and
the
intr
oduc
tion
of
non-
nati
ve s
peci
es.
Top
ic
Yea
r R
ecor
d
Sta
te o
f in
land
fis
heri
es
in S
outh
Aus
tral
ia
1903
B
ut th
is r
iver
sys
tem
(th
e M
urra
y R
iver
) is
als
o po
sses
sed
of s
till
ano
ther
sou
rce
of r
iche
s th
at d
eser
ves
the
full
att
enti
on o
f th
e ad
join
ing
Sta
tes,
viz
. : th
e fi
sher
ies.
Gen
eral
ly s
peak
ing,
this
indu
stry
has
bee
n le
ft to
itse
lf, o
r th
e in
divi
dual
sta
tes
have
for
mul
ated
reg
ulat
ions
out
of
harm
ony
wit
h on
e an
othe
r. I
n al
l cas
es
litt
le s
uper
visi
on h
as b
een
prov
ided
, and
the
cons
eque
nce
resu
lt h
as b
een
law
less
ness
, abu
ses,
and
fri
ctio
n.
4747

No
indu
stry
can
thri
ve u
nder
suc
h co
ndit
ions
, and
the
fish
erie
s ar
e at
pre
sent
in w
hat m
ay b
e te
rmed
a s
ickl
y
and
stra
ggli
ng s
tate
. The
cli
mat
ic c
ondi
tion
s ar
e sa
id to
hav
e an
infl
uenc
e on
thes
e m
atte
rs, b
ut, i
f, th
is is
only
ano
ther
rea
son
why
the
mos
t sho
uld
be m
ade
of th
e ex
isti
ng p
ossi
bili
ties
, whi
ch in
them
selv
es a
re
grea
t ; a
nd in
reg
ard
to th
is, a
s to
fis
heri
es g
ener
ally
, it i
s, f
or o
bvio
us r
easo
ns, h
ighl
y de
sira
ble
and
muc
h
easi
er to
mai
ntai
n an
abu
ndan
t sup
ply
rath
er th
an a
llow
the
latt
er to
dw
indl
e aw
ay th
roug
h ne
glec
t, an
d th
e
star
t the
nec
essa
rily
slo
w a
nd d
iffi
cult
task
of
repl
enis
hing
aga
inst
hea
vy o
dds
(Dan
nevi
g, 1
903)
.
Impo
rtan
ce o
f M
urra
y
cod
1903
O
f th
e fi
shes
on
the
wes
tern
riv
er s
yste
m th
e M
urra
y co
d is
by
far
the
mos
t im
port
ant.
… T
he c
od a
ppea
rs
to b
e ha
rdy
and
prol
ific
; it
occ
urs
in q
uant
itie
s in
all
the
prin
cipa
l tri
buta
ries
to th
e ex
tens
ive
syst
em o
f
rive
rs, a
s w
ell a
s th
e la
rge
lake
s, e
tc.,
… A
ll th
e ye
ar th
roug
h fi
shin
g op
erat
ions
are
car
ried
on,
and
the
grea
ter
part
of
the
catc
hes
desp
atch
ed f
rom
var
ious
cen
tres
to A
dela
ide,
in S
outh
Aus
tral
ia, M
elbo
urne
and
Bal
lara
t, in
Vic
tori
a (D
anne
vig,
190
3).
Dis
trib
utio
n of
fis
h fo
r
mar
ket
1903
F
rom
Tab
les
II. a
nd I
II. t
he f
ollo
win
g pa
rtic
ular
s m
ay b
e ob
serv
ed :-
1. T
hat a
bout
two-
thir
ds o
f th
e fi
sh
caug
ht a
re s
ent t
o A
dela
ide.
2. T
hat t
he to
tal q
uant
ity
sent
aw
ay f
rom
the
five
rai
lway
sta
tion
s fo
r th
e th
ree
year
s av
erag
es a
bout
422
tons
per
yea
r. …
But
thes
e ta
bles
are
by
no m
eans
exh
aust
ive.
Apa
rt f
rom
the
thre
e ce
ntre
s st
ated
, it i
s ob
viou
s th
at a
cer
tain
—pe
rhap
s co
nsid
erab
le—
quan
tity
of f
ish
sent
is d
irec
t to
othe
r to
wns
hips
alo
ng th
e ra
ilw
ay li
nes
in S
outh
Aus
tral
ia, V
icto
ria,
and
eve
n N
ew S
outh
Wal
es, a
nd f
ish
is
prob
ably
rec
eive
d in
Ade
laid
e, M
elbo
urne
, and
Bal
lara
t, al
so f
rom
oth
er p
arts
of
the
rive
r th
an th
e fi
ve
4848
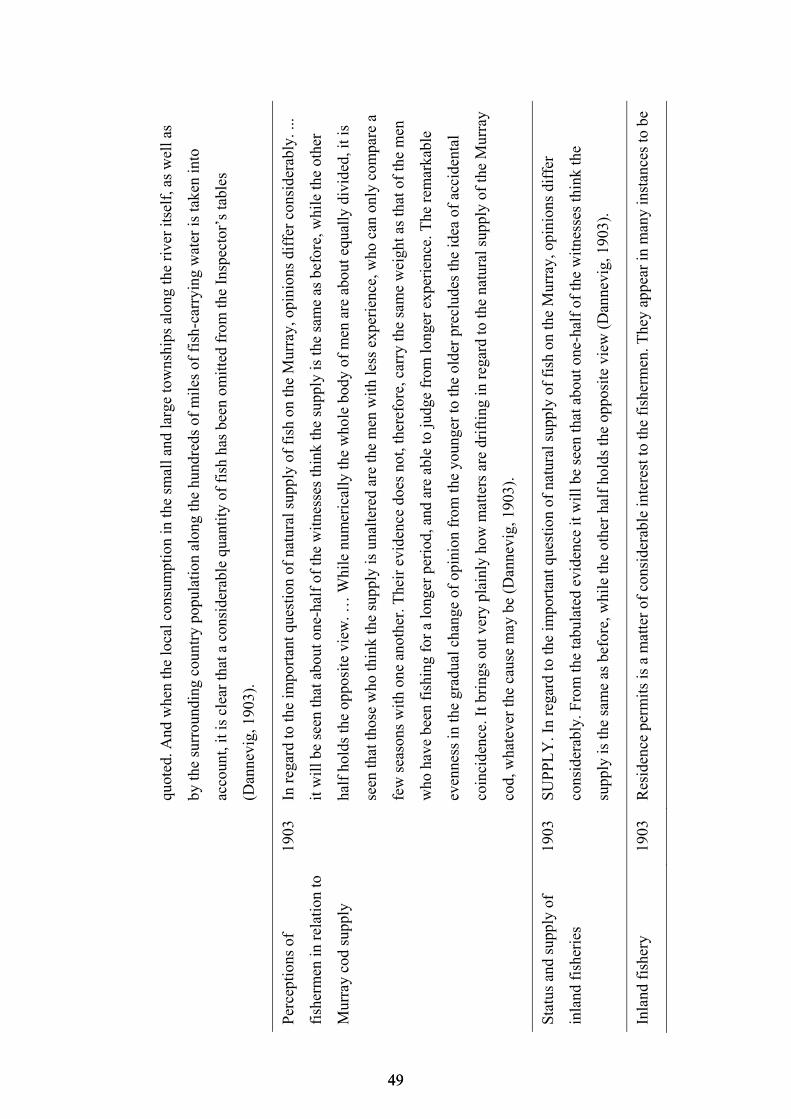
quot
ed. A
nd w
hen
the
loca
l con
sum
ptio
n in
the
smal
l and
larg
e to
wns
hips
alo
ng th
e ri
ver
itse
lf, a
s w
ell a
s
by th
e su
rrou
ndin
g co
untr
y po
pula
tion
alo
ng th
e hu
ndre
ds o
f m
iles
of
fish
-car
ryin
g w
ater
is ta
ken
into
acco
unt,
it is
cle
ar th
at a
con
side
rabl
e qu
anti
ty o
f fi
sh h
as b
een
omit
ted
from
the
Insp
ecto
r’s
tabl
es
(Dan
nevi
g, 1
903)
.
Per
cept
ions
of
fish
erm
en in
rel
atio
n to
Mur
ray
cod
supp
ly
1903
In
reg
ard
to th
e im
port
ant q
uest
ion
of n
atur
al s
uppl
y of
fis
h on
the
Mur
ray,
opi
nion
s di
ffer
con
side
rabl
y. ..
.
it w
ill b
e se
en th
at a
bout
one
-hal
f of
the
wit
ness
es th
ink
the
supp
ly is
the
sam
e as
bef
ore,
whi
le th
e ot
her
half
hol
ds th
e op
posi
te v
iew
. … W
hile
num
eric
ally
the
who
le b
ody
of m
en a
re a
bout
equ
ally
div
ided
, it i
s
seen
that
thos
e w
ho th
ink
the
supp
ly is
una
lter
ed a
re th
e m
en w
ith
less
exp
erie
nce,
who
can
onl
y co
mpa
re a
few
sea
sons
wit
h on
e an
othe
r. T
heir
evi
denc
e do
es n
ot, t
here
fore
, car
ry th
e sa
me
wei
ght a
s th
at o
f th
e m
en
who
hav
e be
en f
ishi
ng f
or a
long
er p
erio
d, a
nd a
re a
ble
to ju
dge
from
long
er e
xper
ienc
e. T
he r
emar
kabl
e
even
ness
in th
e gr
adua
l cha
nge
of o
pini
on f
rom
the
youn
ger
to th
e ol
der
prec
lude
s th
e id
ea o
f ac
cide
ntal
coin
cide
nce.
It b
ring
s ou
t ver
y pl
ainl
y ho
w m
atte
rs a
re d
rift
ing
in r
egar
d to
the
natu
ral s
uppl
y of
the
Mur
ray
cod,
wha
teve
r th
e ca
use
may
be
(Dan
nevi
g, 1
903)
.
Sta
tus
and
supp
ly o
f
inla
nd f
ishe
ries
1903
S
UP
PL
Y. I
n re
gard
to th
e im
port
ant q
uest
ion
of n
atur
al s
uppl
y of
fis
h on
the
Mur
ray,
opi
nion
s di
ffer
cons
ider
ably
. Fro
m th
e ta
bula
ted
evid
ence
it w
ill b
e se
en th
at a
bout
one
-hal
f of
the
wit
ness
es th
ink
the
supp
ly is
the
sam
e as
bef
ore,
whi
le th
e ot
her
half
hol
ds th
e op
posi
te v
iew
(D
anne
vig,
190
3).
Inla
nd f
ishe
ry
1903
R
esid
ence
per
mit
s is
a m
atte
r of
con
side
rabl
e in
tere
st to
the
fish
erm
en. T
hey
appe
ar in
man
y in
stan
ces
to b
e
4949

obli
ged
to c
amp
alon
g th
e ri
ver
bank
s, a
nd c
ome
occa
sion
ally
into
con
flic
t wit
h th
e re
side
nts.
The
men
mov
e up
and
dow
n th
e ri
ver
in a
ccor
danc
e w
ith
seas
ons
and
othe
r ci
rcum
stan
ces,
and
are
una
ble
to li
ve
wit
h th
eir
fam
ilie
s. …
The
maj
orit
y no
w c
atch
wha
t the
y ca
n in
one
pla
ce a
nd th
en g
o on
to a
noth
er
(Dan
nevi
g, 1
903)
.
Intr
oduc
tion
of
trou
t
(non
-nat
ive
spec
ies)
1903
A
CC
LIM
AT
ISA
TIO
N. T
he S
ydne
y F
ishe
ries
Dep
artm
ent h
as k
indl
y gi
ven
us 1
,000
rai
nbow
trou
t fry
,
whi
ch a
re to
be
dist
ribu
ted
to p
erso
ns w
ho h
ave
agre
ed to
rec
eive
sam
e an
d re
leas
e th
em in
run
ning
str
eam
s
in v
ario
us lo
cali
ties
thro
ugho
ut th
e St
ate.
Bey
ond
this
, I th
ink
our
ener
gies
wil
l be
bett
er d
irec
ted
to th
e
cons
erva
tion
of
our
loca
l var
ieti
es th
an in
att
empt
ing
to a
ccli
mat
ise
fore
ign
spec
ies.
Lat
er, w
hen
we
know
mor
e ab
out t
he h
abit
s of
our
ow
n fi
sh, w
e m
ay w
ell s
eek
to a
cqui
re a
n ac
quai
ntan
ce w
ith
thos
e of
oth
er
wat
ers
(Duf
fiel
d, 1
903a
).
Clo
sed
seas
on f
or
Mur
ray
cod
1903
C
LO
SE
SE
AS
ON
. The
clo
se s
easo
n on
the
Mur
ray
has
now
bee
n m
ade
unif
orm
in N
ew S
outh
Wal
es,
Vic
tori
a, a
nd th
is S
tate
, viz
., fr
om th
e 1st
Sep
tem
ber
to D
ecem
ber
20th
of
each
yea
r. D
urin
g th
is p
erio
d no
fish
ing
wha
teve
r ca
n be
car
ried
on,
exc
ept w
ith
rod
and
line
, or
hand
line
. Cro
ssli
nes,
spr
inge
rs, a
nd a
ll
desc
ript
ion
of n
ets
are
abso
lute
ly p
rohi
bite
d …
(D
uffi
eld,
190
3a)
Fis
heri
es a
nd
cons
erva
tion
man
agem
ent
1903
O
LD
ME
TH
OD
S S
UC
CE
SS
FU
L. N
ine
year
s ag
o m
en c
ould
mak
e a
good
livi
ng w
ith
cros
slin
es a
nd
spri
nger
s. “
No
unus
ual t
hing
for
a m
an to
cat
ch h
alf
a to
n a
wee
k” (
Mr.
McI
ntos
h’s
evid
ence
). …
Wit
h a
cycl
e of
nor
mal
riv
er le
vels
and
judi
ciou
s fi
shin
g th
erei
n, is
ther
e an
y re
ason
why
thos
e go
od ti
mes
sho
uld
5050
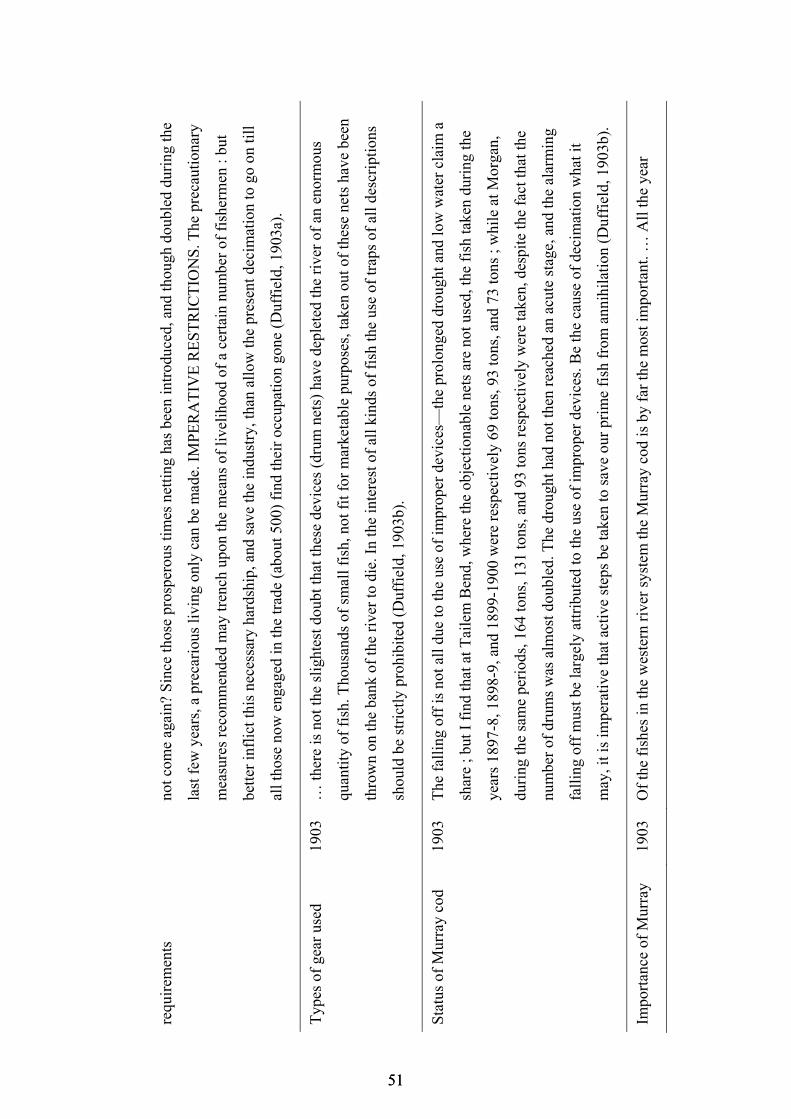
requ
irem
ents
no
t com
e ag
ain?
Sin
ce th
ose
pros
pero
us ti
mes
net
ting
has
bee
n in
trod
uced
, and
thou
gh d
oubl
ed d
urin
g th
e
last
few
yea
rs, a
pre
cari
ous
livi
ng o
nly
can
be m
ade.
IM
PE
RA
TIV
E R
ES
TR
ICT
ION
S. T
he p
reca
utio
nary
mea
sure
s re
com
men
ded
may
tren
ch u
pon
the
mea
ns o
f li
veli
hood
of
a ce
rtai
n nu
mbe
r of
fis
herm
en :
but
bett
er in
flic
t thi
s ne
cess
ary
hard
ship
, and
sav
e th
e in
dust
ry, t
han
allo
w th
e pr
esen
t dec
imat
ion
to g
o on
till
all t
hose
now
eng
aged
in th
e tr
ade
(abo
ut 5
00)
find
thei
r oc
cupa
tion
gon
e (D
uffi
eld,
190
3a).
Typ
es o
f ge
ar u
sed
1903
…
ther
e is
not
the
slig
htes
t dou
bt th
at th
ese
devi
ces
(dru
m n
ets)
hav
e de
plet
ed th
e ri
ver
of a
n en
orm
ous
quan
tity
of
fish
. Tho
usan
ds o
f sm
all f
ish,
not
fit
for
mar
keta
ble
purp
oses
, tak
en o
ut o
f th
ese
nets
hav
e be
en
thro
wn
on th
e ba
nk o
f th
e ri
ver
to d
ie. I
n th
e in
tere
st o
f al
l kin
ds o
f fi
sh th
e us
e of
trap
s of
all
des
crip
tion
s
shou
ld b
e st
rict
ly p
rohi
bite
d (D
uffi
eld,
190
3b).
Sta
tus
of M
urra
y co
d 19
03
The
fal
ling
off
is n
ot a
ll d
ue to
the
use
of im
prop
er d
evic
es—
the
prol
onge
d dr
ough
t and
low
wat
er c
laim
a
shar
e ; b
ut I
fin
d th
at a
t Tai
lem
Ben
d, w
here
the
obje
ctio
nabl
e ne
ts a
re n
ot u
sed,
the
fish
take
n du
ring
the
year
s 18
97-8
, 189
8-9,
and
189
9-19
00 w
ere
resp
ecti
vely
69
tons
, 93
tons
, and
73
tons
; w
hile
at M
orga
n,
duri
ng th
e sa
me
peri
ods,
164
tons
, 131
tons
, and
93
tons
res
pect
ivel
y w
ere
take
n, d
espi
te th
e fa
ct th
at th
e
num
ber
of d
rum
s w
as a
lmos
t dou
bled
. The
dro
ught
had
not
then
rea
ched
an
acut
e st
age,
and
the
alar
min
g
fall
ing
off
mus
t be
larg
ely
attr
ibut
ed to
the
use
of im
prop
er d
evic
es. B
e th
e ca
use
of d
ecim
atio
n w
hat i
t
may
, it i
s im
pera
tive
that
act
ive
step
s be
take
n to
sav
e ou
r pr
ime
fish
fro
m a
nnih
ilat
ion
(Duf
fiel
d, 1
903b
).
Impo
rtan
ce o
f M
urra
y 19
03
Of
the
fish
es in
the
wes
tern
riv
er s
yste
m th
e M
urra
y co
d is
by
far
the
mos
t im
port
ant.
… A
ll th
e ye
ar
5151

cod
and
dist
ribu
tion
of
fish
for
mar
ket
thro
ugh
fish
ing
oper
atio
ns a
re c
arri
ed o
n, a
nd th
e gr
eate
r pa
rt o
f th
e ca
tche
s de
spat
ched
fro
m v
ario
us
cent
res
to A
dela
ide,
in S
outh
Aus
tral
ia, M
elbo
urne
and
Bal
lara
t, in
Vic
tori
a (D
anne
vig,
190
3).
Lit
tle
dem
and
for
fres
hwat
er c
rayf
ish
and
call
op (
gold
en p
erch
)
1903
(E
vide
nce
subm
itte
d by
Mr.
Sam
uel M
acIn
tosh
, Exp
ert,
Vil
lage
Set
tlem
ents
, als
o C
hief
Ass
ista
nt I
nspe
ctor
of F
ishe
ries
) L
obst
ers,
etc
.—G
reat
fal
ling
off
fro
m M
orga
n to
the
corn
er th
is y
ear,
alt
houg
h a
num
ber
wer
e
caug
ht h
ighe
r up
the
rive
r. L
obst
ers
gene
rall
y ap
pear
in M
ay a
nd g
o aw
ay in
Aug
ust ;
they
are
not
sen
t to
mar
ket ;
per
sona
lly
pref
er th
em to
sal
t-w
ater
lobs
ters
. The
sam
e th
ing
appl
ies
to c
atfi
sh a
nd c
allo
p, b
oth
of
whi
ch a
re e
xcel
lent
foo
d, b
ut v
ery
litt
le in
dem
and
(Dan
nevi
g, 1
903)
.
Des
truc
tion
of
turt
les
1903
(E
vide
nce
subm
itte
d by
Mr.
Sam
uel M
acIn
tosh
, Exp
ert,
Vil
lage
Set
tlem
ents
, als
o C
hief
Ass
ista
nt I
nspe
ctor
of F
ishe
ries
) A
n ad
vant
age
of d
rum
net
s is
that
they
des
troy
eno
rmou
s qu
anti
ties
of
turt
les,
and
if p
rope
rly
set i
n st
ill w
ater
s ca
n be
uti
lise
d fo
r ca
tchi
ng tu
rtle
s al
ong.
Hav
e se
en tw
enty
-six
turt
les
take
n ou
t of
one
drum
in B
enro
ck C
reek
, nea
r O
verl
and
Cor
ner,
abo
ut th
ree
year
s ag
o (D
anne
vig,
190
3).
Num
ber
of f
ishe
rmen
19
03
(Evi
denc
e su
bmit
ted
by M
r. S
amue
l Mac
Into
sh, E
xper
t, V
illa
ge S
ettl
emen
ts, a
lso
Chi
ef A
ssis
tant
Ins
pect
or
of F
ishe
ries
) N
umbe
r of
set
tler
s al
ong
the
rive
r du
ring
the
last
ten
year
s in
crea
sed
very
con
side
rabl
y. I
n
1891
not
twen
ty s
ettl
ers
betw
een
Mor
gan
and
boun
dary
, and
now
ther
e ar
e 50
0 (e
xclu
ding
sta
tion
han
ds
and
Ren
mar
k. N
o ca
ught
fis
h cr
osse
d ou
r bo
unda
ry in
189
1, a
nd in
that
yea
r th
ere
wer
e pr
acti
call
y no
fis
h
caug
ht a
bove
Ove
rlan
d C
orne
r (D
anne
vig,
190
3).
5252

Num
ber
of f
ishe
rmen
and
type
s of
gea
r us
ed
1909
R
IVE
R M
UR
RA
Y F
ISH
ER
IES
. The
reg
iste
r sh
ows
that
246
lice
nsed
fis
herm
en a
nd li
cens
ed s
erva
nts
are
empl
oyed
on
thes
e w
ater
s, a
dded
to w
hich
alm
ost a
s m
any
amat
eurs
fin
d m
ore
or le
ss e
njoy
men
t in
usin
g
the
drum
-net
, cro
ssli
ne, s
idel
ine,
spr
ings
, rod
and
line
, han
d li
ne, o
r m
esh
net i
n co
ntri
buti
ng to
the
tota
l
annu
al c
atch
, whi
ch is
est
imat
ed to
exc
eed
400
tons
per
ann
um. T
he p
rinc
ipal
fis
h in
the
wat
ers
in q
uest
ion
are
mul
low
ay o
r bu
tter
fish
(Sc
iaen
a A
ntar
ctic
a), k
now
n in
New
Sou
th W
ales
as
jew
fish
, in
Que
ensl
and
as
dew
fish
, and
in V
icto
ria
as k
ingf
ish
; Mur
ray
cod
(Oli
goru
s m
acqu
ariu
m),
cal
lop,
gol
d or
Mur
ray
perc
h,
blac
k br
eam
, and
mul
let (
flat
-tai
led,
san
d, a
nd ju
mpi
ng).
The
mor
e un
impo
rtan
t fis
h in
clud
e si
lver
bre
am,
took
ery
or p
iwhi
ree,
cat
fish
, kon
goll
ey, c
arp
(im
port
ed),
and
flo
unde
r (D
uffi
eld,
190
9).
Cra
bs d
estr
ucti
ve to
fish
ing
gear
1909
T
he s
mal
l com
mon
cra
b is
a g
reat
pes
t in
the
low
er w
ater
s in
des
troy
ing
nets
and
any
mes
hed
fish
, whe
reve
r
the
nets
are
all
owed
to to
uch
bott
om. F
or s
ome
year
s pa
st th
e ne
cess
ity
for
som
e sy
stem
of
eith
er c
heck
ing
thei
r in
crea
se o
r, if
pos
sibl
e, b
ring
ing
abou
t the
ir p
ract
ical
ext
erm
inat
ion,
has
bee
n lo
oked
for
by
the
depa
rtm
ent.
Mr.
Dan
nevi
g (F
eder
al D
irec
tor
Fis
heri
es),
Dr.
Ram
say
Sm
ith,
and
oth
ers
have
bee
n
appr
oach
ed w
ith
a vi
ew o
f fi
ndin
g so
me
effe
ctiv
e an
d ec
onom
ical
cur
e fo
r th
e ev
il ;
but u
p to
the
pres
ent n
o
prac
tica
ble
theo
ry h
as b
een
sugg
este
d (D
uffi
eld,
190
9).
Dis
trib
utio
n of
fis
heri
es
spec
ies
alon
g th
e
Mur
ray
Riv
er
1909
F
rom
Wel
ling
ton
to B
lanc
heto
wn,
whi
ch c
onst
itut
e th
e pe
rman
entl
y na
viga
ble
port
ion
of th
e ri
ver,
cod
and
call
op a
re th
e on
ly c
atch
wor
th r
ecor
ding
, as
far
as m
arke
t req
uire
men
ts a
re c
once
rned
. … T
his
port
ion
of
our
inla
nd w
ater
s as
far
up-
stre
am a
s B
lanc
heto
wn
is th
e on
ly w
ater
in th
e S
tate
s w
here
the
cod
fish
erie
s ar
e
5353

open
thro
ugho
ut th
e ye
ar. …
Lak
es B
arm
era
(Bon
ney)
and
Vic
tori
a ar
e ke
pt c
lose
d ag
ains
t fis
hing
, the
ir
wat
ers
bein
g ge
nera
lly
ackn
owle
dged
to b
e th
e pr
inci
pal c
od-s
paw
ning
gro
unds
in th
e M
urra
y w
ater
shed
.
Qua
ntit
ies
of M
urra
y lo
bste
rs a
re tr
appe
d in
bai
ted
wir
e ca
ges
on th
e ri
ver
abov
e M
urra
y B
ridg
e. T
his
spec
ies
(Ast
acoi
des
serr
atus
, McC
oy)
is o
ne o
f th
e m
ost d
elic
ate-
fles
hed
crus
tace
ans,
and
is h
eld
in h
igh
este
em b
y th
e m
ajor
ity
of th
ose
who
are
acq
uain
ted
wit
h it
(D
uffi
eld,
190
9).
Car
p an
d go
ldfi
sh (
non-
nati
ve s
peci
es)
in th
e
Mur
ray
Riv
er
1909
D
urin
g re
cent
yea
rs im
men
se s
hoal
s of
car
p an
d go
ldfi
sh h
ave
been
rep
orte
d in
the
wat
ers
of b
oth
the
lake
s
and
the
rive
r. T
his
vari
ety
is o
f no
edi
ble
valu
e to
man
, yet
it a
ppea
rs to
sup
ply
the
wan
ts o
f th
e co
d, a
nd
also
aff
ords
pas
tim
e to
the
peli
cans
and
cor
mor
ants
(D
uffi
eld,
190
9).
Des
truc
tion
of
shag
s
and
turt
les
1909
S
ince
the
paym
ent o
f a
bonu
s on
sha
gs a
nd tu
rtle
s, th
e nu
mbe
rs o
f th
ese
fish
ene
mie
s ha
ve b
een
visi
bly
decr
ease
d on
the
sett
led
port
ions
of
the
rive
r, a
nd n
o do
ubt t
he r
ecen
t won
derf
ul a
cces
sion
of
codf
ish—
near
ly a
ll u
nder
thre
e ye
ars’
gro
wth
—ca
n w
ith
safe
ty b
e ad
duce
d pa
rtly
to th
e pr
otec
tion
aff
orde
d by
obse
rvin
g a
clos
e se
ason
on
the
reco
gnis
ed b
reed
ing-
plac
es a
nd o
ther
pro
tect
ing
mea
sure
s (D
uffi
eld,
190
9).
Con
nect
ion
to
Eur
opea
n fi
sher
ies
1910
M
aint
aini
ng S
uppl
ies.
—T
he d
epar
tmen
t is
aler
t aft
er in
crea
sing
sup
plie
s, a
nd is
gat
heri
ng in
form
atio
n
resp
ecti
ng th
e w
here
abou
ts o
f na
tura
l bre
edin
g gr
ound
s, w
ith
a vi
ew to
mak
ing
them
a s
anct
uary
for
the
rear
ing
of y
oung
fis
h. I
t is
beli
eved
that
the
rese
rvat
ion
of th
ese
spaw
ning
pla
ces
wil
l rep
leni
sh th
e su
ppli
es
wit
h m
ore
cert
aint
y an
d le
ss e
xpen
se th
an b
y ar
tifi
cial
hat
cher
ies.
Nev
erth
eles
s, w
hen
mor
e is
kno
wn
of th
e
char
acte
r of
our
wat
ers
as a
hom
e fo
r th
e w
ell k
now
n ed
ible
fis
h of
the
Nor
th S
eas,
it m
ay b
ecom
e
5454
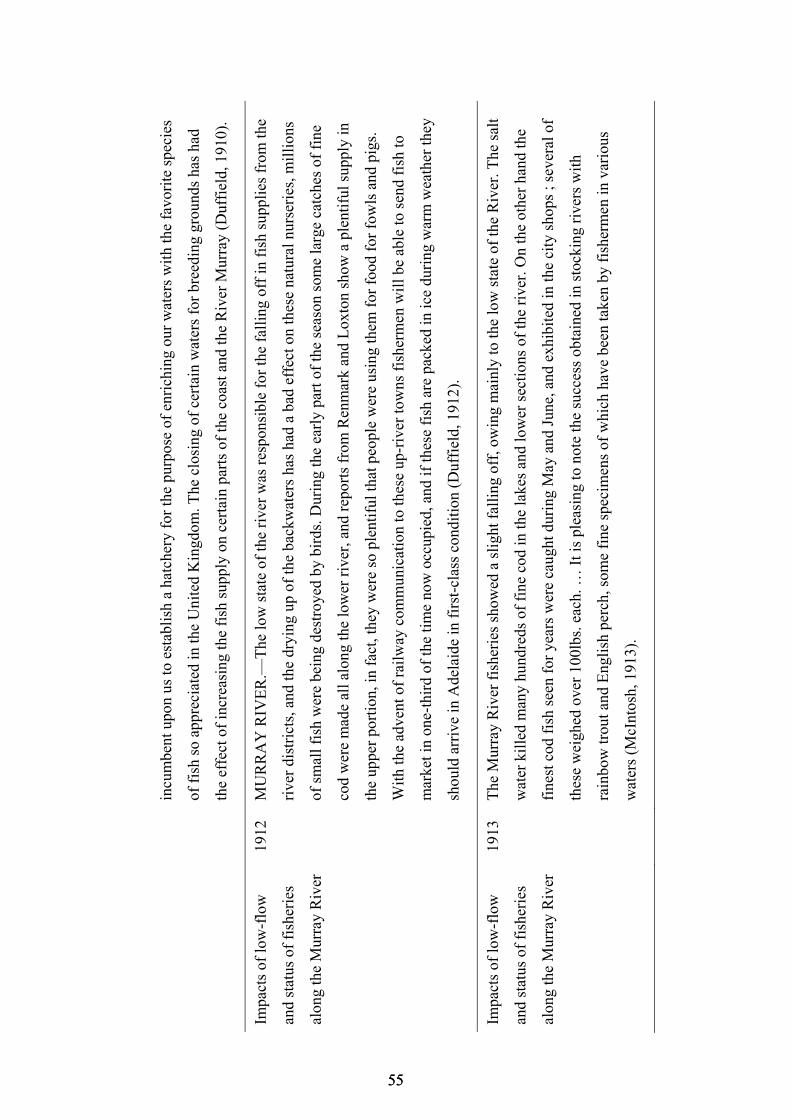
incu
mbe
nt u
pon
us to
est
abli
sh a
hat
cher
y fo
r th
e pu
rpos
e of
enr
ichi
ng o
ur w
ater
s w
ith
the
favo
rite
spe
cies
of f
ish
so a
ppre
ciat
ed in
the
Uni
ted
Kin
gdom
. The
clo
sing
of
cert
ain
wat
ers
for
bree
ding
gro
unds
has
had
the
effe
ct o
f in
crea
sing
the
fish
sup
ply
on c
erta
in p
arts
of
the
coas
t and
the
Riv
er M
urra
y (D
uffi
eld,
191
0).
Impa
cts
of lo
w-f
low
and
stat
us o
f fi
sher
ies
alon
g th
e M
urra
y R
iver
1912
M
UR
RA
Y R
IVE
R.—
The
low
sta
te o
f th
e ri
ver
was
res
pons
ible
for
the
fall
ing
off
in f
ish
supp
lies
fro
m th
e
rive
r di
stri
cts,
and
the
dryi
ng u
p of
the
back
wat
ers
has
had
a ba
d ef
fect
on
thes
e na
tura
l nur
seri
es, m
illi
ons
of s
mal
l fis
h w
ere
bein
g de
stro
yed
by b
irds
. Dur
ing
the
earl
y pa
rt o
f th
e se
ason
som
e la
rge
catc
hes
of f
ine
cod
wer
e m
ade
all a
long
the
low
er r
iver
, and
rep
orts
fro
m R
enm
ark
and
Lox
ton
show
a p
lent
iful
sup
ply
in
the
uppe
r po
rtio
n, in
fac
t, th
ey w
ere
so p
lent
iful
that
peo
ple
wer
e us
ing
them
for
foo
d fo
r fo
wls
and
pig
s.
Wit
h th
e ad
vent
of
rail
way
com
mun
icat
ion
to th
ese
up-r
iver
tow
ns f
ishe
rmen
wil
l be
able
to s
end
fish
to
mar
ket i
n on
e-th
ird
of th
e ti
me
now
occ
upie
d, a
nd if
thes
e fi
sh a
re p
acke
d in
ice
duri
ng w
arm
wea
ther
they
shou
ld a
rriv
e in
Ade
laid
e in
fir
st-c
lass
con
diti
on (
Duf
fiel
d, 1
912)
.
Impa
cts
of lo
w-f
low
and
stat
us o
f fi
sher
ies
alon
g th
e M
urra
y R
iver
1913
T
he M
urra
y R
iver
fis
heri
es s
how
ed a
sli
ght f
alli
ng o
ff, o
win
g m
ainl
y to
the
low
sta
te o
f th
e R
iver
. The
sal
t
wat
er k
ille
d m
any
hund
reds
of
fine
cod
in th
e la
kes
and
low
er s
ecti
ons
of th
e ri
ver.
On
the
othe
r ha
nd th
e
fine
st c
od f
ish
seen
for
yea
rs w
ere
caug
ht d
urin
g M
ay a
nd J
une,
and
exh
ibit
ed in
the
city
sho
ps ;
seve
ral o
f
thes
e w
eigh
ed o
ver
100l
bs. e
ach.
… I
t is
plea
sing
to n
ote
the
succ
ess
obta
ined
in s
tock
ing
rive
rs w
ith
rain
bow
trou
t and
Eng
lish
per
ch, s
ome
fine
spe
cim
ens
of w
hich
hav
e be
en ta
ken
by f
ishe
rmen
in v
ario
us
wat
ers
(McI
ntos
h, 1
913)
.
5555

Impa
cts
of lo
w-f
low
and
stat
us o
f fi
sher
ies
alon
g th
e M
urra
y R
iver
1913
T
he lo
wne
ss o
f th
e M
urra
y ha
s ag
ain
been
res
pons
ible
for
sho
rt s
uppl
ies,
but
som
e ve
ry la
rge
cod
from
the
uppe
r ri
ver
reac
hed
Ade
laid
e in
pri
me
cond
itio
n ; t
hey
wer
e po
ssib
ly th
e fi
nest
fis
h se
en f
or y
ears
. Up
rive
r
tow
ns r
epor
ted
fair
cat
ches
, but
in th
e lo
wer
wat
ers
ther
e w
as a
gre
at s
carc
ity,
par
ticu
larl
y do
wn
stre
am
from
Mur
ray
Bri
dge,
whe
re th
e sa
lt w
ater
pla
yed
havo
c w
ith
cod.
Hun
dred
s of
fis
h w
ere
to b
e se
en f
loat
ing
on th
e su
rfac
e. F
or s
ome
mon
ths
cod
wer
e ex
ceed
ingl
y sc
arce
in th
e la
kes,
pro
babl
y du
e to
the
infl
ux o
f sa
lt
wat
er, b
ut la
tely
som
e go
od c
atch
es w
ere
obta
ined
in L
ake
Alb
ert a
nd a
t Poi
nt M
cLea
y. L
ine
fish
ing
at
Mur
ray
Mou
th h
as n
ot b
een
as s
ucce
ssfu
l as
in f
orm
er y
ears
, but
net
ting
in th
e C
ooro
ng a
nd u
p st
ream
fro
m
Goo
lwa
was
sat
isfa
ctor
y (M
cInt
osh,
191
3).
Intr
oduc
tion
and
spr
ead
of tr
out (
non-
nati
ve
spec
ies)
1913
A
ngle
rs in
str
eam
s an
d ri
vers
had
goo
d sp
ort,
part
icul
arly
in th
e U
pper
Stu
rt, w
here
som
e ni
ce r
ainb
ow tr
out
wer
e ta
ken.
Som
e ye
ars
ago
thes
e fi
sh w
ere
libe
rate
d in
a d
am w
hich
ove
rflo
wed
and
all
owed
the
fish
to
esca
pe, t
hus
stoc
king
the
wat
ers
of th
e ri
ver.
Som
e ye
ars
ago
rain
bow
trou
t wer
e pl
aced
in th
e R
iver
Ang
us,
near
Str
atha
lbyn
, by
Sir
Lan
celo
t Sti
rlin
g, a
nd h
ave
appa
rent
ly d
one
wel
l, as
fis
herm
en r
epor
t hav
ing
caug
ht
thes
e fi
sh in
Lak
e A
lexa
ndri
na a
nd u
p th
e M
urra
y as
far
as
Tai
lem
Ben
d (M
cInt
osh,
191
3).
Intr
oduc
tion
of
redf
in
perc
h (n
on-n
ativ
e
spec
ies)
1913
A
num
ber
of E
ngli
sh p
erch
wer
e ob
tain
ed f
rom
the
Bal
lara
t Acc
lim
atiz
atio
n S
ocie
ty f
or M
r. P
. W.
Bro
mfi
eld,
of
Kan
garo
o Is
land
. I p
erso
nall
y ac
com
pani
ed th
ese
to K
ings
cote
, and
del
iver
ed th
em in
exce
llen
t hea
lth.
The
se f
ish
wer
e re
leas
ed in
Bir
chm
ore’
s an
d M
urra
y’s
Lag
oons
, the
for
mer
bei
ng o
n M
r.
Bro
mfi
eld’
s pr
oper
ty a
nd th
e la
tter
on
the
esta
te o
f M
r. F
. W. W
inch
. The
Gaw
ler
Fis
h P
rote
ctio
n S
ocie
ty
5656
and
Ang
ling
Clu
b, w
hich
has
bee
n es
tabl
ishe
d by
som
e lo
cal s
port
smen
, rec
eive
d an
othe
r su
pply
of
fish
from
Bal
lara
t for
libe
rati
ng in
the
Nor
th P
ara.
The
sto
ckin
g of
thes
e w
ater
s la
st y
ear
has
evid
entl
y be
en
succ
essf
ul, a
s se
vera
l fin
e tr
out h
ave
been
not
iced
late
ly (
McI
ntos
h, 1
913)
.
Goo
d ca
tche
s of
mul
low
ay
1914
It
is p
leas
ing
to r
ecor
d th
e fa
vour
able
sea
son
for
mul
low
ay (
butt
erfi
sh),
larg
e ha
uls
bein
g m
ade
at G
oolw
a,
Mil
ang,
and
Lak
e A
lexa
ndri
na (
McI
ntos
h, 1
914)
.
Impa
cts
of lo
w-f
low
and
stat
us o
f fi
sher
ies
alon
g th
e M
urra
y R
iver
1914
R
IVE
R M
UR
RA
Y A
ND
LA
KE
S’
FIS
HE
RIE
S. T
wo
dry
seas
ons
wit
h a
reco
rd lo
w r
iver
hav
e de
plet
ed th
e
fish
sup
plie
s in
thes
e w
ater
s ; s
ome
of th
e ba
ckw
ater
s ha
ve d
ried
up
enti
rely
, and
to p
reve
nt th
e po
ssib
le
was
te o
f va
luab
le f
ish
it w
as d
ecid
ed to
ope
n th
e na
tura
l hat
cher
y at
Lak
e B
onne
y to
fis
hing
, ow
ing
to th
e
wat
ers
of th
e la
ke d
imin
ishi
ng to
suc
h an
ext
ent t
hat t
here
is e
very
pos
sibi
lity
of
its
beco
min
g dr
y. W
hen
the
lake
is a
gain
fil
led
the
fish
erie
s w
ill b
e ag
ain
prot
ecte
d (M
cInt
osh,
191
4).
Impa
cts
of lo
w-f
low
and
stat
us o
f fi
sher
ies
alon
g th
e M
urra
y R
iver
1914
G
EN
ER
AL
. The
dro
ught
con
diti
ons
expe
rien
ced
duri
ng th
e pe
riod
und
er r
evie
w h
ave
very
ser
ious
ly
affe
cted
the
insh
ore
and
fres
h w
ater
fis
heri
es o
f th
e S
tate
gen
eral
ly, a
nd th
e oy
ster
fis
heri
es in
par
ticu
lar.
The
maj
orit
y of
our
str
eam
s ar
e ra
pidl
y dr
ying
up,
con
sequ
entl
y th
e gr
eate
r po
rtio
n of
the
trou
t, pe
rch,
&c.
,
ther
ein
mus
t of
nece
ssit
y be
des
troy
ed, w
hile
thro
ugh
the
alm
ost t
otal
abs
ence
of
stor
m o
f fl
ood
wat
ers
such
fish
as
are
in th
e ha
bit o
f fr
eque
ntin
g th
e es
tuar
ies
wer
e no
t so
abun
dant
as
usua
l (M
cInt
osh,
191
4).
Intr
oduc
tion
and
spr
ead
It
is e
xcee
ding
ly p
leas
ing
to n
ote
the
succ
ess
obta
ined
by
stoc
king
wat
ers
wit
h ra
inbo
w tr
out,
whi
ch h
ave
5757

of tr
out (
non-
nati
ve
spec
ies)
spre
ad to
the
vari
ous
stre
ams
; als
o th
e en
terp
rise
of
the
Gaw
ler
Fis
h P
rote
ctio
n S
ocie
ty a
nd A
ngle
rs’
Clu
b,
who
con
tinu
e to
sto
ck th
eir
wat
ers
wit
h fi
sh s
uppl
ied
from
the
Bal
lara
t Acc
lim
atiz
atio
n S
ocie
ty. O
ne la
rge
cons
ignm
ent w
as r
ecei
ved
on th
eir
acco
unt b
y on
e of
our
off
icer
s, w
ho g
ave
inst
ruct
ions
as
to th
eir
hand
ling
and
libe
rati
on. T
his
was
a m
ost s
ucce
ssfu
l ven
ture
, as
full
y 99
per
cen
t. w
ere
libe
rate
d in
a h
ealt
h co
ndit
ion.
Dur
ing
the
com
ing
win
ter
we
hope
to b
e ab
le to
sup
ply
the
orde
rs f
or f
ish
that
wer
e ca
ncel
led
owin
g to
the
dry
seas
on, a
nd r
esto
ckin
g w
ill b
e ne
cess
ary
in p
lace
s as
, unf
ortu
nate
ly, t
he e
xtre
me
drou
ght c
ondi
tion
s
thre
aten
to m
ater
iall
y re
duce
the
natu
ral i
ncre
ase
(McI
ntos
h, 1
914)
.
Sto
ckin
g of
Mur
ray
cod
1914
L
ake
Bon
ney,
in th
e S
outh
-Eas
t, ha
s be
en s
tock
ed w
ith
Mur
ray
cod
; a c
onsi
gnm
ent o
f 48
of
thes
e fi
sh w
ere
take
n fr
om W
elli
ngto
n W
est f
or th
e pu
rpos
e, 4
0 of
whi
ch w
ere
libe
rate
d in
goo
d co
ndit
ion.
A s
tric
t wat
ch is
bein
g ke
pt b
y pe
rson
s in
tere
sted
and
the
loca
l ins
pect
or, a
nd th
e pr
otec
tion
of
thes
e fi
sh w
ill b
e st
rict
ly
enfo
rced
(M
cInt
osh,
191
4).
Incr
ease
in th
e nu
mbe
r
of f
ishe
rmen
1914
T
he n
umbe
r of
fis
herm
en h
as in
crea
sed
cons
ider
ably
, whi
ch is
acc
ount
ed f
or b
y fa
rmer
s an
d ot
hers
, who
prev
ious
ly w
orke
d on
the
land
, bei
ng f
orce
d to
look
for
ano
ther
occ
upat
ion
to a
ssis
t in
mak
ing
a li
ving
(McI
ntos
h, 1
914)
.
Goo
d ca
tche
s of
mul
low
ay
1914
T
he s
easo
n fo
r m
ullo
way
has
bee
n an
exc
eedi
ng g
ood
one,
larg
e ha
uls
bein
g m
ade
at th
e va
riou
s ce
ntre
s,
part
icul
arly
so
at th
e M
urra
y M
outh
, whe
re s
ome
fine
fis
h w
ere
land
ed (
McI
ntos
h, 1
914)
.
5858

Impa
cts
of lo
w-f
low
and
dist
ribu
ting
fis
h to
mar
ket
1914
M
UR
RA
Y R
IVE
R. W
ith
such
dry
sea
sons
it w
as o
nly
natu
ral t
hat s
uppl
ies
from
the
rive
r di
stri
cts
wou
ld b
e
shor
t, bu
t, no
twit
hsta
ndin
g th
is, m
any
good
cat
ches
wer
e m
ade
in th
e R
enm
ark
dist
rict
, whi
ch w
ere
rail
ed to
Ade
laid
e ro
m P
arin
ga a
nd L
oxto
n. O
ne e
nter
pris
ing
fish
erm
an h
as f
ound
that
a m
otor
car
is a
val
uabl
e
addi
tion
to h
is p
lant
and
a q
uick
mea
ns o
f tr
ansi
t to
the
rail
way
term
inus
. Ano
ther
gre
at b
enef
it to
the
men
is th
at th
ey c
an p
urch
ase
ice
in w
hich
they
can
pac
k th
eir
fish
, and
wit
h th
ese
faci
liti
es th
e fi
sh a
re m
arke
ted
in p
rim
e co
ndit
ion,
whi
ch c
ompe
nsat
es th
e fi
sher
men
for
the
addi
tion
al e
xpen
se (
McI
ntos
h, 1
914)
.
Goo
d ca
tche
s of
bre
am
1914
In
spec
tor
Fur
ler
repo
rts
that
bre
am f
ishi
ng a
t Noa
rlun
ga in
the
Onk
apar
inga
Riv
er h
as b
een
exce
ptio
nall
y
good
, and
in o
ne w
eek
over
2,0
00 f
ish
wer
e ta
ken
by a
few
ang
lers
. Thi
s st
ream
is a
t pre
sent
spl
endi
dly
stoc
ked
abov
e th
e su
spen
sion
bri
dge,
whe
re o
n ca
lm d
ays
larg
e sh
oals
can
be
seen
(M
cInt
osh,
191
4).
Sta
tus
of M
urra
y co
d 19
14
Tw
o dr
y se
ason
s w
ith
a re
cord
low
riv
er h
ad d
eple
ted
the
fish
sup
plie
s in
thes
e w
ater
s …
(M
cInt
osh,
191
4).
Intr
oduc
tion
of
trou
t
(non
-nat
ive
spec
ies)
1914
It
is e
xcee
ding
ly p
leas
ing
to n
ote
the
succ
ess
obta
ined
by
stoc
king
wat
ers
wit
h ra
inbo
w tr
out,
whi
ch h
ave
spre
ad to
the
vari
ous
stre
ams
; als
o th
e en
terp
rise
of
the
Gaw
ler
Fis
h P
rote
ctio
n S
ocie
ty a
nd A
ngle
rs’
Clu
b,
who
con
tinu
e to
sto
ck th
eir
wat
ers
wit
h fi
sh s
uppl
ied
from
the
Bal
lara
t Acc
lim
atiz
atio
n S
ocie
ty (
McI
ntos
h,
1914
).
Spr
ead
of tr
out (
non-
nati
ve s
peci
es)
1914
R
ainb
ow tr
out a
re in
crea
sing
in L
ake
Ale
xand
rina
, and
it h
as b
een
repo
rted
that
som
e fi
sh h
ave
been
take
n
ther
e. I
t is
asto
nish
ing
the
num
ber
of c
reek
s an
d st
ream
s th
at c
onta
in th
ese
fish
, whi
ch m
ust n
ow s
uffe
r on
5959
acco
unt o
f th
e dr
y se
ason
; bu
t as
they
see
m to
be
wel
l est
abli
shed
, and
are
pro
lifi
c br
eede
rs, t
here
is e
very
reas
on to
bel
ieve
that
wit
h a
retu
rn o
f no
rmal
con
diti
ons
they
wil
l soo
n m
ulti
ply
(McI
ntos
h, 1
914)
.
Sto
ckin
g of
Mur
ray
cod
1914
S
ome
year
s ag
o it
was
dec
ided
to s
tock
Lak
e B
onne
y (n
ear
Mil
lice
nt)
wit
h M
urra
y co
d, b
ut o
win
g to
the
scar
city
of
smal
l fis
h it
was
pos
tpon
ed u
ntil
last
Apr
il, w
hen
thro
ugh
the
kind
ness
of
Mes
srs.
Sta
cey
and
Son
s, o
f W
elli
ngto
n W
est,
the
Dep
artm
ent w
as e
nabl
ed to
sec
ure
a su
pply
. The
se f
ish
wer
e ha
nded
to m
e in
exce
llen
t con
diti
on a
nd p
lace
d in
can
s, in
whi
ch th
ey w
ere
conf
ined
dur
ing
thei
r lo
ng jo
urne
y. I
was
met
at
Mil
lice
nt R
ailw
ay S
tati
on b
y a
trap
kin
dly
supp
lied
by
Mr.
Ros
s G
ordo
n, o
f S
tuck
ey a
nd S
ons,
and
dri
ven
to th
e la
ke. T
he f
ish
wer
e li
bera
ted
in th
eir
new
hom
e, w
here
it is
con
fide
ntly
exp
ecte
d th
ey w
ill d
o w
ell.
Thi
s w
as th
e fi
rst e
xper
imen
t by
the
Dep
artm
ent i
n ca
rryi
ng li
ve M
urra
y co
d lo
ng d
ista
nces
. The
fis
h w
ere
plac
ed in
the
cans
at 5
.30
p.m
. on
the
14th
Apr
il a
nd li
bera
ted
at n
oon
on th
e fo
llow
ing
day
; yet
, aft
er 1
8
hour
s co
nfin
emen
t the
y w
ere
litt
le th
e w
orse
for
thei
r jo
urne
y, a
nd w
hen
rele
ased
sw
am q
uiet
ly a
way
—
som
e of
them
at o
nce
star
ting
to f
eed.
At p
rese
nt th
ere
is a
goo
d su
pply
of
food
, but
I w
ould
rec
omm
end
that
som
e ca
rp b
e pl
aced
in th
ese
wat
ers,
as th
ey a
re a
n ex
cell
ent f
ish
food
and
pro
lifi
c br
eede
rs (
McI
ntos
h, 1
914)
.
Sta
tus
of M
urra
y co
d 19
38
It (
Mur
ray
cod)
is a
ver
y la
rge
spec
ies,
spe
cim
ens
havi
ng b
een
stat
ed to
rea
ch a
wei
ght o
f ov
er 1
50 lb
., an
d
it h
as p
laye
d fo
r ve
ry m
any
year
s a
cons
picu
ous
part
in th
e fi
sh tr
ade—
part
icul
arly
Mel
bour
ne. I
n fa
ct,
cons
ider
ing
the
litt
le th
at h
as b
een
done
eit
her
to p
rote
ct o
r to
pro
paga
te th
e sp
ecie
s, it
is a
won
der
that
it
6060
has
not b
een
alm
ost w
iped
out
(D
akin
and
Kes
teve
n, 1
938)
.
Flu
ctua
tion
in N
ew
Sou
th W
ales
cat
ch o
f
Mur
ray
cod
1938
A
gra
ph (
2) o
f th
e pr
oduc
tion
fro
m th
e in
land
fis
heri
es o
f N
ew S
outh
Wal
es, s
o fa
r as
that
can
be
cons
truc
ted
from
sta
tist
ics
avai
labl
e, s
how
s ro
ughl
y a
seri
es o
f pe
aks
at 1
883,
190
0, 1
918
and
1934
, whi
ch
is a
ppro
xim
atel
y in
sev
ente
en y
ears
cyc
les,
but
whe
ther
suc
h a
peri
odic
flu
ctua
tion
has
gen
uine
ly e
xist
ed
the
natu
re o
f th
e st
atis
tics
doe
s no
t per
mit
us
to s
ay, n
or a
re w
e in
a p
osit
ion
conf
iden
tly
to a
ssig
n th
e ca
uses
of s
uch
fluc
tuat
ions
(D
akin
and
Kes
teve
n, 1
938)
.
Fre
shw
ater
fis
heri
es
and
Mur
ray
cod
1938
F
or o
nly
one
impo
rtan
t mar
ine
fish
, the
tom
my
roug
h, w
as th
ere
a fa
llin
g of
f in
pro
duct
ion
for
1938
, but
ther
e w
as a
trem
endo
us d
rop
in q
uant
itie
s of
fre
sh w
ater
fis
h m
arke
ted
in A
dela
ide.
The
chi
ef r
easo
n fo
r th
e
decl
ine
in c
od a
nd c
allo
p li
es in
the
fact
that
ther
e w
as a
com
plet
e ab
senc
e of
flo
ods
duri
ng th
e pa
st 1
2
mon
ths—
in f
act,
in A
ugus
t, S
epte
mbe
r, a
nd O
ctob
er, t
he s
easo
n of
gre
ates
t pro
duct
ion
in p
revi
ous
year
s,
the
Mur
ray
Riv
er w
as lo
wer
, acc
ordi
ng to
res
iden
ts, t
han
at a
ny o
ther
tim
e si
nce
lock
ing
was
com
plet
ed.
The
clo
se s
easo
n fo
r co
d du
ring
the
mon
ths
Sep
tem
ber
and
Oct
ober
, whe
n no
ne c
ould
be
mar
kete
d, is
anot
her
reas
on f
or th
e dr
op in
pro
duct
ion
of th
at f
ish
(Moo
rhou
se, 1
938)
.
Clo
sed
seas
on f
or
Mur
ray
cod
1938
F
or m
any
year
s S
outh
Aus
tral
ia h
as p
erm
itte
d th
e m
arke
ting
of
Mur
ray
cod
duri
ng th
e br
eedi
ng s
easo
n. I
t
had
been
fou
nd in
193
6 th
at m
ost o
f th
e fi
sh ta
ken
in S
epte
mbe
r w
ere
so f
ull r
oed
as to
be
near
ly m
atur
e. I
n
orde
r to
sav
e po
tent
ial b
reed
ers,
this
Sta
te, a
fter
con
sult
atio
n w
ith
Vic
tori
a an
d N
ew S
outh
Wal
es, d
urin
g
Sep
tem
ber,
193
6, d
ecid
ed to
impo
se a
clo
se s
easo
n on
the
taki
ng o
f th
is f
ish.
Sin
ce s
o fe
w o
f th
em w
ere
6161

foun
d fu
ll r
oed
in N
ovem
ber,
193
6, it
was
con
side
red
suff
icie
nt f
or th
e m
omen
t to
prev
ent t
heir
bei
ng ta
ken
duri
ng th
e m
onth
s of
Sep
tem
ber
and
Oct
ober
, but
Vic
tori
a an
d N
ew S
outh
Wal
es, b
oth
of w
hom
had
for
man
y ye
ars
had
a cl
ose
seas
on d
urin
g O
ctob
er a
nd N
ovem
ber,
mer
ely
adde
d S
epte
mbe
r to
that
sea
son.
An
inte
nsiv
e st
udy
of th
is f
ish
was
com
men
ced
by a
n of
fice
r of
the
New
Sou
th W
ales
Fis
hery
Dep
artm
ent
duri
ng th
e 19
37 b
reed
ing
seas
on, a
nd th
e ve
ry in
conc
lusi
ve r
esul
ts o
btai
ned
by h
im w
ere
publ
ishe
d in
Bul
leti
n N
o. 1
, 193
8, o
f th
e N
ew S
outh
Wal
es C
hief
Sec
reta
ry’s
Dep
artm
ent (
Moo
rhou
se, 1
938)
.
Sta
tus
of in
land
fish
erie
s
1938
T
he 2
25 li
cens
ed f
ishe
rmen
who
hav
e ha
d al
lott
ed to
them
leng
ths
of th
e M
urra
y R
iver
in w
hich
to f
ish
excl
usiv
ely,
exp
erie
nce
a ve
ry d
iffi
cult
per
iod
duri
ng th
e pa
st y
ear,
and
the
maj
orit
y ha
d to
obt
ain
exem
ptio
n fr
om f
ishi
ng th
eir
reac
hes
in o
rder
to ta
ke u
p te
mpo
rari
ly s
ome
othe
r oc
cupa
tion
. How
ever
, in
gene
ral,
the
pric
es f
or th
ese
fish
hav
e be
en m
uch
high
er th
an in
pre
viou
s ye
ars,
so
that
thou
ght s
mal
l
quan
titi
es w
ere
take
n, r
esul
ts o
btai
ned
from
a m
onet
ary
poin
t of
view
wer
e re
ason
ably
goo
d (M
oorh
ouse
,
1938
).
Loc
al s
ale
of in
land
fish
erie
s ca
tch
1938
N
umbe
rs o
f M
urra
y fi
sher
men
hav
e de
cide
d to
mar
ket t
heir
fis
h in
the
tow
nshi
ps a
long
the
Riv
er M
urra
y,
and
from
this
loca
l tra
de, r
esid
ents
hav
e be
nefi
ted
cons
ider
ably
. Lar
ge q
uant
itie
s, to
o, a
re m
arke
ted
in
Mel
bour
ne. N
o ac
cura
te in
form
atio
n on
the
amou
nts
so d
ispo
sed
of h
as b
een
obta
ined
(M
oorh
ouse
, 193
8).
Sta
tus
of f
resh
wat
er
cray
fish
1938
A
fre
sh w
ater
Cru
stac
ean,
the
Mur
ray
lobs
ter,
mak
es a
del
icat
e fi
sh, a
nd a
rea
dy s
ale
is f
ound
for
it in
the
vari
ous
tow
ns a
long
the
Mur
ray
Riv
er. O
f co
urse
, no
reco
rds
of q
uant
itie
s m
arke
ted
are
avai
labl
e, b
ut
6262

fish
erm
en s
tate
that
ther
e w
as a
ver
y se
riou
s de
clin
e in
the
quan
titi
es ta
ken
by th
em th
is y
ear
(Moo
rhou
se,
1938
).
Dif
ficu
lty
of
tran
spor
ting
fis
h
1938
C
ON
DE
MN
ED
FIS
H. …
The
Bac
teri
oloi
st a
ttac
hed
to th
e F
ishe
ries
Sec
tion
of
the
Cou
ncil
for
Sci
enti
fic
and
Indu
stri
al R
esea
rch
in a
cop
y of
his
rep
ort o
n “T
he M
arke
ting
of
Fis
h in
Sou
th A
ustr
alia
” (n
ot y
et
publ
ishe
d) h
as c
omm
ente
d ad
vers
ely
on th
e tr
ansp
ort s
uppl
ied
to f
ishe
rmen
in th
e G
oolw
a-M
ilan
g ar
ea.
Kno
win
g w
hat a
ver
y la
rge
amou
nt o
f fi
sh f
rom
thos
e po
rts
is c
onde
mne
d it
wou
ld a
ppea
r th
at a
cha
nge
in
the
tran
spor
t fac
ilit
ies
affo
rded
this
are
a is
cal
led
for
(Moo
rhou
se, 1
938)
.
Typ
es o
f ge
ar u
sed
1938
T
YP
ES
OF
FIS
HIN
G G
EA
R. M
esh
nets
are
in v
ery
com
mon
use
in th
e L
akes
and
Coo
rong
whe
re la
rge
quan
titi
es o
f b
utte
rfis
h an
d m
ulle
t are
bei
ng c
aptu
red
(Moo
rhou
se, 1
938)
.
Tag
ging
of
fish
spe
cies
for
rese
arch
1938
In
ord
er to
thro
w s
ome
ligh
t on
the
grow
th-r
ate
and
mig
rati
on o
f ou
r co
mm
erci
al f
ish,
tagg
ing
expe
rim
ents
have
bee
n co
mm
ence
d. I
n th
is ta
ggin
g of
fis
h w
hich
has
bee
n ca
rrie
d ou
t on
two
fres
hwat
er s
peci
es, a
nd
two
seaw
ater
type
s, m
any
fish
erm
en h
ave
give
n in
valu
able
ass
ista
nce.
Mur
ray
cod
and
call
op w
ere
the
firs
t
to r
ecei
ve a
tten
tion
, but
whi
ting
and
sna
pper
hav
e no
w b
een
adde
d to
the
list
(M
oorh
ouse
, 193
8).
Intr
oduc
tion
of
trou
t
(non
-nat
ive
spec
ies)
1938
In
193
7 th
e fi
sh h
atch
ery
at B
alla
rat c
ould
not
sup
ply
this
Sta
te, b
ut in
193
8 so
me
7,00
0 ad
vanc
ed f
ry o
f
brow
n tr
out,
appr
oxim
atel
y 2
½in
. in
leng
th w
ere
obta
ined
. Wit
h th
e co
-ope
rati
on o
f ho
nora
ry in
spec
tors
thes
e fi
sh w
ere
libe
rate
d in
the
foll
owin
g st
ream
s:--
Tor
rens
, Onk
apar
inga
, Ang
as, F
inni
ss, C
ox’s
, and
6363

Gaw
ler.
Som
e fe
w m
ore,
as
an e
xper
imen
t, w
ere
libe
rate
d in
dam
s an
d la
rge
wat
erho
les
and
lake
s. A
rep
ort
on th
e m
anne
r in
whi
ch th
ese
fish
wil
l dev
elop
is e
ager
ly a
wai
ted
(Moo
rhou
se, 1
938)
.
Goo
d ca
tche
s of
mul
low
ay
1939
B
utte
rfis
h, th
e m
ost i
mpo
rtan
t fis
h pa
ssin
g th
roug
h th
e A
dela
ide
mar
ket a
lso
reac
hed
a pr
oduc
tion
pea
k no
t
note
d fo
r m
any
year
s, w
ith
the
resu
lt th
at it
s pr
ice
fell
to a
s lo
w a
s 1
½d.
per
lb (
Moo
rhou
se, 1
939)
.
Tag
ging
of
fish
spe
cies
for
rese
arch
1939
(c
) T
AG
GIN
G O
F F
ISH
. The
tagg
ing
of w
hiti
ng, s
napp
er, M
urra
y co
d an
d ca
llop
was
con
tinu
ed. …
Six
Mur
ray
cod
wer
e re
capt
ured
aft
er ta
ggin
g an
d li
bera
tion
. Som
e ha
d go
ne u
pstr
eam
, oth
ers
had
mov
ed
dow
nstr
eam
, but
the
gene
ral m
igra
tion
was
ver
y sl
ight
dis
tanc
es. T
he g
reat
est g
row
th w
as n
oted
in a
cod
libe
rate
d on
12th
Sep
tem
ber,
193
7, b
ut M
r. J
. F. T
. Hei
nick
e an
d re
capt
ured
by
him
on
1st J
uly,
193
8. I
t had
grow
n 1i
n. w
hich
rep
rese
nted
an
incr
ease
in w
eigh
t of
appr
oxim
atel
y ½
lb (
Moo
rhou
se, 1
939)
.
Siz
e li
mit
s an
d cl
osed
seas
on f
or M
urra
y co
d
1939
O
n th
e M
urra
y R
iver
, Mur
ray
cod
may
not
be
take
n un
less
they
are
of
over
the
pres
crib
ed le
ngth
, viz
., 15
in.
The
re is
als
o a
clos
e se
ason
res
tric
tion
on
cod.
Thi
s is
fix
ed f
rom
Sep
tem
ber
and
Oct
ober
eac
h ye
ar
(Moo
rhou
se, 1
939)
.
In o
ur o
ther
fre
shw
ater
str
eam
s, th
e im
port
ed tr
out (
eith
er b
row
n or
rai
nbow
) m
ay n
ot le
gall
y be
take
n
unle
ss th
ey a
re o
f ov
er th
e m
inim
um le
ngth
, viz
., 10
in. T
here
is, f
or th
is f
ish
also
, a c
lose
sea
son
whi
ch n
ow
exte
nds
from
1st M
ay to
31st
Aug
ust (
Moo
rhou
se, 1
939)
.
6464
Impa
cts
of f
lood
ing
and
stat
us o
f in
land
fish
erie
s
1940
M
UR
RA
Y R
IVE
R. H
eavy
flo
odin
g of
the
Mur
ray
rive
r, w
hich
last
ed th
roug
h th
e m
onth
s of
Aug
usta
,
Sep
tem
ber,
Oct
ober
and
Nov
embe
r, c
onst
itut
ed f
avou
rabl
e co
ndit
ions
for
the
capt
ure
of la
rge
quan
titi
es o
f
rive
r fi
sh. S
epte
mbe
r an
d O
ctob
er a
re a
clo
se s
easo
n fo
r M
urra
y co
d, s
o on
ly c
allo
p an
d br
eam
can
be
mar
kete
d du
ring
thos
e m
onth
s. F
ishe
rmen
alo
ng s
ever
al p
arts
of
the
rive
r of
ten
caug
ht a
s m
uch
as 4
0lb.
thes
e tw
o fi
sh (
besi
des
quan
titi
es o
f co
d w
hich
had
to b
e re
leas
e) in
eac
h dr
um n
et. T
he n
umbe
rs o
f ne
ts
used
ther
efor
e w
ere
ofte
n re
duce
d to
as
few
as
six
per
man
. A c
onse
rvat
ive
esti
mat
e sh
ows
that
25
tons
of
call
op a
nd b
ream
per
wee
k w
ere
caug
ht d
urin
g O
ctob
er. D
espi
te th
e he
avy
prod
ucti
on, t
he q
uant
ity
of c
od
and
call
op w
hich
pas
sed
thro
ugh
the
Ade
laid
e fi
sh m
arke
t dur
ing
the
year
did
not
con
stit
ute
a re
cord
,
mai
nly
beca
use
a la
rge
prop
orti
on o
f th
e ca
tch
was
sol
d at
loca
l mar
kets
, whi
ch th
is d
epar
tmen
t has
bee
n
urgi
ng f
ishe
rmen
to e
xplo
it. S
ome
mor
e en
terp
risi
ng f
ishe
rmen
eve
n de
live
red
thei
r fi
sh to
tow
ns a
s fa
r
rem
oved
fro
m th
e M
urra
y ri
ver
as J
ames
tow
n, P
eter
boro
ugh
and
Wir
raba
ra. C
onsi
dera
ble
quan
titi
es, a
s
usua
l, w
ere
also
con
sign
ed to
Mel
bour
ne.
Whi
le th
ese
larg
e qu
anti
ties
of
fish
wer
e be
ing
capt
ured
in S
outh
Aus
tral
ia’s
por
tion
of
the
Mur
ray
rive
r, th
e
mun
icip
alit
y of
Alb
ury
(New
Sou
th W
ales
) su
gges
ted
that
ow
ing
to th
e de
plet
ion
of o
ur f
resh
-wat
er f
ish
all
com
mer
cial
fis
hing
the
Mur
ray
rive
r sh
ould
be
proh
ibit
ed f
or tw
o ye
ars.
Fro
m th
is is
may
be
infe
rred
that
cond
itio
ns g
ener
ally
in S
outh
Aus
tral
ia’s
par
t of
the
rive
r m
ust b
e ve
ry d
iffe
rent
fro
m th
ose
in th
e N
ew
Sou
th W
ales
por
tion
. To-
day
the
Mur
ray
in S
outh
Aus
tral
ia c
an b
e re
gard
ed a
s a
rive
r in
mag
nitu
de o
nly
6565

duri
ng f
lood
per
iods
. At o
ther
tim
es it
is m
erel
y a
seri
es o
f se
ven
larg
e na
rrow
lake
s, d
ue to
the
lock
ing
syst
em. I
n th
ese
lake
s, e
ach
appr
oxim
atel
y 50
mil
es in
leng
th, a
nd o
f va
ryin
g de
pths
, are
fou
nd p
lank
ton
(pri
ncip
ally
cop
epod
s), s
hrim
ps, y
abbi
es, a
nd s
mal
l fis
h su
ch a
s sm
elts
and
car
p, u
pon
whi
ch c
od a
nd c
allo
p
are
depe
nden
t for
foo
d.
The
193
9 fl
oods
dis
clos
ed v
ast n
umbe
rs o
f M
urra
y fi
sh in
our
por
tion
of
the
rive
r. S
o nu
mer
ous
wer
e th
ey
and
so e
asil
y w
ere
they
cau
ght t
hat m
any
fish
erm
en s
ugge
sted
a r
evis
ion
of th
e m
inim
um w
eigh
ts. T
hey
cons
ider
ed th
e si
ze o
f ca
llop
and
of
brea
m s
houl
d be
rai
sed
to 1
2in.
and
of
cod
to 1
8in.
The
se s
ugge
sted
incr
ease
s w
ere
stro
ngly
sup
port
ed b
y th
e m
arke
ting
pro
prie
tors
, and
by
the
Ade
laid
e fi
shm
onge
rs, a
ll o
f
who
m a
t tim
es e
xper
ienc
e co
nsid
erab
le d
iffi
cult
y in
dis
posi
ng o
f th
ese
fish
and
oth
ers
whi
ch ju
st c
ome
wit
hin
the
pres
ent p
resc
ribe
d m
inim
um w
eigh
t. T
he s
ugge
stio
ns w
ere
not a
dopt
ed (
Moo
rhou
se, 1
940)
.
Tag
ging
of
fish
spe
cies
for
rese
arch
1940
(a
) T
AG
GIN
G O
F F
ISH
. The
tagg
ing
of w
hiti
ng, s
napp
er, M
urra
y co
d an
d ca
llop
, was
con
tinu
ed, a
nd
muc
h va
luab
le a
ssis
tanc
e w
as g
iven
by
vari
ous
fish
erm
en. O
ne o
f th
e m
ost i
nter
esti
ng m
igra
tion
s w
as th
at
carr
ied
out b
y a
Mur
ray
cod
whi
ch, t
hree
day
s af
ter
its
libe
rati
on a
t Loc
k 15
, Rob
inva
le, w
as c
aptu
red
65
mil
es u
pstr
eam
fro
m it
s po
int o
f li
bera
tion
. As
has
been
pre
viou
sly
foun
d, m
igra
tion
can
als
o be
dow
nstr
eam
. Thi
s w
as s
how
n by
a f
ish
libe
rate
d ne
ar B
lanc
heto
wn
whi
ch, a
wee
k af
ter
libe
rati
on, w
as
foun
d 5
mil
es d
owns
trea
m (
Moo
rhou
se, 1
940)
.
6666

Mig
rati
on o
f fi
sh a
nd
oper
atio
n of
wei
r fi
sh
ladd
er
1940
(c
) F
ISH
MIG
RA
TIO
N. M
urra
y R
iver
Fis
h.—
Fro
m in
form
atio
n su
ppli
ed th
is y
ear
by th
e lo
ck m
aste
r at
Loc
k 15
, at R
obin
vale
, the
fol
low
ing
fish
pas
sed
up th
e fi
sh la
dder
at t
hat l
ock:
--36
3 co
d (1
76 o
f w
hich
wer
e ta
gged
), 1
,510
cal
lop,
1 M
acqu
arie
per
ch, 5
,153
gru
nter
or
silv
er p
erch
, 303
Eng
lish
per
ch, a
nd 4
catf
ish.
Fro
m J
uly
to D
ecem
ber
the
Mur
ray
rive
r w
as, a
ccor
ding
to th
e lo
ckm
aste
r’s
repo
rt, s
o hi
gh th
at th
e lo
ck a
nd
wei
r w
ere
left
ope
n. D
urin
g M
arch
, on
the
othe
r ha
nd, t
here
was
not
suf
fici
ent w
ater
to f
low
ove
r th
e w
eir.
No
chec
k on
fis
h us
ing
the
ladd
er w
as m
ade
duri
ng th
ose
mon
ths.
Of
the
fish
men
tion
ed a
bove
the
cod
wer
e
repo
rted
to h
ave
vari
ed f
rom
9in
. to
28in
. in
leng
th ;
call
op f
rom
6in
. to
20in
. ; a
nd th
e si
lver
per
ch f
rom
8in.
to 1
6in
(Moo
rhou
se, 1
940)
.
Poo
r ca
tche
s of
mul
low
ay
1941
…
it w
ill b
e se
en th
at, t
houg
h th
e qu
anti
ty o
f fi
sh p
assi
ng th
roug
h th
e m
arke
t thi
s ye
ar w
as o
nly
slig
htly
less
than
that
of
1937
-38,
the
valu
e re
ceiv
ed w
as £
1,00
0 m
ore.
But
terf
ish
– th
e m
ost i
mpo
rtan
t fis
h in
the
Ade
laid
e fi
sh tr
ade
– sh
owed
a b
ig d
rop
in p
rodu
ctio
n co
mpa
red
wit
h th
e qu
anti
ties
take
n du
ring
the
last
two
year
s an
d re
turn
ed to
the
1937
-38
leve
l. T
houg
h th
e qu
anti
ty m
arke
ted
this
yea
r w
as a
lmos
t the
sam
e as
that
for
193
7-38
, it r
each
ed o
nly
two-
thir
ds o
f th
e va
lue,
due
pro
babl
y to
the
mor
e ev
en m
arke
ting
not
iced
in 1
937.
In
the
earl
y pa
rt o
f th
e ye
ar 1
940-
41 s
uch
larg
e qu
anti
ties
wer
e m
arke
ted
(on
som
e da
ys a
s m
uch
as
10 to
ns a
rriv
ed f
or d
istr
ibut
ion)
that
pri
ces
fluc
tuat
ed v
iole
ntly
… (
Moo
rhou
se, 1
941)
.
6767

19
41
No
men
tion
of M
urra
y co
d (M
oorh
ouse
, 194
1)
Poo
r ca
tche
s of
mul
low
ay
1942
G
EN
ER
AL
RE
MA
RK
S—
The
dec
line
in b
utte
rfis
h su
ppli
es n
ot o
nly
from
the
Mur
ray
mou
th a
nd C
ooro
ng
but a
lso
from
all
oth
er f
ishi
ng c
entr
es n
oted
last
yea
r, c
onti
nued
and
rea
ched
a v
ery
low
leve
l (M
oorh
ouse
,
1942
).
Impo
rtan
ce o
f in
land
fish
erie
s
1942
T
he p
rinc
ipal
sou
rces
of
Ade
laid
e’s
supp
ly a
re th
e M
urra
y R
iver
, the
Mur
ray
Lak
es a
nd C
ooro
ng, t
he p
orts
of G
ulf
St.
Vin
cent
and
the
port
s on
the
east
ern
side
of
Spe
ncer
Gul
f (M
oorh
ouse
, 194
2).
Impo
rtan
ce o
f in
land
fish
erie
s
1942
T
he A
dela
ide
mar
ket r
egul
arly
rec
eive
s co
nsid
erab
le q
uant
itie
s of
Mur
ray
Riv
er f
ish
(cod
and
cal
lop)
.
Whe
n fl
oodi
ng o
f th
e ri
ver
occu
rs th
ese
supp
lies
are
oft
en s
o la
rge
as to
ove
r-ta
x th
e m
arke
t. O
n su
ch
occa
sion
s or
whe
n th
ere
is a
n ex
cess
of
sea
fish
, the
pri
ces
of a
ll f
ish
are
gene
rall
y lo
w (
Moo
rhou
se, 1
942)
.
Tag
ging
of
gold
en
perc
h fo
r re
sear
ch
1942
O
win
g to
the
pres
ence
of
quit
e la
rge
num
bers
of
smal
l cal
lop
and
smal
l per
ch in
Lak
e A
lexa
ndri
na a
nd
Lak
e A
lber
t hun
dred
s ha
ve b
een
mes
hed
in n
ets
set t
o ca
ptur
e m
ulle
t. O
ne in
tere
sted
fis
herm
an (
Mr.
D.
Cre
mer
) ha
s al
read
y ta
gged
a v
ery
larg
e nu
mbe
r of
thes
e ca
llop
in th
e ho
pes
that
som
e in
tere
stin
g
disc
over
ies
wil
l res
ult (
Moo
rhou
se, 1
942)
.
19
42
No
men
tion
of M
urra
y co
d (M
oorh
ouse
, 194
2)
Lar
ge c
atch
es o
f 19
43
Fis
h su
ppli
es w
ere
som
ewha
t sca
rce
duri
ng th
ose
stor
my
mon
ths
and
who
lesa
le p
rice
s re
mai
ned
high
.
6868

cong
olli
s F
ortu
nate
ly, c
ongo
llis
app
eare
d ag
ain
in th
e L
akes
dur
ing
the
win
ter
and
help
ed th
e m
arke
t car
ry o
n th
roug
h
this
dif
ficu
lt s
easo
n. T
hese
fis
h ha
ve n
ot o
ccur
red
in b
ig n
umbe
rs th
is w
inte
r, b
ut r
uffs
whi
ch w
ere
take
n in
cons
ider
able
qua
ntit
ies
fill
ed th
e de
man
d fo
r fi
sh o
f sm
all s
ize.
Lar
ge f
ish
capa
ble
of s
uppl
ying
the
requ
irem
ents
of
the
cutl
et tr
ade
wer
e al
so in
rat
her
shor
t sup
ply
due
mai
nly
to th
e fu
rthe
r fa
ll th
is y
ear
in
butt
erfi
sh la
ndin
gs (
Moo
rhou
se, 1
943)
.
19
43
No
men
tion
of M
urra
y co
d (M
oorh
ouse
, 194
3)
19
44
No
men
tion
of i
nlan
d fi
sher
ies
(Moo
rhou
se, 1
945)
19
45
No
men
tion
of i
nlan
d fi
sher
ies
(Moo
rhou
se, 1
945)
19
46
No
men
tion
of i
nlan
d fi
sher
ies
(Moo
rhou
se, 1
946)
Bre
edin
g of
trou
t (no
n-
nati
ve s
peci
es)
1947
B
RO
WN
TR
OU
T. T
he b
reed
ing
of tr
out w
as r
esum
ed o
n a
smal
l sca
le th
is y
ear
afte
r a
laps
e of
sev
eral
year
s. H
onor
ary
Insp
ecto
r M
alpa
s, w
hose
ser
ious
illn
ess
had
prev
ente
d a
cont
inua
nce
of th
e w
ork
begu
n by
him
in 1
940,
for
tuna
tely
rec
over
suf
fici
entl
y to
sup
ervi
se th
e w
ork
of th
is s
on. S
ever
al th
ousa
nd f
ish
wer
e
hatc
hed.
A p
roto
zoan
par
asit
e, d
ue to
ove
rcro
wdi
ng, w
as d
isco
vere
d in
the
late
r st
ages
. Thi
s to
ok r
elat
ivel
y
heav
y to
ll o
f th
e yo
ung
fry.
App
roxi
mat
ely
2,00
0 fi
sh w
ere
rele
ased
(M
oorh
ouse
, 194
7).
Dis
cuss
ion
rega
rdin
g 19
47
DE
PL
ET
ION
. Thi
s is
sur
ely
an in
appr
opri
ate
wor
d to
use
in A
ustr
alia
whe
re th
e fi
sher
ies
are
mar
kedl
y
6969

the
stat
us o
f S
outh
Aus
tral
ian
fish
erie
s
unde
r-de
velo
ped
and
have
suc
h a
rela
tive
ly s
hort
his
tory
com
pare
d w
ith
thos
e ov
erse
as. W
hen
Dr.
Tho
mps
on, C
hief
of
the
Fis
heri
es D
ivis
ion
of th
e C
.S.I
.R.,
who
had
exp
ress
ed th
e op
inio
n th
at S
outh
Aus
tral
ian
in-s
hore
wat
ers
wer
e “p
roba
bly
depl
eted
exc
ept p
ossi
bly
for
the
whi
ting
fis
hery
,” w
as a
sked
why
, it t
hat w
ere
the
case
, the
dep
artm
enta
l bea
ch n
etti
ng te
sts
on f
ish
othe
r th
at w
hiti
ng h
as b
een
so
succ
essf
ul, h
e re
plie
d th
at m
y te
sts
wer
e m
ade
“in
very
sha
llow
wat
er w
hich
was
mor
e or
less
vir
gin
grou
nd.”
I fa
il to
see
how
a s
tate
of
depl
etio
n by
ove
r-fi
shin
g ca
n be
rec
onci
led
wit
h vi
rgin
wat
ers.
…
Whe
n a
fish
that
is n
orm
ally
ple
ntif
ul b
ecom
es s
carc
e of
doe
s no
t fre
quen
t its
usu
al h
aunt
s th
e ca
use
is o
ften
ascr
ibed
in s
ome
quar
ters
to d
eple
tion
, reg
ardl
ess
of th
e fa
ct th
at p
erha
ps n
o ad
equa
te in
vest
igat
ions
of
the
posi
tion
hav
e be
en m
ade.
How
eas
y it
is to
dra
w w
rong
con
clus
ions
abo
ut f
ish
stoc
ks is
illu
stra
ted
in th
e
foll
owin
g. …
Tw
o ot
her
spec
ies
have
als
o be
en s
carc
e, n
amel
y, th
e m
ullo
way
or
butt
erfi
sh, w
hich
is o
f gr
eat c
omm
erci
al
impo
rtan
t, an
d th
e si
lver
whi
ting
whi
ch is
not
so
impo
rtan
t. …
The
mul
low
ay h
ave
also
bee
n ca
pric
ious
in th
eir
appe
aran
ces.
Yea
rs a
go b
ig h
auls
of
them
cou
ld b
e ta
ken
in th
e sh
allo
ws
and
the
“run
s” to
the
nort
h of
Ade
laid
e. T
hey
are
not t
here
now
but
in 1
938
and
1939
they
7070

wer
e pr
esen
t in
very
larg
e nu
mbe
rs in
the
Mur
ray
Mou
th, l
akes
, and
Coo
rong
. Tod
ay o
nly
a fe
w a
re ta
ken
ther
e. T
he c
omin
g in
to o
pera
tion
of
the
barr
ages
was
coi
ncid
enta
l wit
h th
e sc
arci
ty o
f th
e m
ullo
way
in th
e
Coo
rong
and
man
y fi
sher
men
are
con
vinc
ed th
at th
e ad
vent
of
the
barr
ages
act
uall
y ca
used
the
mul
low
ay to
leav
e th
e C
ooro
ng. B
ut w
hat r
easo
n ca
n be
adv
ance
d fo
r th
e fa
ilur
e of
this
spe
cies
to f
requ
ent t
he “
runs
” to
the
nort
h of
Ade
laid
e w
here
no
barr
ages
exi
st?
It m
ight
be
men
tion
ed h
ere
that
mul
low
ay w
ere
once
an
impo
rtan
t fis
h co
mm
erci
ally
in th
e G
ipps
land
Lak
es (
Lak
es E
ntra
nce)
of
Vic
tori
a ; t
hey
have
alm
ost
disa
ppea
red
from
ther
e al
so. S
ome
fish
erm
en th
ere
ascr
ibed
thei
r di
sapp
eara
nce
to th
e op
enin
g of
the
Gip
psla
nd la
kes
to th
e se
a. O
n th
e ot
her
hand
thes
e fi
sh h
ave
appe
ared
in n
umbe
rs a
long
the
foot
of
Yor
ke
Pen
insu
la w
here
no
fres
h w
ater
str
eam
s en
tre
the
sea
(Moo
rhou
se, 1
947)
.
Intr
oduc
tion
of
redf
in
perc
h (n
on-n
ativ
e
spec
ies)
1948
E
ngli
sh p
erch
, whi
ch a
re g
ood
spor
ting
fis
h an
d ve
ry p
alat
able
, hav
e be
en li
bera
ted
in m
any
priv
atel
y-
owne
d da
ms
in S
outh
Aus
tral
ia. M
any
orde
rs f
or th
ese
fish
cou
ld n
ot b
e su
ppli
ed la
st y
ear.
It i
s kn
own
that
so lo
ng a
s su
ch f
ood
as s
hrim
ps, y
abbi
es, a
nd m
inno
ws
is p
rese
nt th
e pe
rch
thri
ve a
nd m
ulti
ply.
Man
y
farm
ers
now
enj
oy n
ot o
nly
the
rela
xati
on o
f fi
shin
g on
thei
r ow
n pr
oper
ties
, but
als
o th
e co
nsum
ing
of
pala
tabl
e fr
esh
fish
(M
oorh
ouse
, 194
8).
19
48
No
men
tion
of i
nlan
d fi
sher
ies
(Moo
rhou
se, 1
948)
.
19
49
No
men
tion
of i
nlan
d fi
sher
ies
(Moo
rhou
se, 1
949)
.
7171

19
50
No
men
tion
of i
nlan
d fi
sher
ies
(Moo
rhou
se, 1
950)
Impa
cts
of f
lood
ing
and
stat
us o
f in
land
fish
erie
s
1951
M
UR
RA
Y R
IVE
R. T
his
year
, the
sec
ond
in s
ucce
ssio
n, h
eavy
flo
odin
g of
the
Mur
ray
Riv
er g
ave
favo
urab
le c
ondi
tion
s fo
r th
e ca
ptur
e of
larg
e qu
anti
ties
of
fres
h w
ater
fis
h, b
ut th
eir
who
lesa
le p
rice
in
Ade
laid
e of
ten
fell
so
low
as
to m
ake
the
catc
hing
una
ttra
ctiv
e to
man
y fi
sher
men
. Aga
in, a
s in
pre
viou
s
floo
ding
s, th
e qu
anti
ties
rea
chin
g th
e A
dela
ide
mar
ket d
id n
ot c
onst
itut
e a
reco
rd. T
here
wer
e, h
owev
er,
heav
y sa
les
at to
wns
and
vil
lage
s al
ong
or n
ear
the
rive
r. F
ishe
rmen
ope
rati
ng in
the
Mur
ray
Lak
es
(Ale
xand
rina
and
Alb
ert)
als
o re
port
ed th
e pr
esen
ce o
f ev
er-i
ncre
asin
g qu
anti
ties
of
fres
h w
ater
fis
h. T
hese
men
are
taki
ng h
eart
aga
in a
fter
the
loss
of
thei
r sa
lt w
ater
fis
hery
whi
ch f
ollo
wed
the
clos
ing
of th
e
barr
ages
at G
oolw
a. F
or a
per
iod
duri
ng th
e ch
ange
-ove
r fr
om s
alt w
ater
to f
resh
wat
er c
ondi
tion
s in
the
area
s be
cam
e a
“des
ert.”
Slo
wly
fre
sh w
ater
life
bec
ame
esta
blis
hed.
Tod
ay th
e qu
antit
y of
fis
h pr
esen
t
mak
es f
ishi
ng a
pro
fita
ble
occu
pati
on o
nce
mor
e. A
mat
eur
fish
erm
en, t
oo, e
njoy
ed g
ood
catc
hes.
In 1
939,
whi
le la
rge
quan
titi
es o
f fi
sh w
ere
bein
g ca
ptur
e in
Sou
th A
ustr
alia
’s p
orti
on o
f th
e M
urra
y R
iver
,
the
Mun
icip
alit
y of
Alb
ury
sugg
este
d th
at a
ll c
omm
erci
al f
ishi
ng s
houl
d be
pro
hibi
ted
in th
e M
urra
y R
iver
for
a pe
riod
of
year
s. T
he s
ugge
stio
n w
as n
ot a
dopt
ed. S
imil
ar r
eque
sts
for
the
tota
l pro
hibi
tion
of
fish
ing
or
for
the
intr
oduc
tion
of
seve
re r
estr
icti
ons
on th
e ta
king
of
Mur
ray
fish
hav
e be
en m
ade
by v
ario
us in
ters
tate
bodi
es f
rom
tim
e to
tim
e si
nce
then
. The
mos
t rec
ent r
eque
st f
or a
com
plet
e cl
osur
e, m
ade
in J
une,
195
1,
7272

cam
e fr
om th
e V
icto
rian
Pis
cato
rial
Cou
ncil
. It,
too,
was
not
app
rove
d (M
oorh
ouse
, 195
1).
19
52
No
men
tion
of i
nlan
d fi
sher
ies
(Moo
rhou
se, 1
952)
19
53
No
men
tion
of i
nlan
d fi
sher
ies
(Moo
rhou
se, 1
953)
Intr
oduc
tion
of
redf
in
perc
h (n
on-n
ativ
e
spec
ies)
1953
L
IVE
FIS
H D
IST
RIB
UT
ION
. The
libe
rati
ng o
f E
ngli
sh p
erch
in p
riva
tely
-ow
ned
dam
s w
as c
onti
nued
and
15 a
ppli
cati
ons
wer
e su
ppli
ed. …
(M
oorh
ouse
, 195
3)
Issu
ing
of lo
cati
on-
base
d li
cenc
es to
fish
erm
en
1954
R
IVE
R M
UR
RA
Y R
ES
ER
VE
S. T
he R
iver
Mur
ray
is d
ivid
ed in
to r
each
es o
f le
ngth
s va
ryin
g fr
om h
alf
a
mil
e to
two
mil
es. T
hese
wer
e fo
rmer
ly a
llot
ted
to f
ishe
rmen
who
wer
e th
e on
ly p
erso
ns p
erm
itte
d to
use
com
mer
cial
fis
hing
gea
r su
ch a
s cr
oss
line
s an
d dr
um n
ets
in th
e ca
ptur
e of
fis
h. A
ll o
ther
per
sons
wer
e
rest
rict
ed to
han
dlin
ing
for
the
fish
they
wis
hed
to c
atch
. The
tow
ns w
ere
esta
blis
hed
alon
g th
e ri
ver.
Res
iden
ts p
ress
ed f
or p
erm
issi
ons
to u
se c
ross
line
s an
d dr
um n
ets
in th
e ca
ptur
e of
thei
r fi
sh. F
ishe
rmen
obje
cted
to th
is in
trus
ion
so it
was
dec
ided
that
as
soon
as
a re
ach-
hold
er n
ear
a to
wn
gave
up
his
area
the
reac
h w
ould
be
decl
ared
a to
wn
fish
ing
rese
rve.
At p
rese
nt to
wn
fish
ing
rese
rves
are
est
abli
shed
at
Wel
ling
ton,
Tai
lem
Ben
d, M
urra
y B
ridg
e, M
ypol
onga
, Cal
oote
, Man
num
, Bow
hill
, Cou
rnam
ount
, Sw
an
Rea
ch, B
lanc
heto
wn,
Mur
bko,
Mor
gan,
Cad
ell,
Ram
co, W
aike
ries
, Kin
gsto
n, C
obdo
gla,
Lox
ton,
Ber
ri,
Lyr
up, a
nd R
enm
ark.
Thi
s po
licy
is g
ivin
g ge
nera
l sat
isfa
ctio
n (M
oorh
ouse
, 195
4).
7373

19
55
No
men
tion
of i
nlan
d fi
sher
ies
(Moo
rhou
se, 1
955)
.
Dec
line
of
inla
nd
fish
erie
s ca
tche
s
1956
T
he k
now
n pr
oduc
tion
of
fish
(al
l spe
cies
exc
ept c
rayf
ish)
am
ount
ed to
6,5
30,0
00 lb
. Thi
s re
pres
ente
d an
incr
ease
of
30,0
00 lb
. ove
r fi
gure
s qu
ote
last
yea
r. T
here
was
a m
arke
d in
crea
se th
is y
ear
in th
e pr
oduc
tion
of tu
na, m
ulle
t, sn
ook,
whi
ting
, and
gar
fish
. A s
erio
us d
ecli
ne in
Aus
tral
ian
salm
on p
rodu
ctio
n du
e
prin
cipa
lly
to f
ishe
rmen
turn
ing
thei
r at
tent
ion
to o
ther
fis
h, a
nd a
big
fal
l in
fish
fro
m th
e M
urra
y R
iver
,
nam
ely
Mur
ray
cod,
cal
lop,
and
mul
low
ay, d
ue to
hea
vy a
nd c
onti
nuou
s fl
oods
, alm
ost o
utw
eigh
ed th
ose
incr
ease
s (M
oorh
ouse
, 195
6).
Bre
edin
g an
d
intr
oduc
tion
of
trou
t
(non
-nat
ive
spec
ies)
1956
T
RO
UT
. T
rout
hat
chin
g w
as f
irst
att
empt
ed in
193
9 w
hen
Hon
orar
y In
spec
tor
C. W
. Mal
pas,
of
Unl
ey,
hatc
hed
thou
sand
s of
loca
lly
obta
ined
egg
s in
sm
all t
rays
in h
is b
acky
ard.
The
hat
cher
y w
as m
oved
to
Upp
er S
turt
so
that
the
usin
g of
spr
ing
wat
ers
coul
d su
ppla
nt th
e so
mew
hat e
xpen
sive
tow
n su
pply
. The
spri
ng w
ater
was
impu
re s
o th
e ha
tche
ry, n
ow in
cha
rge
of th
e F
ly F
ishe
rs’
Ass
ocia
tion
, was
rem
oved
to
Ovi
ngha
m, w
here
the
tow
n su
pply
was
aga
in a
vail
ed o
f. T
his
year
the
size
of
the
hatc
hery
was
mor
e th
an
doub
led
at a
cos
t of
£475
. The
Fis
heri
es a
nd G
ame
Dep
artm
ent m
et h
alf
this
exp
ense
. Tho
usan
ds o
f
rain
bow
trou
t hat
ched
fro
m e
ggs
impo
rted
fro
m W
este
rn A
ustr
alia
are
rep
orte
d to
hav
e be
en d
istr
ibut
ed
thro
ugho
ut th
e ne
arby
str
eam
s. A
con
side
rabl
e nu
mbe
r of
bro
wn
trou
t was
als
o ha
tche
d an
d li
bera
ted.
The
Sou
th A
ustr
alia
n T
ouri
st B
urea
u m
ade
a fi
lm o
f th
e ha
tche
ry a
nd o
f fi
shin
g fo
r tr
out i
n th
e T
orre
ns G
orge
.
Thi
s w
ill b
e us
ed f
or p
ubli
city
and
ent
erta
inm
ent p
urpo
ses
(Moo
rhou
se, 1
956)
.
7474
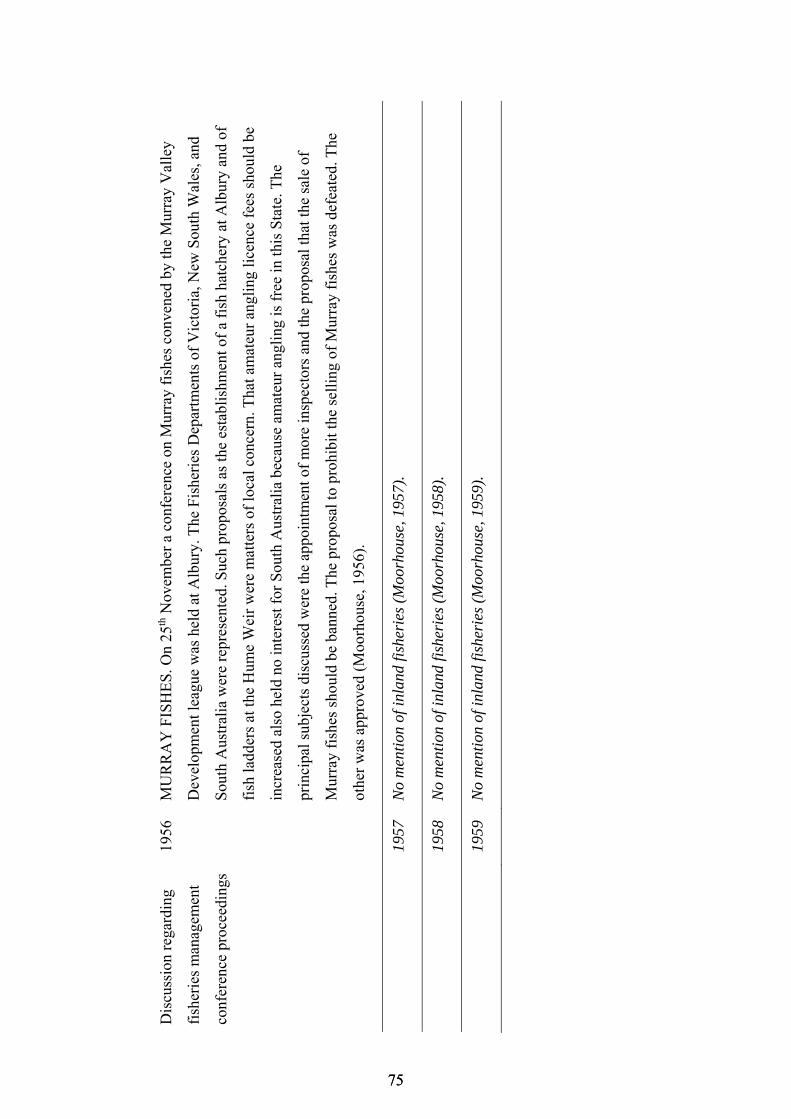
Dis
cuss
ion
rega
rdin
g
fish
erie
s m
anag
emen
t
conf
eren
ce p
roce
edin
gs
1956
M
UR
RA
Y F
ISH
ES
. On
25th
Nov
embe
r a
conf
eren
ce o
n M
urra
y fi
shes
con
vene
d by
the
Mur
ray
Val
ley
Dev
elop
men
t lea
gue
was
hel
d at
Alb
ury.
The
Fis
heri
es D
epar
tmen
ts o
f V
icto
ria,
New
Sou
th W
ales
, and
Sou
th A
ustr
alia
wer
e re
pres
ente
d. S
uch
prop
osal
s as
the
esta
blis
hmen
t of
a fi
sh h
atch
ery
at A
lbur
y an
d of
fish
ladd
ers
at th
e H
ume
Wei
r w
ere
mat
ters
of
loca
l con
cern
. Tha
t am
ateu
r an
glin
g li
cenc
e fe
es s
houl
d be
incr
ease
d al
so h
eld
no in
tere
st f
or S
outh
Aus
tral
ia b
ecau
se a
mat
eur
angl
ing
is f
ree
in th
is S
tate
. The
prin
cipa
l sub
ject
s di
scus
sed
wer
e th
e ap
poin
tmen
t of
mor
e in
spec
tors
and
the
prop
osal
that
the
sale
of
Mur
ray
fish
es s
houl
d be
ban
ned.
The
pro
posa
l to
proh
ibit
the
sell
ing
of M
urra
y fi
shes
was
def
eate
d. T
he
othe
r w
as a
ppro
ved
(Moo
rhou
se, 1
956)
.
19
57
No
men
tion
of i
nlan
d fi
sher
ies
(Moo
rhou
se, 1
957)
.
19
58
No
men
tion
of i
nlan
d fi
sher
ies
(Moo
rhou
se, 1
958)
.
19
59
No
men
tion
of i
nlan
d fi
sher
ies
(Moo
rhou
se, 1
959)
.
7575

Chapter 4: Historical ecology changes the options for
management of invading species
4.1 Preface
Invasive species can drive changes in ecosystems that have lasting legacies. The
implications of such changes for society can be considerable where there is, for example, a
loss of access to resources or environmental variation that is confronting. In this chapter,
societal concern toward a cryptogenic species of oyster is assessed along with the options
for its management. The population is considered from a historical perspective, using
historical data obtained from archived fisheries records, and the contemporary effects of
the species on a native bivalve and associated epifauna are quantified. A decision-making
model is used to understand the management actions that could be assigned to the
population based on community perspective alone, in contrast to those made based on the
empirical evidence. This chapter is being developed as a manuscript for publication, with
the co-author Sean D. Connell.
7676

4.2 Statement of authorship
Principal Author
Name of Principal Author (Candidate) Heidi K. Alleway
Contribution to the Paper Conceptualised and designed the research and experiment, organised and conducted field and
laboratory work, collated and analysed the data, interpreted the results and developed the
manuscript.
Overall percentage (%) 80%
Signature
Date 24/07/2015
Co-Author Contributions
By signing the Statement of Authorship, each author certifies that:
vii. the candidate’s stated contribution to the publication is accurate (as detailed above);
viii. permission is granted for the candidate in include the publication in the thesis; and
ix. the sum of all co-author contributions is equal to 100% less the candidate’s stated contribution.
Name of Co-Author Sean D. Connell
Contribution to the Paper Conceptualised and designed the experiment, assisted with the interpretation of results and
development of the manuscript.
Signature
Date 21/07/2015
Title of Paper Historical ecology changes the options for management of invading species
Publication Status Published Accepted for Publication
Submitted for Publication Publication Style
Publication Details
7777
Historical ecology changes the options for management
of invading species
Heidi K. Alleway and Sean D. Connell
Southern Seas Ecology Laboratories, School of Biological Sciences, University of
Adelaide, South Australia, 5005, Australia
4.3 Abstract
Invasive species have for centuries affected communities and ecosystems and generate
impacts that are unwanted by business and society. Despite the development of invasion
ecology as a discipline and rigorous management frameworks, such as biosecurity, many
species cannot reliably be described as native or alien and determining their degree of
‘invasiveness’ can be challenging. The introduction of non-native species can also return
functions previously undertaken by native species that have been lost, but recognition for
this possibility can be obscured by society’s amnesia of past environments, or collective
acceptance of shifted baselines regarding lost functions. This chapter evaluates the
ecological merit of the concern of a regional community toward a cryptogenic oyster
Pinctada albina sugillata, which occurs in a locality of oyster loss. This species can occur
as an epibiont, attached to the native bivalve Pinna bicolor in large numbers, which is an
unwanted interaction and the community has thus branded it ‘highly invasive’. This model
of invasion was tested using historical and experimental approaches. Historical records
indicated a comparable past association between the native oyster Ostrea angasi and Pi.
bicolor such that the association is not ‘unnatural’. Transplant experiments then tested the
impact of Pc. albina sugillata as an epibiont on the condition of Pi. bicolor but did not
detect a negative effect on individual health. Instead, a positive effect of Pc. albina
sugillata on epifaunal species richness and abundance was observed as a result of the
complex habitat this species creates in association with Pi. bicolor. The contradiction
7878

between the societal perspective and the empirical data for management options was
considered through a decision-making model. Decisions based on the perception that P.
albina sugillata was highly invasive led to the investigation of eradication and biological
control, but the inclusion of historical ecology led to a change in focus to resource use,
with education and communication to seek containment. This outcome suggests that
historical ecology could be used to inform the ecological context of invading species and
options for their management.
4.4 Introduction
Invasive species are a challenge to ecosystems, societies and management (Simberloff et
al., 2013), and global change infers they will play an increasingly prominent and dynamic
role in the environment and in human communities (Walther et al., 2009). The increasing
rate at which non-native species are introduced to new landscapes, which has at no time in
the past been higher, represents both opportunity through benefits to biodiversity or
ecosystem services, as well as risks due to negative impacts such as resource or
biodiversity loss (Walther et al., 2009). A further risk is the mistaken classification of a
species as ‘alien’ when it is in fact native (Willis and Birks, 2006), which might lead to
xenophobia (Larson, 2005). Hence, the native-versus-alien dichotomy that is commonly
used can be counterproductive to ecology and management (Davis et al., 2011). Despite
the introduction of formal surveillance networks through biosecurity (Meyerson and
Reaser, 2002) our ability to accurately describe a species as native or alien will continue to
be limited (Preston, 2009, Walther et al., 2009, Webber and Scott, 2012), which is
problematic under a future of systematic change in community assemblages and the
“shuffling of species” with changing climate (Hobday, 2011, Dornelas et al., 2014).
Species-specific ecologies of invaders bring both ecological and social challenges.
Consequently, debate around the management actions needed can arise from differing
values for invasive species (Estévez et al., 2014). For example, species intentionally
introduced during the course of European colonisation, for instance trout, can be despised
or revered. Such species can be the subject of a shifted baseline that then acts to facilitate
their conservation, because society is placing a high value on their presence (Clavero,
2014). The strict regime established through biosecurity has raised the profile of non-
7979
native species and communities are now aware of their occurrence (Meyerson and Reaser,
2002), but it has also contributed to the use of militaristic metaphors, including the terms
‘invasion’, ‘invader’, ‘target’ and ‘strategy’, that can create the belief we are at war with
species not considered to be a natural part of the environment (Larson, 2005). Invasive
species can contribute positive changes to ecosystems, including the provision of habitat,
shelter and food (Schlaepfer et al., 2011). But these positive changes could be overlooked
when there are little data available to determine their effect, or societal perspectives toward
the species politically motivate decision-making (Gozlan et al., 2013).
Baselines against which natural and human mediated change can be measured can be
impeded by the temporal span of available data and the action of the shifting baseline
syndrome (Pauly, 1995, Jackson, 2001, Willis and Birks, 2006). Without accurate
baselines we risk misinterpreting the absence or productivity of a species or ecosystem
(Alleway and Connell, 2015), but we might also misinterpret positive change, including
the benefits that introduced species bring to landscapes that are negatively impacted by
human activity (Schlaepfer et al., 2011). It may well be worth contemplating the ecological
services of non-natives and whether their coexistence with a historically and ecologically
informed society is possible. Consequently, the temporal scale of measurement in invasion
ecology is important and species-specific invasion ecologies can be improved by
considering the occurrence of species over longer periods of time and applying a holistic
understanding of ecosystem change (Willis and Birks, 2006, Carlton, 2009). Many studies
in invasion ecology do not, however, adopt a long-term perspective toward the changes
that a species might have contributed (Strayer et al., 2006), or the changes that have
occurred within an ecosystem that might have facilitated its establishment (Sol et al.,
2008). Historical ecological research, which works to build a representative measure of
change over time using palaeoecological, archaeological or historical processes could,
therefore, assist invasion ecology.
Non-native bivalves, including oysters, can be ecosystem engineers (Sousa et al., 2009)
and, as a result, they represent some of the most widely distributed invasive species in the
world contributing to positive feedback loops and ‘invasional meltdown’, such as the
introduction of new diseases and pathogens (Ruesink et al., 2005, Heiman and Micheli,
2010, Mineur et al., 2014). Here, the ecological merits of community concern toward a
8080
cryptogenic oyster species and its management were evaluated. The species, a pearl oyster
Pinctada albina sugillata, occurs in an area of past loss of oysters and oyster reefs, but the
community considers its behaviour to be highly invasive and its presence of imperative
concern. An experimental approach was combined with information from historical
records to assess negative and positive aspects of the population. The hypothesis that the
occurrence of Pc. albina sugillata as an epibiont, attached to the shell of native Pinna
bicolor (razorfish or razor clam), would negatively affect Pi. bicolor condition was tested
using transplant experiments. A second hypothesis was also evaluated; this being that
interaction between these two species would positively affect epifaunal species richness
and abundance due to the complex biogenic habitat created by the association. The
influence of the historical baseline of oyster loss on societal perspective, and thus the
management actions assigned to the species, was considered through the use of a decision-
making model.
4.5 Materials and methods
4.5.1 Site description and population
Spencer Gulf in South Australia is an inverse estuary influenced by seasonally warm water
on the continental shelf from the major southward flowing currents from northern
Australia and is, consequently, characterised by a changing temperature regime; the
shallow waters of the upper Gulf vary by approximately 12°C, between summer and
winter, and summer temperatures reach greater than 24°C (Nunes Vaz, 2014). This
oceanography creates a distinct subtropical environment that supports the presence of
tropical and sub-tropical species, including a number of tropical ‘relicts’ (Shepherd, 1983,
Edyvane, 1999b).
Pc. albina sugillata is one of two sub-species of pearl oyster distributed across areas of
the Indo-Pacific and along Australia’s northern coastline, from the Houtman-Abroholos
Islands in the west to central NSW in the east (Hynd, 1960). In South Australia, the species
occurs in the upper reaches of Spencer Gulf (Figure 1a). Voucher specimens were first
lodged with the South Australian Museum in 2003, though anecdotally this species was
reported sometime in the 1980s (Wiltshire et al., 2010). Surveys of benthic communities in
the late 1970s at the southern end of the species current range did not highlight its presence
8181

(Shepherd, 1983). The population is now patchily distributed at various densities across
approximately 20 kms of the upper Spencer Gulf (Rutherford and Miller, 2011). Because
the date of first occurrence and the vector of transfer are unknown the species is classified
as cryptogenic.
4.5.2 Community perception
Responding to community concern the Government of South Australia provided a
parliamentary inquiry into invasive species, at which the ecological effects of the Pc.
albina sugillata population were considered. During their presentation of evidence to the
inquiry, representatives from the community highlighted their concern for the way in
which Pc. albina sugillata interacted with the native bivalve P. bicolor. It was stated;
“well, we can see it’s fairly clear the razorfish are decimated; they have actually flattened
whole areas of them and that is continuing”; also, “they literally form a blanket over the
Razorfish smothering them from the intertidal zone” (Figure 1b) (Invasive Species Inquiry,
NRC, 2010). Pc. albina sugillata attaches to the outer shell of Pi. bicolor often in numbers
of 10s of individuals across a range of sizes (Figure 1c). Pi. bicolor is a popular
recreational fishery species throughout South Australia, particularly within the Spencer
Gulf where it is an iconic species used for food and bait for fishing. Spatial closures and
catch limits have been in place since 2006 to limit harvesting of Pi. Bicolor, due to
concerns of high fishing pressure and localised depletion. Beginning in 2011, the local
community of the upper Spencer Gulf was engaged in further dialogue, through direct
discussion with individuals and presentation to the Local City Council of Port Augusta and
members of their Marine Advisory Group (June 2011), encompassing representatives from
local and state government, local community groups and businesses, and members of the
public. Discussion was ongoing after this point, via direct conversation through phone,
email and meetings during site visits.
4.5.3 Historical ecological records
To build an understanding of the local environment prior to the establishment of Pc. albina
sugillata and the interaction of this species with Pi. bicolor, fisheries records held at the
State Records of South Australia and voucher specimens within the South Australian
Museum were searched for reference to the past observation of Pc. albina sugillata and
8282
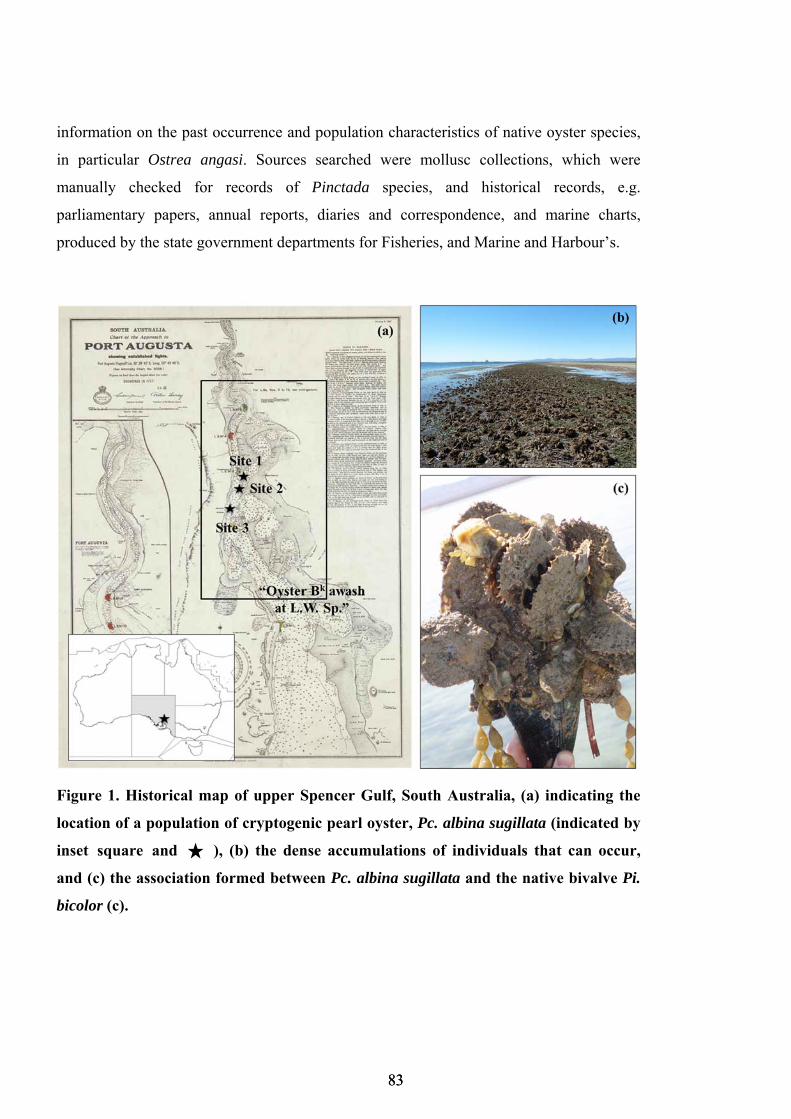
information on the past occurrence and population characteristics of native oyster species,
in particular Ostrea angasi. Sources searched were mollusc collections, which were
manually checked for records of Pinctada species, and historical records, e.g.
parliamentary papers, annual reports, diaries and correspondence, and marine charts,
produced by the state government departments for Fisheries, and Marine and Harbour’s.
Figure 1. Historical map of upper Spencer Gulf, South Australia, (a) indicating the
location of a population of cryptogenic pearl oyster, Pc. albina sugillata (indicated by
inset square and ), (b) the dense accumulations of individuals that can occur,
and (c) the association formed between Pc. albina sugillata and the native bivalve Pi.
bicolor (c).
8383

4.5.4 Experimental test
An experimental approach was used to evaluate the effects of Pc. albina sugillata on the
condition of individual Pi. bicolor. The model of concern, that Pi. bicolor is ‘decimated’
and ‘smothered’ by Pc. albina sugillata was assessed by testing the hypothesis that the
condition of Pi. bicolor would be negatively correlated with the weight of Pc. albina
sugillata attached to each shell, i.e. the larger the number of oysters attached to the shell
the poorer the condition of Pi. bicolor.
In December 2012, 135 discrete associations of Pi. bicolor with Pc. albina sugillata
attached (Figure 1c) were harvested from three sites, encompassing areas of higher density
Pc. albina sugillata (denser aggregations, individuals attached to hard substrate in tens of
individuals) and lower density (individuals loosely aggregated or occurring individually,
not attached to hard substrate in more than single numbers), based on data in Rutherford
and Miller (2011). Approximately 500 m separated Sites 1 and 2 and Site 3 was 2 km
distant to Site 2 (Figure 1a). Spatial separation between sites was not equal because Pc.
albina sugillata is patchily distributed, occurring across intertidal and shallow subtidal
areas and on sand shoals interspersed with deep channels where the species does not occur.
The separation was, however, considered sufficient to separate the effects of Pc. albina
sugillata on individual Pi. bicolor between sites.
Three treatments were applied to the samples: Treatment (T) 1 = control (picked up and
put down again with minimum translocation), T2 = Pi. bicolor cleaned of all Pc. albina
sugillata, and T3 = Pi. bicolor uncleaned of Pc. albina sugillata. Samples were treated and
translocated according to the sample statistics in Table 1 with 25 individuals in each
category, other than Site 3 where two additional replicates were laid (n = 35) because of
the locations proximity to boating and fishing activity and the higher risk of the experiment
being tampered with. An uneven number of samples were laid due to the significant
amount of time associated with laboratory processing of individuals, without
compromising the experimental design.
Individual associations were laid in replicates of one metre wide rows, five Pi. bicolor
within each demarcated by two metal pickets, and treatments were separated by two
metres. This density was consistent with that observed at each study site; Pi. bicolor are
also known to occur in densities greater than 20 individuals per m2 (Butler and Keough,
8484
1981). Hence, this density was also considered adequate to exclude the potential negative
effects of the proximity of other Pi. Bicolor, such that their presence would not overwhelm
the potential effect of Pc. albina sugillata. Treatments were left in-situ for 21 months, to
allow sufficient time for an effect on P. bicolor condition to occur, after which the
complete association – Pi. bicolor, Pc. albina sugillata and all associated epifauna – were
harvested. Associations were individually bagged and placed in ice slurry prior to
processing.
During the experiment replicates at Site 3 were tampered with and the metal pickets
removed. Transplanted Pi. bicolor were systematically searched for but were not found
and a haphazard collection of 25 Pi. bicolor were harvested in lieu of transplanted samples,
reflecting as near as possible the original treatment of ‘assemblages transplanted with Pc.
albina sugillata attached from an area of a higher density of oyster’, i.e. larger Pi. bicolor
with higher numbers of Pc. albina sugillata attached to their shell were harvested.
4.5.5 Condition of Pi. bicolor
Epifauna were removed from the surface of each Pi. bicolor and retained. Pc. albina
sugillata were separated from the rest of the sample, cleaned of excess material, e.g. mud
and algae, patted dry with paper towel and the total total wet weight of oysters in grams
recorded.
A condition index of Pi. bicolor was generated, sensu Wu and Shin (1998):
Condition index = (dry tissue weight (g) / maximum shell width (cm)) x 100
For this measurement, soft parts of each Pi. bicolor, e.g. stomach, gonads, were excluded
and only the adductor muscle was included as tissue. It was thought the muscle tissue of
Pi. bicolor would better reflect long-term condition because muscle mass, based on the
hypothesis, would be effected by the persistent presence of Pc. albina sugillata as an
epibiont, i.e. Pi. bicolor with a larger number Pc. albina sugillata on their shell would be
persistently stressed and muscle tissue, as a result, would be atrophied. Furthermore, it was
also assumed that variation in tissue mass due to seasonal and local variation of food or
spawning could be reflected in the soft parts of Pi. bicolor, e.g. stomach and gonads, and
might therefore confound measurement of condition due to collection of Pi. bicolor across
a single point in time. Pi. bicolor is commercially and recreationally exploited for
8585
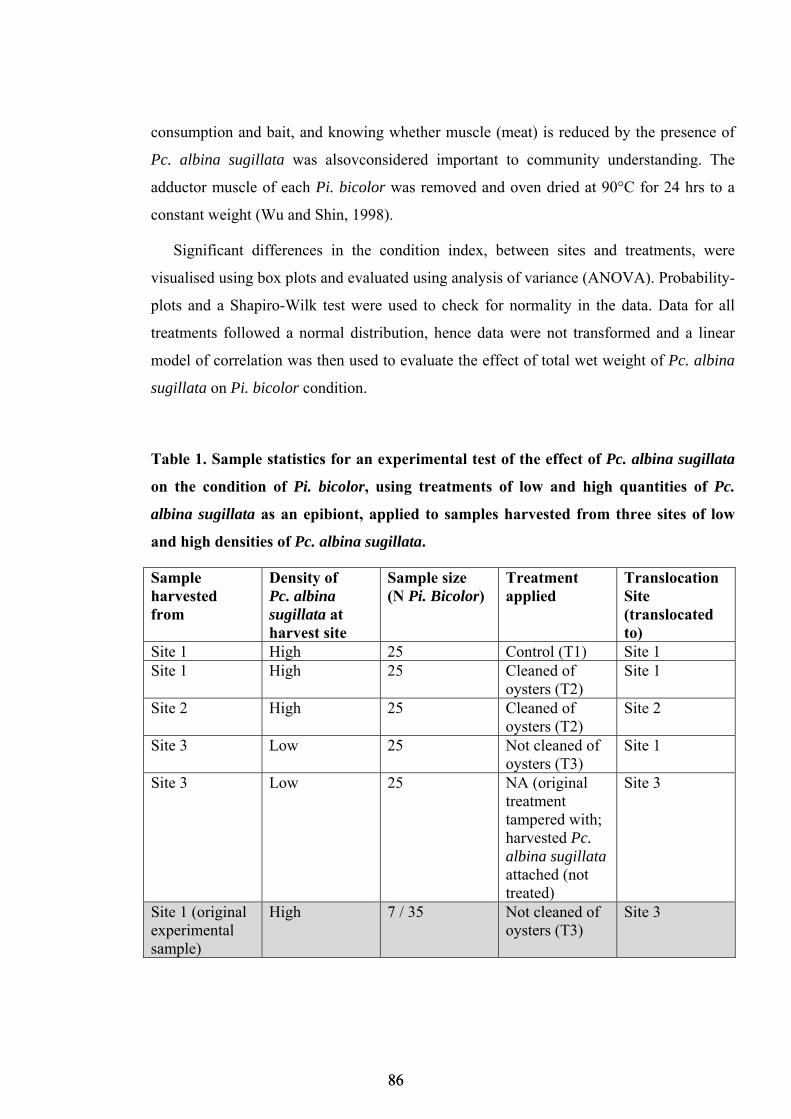
consumption and bait, and knowing whether muscle (meat) is reduced by the presence of
Pc. albina sugillata was alsovconsidered important to community understanding. The
adductor muscle of each Pi. bicolor was removed and oven dried at 90°C for 24 hrs to a
constant weight (Wu and Shin, 1998).
Significant differences in the condition index, between sites and treatments, were
visualised using box plots and evaluated using analysis of variance (ANOVA). Probability-
plots and a Shapiro-Wilk test were used to check for normality in the data. Data for all
treatments followed a normal distribution, hence data were not transformed and a linear
model of correlation was then used to evaluate the effect of total wet weight of Pc. albina
sugillata on Pi. bicolor condition.
Table 1. Sample statistics for an experimental test of the effect of Pc. albina sugillata
on the condition of Pi. bicolor, using treatments of low and high quantities of Pc.
albina sugillata as an epibiont, applied to samples harvested from three sites of low
and high densities of Pc. albina sugillata.
Sample harvested from
Density of Pc. albina sugillata at harvest site
Sample size (N Pi. Bicolor)
Treatment applied
Translocation Site (translocated to)
Site 1 High 25 Control (T1) Site 1 Site 1 High 25 Cleaned of
oysters (T2) Site 1
Site 2 High 25 Cleaned of oysters (T2)
Site 2
Site 3 Low 25 Not cleaned of oysters (T3)
Site 1
Site 3 Low 25 NA (original treatment tampered with; harvested Pc. albina sugillata attached (not treated)
Site 3
Site 1 (original experimental sample)
High 7 / 35 Not cleaned of oysters (T3)
Site 3
8686

4.5.6 Epifaunal richness and abundance
In July 2012, Pc. albina sugillata and Pi. bicolor associations were harvested from three
sites across areas of low and high Pc. albina sugillata density. One metre square quadrats
were haphazardly placed over the benthos at Sites 1 and 2, with all Pi. bicolor within the
quadrat harvested as well as associated epifauna. At Site 3 a haphazard collection of 37 Pi.
bicolor was taken due to weather conditions, which limited the capacity to work with the
quadrats. Pc. albina sugillata were removed from the sample, cleaned of any residual
epifauna and patted dry with towel. Total wet weight of Pc. albina sugillata within each
sample was then recorded and remaining epifauna was sieved through 0.5 mm mesh and
retained. Epifauna were identified to the taxonomic level of family, or higher if this could
not reasonably be determined. Total epifauna and the total number of taxonomic groups
across all samples were categorically distributed according to classes of Pc. albina
sugillata wet weight, and the mean and standard deviation were calculated.
4.5.7 Decision-making model
Although patchy in its distribution and abundance, Pc. albina sugillata occurs in large
numbers and aggregations can form what could be considered oyster beds (dense
accumulations of living oysters) (Figure 1b). Archival material indicated the native oyster
O. angasi historically formed beds in the upper Spencer Gulf and grew on Pi. bicolor in
large numbers. Based on this knowledge and the concern of the local community regarding
the impact of Pc. albina sugillata on Pi. bicolor, a decision-making model was built that
included and discounted the historical ecological baseline of O. angasi occurrence and
growth on Pi. bicolor (Figure 2). The decision-making model was used to consider the
influence of societal perspectives and the management actions that would consequently be
assigned to the population.
4.6 Results
4.6.1 Community consultation and decision-making for management
The consequence of government response to community concern via consultation led to
the management options of biological control, eradication and removal being investigated
(Figure 2). This outcome was based on community information regarding the
8787

‘invasiveness’ of Pc. albina sugillata and both the assumption, and political motivation as
a result of the Invasive Species Inquiry, that the species was significantly, negatively
affecting the Pi. bicolor population.
4.6.2 Historical ecological records
No records for Pc. albina sugillata other than those previously reported (Wiltshire et al.,
2010) were identified. Historical records were, however, identified for the past occurrence
of oyster reefs formed by the native O. angasi and for overexploitation of areas due to
commercial fishing in the area overlapping the current range of Pc. albina sugillata. These
references were found within the diaries and letter books of the Inspector of Fisheries
(Fisheries, 1886), as well as cartographic material from 1863 of the area indicating at least
one oyster bank (Figure 1a). Oyster reefs have been made functionally extinct by
overexploitation, but knowledge of their previously widespread distribution and aspects of
their ecology, including the manner in which they used to grow, has only recently become
known (chapter three, Alleway and Connell (2015)). Records were also identified
indicating O. angasi historically grew on Pi. bicolor in large numbers. Pi. bicolor were
noted to provide a preferred hard substrate for the settlement of oysters. For example, on
the 13th September 1881 the then Inspector of Fisheries commented in correspondence;
“some of the best formation as yet known in the History of Oyster culture for the oyster
spat to cling, as many as fifty oysters, old and young, having been found on one razorfish”
(Fisheries, 1886). The importance of this interaction led the Inspector of Fisheries to
repeatedly translocate live Pi. bicolor over hundreds of kilometres, in an effort to re-
establish native oyster beds once they had started to deteriorate (Table 2) (Fisheries, 1886).
8888
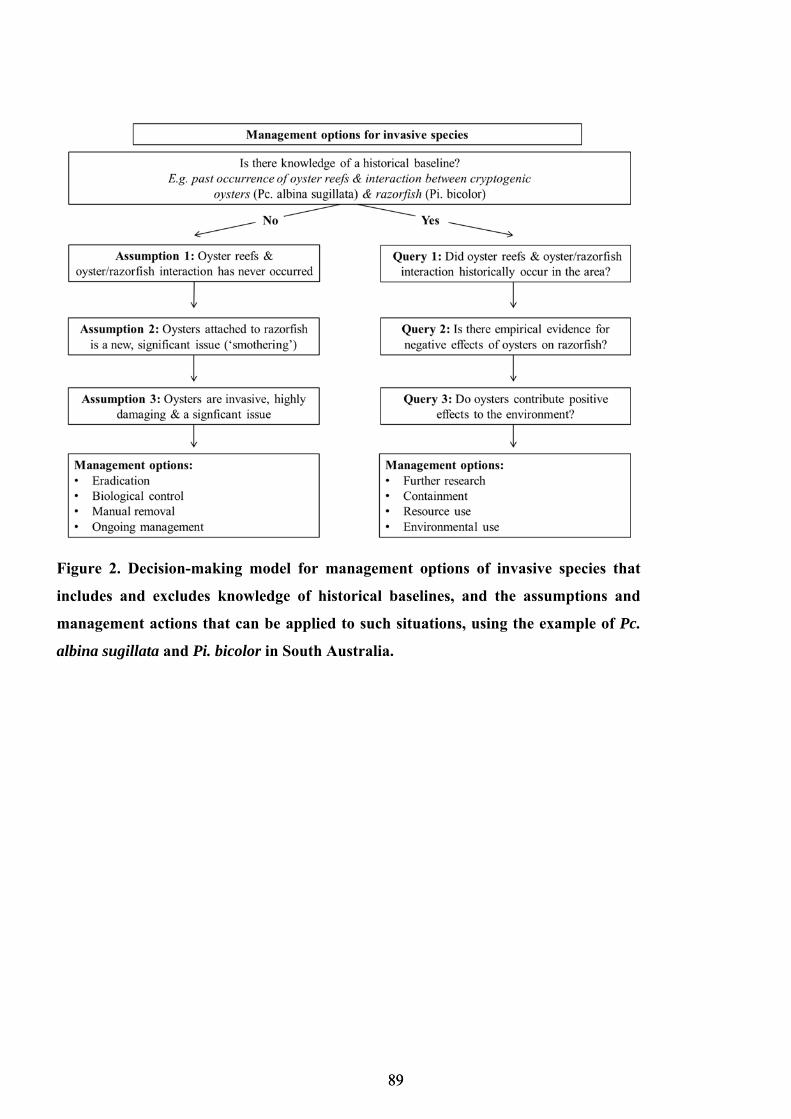
Figure 2. Decision-making model for management options of invasive species that
includes and excludes knowledge of historical baselines, and the assumptions and
management actions that can be applied to such situations, using the example of Pc.
albina sugillata and Pi. bicolor in South Australia.
8989
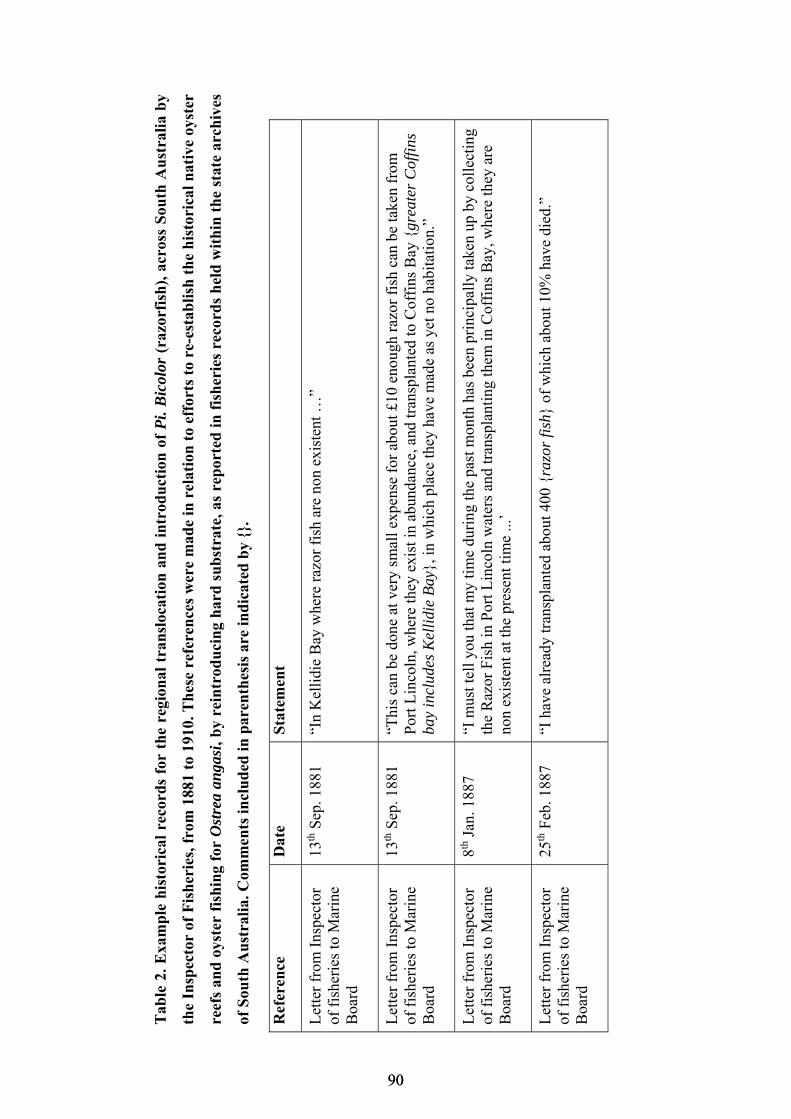
Tab
le 2
. Exa
mp
le h
isto
rica
l re
cord
s fo
r th
e re
gion
al t
rans
loca
tion
an
d i
ntr
odu
ctio
n o
f P
i. B
icol
or (
razo
rfis
h),
acr
oss
Sou
th A
ust
rali
a b
y
the
Insp
ecto
r of
Fis
her
ies,
fro
m 1
881
to 1
910.
Th
ese
refe
ren
ces
wer
e m
ade
in r
elat
ion
to
effo
rts
to r
e-es
tab
lish
th
e h
isto
rica
l nat
ive
oyst
er
reef
s an
d o
yste
r fi
shin
g fo
r O
stre
a an
gasi
, by
rein
trod
uci
ng
har
d s
ub
stra
te, a
s re
por
ted
in f
ish
erie
s re
cord
s h
eld
wit
hin
th
e st
ate
arch
ives
of S
outh
Au
stra
lia.
Com
men
ts in
clu
ded
in p
aren
thes
is a
re in
dic
ated
by
{}.
Ref
eren
ce
Dat
e S
tate
men
t
Let
ter
from
Ins
pect
or
of f
ishe
ries
to M
arin
e B
oard
13th
Sep
. 188
1 “I
n K
elli
die
Bay
whe
re r
azor
fis
h ar
e no
n ex
iste
nt …
”
Let
ter
from
Ins
pect
or
of f
ishe
ries
to M
arin
e B
oard
13th
Sep
. 188
1 “T
his
can
be d
one
at v
ery
smal
l exp
ense
for
abo
ut £
10 e
noug
h ra
zor
fish
can
be
take
n fr
om
Por
t Lin
coln
, whe
re th
ey e
xist
in a
bund
ance
, and
tran
spla
nted
to C
offi
ns B
ay {
grea
ter
Cof
fins
ba
y in
clud
es K
elli
die
Bay
}, in
whi
ch p
lace
they
hav
e m
ade
as y
et n
o ha
bita
tion
.”
Let
ter
from
Ins
pect
or
of f
ishe
ries
to M
arin
e B
oard
8th J
an. 1
887
“I m
ust t
ell y
ou th
at m
y ti
me
duri
ng th
e pa
st m
onth
has
bee
n pr
inci
pall
y ta
ken
up b
y co
llec
ting
th
e R
azor
Fis
h in
Por
t Lin
coln
wat
ers
and
tran
spla
ntin
g th
em in
Cof
fins
Bay
, whe
re th
ey a
re
non
exis
tent
at t
he p
rese
nt ti
me
...’
Let
ter
from
Ins
pect
or
of f
ishe
ries
to M
arin
e B
oard
25th
Feb
. 188
7 “I
hav
e al
read
y tr
ansp
lant
ed a
bout
400
{ra
zor
fish
} of
whi
ch a
bout
10%
hav
e di
ed.”
9090
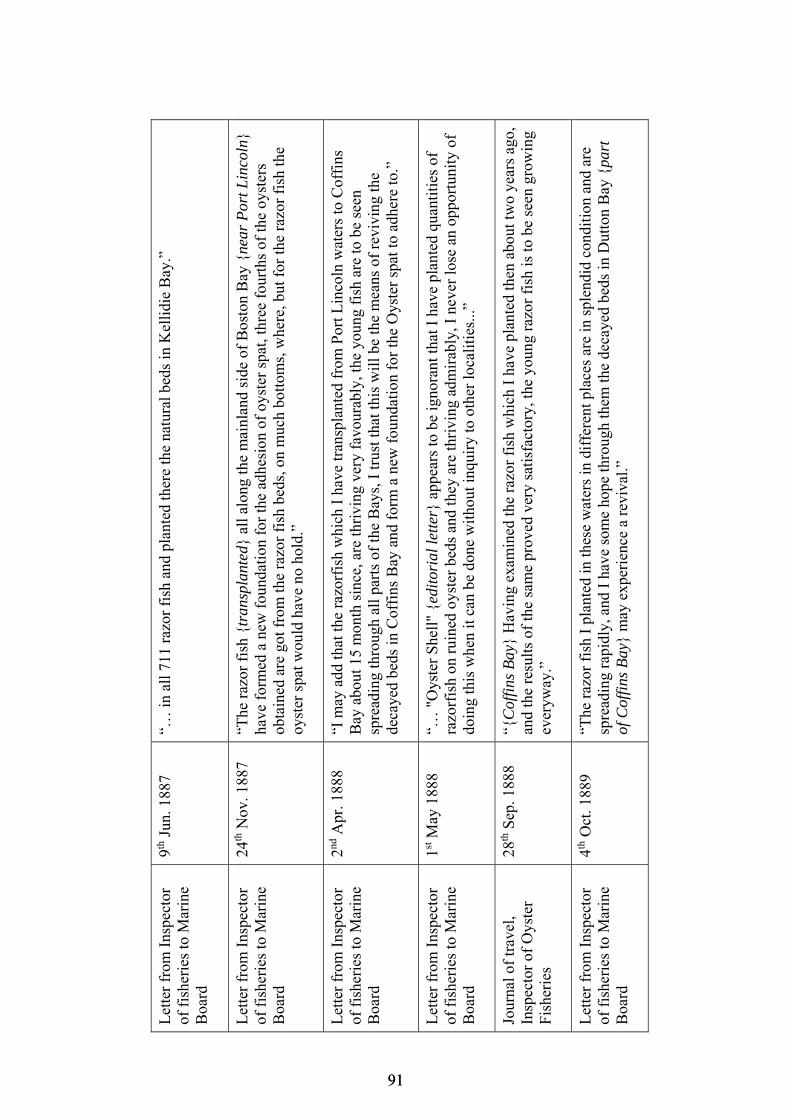
Let
ter
from
Ins
pect
or
of f
ishe
ries
to M
arin
e B
oard
9th J
un. 1
887
“… in
all
711
raz
or f
ish
and
plan
ted
ther
e th
e na
tura
l bed
s in
Kel
lidi
e B
ay.”
Let
ter
from
Ins
pect
or
of f
ishe
ries
to M
arin
e B
oard
24th
Nov
. 188
7 “T
he r
azor
fis
h {t
rans
plan
ted}
all
alo
ng th
e m
ainl
and
side
of
Bos
ton
Bay
{ne
ar P
ort L
inco
ln}
have
for
med
a n
ew f
ound
atio
n fo
r th
e ad
hesi
on o
f oy
ster
spa
t, th
ree
four
ths
of th
e oy
ster
s ob
tain
ed a
re g
ot f
rom
the
razo
r fi
sh b
eds,
on
muc
h bo
ttom
s, w
here
, but
for
the
razo
r fi
sh th
e oy
ster
spa
t wou
ld h
ave
no h
old.
”
Let
ter
from
Ins
pect
or
of f
ishe
ries
to M
arin
e B
oard
2nd A
pr. 1
888
“I m
ay a
dd th
at th
e ra
zorf
ish
whi
ch I
hav
e tr
ansp
lant
ed f
rom
Por
t Lin
coln
wat
ers
to C
offi
ns
Bay
abo
ut 1
5 m
onth
sin
ce, a
re th
rivi
ng v
ery
favo
urab
ly, t
he y
oung
fis
h ar
e to
be
seen
sp
read
ing
thro
ugh
all p
arts
of
the
Bay
s, I
trus
t tha
t thi
s w
ill b
e th
e m
eans
of
revi
ving
the
deca
yed
beds
in C
offi
ns B
ay a
nd f
orm
a n
ew f
ound
atio
n fo
r th
e O
yste
r sp
at to
adh
ere
to.”
Let
ter
from
Ins
pect
or
of f
ishe
ries
to M
arin
e B
oard
1st M
ay 1
888
“… "
Oys
ter
She
ll"
{edi
tori
al le
tter
} ap
pear
s to
be
igno
rant
that
I h
ave
plan
ted
quan
titi
es o
f ra
zorf
ish
on r
uine
d oy
ster
bed
s an
d th
ey a
re th
rivi
ng a
dmir
ably
, I n
ever
lose
an
oppo
rtun
ity
of
doin
g th
is w
hen
it c
an b
e do
ne w
itho
ut in
quir
y to
oth
er lo
cali
ties
...”
Jour
nal o
f tr
avel
, In
spec
tor
of O
yste
r F
ishe
ries
28th
Sep
. 188
8 “{
Cof
fins
Bay
} H
avin
g ex
amin
ed th
e ra
zor
fish
whi
ch I
hav
e pl
ante
d th
en a
bout
two
year
s ag
o,
and
the
resu
lts
of th
e sa
me
prov
ed v
ery
sati
sfac
tory
, the
you
ng r
azor
fis
h is
to b
e se
en g
row
ing
ever
yway
.”
Let
ter
from
Ins
pect
or
of f
ishe
ries
to M
arin
e B
oard
4th O
ct. 1
889
“The
raz
or f
ish
I pl
ante
d in
thes
e w
ater
s in
dif
fere
nt p
lace
s ar
e in
spl
endi
d co
ndit
ion
and
are
spre
adin
g ra
pidl
y, a
nd I
hav
e so
me
hope
thro
ugh
them
the
deca
yed
beds
in D
utto
n B
ay {
part
of
Cof
fins
Bay
} m
ay e
xper
ienc
e a
revi
val.”
9191
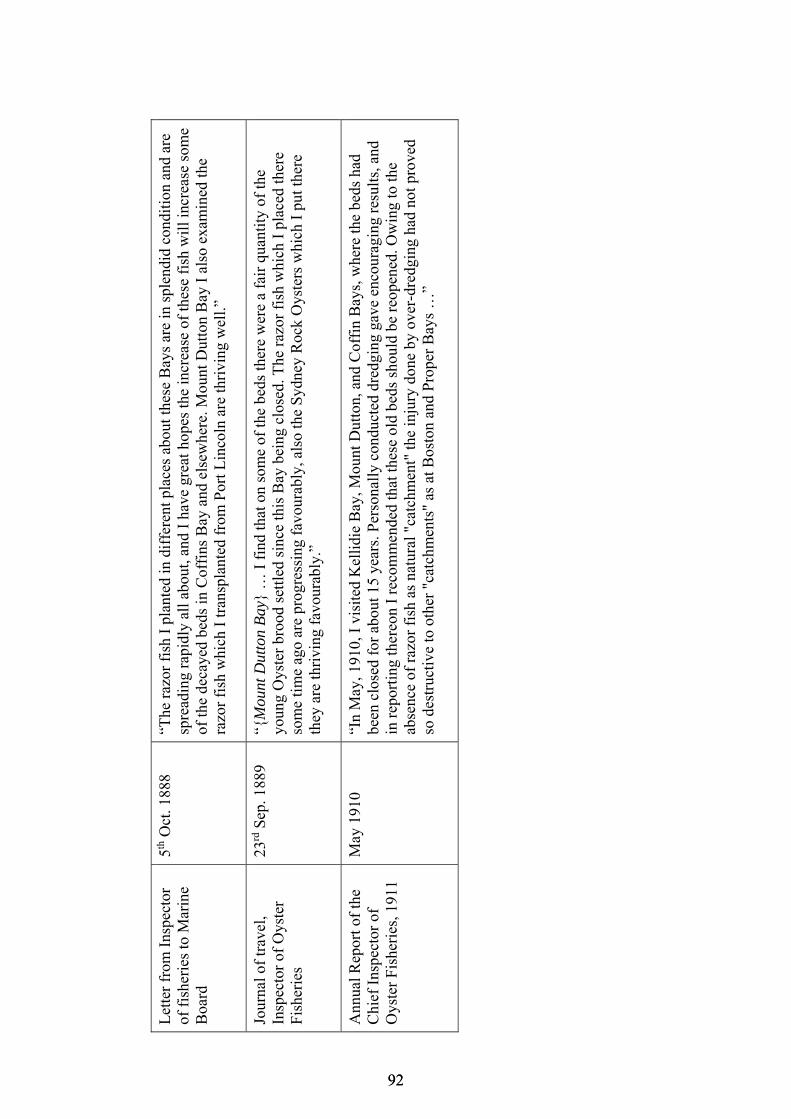
Let
ter
from
Ins
pect
or
of f
ishe
ries
to M
arin
e B
oard
5th O
ct. 1
888
“The
raz
or f
ish
I pl
ante
d in
dif
fere
nt p
lace
s ab
out t
hese
Bay
s ar
e in
spl
endi
d co
ndit
ion
and
are
spre
adin
g ra
pidl
y al
l abo
ut, a
nd I
hav
e gr
eat h
opes
the
incr
ease
of
thes
e fi
sh w
ill i
ncre
ase
som
e of
the
deca
yed
beds
in C
offi
ns B
ay a
nd e
lsew
here
. Mou
nt D
utto
n B
ay I
als
o ex
amin
ed th
e ra
zor
fish
whi
ch I
tran
spla
nted
fro
m P
ort L
inco
ln a
re th
rivi
ng w
ell.”
Jour
nal o
f tr
avel
, In
spec
tor
of O
yste
r F
ishe
ries
23rd
Sep
. 188
9 “{
Mou
nt D
utto
n B
ay}
… I
fin
d th
at o
n so
me
of th
e be
ds th
ere
wer
e a
fair
qua
ntit
y of
the
youn
g O
yste
r br
ood
sett
led
sinc
e th
is B
ay b
eing
clo
sed.
The
raz
or f
ish
whi
ch I
pla
ced
ther
e so
me
tim
e ag
o ar
e pr
ogre
ssin
g fa
vour
ably
, als
o th
e S
ydne
y R
ock
Oys
ters
whi
ch I
put
ther
e th
ey a
re th
rivi
ng f
avou
rabl
y.”
Ann
ual R
epor
t of
the
Chi
ef I
nspe
ctor
of
Oys
ter
Fis
heri
es, 1
911
May
191
0 “I
n M
ay, 1
910,
I v
isit
ed K
elli
die
Bay
, Mou
nt D
utto
n, a
nd C
offi
n B
ays,
whe
re th
e be
ds h
ad
been
clo
sed
for
abou
t 15
year
s. P
erso
nall
y co
nduc
ted
dred
ging
gav
e en
cour
agin
g re
sult
s, a
nd
in r
epor
ting
ther
eon
I re
com
men
ded
that
thes
e ol
d be
ds s
houl
d be
reo
pene
d. O
win
g to
the
abse
nce
of r
azor
fis
h as
nat
ural
"ca
tchm
ent"
the
inju
ry d
one
by o
ver-
dred
ging
had
not
pro
ved
so d
estr
ucti
ve to
oth
er "
catc
hmen
ts"
as a
t Bos
ton
and
Pro
per
Bay
s …
”
9292
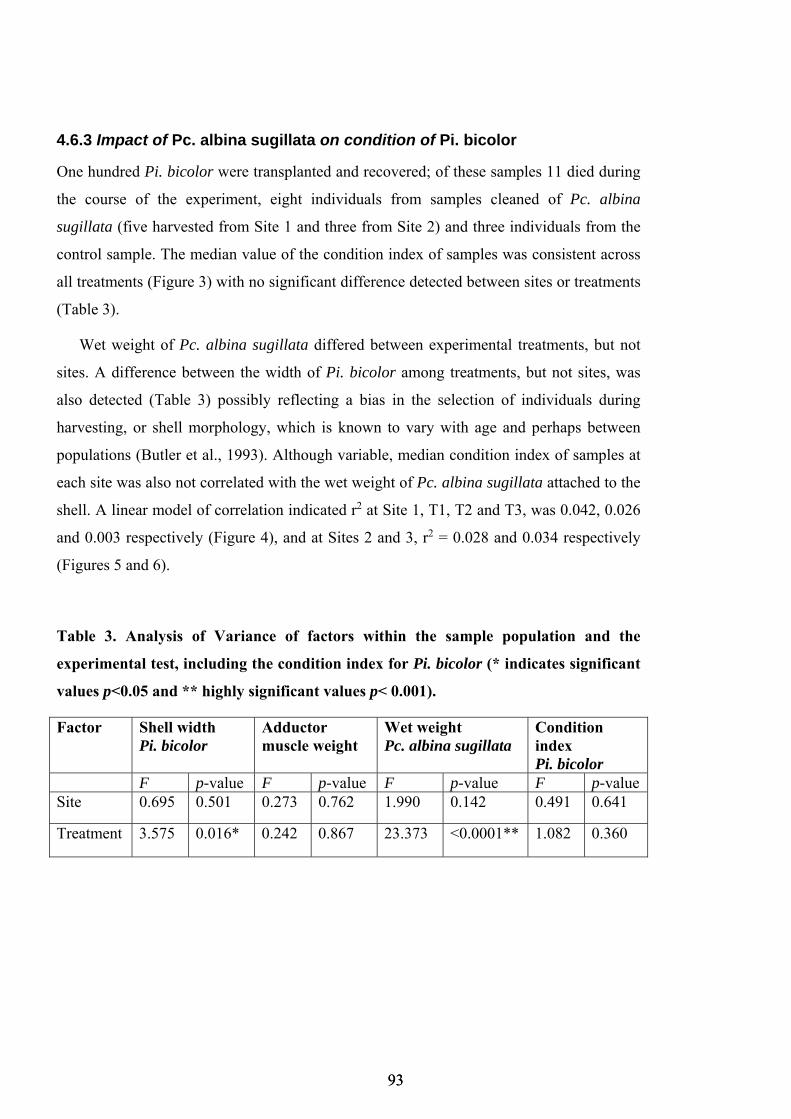
4.6.3 Impact of Pc. albina sugillata on condition of Pi. bicolor
One hundred Pi. bicolor were transplanted and recovered; of these samples 11 died during
the course of the experiment, eight individuals from samples cleaned of Pc. albina
sugillata (five harvested from Site 1 and three from Site 2) and three individuals from the
control sample. The median value of the condition index of samples was consistent across
all treatments (Figure 3) with no significant difference detected between sites or treatments
(Table 3).
Wet weight of Pc. albina sugillata differed between experimental treatments, but not
sites. A difference between the width of Pi. bicolor among treatments, but not sites, was
also detected (Table 3) possibly reflecting a bias in the selection of individuals during
harvesting, or shell morphology, which is known to vary with age and perhaps between
populations (Butler et al., 1993). Although variable, median condition index of samples at
each site was also not correlated with the wet weight of Pc. albina sugillata attached to the
shell. A linear model of correlation indicated r2 at Site 1, T1, T2 and T3, was 0.042, 0.026
and 0.003 respectively (Figure 4), and at Sites 2 and 3, r2 = 0.028 and 0.034 respectively
(Figures 5 and 6).
Table 3. Analysis of Variance of factors within the sample population and the
experimental test, including the condition index for Pi. bicolor (* indicates significant
values p<0.05 and ** highly significant values p< 0.001).
Factor Shell width Pi. bicolor
Adductor muscle weight
Wet weight Pc. albina sugillata
Condition index Pi. bicolor
F p-value F p-value F p-value F p-value Site 0.695 0.501 0.273 0.762 1.990 0.142 0.491 0.641
Treatment 3.575 0.016* 0.242 0.867 23.373 <0.0001** 1.082 0.360
9393
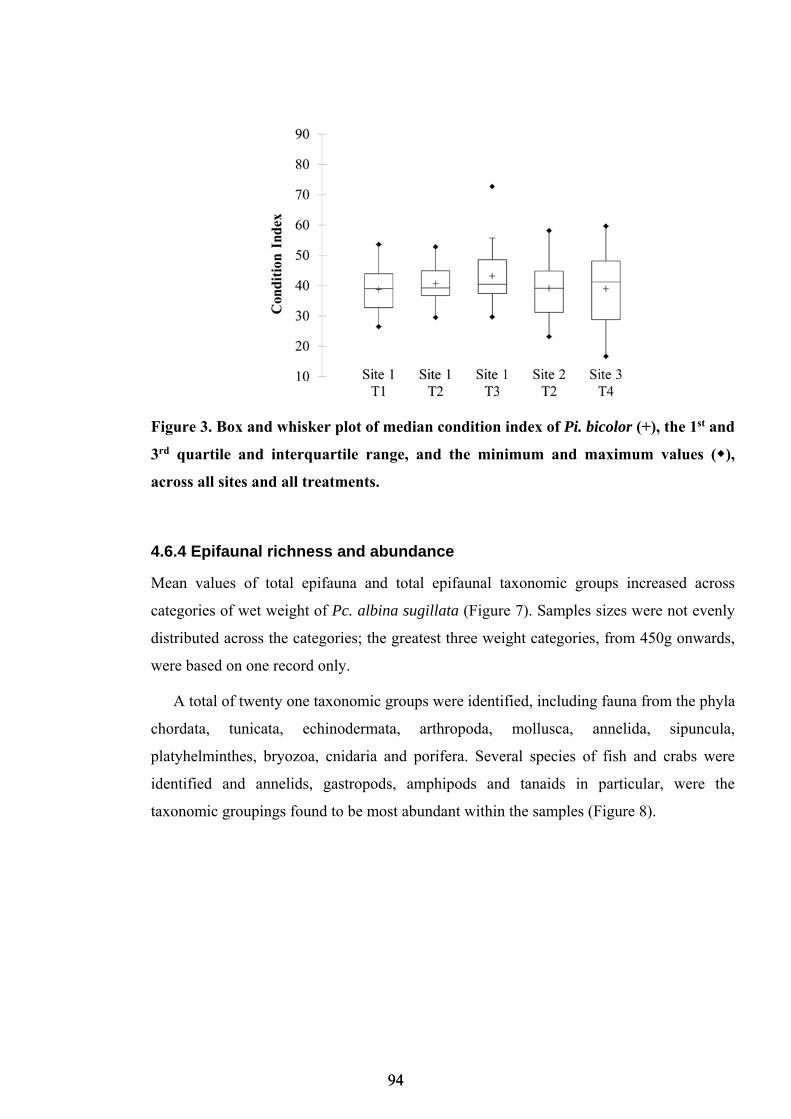
Figure 3. Box and whisker plot of median condition index of Pi. bicolor (+), the 1st and
3rd quartile and interquartile range, and the minimum and maximum values (),
across all sites and all treatments.
4.6.4 Epifaunal richness and abundance
Mean values of total epifauna and total epifaunal taxonomic groups increased across
categories of wet weight of Pc. albina sugillata (Figure 7). Samples sizes were not evenly
distributed across the categories; the greatest three weight categories, from 450g onwards,
were based on one record only.
A total of twenty one taxonomic groups were identified, including fauna from the phyla
chordata, tunicata, echinodermata, arthropoda, mollusca, annelida, sipuncula,
platyhelminthes, bryozoa, cnidaria and porifera. Several species of fish and crabs were
identified and annelids, gastropods, amphipods and tanaids in particular, were the
taxonomic groupings found to be most abundant within the samples (Figure 8).
9494

Figure 4. Correlation analysis using a linear regression model at Site 1, T1 (n = 22)
(a), T2 (n = 20) (b) and T3 (n = 24) (c), and 95% confidence interval of the
observations (solid line) and 95% confidence interval of the mean (dashed line).
9595

Figure 5. Correlation analysis using a linear regression model at Site 2 (n = 22) and
95% confidence interval of the observations (solid line) and 95% confidence interval
of the mean (dashed line).
Figure 6. Correlation analysis using a linear regression model at Site 3 (n = 24) and
95% confidence interval of the observations (solid line) and 95% confidence interval
of the mean (dashed line).
9696

Figure 7. Mean values and standard deviation of the mean, of the total number of
epifauna (□) and total number of species (♦) associated with Pc. albina sugillata
attached to the shell of Pi. bicolor across increasing categories of wet weight (g).
Points shaded in grey indicate values based on one sample only.
4.6.5 Revisiting community consultation and management outcomes
The results of the experimental test and the lack of a detectable effect of Pc. albina
sugillata on the condition of Pi. bicolor were presented to the local community at an open
forum in January 2015. Opinions of the community regarding this result differed
dramatically; some participants accepted the suggestion that Pc. albina sugillata may not
be ‘wiping out’ Pi. bicolor whilst others refused to acknowledge this position and
continued to perceive a catastrophic effect of Pc. albina sugillata to the local and, in some
cases, the broader marine ecosystem across the state of South Australia.
Management actions based on decision-making that incorporated the historical baseline
were discussed with the community, these were: further research; the development of an
experimental industry to identify a resource use; and education and communication to
ensure containment of the population within its current range. After agreement, the
Government of South Australia is now supporting the local community to pursue the
development of an exploratory and developmental resource industry, and to communicate
to the wider public voluntary biosecurity measures to ensure containment.
9797

Figure 8. Total accumulative number of epifauna across all taxonomic groups
identified, associated with samples of Pc. albina sugillata attached to the shell of Pi.
bicolor, harvested from three sites in the upper Spencer Gulf.
4.7 Discussion
Although it was hypothesised that Pc. albina sugillata would have a negative effect on the
condition of Pi. bicolor, this hypothesis was rejected. The results of this work suggest the
relationship between Pc. albina sugillata and Pi. bicolor is not one of direct causality, at
least not to the degree that reflects the societal concern for ‘smothering’ and ‘decimation’.
Contemporary studies have shown that diverse and abundant epifauna can grow on Pi.
bicolor (Kay and Keough, 1981, Keough, 1984). Bivalve aggregations comprising Malleus
malleus (hammer oysters) and Pi. bicolor have been recorded within the upper Spencer
Gulf in areas between the intertidal and 16 m depth (Shepherd, 1983, Edyvane, 1999b).
9898

Historical studies indicate that large numbers of O. angasi used to attach to the shell of Pi.
bicolor prior to their overexploitation and that the Inspector of Fisheries transplanted large
quantities of live specimens from one location to another for use as hard substrate to try
and re-establish failing native oyster reefs (Fisheries, 1886). Butler et al. (1993) also
suggest that Pinna might be a relatively stress-tolerant species.
Identifying species-specific traits that reflect ‘invasive’ behaviors can be challenging
(Sol et al., 2008). Literature and the Global Invasive Species Database do not indicate
invasive populations of Pi. albina elsewhere, but even extreme impacts from invasive
species are not always readily detectable (Simberloff et al., 2013). Consequently, the full
range of ecological, economic and social impacts regarding the presence of Pc. albina
sugillata should be considered (Simberloff et al., 2013) and the population monitored for
lag effects (Essl et al., 2015), or cumulative negative impacts that could lead to a trophic
cascade (Simberloff and Von Holle, 1999). Further research should also take into account
potential effects on the spawning or recruitment of Pi. bicolor, including those that might
incrementally impact the population over longer periods of time. Pinna have external
fertilization, are sessile from settlement and are slow growing, hence, there is a reliance on
proximity to other individuals and population dynamics depend on the ‘storage effect’, i.e.
highly variable recruitment compensated for by a long adult life (Butler et al., 1993). The
removal of adults from the population due to environmental effects, or fishing, could have
considerable impact on the population in the upper Spencer Gulf.
Non-native species can contribute positive effects where they provide important
ecosystem services to society, such as population control of other invasive species, or
habitat or food for native species (Schlaepfer et al., 2011, Madin et al., 2012). Pc. albina
sugillata in the upper Spencer Gulf forms dense aggregations and complex biogenic
habitat. As indicated here, larger quantities of Pc. albina sugillata attached to the shell of
Pi. bicolor can support larger amounts of epifauna, both total numbers and species
diversity. These fauna, such as annelids, bivalves and tanaids, could be providing a food
source to species of fish and crustacea associated with the area, including species of
commercial and recreational value. The large biomass of oysters would also be providing
enhanced water filtration capacity, thereby improving water quality (Kellogg et al., 2014).
Both of these functions would likely have been provided historically by the presence of
9999
oyster reefs formed by O. angasi. These reefs are now functionally extinct and a collective
inter-generational amnesia exists around their past occurrence, distribution and
productivity (Beck et al., 2011, Alleway and Connell, 2015). Pc. albina sugillata may be
providing environmental services that have been lost through the extirpation of oyster reefs
in the past and, consequently, may be of ecological or conservation value (Schlaepfer et
al., 2011, Davis et al., 2011).
Collective perception can shape public opinion of invasive species and public
awareness of issues does not always correlate with actual ecological risk (Gozlan et al.,
2013, Simberloff et al., 2013). The classification of Pc. albina sugillata as ‘highly
invasive’ is being driven by societal sensitivity. The engineering behaviour of oysters in
high densities would be confronting to a community that had no knowledge of or
experience with this type of habitat, particularly for people who are interacting with the
population regularly (there is strong opinion among recreational fishers that the species is
highly invasive). This perspective may be affected by intergenerational amnesia, of the
past occurrence of oyster reefs, such that the community now has a considerably lower
expectation for this habitat and the productivity of the ecosystem (Alleway and Connell,
2015). Where communities have lower expectations it is possible they will have difficulty
reconciling whether a species is invasive or a function of broadscale ecological change
(Sol et al., 2008) or show resistance to the positive benefits that introduced species might
bring (Walther et al., 2009, Davis et al., 2011).
The influence of the shifting baseline syndrome in invasion ecology is not widely
studied, but offers a more comprehensive understanding of changing balances between
species loss and addition. Historical ecological research, which has emerged as a field that
explicitly seeks to understand past ecological states and the interaction of humans with the
environment assists our interpretation of species-specific invasion ecologies (Jackson,
2001, Willis and Birks, 2006). Invasive species have contributed to ecological change over
a very long period of time (Willis and Birks, 2006, Carlton, 2009) and the continued
preoccupation with contemporary change as the time-frame for managing invasive species
is inconsistent with the drivers of their occurrence, establishment and impact. Historical
records could, therefore, be used to redress our understanding of cryptogenic and invasive
species, particularly where there is little information about the initial stages of the species’
100100
establishment. Because invasive species could contribute to ecological functions that have
been lost to history, as well as new opportunities (Walther et al., 2009, Schlaepfer et al.,
2011, Madin et al., 2012), historical ecology would assist scientists, managers and society
to perceive and coexist with non-native species.
Structured, transparent and participatory decision-making could also support clearer
definition of the behaviours and impacts that establish whether a species is invasive
(Estévez et al., 2014). The decision-making model developed here illustrates divergent
management outcomes with and without consideration of a historical baseline. Based on
the societal concern, and the political action achieved, initial discussions regarding
management actions considered eradication using a biological control agent; an extreme
measure for marine environments. Once the historical baseline was recovered
consideration of management changed to focus on resource use, with education and
communication to seek containment. This outcome suggests that shifting baselines could
be used more extensively to inform the ecological context of invading species and options
for their management. Certainly, management decisions based on perception alone are
insufficient to address issues associated with invasive species (Pauly, 1995, Gozlan et al.,
2013, Clavero, 2014). As changing climate will increasingly result in new instances of
range expansion or introductions, it may well be worth contemplating the ecological
services of range changing or dispersing non-natives and whether their coexistence with a
more historically and ecologically informed society is possible.
101101
Chapter 5: Loss of an ecological baseline through the
eradication of oyster reefs from coastal ecosystems and
human memory
5.1 Preface
Oyster reefs have been extirpated from many regions of the world. This loss has
contributed to associated declines in productivity, of oysters and reef associated fish
species, complex hard substrate and biological capacity for water filtration. Despite their
widespread deterioration and associated loss of valuable ecosystem services, oyster reefs in
many locations are given little consideration. This chapter uses archival fisheries records to
reconstruct a shifted ecological and cognitive baseline for oyster reefs formed by Ostrea
angasi. The reconstructed baseline illustrates that intergenerational amnesia can occur and
that the shifting baselines syndrome might reduce our expectations for contemporary
ecosystems. This chapter has been published in Conservation Biology and is reprinted here
with permission from John Wiley & Sons (Appendix B). The original manuscript can be
sourced from the publishers website:
http://onlinelibrary.wiley.com/doi/10.1111/cobi.12452/abstract.
102102

5.2 Statement of authorship
Principal Author
Name of Principal Author (Candidate) Heidi K. Alleway
Contribution to the Paper Conceptualised and designed the research, collated and analysed the data, interpreted the
results and wrote and edited the manuscript.
Overall percentage (%) 80%
Signature
Date 24/07/2015
Co-Author Contributions
By signing the Statement of Authorship, each author certifies that:
x. the candidate’s stated contribution to the publication is accurate (as detailed above);
xi. permission is granted for the candidate in include the publication in the thesis; and
xii. the sum of all co-author contributions is equal to 100% less the candidate’s stated contribution.
Name of Co-Author Sean D. Connell
Contribution to the Paper Assisted with the design of the research and analyses, the interpretation of results and writing
and editing the manuscript.
Signature
Date 15/07/2015
Title of Paper Loss of an ecological baseline through the eradication of oyster reefs from coastal ecosystems
and human memory
Publication Status Published Accepted for Publication
Submitted for Publication Publication Style
Publication Details Conservation Biology 29(3): 795-804. DOI: 10.1111/cobi.12452
103103
Contributed Paper
Loss of an ecological baseline through theeradication of oyster reefs from coastal ecosystemsand human memoryHeidi K. Alleway ∗ and Sean D. ConnellSouthern Seas Ecology Laboratories, School of Biological Sciences and The Environment Institute, University of Adelaide, SouthAustralia, 5005, Australia
Abstract: Oyster reefs form over extensive areas and the diversity and productivity of sheltered coasts dependon them. Due to the relatively recent population growth of coastal settlements in Australia, we were able toevaluate the collapse and extirpation of native oyster reefs (Ostrea angasi) over the course of a commercialfishery. We used historical records to quantify commercial catch of O. angasi in southern Australia from earlycolonization, around 1836, to some of the last recorded catches in 1944 and used our estimates of catchand effort to map their past distribution and assess oyster abundance over 180 years. Significant declines incatch and effort occurred from 1886 to 1946 and no native oyster reefs occur today, but historically oysterreefs extended across more than 1,500 km of coastline. That oyster reefs were characteristic of much of thecoastline of South Australia from 1836 to 1910 appears not to be known because there is no contemporaryconsideration of their ecological and economic value. Based on the concept of a shifted baseline, we considerthis contemporary state to reflect a collective, intergenerational amnesia. Our model of generational amnesiaaccounts for differences in intergenerational expectations of food, economic value, and ecosystem services ofnearshore areas. An ecological system that once surrounded much of the coast and possibly the past presenceof oyster reefs altogether may be forgotten and could not only undermine progress towards their recovery, butalso reduce our expectations of these coastal ecosystems.
Keywords: ecosystem collapse, historical ecology, historical fishing, Ostrea angasi, shifted baseline
La Perdida de una Lınea de Base Ecologica por Medio de la Erradicacion de Arrecifes de Ostion de los EcosistemasCosteros y la Memoria Humana
Resumen: Los arrecifes de ostion se forman a lo largo de areas extensas y tanto la diversidad y como laproductividad de las costas resguardadas dependen de ellos. Debido al incremento relativamente reciente delcrecimiento poblacional en Australia, pudimos evaluar el colapso y la extirpacion de arrecifes del ostion nativoOstrea angasi durante el desarrollo de una pesquerıa comercial. Usamos registros historicos para cuantificarla captura comercial de O. angasi en el sur de Australia desde la colonizacion temprana, aproximadamente1836, hasta algunas de las ultimas capturas registradas en 1944. Usamos nuestras estimaciones de captura yesfuerzo para mapear su distribucion anterior y evaluar la abundancia de los ostiones a lo largo de 180 anos.De 1886 hasta 1946 ocurrieron declinaciones significativas en la captura y el esfuerzo y en la actualidad noexisten arrecifes de ostion nativo, pero estos se extendıan historicamente a lo largo de mas de 1, 500 km delınea costera. Parece no ser conocido que estos arrecifes fueron caracterısticos de la mayor parte de la lıneacostera del sur de Australia de 1836 hasta 1910 porque no hay una consideracion contemporanea de suvalor ecologico y economico. Con base en el concepto de una lınea de base modificada, consideramos que esteestado contemporaneo refleja una amnesia inter-generacional y colectiva. Nuestro modelo de una amnesiageneracional representa diferencias en las expectativas inter-generacionales de alimento, valor economico yservicios ambientales de areas cercanas a la costa. Que un sistema ecologico que alguna vez rodeo una granparte de la costa y posiblemente la presencia anterior de arrecifes de ostion probablemente esten olvidados,
∗email [email protected] submitted June 22, 2014; revised manuscript accepted September 29, 2014.
795Conservation Biology, Volume 29, No. 3, 795–804C⃝ 2015 Society for Conservation BiologyDOI: 10.1111/cobi.12452104104
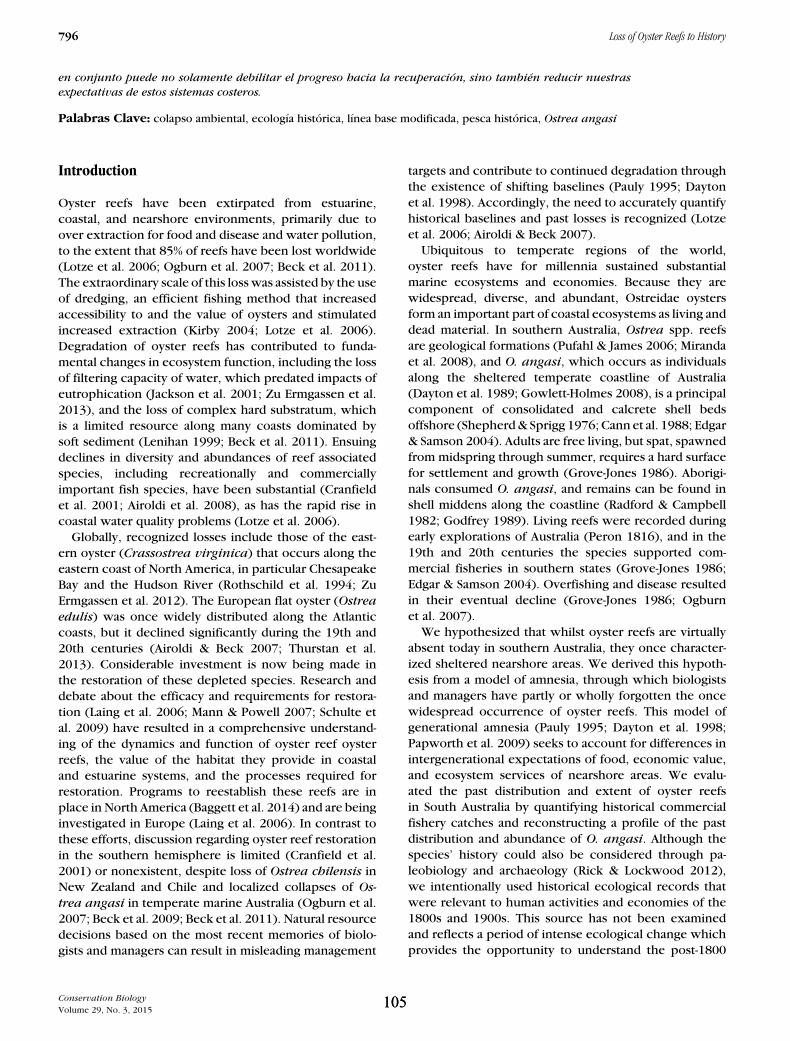
796 Loss of Oyster Reefs to History
en conjunto puede no solamente debilitar el progreso hacia la recuperacion, sino tambien reducir nuestrasexpectativas de estos sistemas costeros.
Palabras Clave: colapso ambiental, ecologıa historica, lınea base modificada, pesca historica, Ostrea angasi
Introduction
Oyster reefs have been extirpated from estuarine,coastal, and nearshore environments, primarily due toover extraction for food and disease and water pollution,to the extent that 85% of reefs have been lost worldwide(Lotze et al. 2006; Ogburn et al. 2007; Beck et al. 2011).The extraordinary scale of this loss was assisted by the useof dredging, an efficient fishing method that increasedaccessibility to and the value of oysters and stimulatedincreased extraction (Kirby 2004; Lotze et al. 2006).Degradation of oyster reefs has contributed to funda-mental changes in ecosystem function, including the lossof filtering capacity of water, which predated impacts ofeutrophication (Jackson et al. 2001; Zu Ermgassen et al.2013), and the loss of complex hard substratum, whichis a limited resource along many coasts dominated bysoft sediment (Lenihan 1999; Beck et al. 2011). Ensuingdeclines in diversity and abundances of reef associatedspecies, including recreationally and commerciallyimportant fish species, have been substantial (Cranfieldet al. 2001; Airoldi et al. 2008), as has the rapid rise incoastal water quality problems (Lotze et al. 2006).
Globally, recognized losses include those of the east-ern oyster (Crassostrea virginica) that occurs along theeastern coast of North America, in particular ChesapeakeBay and the Hudson River (Rothschild et al. 1994; ZuErmgassen et al. 2012). The European flat oyster (Ostreaedulis) was once widely distributed along the Atlanticcoasts, but it declined significantly during the 19th and20th centuries (Airoldi & Beck 2007; Thurstan et al.2013). Considerable investment is now being made inthe restoration of these depleted species. Research anddebate about the efficacy and requirements for restora-tion (Laing et al. 2006; Mann & Powell 2007; Schulte etal. 2009) have resulted in a comprehensive understand-ing of the dynamics and function of oyster reef oysterreefs, the value of the habitat they provide in coastaland estuarine systems, and the processes required forrestoration. Programs to reestablish these reefs are inplace in North America (Baggett et al. 2014) and are beinginvestigated in Europe (Laing et al. 2006). In contrast tothese efforts, discussion regarding oyster reef restorationin the southern hemisphere is limited (Cranfield et al.2001) or nonexistent, despite loss of Ostrea chilensis inNew Zealand and Chile and localized collapses of Os-trea angasi in temperate marine Australia (Ogburn et al.2007; Beck et al. 2009; Beck et al. 2011). Natural resourcedecisions based on the most recent memories of biolo-gists and managers can result in misleading management
targets and contribute to continued degradation throughthe existence of shifting baselines (Pauly 1995; Daytonet al. 1998). Accordingly, the need to accurately quantifyhistorical baselines and past losses is recognized (Lotzeet al. 2006; Airoldi & Beck 2007).
Ubiquitous to temperate regions of the world,oyster reefs have for millennia sustained substantialmarine ecosystems and economies. Because they arewidespread, diverse, and abundant, Ostreidae oystersform an important part of coastal ecosystems as living anddead material. In southern Australia, Ostrea spp. reefsare geological formations (Pufahl & James 2006; Mirandaet al. 2008), and O. angasi, which occurs as individualsalong the sheltered temperate coastline of Australia(Dayton et al. 1989; Gowlett-Holmes 2008), is a principalcomponent of consolidated and calcrete shell bedsoffshore (Shepherd & Sprigg 1976; Cann et al. 1988; Edgar& Samson 2004). Adults are free living, but spat, spawnedfrom midspring through summer, requires a hard surfacefor settlement and growth (Grove-Jones 1986). Aborigi-nals consumed O. angasi, and remains can be found inshell middens along the coastline (Radford & Campbell1982; Godfrey 1989). Living reefs were recorded duringearly explorations of Australia (Peron 1816), and in the19th and 20th centuries the species supported com-mercial fisheries in southern states (Grove-Jones 1986;Edgar & Samson 2004). Overfishing and disease resultedin their eventual decline (Grove-Jones 1986; Ogburnet al. 2007).
We hypothesized that whilst oyster reefs are virtuallyabsent today in southern Australia, they once character-ized sheltered nearshore areas. We derived this hypoth-esis from a model of amnesia, through which biologistsand managers have partly or wholly forgotten the oncewidespread occurrence of oyster reefs. This model ofgenerational amnesia (Pauly 1995; Dayton et al. 1998;Papworth et al. 2009) seeks to account for differences inintergenerational expectations of food, economic value,and ecosystem services of nearshore areas. We evalu-ated the past distribution and extent of oyster reefsin South Australia by quantifying historical commercialfishery catches and reconstructing a profile of the pastdistribution and abundance of O. angasi. Although thespecies’ history could also be considered through pa-leobiology and archaeology (Rick & Lockwood 2012),we intentionally used historical ecological records thatwere relevant to human activities and economies of the1800s and 1900s. This source has not been examinedand reflects a period of intense ecological change whichprovides the opportunity to understand the post-1800
Conservation BiologyVolume 29, No. 3, 2015
105105

Alleway & Connell 797
interaction of humans with this species (Szabo & Hedl2011).
Methods
We searched and recovered historical references relat-ing to O. angasi within the state of South Australia. Ourprimary historical references included reports from thechief inspector of fisheries (e.g., Randall 1911; McIntosh1913) and diaries and correspondence of fisheries inspec-tors (Inspector of Oyster Fisheries 1886; Inspector ofOyster Fisheries 1892). Secondary references were alsoreviewed (e.g., Wallace-Carter 1987) (information on ref-erences in Supporting Information).
Individual records (anecdotes or statements) were tran-scribed from these references and coded by date, biore-gion, location, and age. Records of catch (numerical andqualitative), and quantity were coded (absent, 0; rare,1; uncommon, 2; common, 3; abundant, 4; extremelyabundant) when they occurred as were records of fish-ing effort, catch rates, the number of persons or boatsengaged in the fishery, and catch per unit effort. Quan-tities of catch and effort within the fishery (number oflicensed boats and men) were assessed across time andtested for a model of simple linear regression and sig-nificance of the fit. All locations with records of fishingor payable beds (i.e., beds and fishing in named baysand near coastal townships, headlands, or geographicalfeatures) were mapped.
Proxies and phases of fisheries management provide ameans to assess past changes or phenomenon that can nolonger be quantified, as previously demonstrated throughthe historical loss of oyster reefs (Kirby 2004; White et al.2009). We summarized changes in the South Australianfishery, taking into account the proxies described byKirby (2004); that is, the date of implementation of regula-tions to manage the fishery, the beginning of importationof oysters to restock locations, and the earliest evidencefor bottom dredging. Records describing environmentalvariables were collated, for example the influence of rain-fall or seasonal growth of weed or interactions betweenO. angasi and other species.
Coding qualitative records to calculate perceived abun-dance has been used when quantitative surveys werenot available (e.g., Fortibuoni et al. 2010; Al-Abdulrazzaket al. 2012). We coded all records that referred to theabundance of oysters on a scale of 0 (absent) to 5 (ex-tremely abundant) (sensu Pandolfi et al. 2003) (examplesof coding in Supporting Information) and calculated themode of all values per annum. The modal value, beingthe most frequent record of abundance and most likelyecological state of the region at that time, was used toestimate oyster abundance in 2 marine bioregions andevaluate change over time.
Results
Past and Present of the Fishery
Beginning “in the early days of the colony” (c. 1836),O. angasi were commercially fished in South Australiafor more than 100 years. As many as 30 sailing cutters(a secondary reference indicates there might have been50 [Wallace-Carter 1987]) formed a fishing fleet that trav-eled large distances, often as a group (Fig. 1a). A dredge,consisting of an iron bar and mesh bag (Fig. 1b), wasused throughout the term of the fishery. A cutter woulddrag multiple dredges back and forth across a bed andall material in the bag was brought on board, where liveoysters were separated from bycatch. Beds were actively“worked down” (i.e., fished until the catch was low ornil), after which fishers would move on to other locations(Table 1).
Regulations governing oyster fishing formed SouthAustralia’s first fisheries legislation and came into effectin 1853, 4 years before the state attained its own govern-ment (Fig. 1c). Further legislation was enacted in 1873to introduce minimum size limits, a closed season foryoung from September to November, closure of areas asdeemed necessary, and penalties for depositing “injuriousmatter” on a bed, including matter dredged from that bed(Governor 1873). In 1885 a licensing system and exclu-sive rights to newly found beds was also introduced.These acts indicate the government was sufficiently con-cerned about the state of oyster beds and that declinesin stock were likely noticeable (Table 1) (Inspector ofOyster Fisheries 1886; Kirby 2004).
Presently, recreational and commercial fishing ofO. angasi is permitted, although there has not been arecent commercial catch (Knight & Tsolos 2012). Com-mercial oyster fishing is restricted through licensing,but spatial or seasonal closures are not prescribed. Thespecies is also not the subject of legislation, policy, ormanagement for conservation, protection, or recovery.
Catch and Effort
Total catch for the state of South Australia was recordedby the inspector for several non-contiguous periods from1886 to 1944. Catch was 2342 bags in 1886 and reacheda peak of 3549 bags in 1890 before declining to <1000bags/annum from 1910 onwards (Fig. 2a; R2 = 0.673,p = 0.000). The last catch reported was 139 bags in 1944.Gaps in the time series from 1891 to 1909 and 1915 to1936 were the result of a lack of reporting, and fishingwas recorded as occurring during this time. Fishery-wideeffort declined from at least 27 boats and 48 men in 1887to 8 boats and 14 men in 1914 (Fig. 2b; boats R2 = 0.594,p = 0.015; men R2 = 0.832, p = 0.002). After 1944 theoyster industry in South Australia turned to aquaculture ofthe introduced species Crassostrea gigas (Pacific oyster)
Conservation BiologyVolume 29, No. 3, 2015
106106
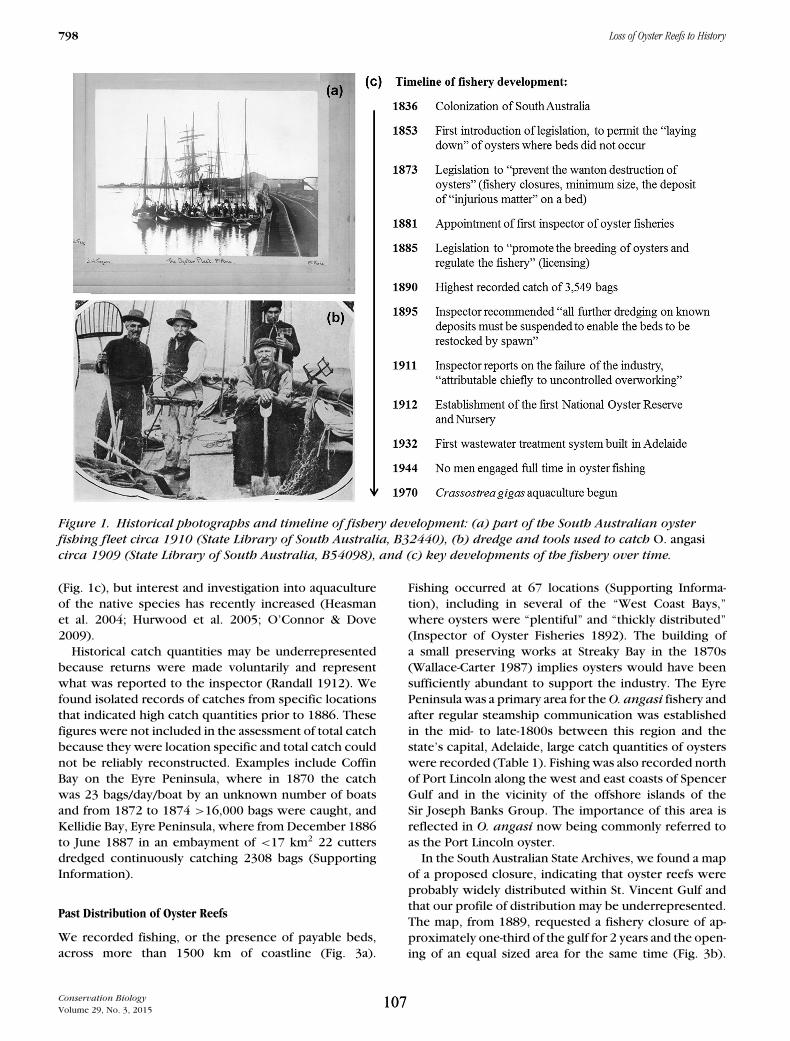
798 Loss of Oyster Reefs to History
Figure 1. Historical photographs and timeline of fishery development: (a) part of the South Australian oysterfishing fleet circa 1910 (State Library of South Australia, B32440), (b) dredge and tools used to catch O. angasicirca 1909 (State Library of South Australia, B54098), and (c) key developments of the fishery over time.
(Fig. 1c), but interest and investigation into aquacultureof the native species has recently increased (Heasmanet al. 2004; Hurwood et al. 2005; O’Connor & Dove2009).
Historical catch quantities may be underrepresentedbecause returns were made voluntarily and representwhat was reported to the inspector (Randall 1912). Wefound isolated records of catches from specific locationsthat indicated high catch quantities prior to 1886. Thesefigures were not included in the assessment of total catchbecause they were location specific and total catch couldnot be reliably reconstructed. Examples include CoffinBay on the Eyre Peninsula, where in 1870 the catchwas 23 bags/day/boat by an unknown number of boatsand from 1872 to 1874 >16,000 bags were caught, andKellidie Bay, Eyre Peninsula, where from December 1886to June 1887 in an embayment of <17 km2 22 cuttersdredged continuously catching 2308 bags (SupportingInformation).
Past Distribution of Oyster Reefs
We recorded fishing, or the presence of payable beds,across more than 1500 km of coastline (Fig. 3a).
Fishing occurred at 67 locations (Supporting Informa-tion), including in several of the “West Coast Bays,”where oysters were “plentiful” and “thickly distributed”(Inspector of Oyster Fisheries 1892). The building ofa small preserving works at Streaky Bay in the 1870s(Wallace-Carter 1987) implies oysters would have beensufficiently abundant to support the industry. The EyrePeninsula was a primary area for the O. angasi fishery andafter regular steamship communication was establishedin the mid- to late-1800s between this region and thestate’s capital, Adelaide, large catch quantities of oysterswere recorded (Table 1). Fishing was also recorded northof Port Lincoln along the west and east coasts of SpencerGulf and in the vicinity of the offshore islands of theSir Joseph Banks Group. The importance of this area isreflected in O. angasi now being commonly referred toas the Port Lincoln oyster.
In the South Australian State Archives, we found a mapof a proposed closure, indicating that oyster reefs wereprobably widely distributed within St. Vincent Gulf andthat our profile of distribution may be underrepresented.The map, from 1889, requested a fishery closure of ap-proximately one-third of the gulf for 2 years and the open-ing of an equal sized area for the same time (Fig. 3b).
Conservation BiologyVolume 29, No. 3, 2015
107107

Alleway & Connell 799
Table 1. Examples of historical records of fishing, decline, and associated environmental changes on oyster reefs in South Australia.
Topic Record Reference
Working down of beds “I proceeded and examined the Louth Bay Oyster Beds; heresix cutters were working, but doing little business as thebeds are worked down to about a bag and a half each perday . . . ”
Inspector of Oyster Fisheries(1886)
Decline “ . . . our once prolific oyster beds are every year becomingless reproductive and it is my firm conviction that nothingbut decisive measures can cope with the difficulty underwhich our oyster beds and cutters at present labour, thecontinual dredging and redredging by large number ofboats . . . if we are to conserve existing oyster beds andextend the industry, all further dredging on known depositsmust be suspended to enable the beds to be restocked byspawn from properly matured oysters.”
Inspector of Oyster Fisheries(1892)
Sequential expansion “In the early days of the colony the Oyster supply wasobtained from the Eastern shores of Yorke Peninsula andthe dredging there was continued for years, crossing andrecrossing over the same beds constantly withouthinderance, protection or regulation of any kind, so muchso that the beds were never allowed to rest, and the resultwas that Oyster beds were completely depopulated of allpower of reproduction to such an extent that for nearly20 years there were hardly any oysters to be obtained,where previously there was abundance, when the supplyceased on Yorke Peninsula then the Bays in theneighbourhood of Port Lincoln were resorted to, wherethere was an ample supply of splendid Oysters obtainedfrom fine natural beds covering a large area both in deepand shallow waters, chiefly Port Lincoln proper and BostonBay.”
Inspector of Oyster Fisheries(1886)
Abundance “I was engaged Oyster dredging myself at the time referred toand it was no uncommon thing for two men in one boat toraise 23 bags Oyster in one day . . . no less than 16,000 bagsoysters were dredged during the years 1872, 1873 and1874.”
Inspector of Oyster Fisheries(1886)
Overexploitation “The causes leading to the vanishment of what was at onetime a flourishing industry were believed to be attributablechiefly to uncontrolled over-working, by which the bedshad not only become depleted, but the natural “catchment”on which the spat is collected, consisting chiefly ofrazorfish, had been destroyed.”
Randall (1911)
Settlement and translocation ofnative bivalves
“I may add that the razorfish which I have transplanted fromPort Lincoln waters to Coffins Bay about 15 month since,are thriving very favourably, the young fish are to be seenspreading through all parts of the Bays, I trust that this willbe the means of reviving the decayed beds in Coffins Bayand form a new foundation for the Oyster spat to adhere to.”
Inspector of Oyster Fisheries(1886)
Impact of dredging “I would point out that dredging is always accompanied by alarge amount of unavoidable destruction to young oystersand oyster brood, and taking more than the marketrequirements from the natural beds simply means ruin . . . ”
Inspector of Oyster Fisheries(1892)
Records indicated that large quantities of oysters werecaught within the St. Vincent Gulf, and in the early daysof the colony (approximately 1836–1870) markets in Ade-laide were supplied from extensive beds along the YorkePeninsula and the north coast of Kangaroo Island (Randall1911; McIntosh 1913). Records of early overfishing in theregion were identified, and beds along the eastern shoreof Yorke Peninsula were referred to as prolific until about1855, after which a decrease in harvest and the numberof oysters on the beds was reported (Table 1).
Estimated Abundance of Oysters
Estimated abundance of oysters for all age classes at lo-cations on the Eyre Peninsula (n = 174) was 5 in 1836and 2 in 1938 (Fig. 4). Estimated abundance within St.Vincent Gulf (n = 113) was 4 in 1836 and 2 in 1925 (Fig.4). Abundance of spat and young was estimated as 4 and5 from 1888 to 1895, which may have reflected recoveryof previously fished beds within the St. Vincent Gulf afterfishing moved to the Eyre Peninsula (Inspector of OysterFisheries 1892).
Conservation BiologyVolume 29, No. 3, 2015
108108

800 Loss of Oyster Reefs to History
Figure 2. Historical statewide (a) total number ofbags of oysters (approximately 350 oysters per bag)and (b) number of licenses (as a measure of effort) inthe South Australian O. angasi fishery from 1886 to1946 (open symbols, values retrieved from secondaryreferences only).
Declines in estimated oyster abundance were sup-ported by records of actual declines, which we identifiedthrough the diaries and correspondence of the inspec-tor. For example, it was reported in 1895 that the “onceprolific beds” were every year becoming less produc-tive and the inspector stated that “nothing but decisivemeasures” were required, including the suspension ofall further dredging until the oysters could sufficientlyrecover (Table 1; Supporting Information).
Environmental and Ecological Records
We found no quantitative historical data on oyster dis-tribution, but we summarized the qualitative records todetermine something of the ecology of oyster reefs, theirassociated species, and the influence of environmentalfactors and dredging on population numbers and reefformation (records in Supporting Information). There
was no evidence of population decline resulting frompests or diseases, such as bonamiasis and Polydoraspp. (Ogburn et al. 2007). Records referenced the lackof both pest issues in South Australia and a perceivedresistance of O. angasi to Polydora spp.
Rainfall was recorded as promoting spawning and therecruitment and growth of spat. It was thought that runoffprovided food, and “starvation” of oysters was reportedduring years of low rainfall. A lack of rainfall in 1914was recorded as greatly affecting the work to recoverbeds in Port Lincoln. Cladophora spp. was recorded as“blanketing” beds in summer and dying back in winter.
Between 1885 and 1887, the inspector introduced anon-native oyster, Saccostrea glomerata (Sydney rockoyster), in an effort to establish an alternative oysterstock. During the early 1900s reestablishment of nativepopulations was tried through the translocation of Pinnabicolor (razor fish) across parts of the coastline. Thisspecies could be found with upwards of 50 native oys-ters attached to its shell and the Inspector repeatedlytransferred hundreds of individuals to locations wherethey did not naturally occur to provide hard substratefor the settlement of spat (Table 1). In 1912, the inspec-tor established the National Oyster Reserve and Nurseryin Proper Bay, Port Lincoln (Fig. 1c), and laid out arti-ficial hard substrate, including tree boughs, iron pots,pans, and tins to seed oysters (Supporting Information).Juveniles were then translocated to other parts of thestate.
The impact of dredging was known and recorded par-ticularly in reference to its non-selectivity, its impact onyoung oysters, the breaking up and removal of hard sub-strate (Table 1), as well as the potential long term siltationand smothering of reefs (Supporting Information) (Shep-herd 1986). Dredging also affected P. bicolor, decreasingits abundance, but this species was reported to haveincreased in numbers in some areas after the areas wereclosed to fishing (Inspector of Oyster Fisheries 1892).
DiscussionThe decline in catch from 1890 to 1910 signals the col-lapse of the oyster fishery in South Australia. Historicalaccounts, the implementation of legislation in the midand late 19th century, and patterns of perceived abun-dance suggest, however, that regional declines in oys-ter abundance were noticeable prior to the collectionof these catch records. The southern Australian fisherytraveled and dredged as a fleet, sometimes in groups of10–20 boats, at different sites across the state, wherebeds were then worked down before the fleet movedon to another location (Inspector of Oyster Fisheries1886; Inspector of Oyster Fisheries 1892). This is con-sistent with the sequential expansion and exploitationof fisheries elsewhere (Kirby 2004) and, at a reducedspatial scale, the practice of roving exploitation (Berkes
Conservation BiologyVolume 29, No. 3, 2015
109109

Alleway & Connell 801
Figure 3. (a) Historical distribution of oyster reefs in South Australia that no longer exist (solid circles),interpreted from records with reference to historical fishing or the presence of “payable beds” (star, location ofAdelaide; square, the area outlined in [b]) and (b) a map of St. Vincent Gulf in 1889 showing a proposed area ofoyster fishing closure (solid bold outline) and an area to be opened to fishing (triangular-shaped area below theproposed closed area).
et al. 2006). Dredging removed hard substrate, whichcontributed to siltation and the failure of larvae to recruitsuch that overexploitation was the driver of the eradica-tion of oyster reefs (Randall 1911). Changes due to landuse, including water pollution, have contributed to thedecline of oyster populations in other areas (Lotze et al.2006; White et al. 2009). It is possible that these impactsoccurred in South Australia, but the local spatial scale ofcatchment-based impacts cannot account for the largerscale of degradation and declines in oyster numbers thatoccurred prior to major catchment changes.
The eradication of reefs is similar to losses in otherareas (Airoldi & Beck 2007; Zu Ermgassen et al. 2012;Thurstan et al. 2013). Oyster fishing in South Australiabegan in the early days of the colony, around 1836, andformed the state’s first commercial fishery, illustratingthat oysters are vulnerable to cases of historical over-exploitation because they are accessible (Kirby 2004;Lotze et al. 2006). The timing of legislation indicates theimportance of oysters to the colony. The first act to en-courage development of the oyster fishery was gazettedin 1853, 4 years before South Australia attained a stateparliament. Subsequent legislation in 1873 introduced aminimum legal size, closed seasons, and protected areas.For this legislation to have been necessary, declines in
abundance were likely noticeable (Inspector of OysterFisheries 1892; Kirby 2004). This act also introducedpenalties for dumping bycatch onto reefs, including “bal-last, sand, mud, refuse, or injurious matter of any naturewhatsoever,” even when this material was removed fromthat same bed (Governor 1873). Hard substrate is nec-essary to the perpetuation of reefs through time (Mann& Powell 2007), and it is possible that the removal ofexcess material from the reef area contributed to theirdegradation.
Commercial oyster fisheries occurred concurrentlyacross the southern coastline of Australia, and our profilerepresents only a portion of this activity (Grove-Jones1986; Edgar & Samson 2004). The geological and archae-ological presence of oysters has not been quantified inour study area (Szabo & Hedl 2011; Rick & Lockwood2012), although O. angasi has been identified in Aborigi-nal shell middens at other locations (Radford & Campbell1982; Godfrey 1989). Combined with the potential un-derrepresentation of catch statistics because of voluntaryreporting (Randall 1912), although under reporting maynot have occurred consistently and in some years compar-atively more oysters may have been reported, our profilelikely understates the overall scale of loss of reefs acrossspace and time.
Conservation BiologyVolume 29, No. 3, 2015
110110

802 Loss of Oyster Reefs to History
Figure 4. Estimated abundance of all O. angasi, of adults, and of spat and young on the Eyre Peninsula (n = 174)and within St. Vincent Gulf (n = 113), South Australia, based on calculations of annual perceived abundancefrom 1830 to 1950 (closed circles, modal value of all records per year; open circles, values based on a single recordof abundance for that year).
Although oyster reefs formed by O. angasi were pre-viously widely distributed in southern Australia, to datethere has been a focus on reporting historical oyster fish-ing and the loss of oyster reefs from only a small numberof locations (i.e., greater Coffin Bay, the area surroundingPort Lincoln, and Stansbury on the Yorke Peninsula) (e.g.,Grove-Jones 1986; Hone 1993; Olsen 1994). Fishing wasnot limited to these locations, and we found that oysterreefs were present in the past across more than 1500km of coastline. Recent quantitative surveys of the distri-bution and abundance of fauna encompassing these lo-cations detected only individuals, not aggregations (e.g.,Shepherd 1983; Tanner 2005). These locations are nowpredominantly areas of sand and mud. In some areas,algae and seagrass predominate (Grove-Jones 1986), andin other areas the benthos lacks large macrofauna andflora (Tanner 2005).
Early attempts, over 100 years ago, to prevent thecollapse of native oyster reefs through protected areaswere not realized, and no reefs are known to exist to-day. We believe the loss of reefs in southern Australiarepresents one of the more substantial losses of an eco-logically important and widespread ecosystem becausethese reefs would have supported the productivity ofassociated fishes, stabilized soft sediment, and helpedmaintain water quality (Lenihan 1999; Jackson et al. 2001;Lotze et al. 2006). Decreases in the diversity of speciesassociated with oyster reefs have been attributed to lossof habitat (Airoldi et al. 2008), as have declines in thedensity and productivity of commercially important fishspecies (Cranfield et al. 2001; Peterson et al. 2003).
As filter feeders, oysters play a disproportionatelylarge role in maintaining coastal water quality (Officeret al. 1982; Ulanowicz & Tuttle 1992). The degradation
Conservation BiologyVolume 29, No. 3, 2015
111111

Alleway & Connell 803
of coastal water quality has contributed to substantialecological (Connell et al. 2008) and economic costs inlocalities like South Australia (Fernandes et al. 2009), andit is possible that the loss of oyster reefs has compoundedthese costs. Seagrasses and kelp forests in South Australiahave declined by 60–70% from their original state at acost of AUD$67.1 million (Connell et al. 2008; HattonMacDonald et al. 2014). To readdress this loss, thegovernment spends more than AU$100 million/annumto improve the quality of water discharged fromits wastewater treatment plants (South AustralianWater Corporation 2013). For many locations, includingAustralia, the feasibility of improving coastal water qualitythrough restoring oyster populations is unknown. Thecost of programs in the United States for such purposesare substantial (Zu Ermgassen et al. 2013; Baggett et al.2014) and the success uncertain (Mann & Powell 2007).
Amnesia represents a state in which there has partlyor wholly been a loss of human memory. We suggestthat the 180 years that have lapsed since fishing forO. angasi began and a lack of data (Papworth et al.2009) has contributed to a collective amnesia regardingthis species’ past distribution, abundance and reefs. Thecurrent lack of consideration of this species represents astriking contrast to the attention it was paid historically.Despite repeated introduction of legislation during themid- to late-1800s, for protected areas, minimum sizelimits, and restoration, current legislation relates onlyto the licensing of commercial fishing. By recalling theformer extensiveness of oyster reefs, a shifting base-line can also be recovered (Pauly 1995; Dayton et al.1998). Recovering a past baseline will improve the per-ception and expectations for oyster reefs and create amore accurate model for setting conservation targets(Papworth et al. 2009). Our model of generational am-nesia accounts for differences in intergenerational ex-pectations of ecosystems and the food, economic value,and ecosystem services they provide. Such amnesia mayundermine progress toward restoration of ecosystemsbecause researchers, managers, and the public may havereduced expectations of an ecosystem’s potential. Ourresults highlight that the baseline for oyster reefs in south-ern Australia needs to be corrected. If it is not, it may beforgotten that oyster reefs once characterized the coast-line or that they were present at all.
Acknowledgments
We thank J.L. Ruesink, also P.S.E. Zu Ermgassen, K.A.McGraw, R.C. Mann, S.A. Shepherd, and S.M. Clarke forinvaluable discussions and B. Knill and D. Peacock forassistance developing the database. We also thank thereviewers and handling editor for thorough and con-structive feedback that greatly improved the manuscript.We acknowledge the support of Primary Industries andRegions South Australia and an Australian Research Coun-cil Future Fellowship to S.D.C.
Supporting Information
A historical reference list (Appendix S1), codes for abun-dance (Appendix S2), fishery timeline (Appendix S3),catch estimates (Appendix S4), list of locations (Ap-pendix S5), example records (Appendix S6), and mapof the National Oyster Reserve 1889 (Appendix S7) areavailable online. The authors are solely responsible forthe content and functionality of these materials. Queries(other than the absence of material) should be directedto the corresponding author.
Literature Cited
Airoldi L, Balata D, Beck MW. 2008. The Gray Zone: relationships be-tween habitat loss and marine diversity and their application inconservation. Journal of Experimental Marine Biology and Ecology366:8–15.
Airoldi L, Beck MW. 2007. Loss, status and trends for coastal marinehabitats of Europe. Oceanography and Marine Biology: An AnnualReview 45:345–405.
Al-Abdulrazzak D, Naidoo R, Palomares MLD, Pauly D. 2012. Gainingperspective on what we’ve lost: the reliability of encoded anec-dotes in historical ecology. PLOS ONE 7:e43386. DOI: 10.1371/jour-nal.pone.0043386.
Baggett LP, Powers SP, Brumbaugh R, Coen LD, DeAngelis B, GreeneJ, Hancock B, Morlock S. 2014. Oyster habitat restoration monitor-ing and assessment handbook. Page 96. The Nature Conservancy,Arlington, VA.
Beck MB, et al. 2009. Shellfish reefs at risk: a global analysis of problemsand solutions. Page 52. The Nature Conservancy, Arlington, VA.
Beck MW, et al. 2011. Oyster reefs at risk and recommendations for con-servation, restoration, and management. BioScience 61:107–116.
Berkes F, et al. 2006. Globalization, roving bandits, and marine re-sources. Science 311:1557–1558.
Cann JH, Belperio AP, Gostin VA, Murray-Wallace CV. 1988. Sea-levelhistory, 45,000 to 30,000 yr B.P., inferred from benthic foraminifera,Gulf St. Vincent, South Australia. Quaternary Research 29:153–175.
Connell SD, Russell BD, Turner DJ, Shepherd SA, Kildea T, Miller D,Airoldi L, Cheshire A. 2008. Recovering a lost baseline: missing kelpforests from a metropolitan coast. Marine Ecology Progress Series360:63–72.
Cranfield HJ, Carbines G, Michael KP, Dunn A, Stotter DR, Smith DJ.2001. Promising signs of regeneration of blue cod and oyster habitatchanged by dredging in Foveaux Strait, southern New Zealand. NewZealand Journal of Marine and Freshwater Research 35:897–908.
Dayton PK, Carleton JH, Mackley AG, Sammarco PW. 1989. Patterns ofsettlement, survival and growth of oysters across the Great BarrierReef. Marine Ecology Progress Series 54:75–90.
Dayton PK, Tegner MJ, Edwards PB, Riser KL. 1998. Sliding baselines,ghosts, and reduced expectations in kelp forest communities. Eco-logical Applications 8:309–322.
Edgar GJ, Samson CR. 2004. Catastrophic decline in mollusc diversityin eastern Tasmania and its concurrence with shellfish fisheries.Conservation Biology 18:1579–1588.
Fernandes M, Bryars S, Mount G, Miller D. 2009. Seagrasses as a sink forwastewater nitrogen: the case of the Adelaide metropolitan coast.Marine Pollution Bulletin 58:290–311.
Fortibuoni T, Libralato S, Raicevich S, Giovanardi O, Solidoro C. 2010.Coding early naturalists’ accounts into long-term fish communitychanges in the Adriatic Sea (1800–2000). PLOS ONE 5:e15502. DOI:10.1371/journal.pone.0015502.
Conservation BiologyVolume 29, No. 3, 2015
112112

804 Loss of Oyster Reefs to History
Godfrey MCS. 1989. Shell midden chronology in southwestern Victoria:Reflections of change in prehistoric population and subsistence?Archaeology in Oceania 24:65–69.
Governor (A. Musgrave). 1873. The Oyster Fisheries Act. GovernmentPrinter, Adelaide.
Gowlett-Holmes K. 2008. A field guide to the marine invetebrates ofSouth Australia. Notomares, Tasmania, Australia.
Grove-Jones R. 1986. Experimental Cultivation of Native (Ostrea an-gasi) and Pacific (Crassostrea gigas) Oysters in South Australia.South Australian Department of Fisheries, Adelaide.
Hatton MacDonald D, Ardeshiri A, Rose JM, Russell BD, Connell SD.2014. Valuing coastal water quality. Marine Policy 52:116–124.
Heasman M, Diggles BK, Hurwood D, Mather P, Pirozzi I, DworjanynS. 2004. Paving the way for continued rapid development of theflat (angasi) oyster (Ostrea angasi) farming industry in New SouthWales in N. Fisheries, editor. NSW Fisheries Final Report Series No.66, NSW Fisheries, Nelson Bay, New South Wales.
Hone P. 1993. Introduction of Crassostrea gigas (Pacific oyster) inSouth Australia. Shellfish Environmental Monitoring Program. De-partment of Primary Industries Fisheries Division, Adelaide, SouthAustralia.
Hurwood DA, Heasman MP, Mather PB. 2005. Gene flow, colonisationand demographic history of the flat oyster Ostrea angasi. Marineand Freshwater Research 56:1099–1106.
Inspector of Oyster Fisheries. 1886. Diary and letter book. Departmentof Marine and Harbors, Adelaide.
Inspector of Oyster Fisheries. 1892. Diary and letter book. Departmentof Marine and Harbors, Adelaide.
Jackson JBC, et al. 2001. Historical overfishing and the recent collapseof coastal ecosystems. Science 293:629–638.
Kirby MX. 2004. Fishing down the coast: historical expansion and col-lapse of oyster fisheries along continental margins. Proceedings ofthe National Academy of Sciences 101:13096–13099.
Knight M, Tsolos A. 2012. South Australian Wild Fisheries Informationand Statistics Report 2010/11. South Australian Research and De-velopment Institute (Aquatic Sciences), Adelaide. SARDI ResearchReport Series No. 62
Laing I, Walker P, Areal F. 2006. Return of the native—is Europeanoyster (Ostrea edulis) stock restoration in the UK feasible. AquaticLiving Resources 19:283–287.
Lenihan HS. 1999. Physical-biological coupling on oyster reefs: howhabitat structure influences individual performance. EcologicalMonographs 69:251–275.
Lotze HK, Lenihan HS, Bourque BJ, Bradbury RH, Cooke RG, Kay CM,Kidwell SM, Kirby MX, Peterson CH, Jackson JBC. 2006. Depletion,degradation, and recovery potential of estuaries and coastal seas.Science 312:1806–1809.
Mann RC, Powell EN. 2007. Why oyster restoration goals in the Chesa-peake Bay are not and probably cannot be achieved. Journal ofShellfish Research 26:905–917.
McIntosh S. 1913. Fisheries—Report of Chief Inspector for 1912–13.House of Assembly, South Australia.
Miranda JA, Wallace MW, McLaren S. 2008. The Norwest Bend Forma-tion: implications for the evolution of Neogene drainage in south-eastern Australia. Sedimentary Geology 205:53–66.
O’Connor WA, Dove MC. 2009. The changing face of oyster culture inNew South Wales, Australia. Journal of Shellfish Research 28:803–811.
Officer CB, Smayda TJ, Mann R. 1982. Benthic filter feeding: a naturaleutrophication control. Marine Ecology Progress Series 9:203–210.
Ogburn DM, White I, McPhee DP. 2007. The disappearance of oysterreefs from eastern Australian estuaries—impact of colonial settle-ment of mudworm invasion? Coastal Management 35:271–287.
Olsen AM. 1994. The history of the development of the Pacific oysterCrassostrea gigas (Thunberg) industry in South Australia. Transac-tions of the Royal Society of South Australia 118:253–259.
Pandolfi JM, et al. 2003. Global trajectories of the long-term decline ofcoral reef ecosystems. Science 301:955–958.
Papworth SK, Rist J, Coad L, Milner-Gulland EJ. 2009. Evidence forshifting baseline syndrome in conservation. Conservation Letters2:93–100.
Pauly D. 1995. Anecdotes and the shifting baseline syndrome of fish-eries. Trends in Ecology & Evolution 10:430.
Peron F. 1816. 15: Historical perspective: Kangaroo Island—1803. TylerMJ, Twidale CR, Ling JK, editors. Natural history of Kangaroo Island.Royal Society of South Australia, Adelaide, South Australia.
Peterson CH, Grabowski JH, Powers SP. 2003. Estimated enhancementof fish production resulting from restoring oyster reef habitat: quan-titative valuation. Marine Ecology Progress Series 264:249–264.
Pufahl PK, James NP. 2006. Monospecific Pliocene oyster buildups,Murray Basin, South Australia: brackish water end member of thereef spectrum. Palaeobiology, Palaeoclimatology, Palaecology 233:11–33.
Radford R, Campbell V. 1982. Archaeology of the southern Adelaideregion. Anthropological Society of South Australia 20:1–8.
Randall WG. 1911. Report of the chief inspector of oyster fisheries onoyster-fishing. House of Assembly, South Australia.
Randall WG. 1912. Report of the chief inspector of oyster fisheries onoyster-fishing. House of Assembly, South Australia.
Rick TC, Lockwood R. 2012. Integrating paleobiology, archeology,and history to inform biological conservation. Conservation Biology27:45–54.
Rothschild BJ, Ault JS, Goulletquer P, Heral M. 1994. Decline of theChesapeake Bay oyster population: a century of habitat destuctionand overfishing. Marine Ecology Progress Series 111:29–39.
Schulte DM, Burke RP, Lipcius RN. 2009. Unprecedented restoration ofa native oyster metapopulation. Science 325:1124–1128.
Shepherd SA. 1983. Benthic communities of upper Spencer Gulf,South Australia. Transactions of the Royal Society of South Australia107:69–85.
Shepherd SA. 1986. Coastal waters. Pages 182–199 in Nance C, SpeightDL, editors. A land transformed: environmental change in SouthAustralia. Longman Cheshire, Melbourne.
Shepherd SA, Sprigg RC. 1976. Substrate, sediments and subtidal ecol-ogy of Gulf St. Vincent and Investigator Strait. Pages 161–174 inTwidale CR, Tyler MJ, Webb BP, editors. Natural history of theAdelaide region. Royal Society of South Australia, Adelaide.
South Australian Water Corporation. 2013. Annual Report, for the yearending 30 June 2013. South Australian Water Corporation, Adelaide,Australia.
Szabo P, Hedl R. 2011. Advancing the intergation of history and ecologyfor conservation. Conservation Biology 25:680–687.
Tanner JE. 2005. Three decades of habitat change in Gulf St. Vincent,South Australia. Transactions of the Royal Society of South Australia129:65–73.
Thurstan RH, Hawkins JP, Roberts CM. 2013. Oyster (Ostrea edulis)extirpation and ecosystem transformation in the Firth of Forth,Scotland. Journal for Nature Conservation 21:253–261.
Ulanowicz RE, Tuttle JH. 1992. The trophic consequences of oysterstock rehabilitation in Chesapeake Bay. Estuaries 15:298–306.
Wallace-Carter E. 1987. For they were fishers: the history of the fishingindustry in South Australia. Amphitrite Publishing House, Adelaide.
White J, Ruesink JL, Trimble AC. 2009. The nearly forgotten oyster:Ostrea lurida Carpenter 1864 (Olympia oyster) history and manage-ment in Washington State. Journal of Shellfish Research 28:43–49.
Zu Ermgassen PSE, et al. 2012. Historical ecology with real numbers:past and present extent and biomass of an imperilled estuarinehabitat. Proceedings of the National Academy of Sciences 279:3393–3400.
Zu Ermgassen PSE, Spalding MD, Grizzle RE, Brumbaugh RD. 2013.Quantifying the loss of a marine ecosystem service: filtration by theeastern oyster in US estuaries. Estuaries and Coasts 36:36–43.
Conservation BiologyVolume 29, No. 3, 2015
113113

1
Supporting Information
Loss of an ecological baseline through the eradication of oyster reefs from
coastal ecosystems and human memory
Heidi K. Alleway* and Sean D. Connell
Southern Seas Ecology Laboratories, School of Biological Sciences and The
Environment Institute, University of Adelaide, South Australia, Australia, 5005,
Australia
Appendix S1. List of the historical references used to evaluate the past distribution,
abundance and fishery for the mud oyster Ostrea angasi (references listed are only
those found to contain records relating to this species).
Reference Details
Location of
Reference
Correspondence and notes
(assembled by H. M. Hale) on
oyster beds and commercial
fisheries, 1926-36
Letters discussing aspects of oysters and
oyster fishing, including regarding the First
Progress Report of the Royal Commission
on the Fishing Industry, January 2 1934
(GRG19/402)
State Records of
South Australia:
South Australian
Museum
Correspondence Files of the
Senior Inspector of Oyster
Fisheries (no date)
Letters, correspondence and informal
reports, including reports on surveys for
new locations of oyster beds
State Records of
South Australia:
Department of
Fisheries
Diary and Letter Book of the
Inspector of Oyster Fisheries
(Volume 1), 1886-92
Diary containing draft and printed
correspondence, and notes regarding travels,
inspections and investigations (GRG51/289)
State Records of
South Australia:
Department of
Marine and Harbors
and predecessors
Diary and Letter Book of the
Inspector of Oyster Fisheries
(Volume 2), 1892-95
Diary containing draft and printed
correspondence, and notes regarding travels,
inspections and investigations (GRG51/289)
State Records of
South Australia:
Department of
Marine and Harbors
and predecessors
Stray Documents Box of stray documents (letters, maps and
correspondence) (GRG51/169)
State Records of
South Australia:
Department of
Marine and Harbors
and predecessors
Randall, W. G. 1911. Report of
the Chief Inspector of Oyster
Fisheries on Oyster-Fishing
Industry. House of Assembly,
South Australia
Report summarizing research on past
aspects of the oyster industry, its failure and
options of restoration of oyster beds and the
fishery (includes photographs of work)
State Records of
South Australia:
Parliamentary
Papers
Randall, W. G. 1912. Report of
the Chief Inspector of Oyster
Report summarizing work undertaken for
restoration of oyster beds and the fishery
State Records of
South Australia:
114114

2
Fisheries on Oyster-Fishing
Industry. House of Assembly,
South Australia
(includes photographs of work) Parliamentary
Papers
McIntosh, S. 1913. Fisheries—
Report of Chief Inspector for
1912-13. House of Assembly,
South Australia
Annual fisheries report, including summary
of oyster fishery
State Records of
South Australia:
Parliamentary
Papers
McIntosh, S. 1914. Fisheries—
Report of Chief Inspector for
1913-14. House of Assembly,
South Australia
Annual fisheries report, including summary
of oyster fishery
State Records of
South Australia:
Parliamentary
Papers
Moorhouse, F. W. 1938. Report
on the Operations of the
Fisheries and Game
Department, 1936-38.
Government Printer, Adelaide
Annual fisheries report, including summary
of oyster fishery
State Records of
South Australia:
Legislative Council
Papers
Moorhouse, F. W. 1939. Report
on the Operations of the
Fisheries and Game
Department, 1938-39.
Government Printer, Adelaide
Annual fisheries report, including summary
of oyster fishery
State Records of
South Australia:
Legislative Council
Papers
Moorhouse, F. W. 1940. Report
on the Operations of the
Fisheries and Game
Department, 1939-40.
Government Printer, Adelaide
Annual fisheries report, including summary
of oyster fishery
South Australia:
Legislative Council
Papers
Moorhouse, F. W. 1943. Report
on the Operations of the
Fisheries and Game
Department, 1942-43.
Government Printer, Adelaide
Annual fisheries report, including short
summary of oyster fishery
South Australia:
Legislative Council
Papers
Moorhouse, F. W. 1945. Report
on the Operations of the
Fisheries and Game
Department, 1943-45.
Government Printer, Adelaide
Annual fisheries report, including short
summary of oyster fishery
South Australia:
Legislative Council
Papers
Marine Invertebrates Collection
Records
Identification cards for dry O. angasi
samples
South Australian
Museum
Chart of the Approach to Port
Augusta: Showing Established
Lights
Cartographic Material of the Adelaide
Marine Board
State Library of
South Australia
Corbett, D. (Ed). 1973. Yorke
Peninsula: A Natural History.
University of Adelaide,
Adelaide
Natural history text with chapters relating to
different aspects of the environment
(terrestrial and marine) of the Yorke
Peninsula
State Library of
South Australia
Olsen, A. M. 1994. The history
of the development of the
Pacific oyster Crassostrea gigas
(Thunberg) industry in South
Australia. Transactions of the
Royal Society of South
Australia 118:253-259
Research article describing the development
of Pacific oyster aquaculture in South
Australia
University of
Adelaide Library
Perry, D. 1985. Early Glenelg
and Holdfast Bay. Research
Research paper discussing aspects of the
early settlement and development of
State Library of
South Australia
115115

3
Paper, Adelaide Holdfast Bay, Adelaide region
Tyler, M. J. & C. R. Twidale
(Eds). 1979. Natural History of
Kangaroo Island. Royal Society
of South Australia, Adelaide
Natural history text with chapters relating to
different aspects of the environment
(terrestrial and marine) of the Kangaroo
Island
State Library of
South Australia
Wallace-Carter, E. 1987. For
They Were Fishers. Amphitrite
Publishing House, Adelaide
Humanities text discussing the fisheries of
South Australia and their development
State Library of
South Australia
116116

4
Appendix S2. Categories, examples of historical records regarding O. angasi ascribed
to each category, and the code allocated to calculate estimated abundance of oysters
and oyster reefs in South Australia.
Perceived abundance Example anecdotes Code
Extremely abundant Prolific, very large supply, very plentiful, immensely large
quantity 5
Abundant
A large/fairly large/considerable quantity/s, plentiful/plenty, an
ample supply, good supplies, entirely satisfactory, doing a fine
business, good returns for the labour
4
Common
A quantity, a good/moderate/fair quantity/s, fair quantity,
satisfactory returns/results, obtainable, doing fairly well,
progressing favourably
3
Uncommon Very limited quantity/s, not entirely satisfactory 2
Rare Not satisfactory, very few, without marked success 1
Absenta
Absent, not found 0
a ‘Absent’ was assigned for references to known current or past presence of oysters. Where no records
or no data were available for a site the anecdote was not coded.
117117

5
Appendix S3. Timeline of the development of oyster fishing and key events in the
South Australian O. angasi fishery.
Year Reference
c. 1836
‘During the first twenty years of the colony's existence oyster lovers rejoiced in the
abundance of the tasty mollusc which were 'a valuable element in the pleasure of a visit
to the Bay (Holdfast Bay) … (Perry, D. 1985. Early Glenelg and Holdfast Bay. Research Paper (State Library of SA). Adelaide, South Australia).
1853
‘An Act to encourage the formation of Oyster Beds, and to protect the same.’ [First Act
implemented for: the ‘laying down’ of beds where no natural beds occur and prohibiting
the unlawful taking of oysters from these areas.]
1873
‘An Act to provide for the formation and protection of Oyster Beds, and to prevent the
wanton destruction of Oysters.’ [New Act implemented for the ‘laying down’ of beds
where no natural beds occur and prohibiting the unlawful taking of oysters from these
areas, as well as: 1. the introduction of penalties for the taking and sale of any oysters or
oyster brood during the months of September, October and November, 2. the introduction
of penalties for the depositing of injurious material on any natural or artificial bed, 3. the
right of the Commissioner to close any natural oyster bed for a set term (not exceeding 3
years) and the introduction of penalties for fishing within these areas, 4. the introduction
of penalties for raising, taking or catching oysters less than six inches in circumference
and not returning this spat, cultch or small oysters to the bed within 6 hours, unless
replenishing an artificial bed, and 5. the provision of an exclusive access license to any
new natural oyster bed found by any person.]
1881 Appointment of first Inspector of Oyster Fisheries.
1885
‘An Act to promote the Breeding of Oysters and to regulate the Oyster Fishery.’ [New
Act implemented for: 1. the issuing of licenses for every vessel and every person engaged
in oyster fishing and introduction of penalties for fishing without a license, 2. continued
provision of exclusive rights to a natural oyster bed found by any person as well as the
revocation of this license if believed that the bed is likely to be exhausted or greatly
reduced in value, 3. the provision of licenses to form artificial beds, 3. the right of the
Treasurer to close any natural oyster bed for a set term (not exceeding 4 years) and the
introduction of penalties for fishing within these areas, 4. continued penalties for the
depositing of injurious material on any natural or artificial bed, and 5. the appointment of
an Inspector by the Governor for administration of the Act.]
Prior to
1885,
through
1889
Introduction of Saccostrea commercialis (Sydney rock oysters). S. commercialis were
deposited in various regions including, Victor Harbor, Port Adelaide, Port Lincoln and
Coffin Bay and while reported to have thrived did not establish a spawning population.
1887
onwards
Pinna bicolor collected by the Inspector of Oyster Fisheries from Port Lincoln waters and
transplanted to Coffin Bay (where they were not present at the time) to try and promote
the recruitment and growth of oyster spat.
1895
Correspondence by the Inspector of Oyster Fisheries indicated the depleted state of stocks
and the need for the suspension of dredging on all beds: “Before concluding however I
would beg respectfully to bring under your notice a fact that I have alluded to in my
former reports namely that our once prolific oyster beds are every year becoming less
reproductive and it is my firm conviction that nothing but decisive measures can cope
with the difficulty under which our oyster beds and cutters at present labour, the
continual dredging and re-dredging by large number of boats, over our known beds for
the last 35 years to my knowledge, has had the effect of reducing the size of marketable
oysters, and their quantity to a minimum, and if the same treatment prevails over the
same grounds the evil will be yet greater and quite irremediable, if we are to conserve
existing oyster beds and extend the industry, all further dredging on known deposits must
be suspended to enable the beds to be restocked by spawn from properly matured
oysters.”
118118

6
1911
Annual Report of the Chief Inspector of Oyster Fisheries included a review of the Oyster-
Fishing Industry:
“THE FAILURE OF THE INDUSTRY – After some months of research the following
conclusion was arrived at:- That the oyster supply was practically exhausted. The few
remaining licensed oystermen were not making a living; many of them had put wells into
their boats and engaged in other fishing. As a matter of fact, the State was dependent
upon New South Wales, Queensland, and New Zealand for her oyster supply. Such was
the position at this time.”
“CAUSES OF THE FAILURE - The cause leading to the vanishment of what was at one
time a flourishing industry were believed to be attributable chiefly to uncontrolled over-
working, by which the beds had not only become depleted, but the natural "catchment"
on which the spat is collected, consisting chiefly of razorfish, had been destroyed.”
“SUGGESTED REMEDY - OYSTER CULTURE - The next consideration was the best
method of repopulating the at present almost barren waters. Artificial cultivation was
believed to be the only practical solution. Simply closing the beds had been tried with
apparently small benefit; just as well take off your crop and sit on the nearest fence in the
vain expectation of seeing a fresh one spring up.”
1911
Material used as cultch (kerosene and other tins, galvanized iron, pots, pans, kettles, old
iron, and tanks, as well as 50 tons of green mallee boughs) deposited in Proper Bay (Port
Lincoln) in early October to try and promote greater settlement and establishment of spat.
1912 Establishment of the first National Oyster Reserve and Nursery in Proper Bay; reported
to be Australia’s first State oyster reserve.
1912 Continued introduction of Saccostrea commercialis
1913
Oysters naturally growing within the Proper Bay nursery transferred to Eastern Cove and
Western Cove on Kangaroo Island to try and establish a second oyster reserve in this
region.
1914 Continued transplanting to try and restock depleted beds.
1938
In the 1936-38 Report on the Operations of the Fisheries and Game Department it was
highlighted that few oysters passed through the Adelaide Fish Market anymore and the
small number caught went directly to private buyers. This report also indicated the
effective end of the industry: “The oyster industry in South Australia is languishing. Only
one centre of any consequence now produces oysters commercially. This centre is the
bays and waters in the Coffin's Bay area, Mount Dutton Bay, and Kellidie Bay being the
two waters in particular from which the oysters are taken. Oyster dredging is a very
arduous task, so with the price of oysters averaging 25s. a bag of 35 to 40 doz., few
oystermen are operating to-day, the majority having turned their attention to fishing.”
1943-45
No men were engaged full time in the industry with 139 bags marketed for the year 1943-
44 (through the Adelaide Fish Market, other regional centres may have traded) and the
department held no records for any oysters being marketed in 1994-45.
1970 Crassostrea gigas (Pacific oyster) spat imported from Japan and set out in Coffin Bay,
Eyre Peninsula for the development of aquaculture.
119119
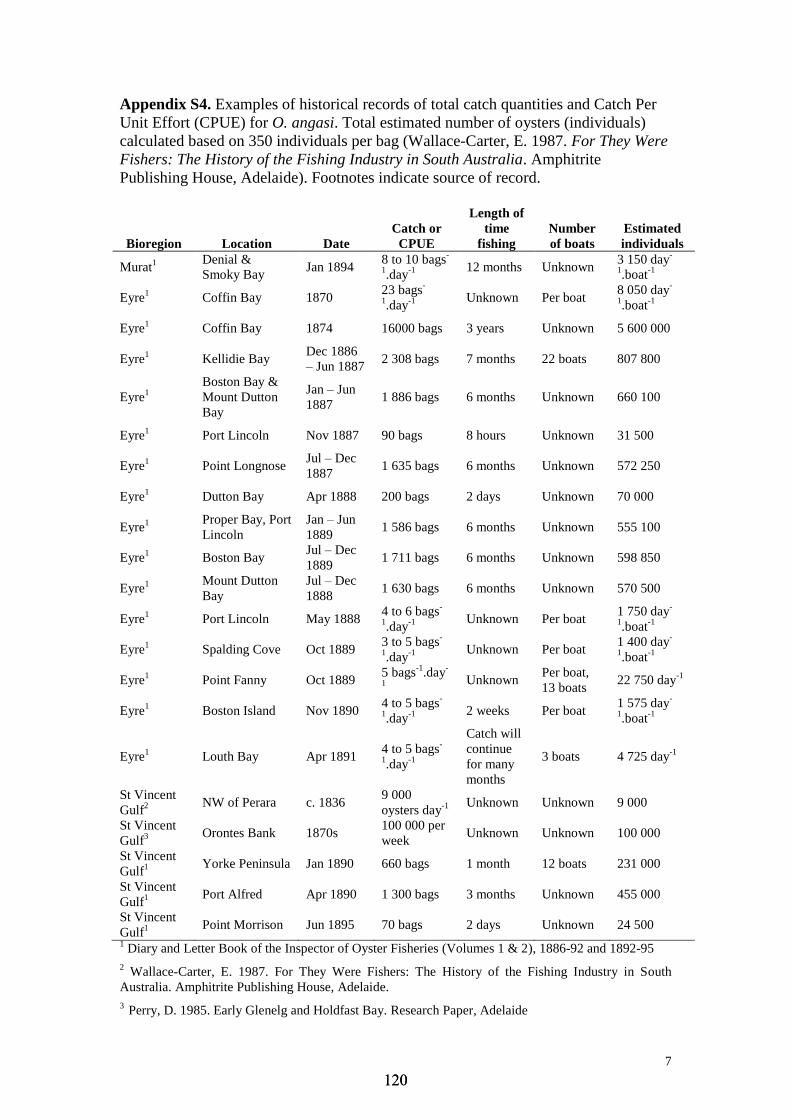
7
Appendix S4. Examples of historical records of total catch quantities and Catch Per
Unit Effort (CPUE) for O. angasi. Total estimated number of oysters (individuals)
calculated based on 350 individuals per bag (Wallace-Carter, E. 1987. For They Were
Fishers: The History of the Fishing Industry in South Australia. Amphitrite
Publishing House, Adelaide). Footnotes indicate source of record.
Bioregion Location Date
Catch or
CPUE
Length of
time
fishing
Number
of boats
Estimated
individuals
Murat1 Denial &
Smoky Bay Jan 1894
8 to 10 bags-
1.day
-1
12 months Unknown 3 150 day
-
1.boat
-1
Eyre1
Coffin Bay 1870 23 bags
-
1.day
-1 Unknown Per boat 8 050 day
-
1.boat
-1
Eyre1 Coffin Bay 1874 16000 bags 3 years Unknown 5 600 000
Eyre1
Kellidie Bay Dec 1886
– Jun 1887 2 308 bags 7 months 22 boats 807 800
Eyre1
Boston Bay &
Mount Dutton
Bay
Jan – Jun
1887 1 886 bags 6 months Unknown 660 100
Eyre1
Port Lincoln Nov 1887 90 bags 8 hours Unknown 31 500
Eyre1
Point Longnose Jul – Dec
1887 1 635 bags 6 months Unknown 572 250
Eyre1
Dutton Bay Apr 1888 200 bags 2 days Unknown 70 000
Eyre1 Proper Bay, Port
Lincoln
Jan – Jun
1889 1 586 bags 6 months Unknown 555 100
Eyre1
Boston Bay Jul – Dec
1889 1 711 bags 6 months Unknown 598 850
Eyre1 Mount Dutton
Bay
Jul – Dec
1888 1 630 bags 6 months Unknown 570 500
Eyre1
Port Lincoln May 1888 4 to 6 bags
-
1.day
-1
Unknown Per boat 1 750 day
-
1.boat
-1
Eyre1
Spalding Cove Oct 1889 3 to 5 bags
-
1.day
-1
Unknown Per boat 1 400 day
-
1.boat
-1
Eyre1
Point Fanny Oct 1889 5 bags
-1.day
-
1
Unknown Per boat,
13 boats 22 750 day
-1
Eyre1
Boston Island Nov 1890 4 to 5 bags
-
1.day
-1 2 weeks Per boat 1 575 day
-
1.boat
-1
Eyre1
Louth Bay Apr 1891 4 to 5 bags
-
1.day
-1
Catch will
continue
for many
months
3 boats 4 725 day-1
St Vincent
Gulf2 NW of Perara c. 1836
9 000
oysters day-1 Unknown Unknown 9 000
St Vincent
Gulf3
Orontes Bank 1870s 100 000 per
week Unknown Unknown 100 000
St Vincent
Gulf1 Yorke Peninsula Jan 1890 660 bags
1 month 12 boats 231 000
St Vincent
Gulf1 Port Alfred Apr 1890 1 300 bags
3 months Unknown 455 000
St Vincent
Gulf1
Point Morrison Jun 1895 70 bags 2 days Unknown 24 500
1 Diary and Letter Book of the Inspector of Oyster Fisheries (Volumes 1 & 2), 1886-92 and 1892-95
2 Wallace-Carter, E. 1987. For They Were Fishers: The History of the Fishing Industry in South
Australia. Amphitrite Publishing House, Adelaide.
3 Perry, D. 1985. Early Glenelg and Holdfast Bay. Research Paper, Adelaide
120120
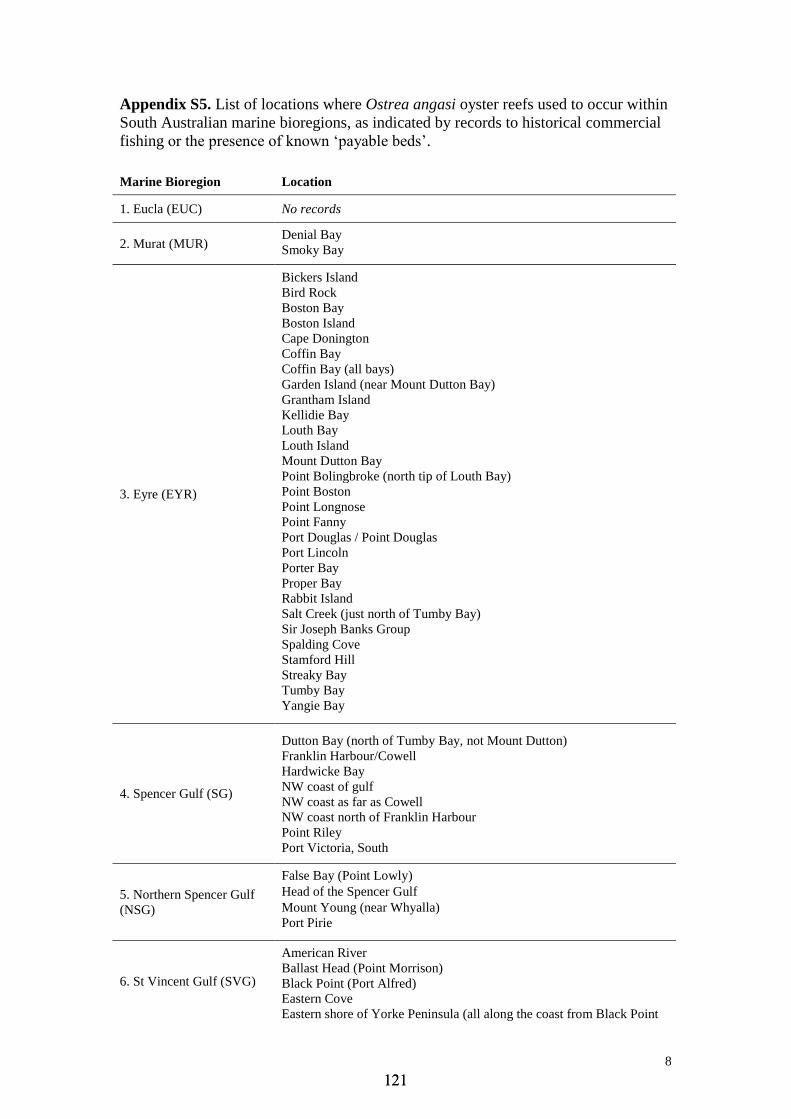
8
Appendix S5. List of locations where Ostrea angasi oyster reefs used to occur within
South Australian marine bioregions, as indicated by records to historical commercial
fishing or the presence of known ‘payable beds’.
Marine Bioregion Location
1. Eucla (EUC) No records
2. Murat (MUR) Denial Bay
Smoky Bay
3. Eyre (EYR)
Bickers Island
Bird Rock
Boston Bay
Boston Island
Cape Donington
Coffin Bay
Coffin Bay (all bays)
Garden Island (near Mount Dutton Bay)
Grantham Island
Kellidie Bay
Louth Bay
Louth Island
Mount Dutton Bay
Point Bolingbroke (north tip of Louth Bay)
Point Boston
Point Longnose
Point Fanny
Port Douglas / Point Douglas
Port Lincoln
Porter Bay
Proper Bay
Rabbit Island
Salt Creek (just north of Tumby Bay)
Sir Joseph Banks Group
Spalding Cove
Stamford Hill
Streaky Bay
Tumby Bay
Yangie Bay
4. Spencer Gulf (SG)
Dutton Bay (north of Tumby Bay, not Mount Dutton)
Franklin Harbour/Cowell
Hardwicke Bay
NW coast of gulf
NW coast as far as Cowell
NW coast north of Franklin Harbour
Point Riley
Port Victoria, South
5. Northern Spencer Gulf
(NSG)
False Bay (Point Lowly)
Head of the Spencer Gulf
Mount Young (near Whyalla)
Port Pirie
6. St Vincent Gulf (SVG)
American River
Ballast Head (Point Morrison)
Black Point (Port Alfred)
Eastern Cove
Eastern shore of Yorke Peninsula (all along the coast from Black Point
121121

9
to Troubridge Lighthouse)
Eastern shore of Yorke Peninsula (the whole of the coast from Port
Wakefield to Port Vincent)
Eastern shore of Yorke Peninsula (from Price to Stansbury)
Edithburgh
Head of the Gulf
Kingscote
Mangrove Point
Marion Reef
North coast of Kangaroo Island
Orontes bank
Oyster Bay
Perara
Pine Point
Port Clinton
Port Julia
Port Price (Wells Creek)
Port Vincent
Port Wakefield
Red Cliff
Rogue’s Point
Sandy Spit
Sheoak Flat
Stansbury
Surveyor’s Point
Western Cove (Cygnet River)
Wool Bay
7. Coorong (COR) No records
8. Otway (OTW) Records but no reference to historical occurrence
Unknown or
unsubstantiated locations
(eg. references to presence
of large number of shells
only, or low confidence
report)
Backy Bay (just north of Fitzgerald Bay) (NSG)
Blanche Harbour (NSG)
Holdfast Bay
Port Broughton (NSG)
Roper Bay (Unknown Bioregion)
Victor Harbor (COR)
122122

10
Appendix S6. Examples of records regarding O. angasi contained within the
historical references.
A. South Australia (general records related to fishery)
Date Source Topic Record
1870
Diary and Letter
Book of the Inspector
of Oyster Fisheries
(Volume 1), 1886-92
Decline
I am enabled to afford some information as far back as
the year 1866. The supply of oysters for the Adelaide
market was limited to the beds situated on the eastern
shores of Yorke Peninsula the dredging there being
carried on indiscriminately without protection or
regulation of any kind it was well known that natural
oyster beds of a very prolific kind existed in Port
Lincoln waters, but in the days referred to it was
impossible to convey them to Pt Adelaide in a condition
for sale, the distance being too great, however the
Steamship Marion took the place of the former slow
sailing craft and at once the difficulty was removed, and
since then there has been a more or less constant supply
of good marketable oysters for Adelaide, dredging went
on in Boston Bay, that is Port Lincoln Bay, and Port
Lincoln Proper Bay in the same indiscriminate manner
as at Yorke Peninsula previously referred to, the beds in
the neighbourhood of the Port Lincoln Bays covered a
large area and it was unfortunate that the restrictions
subsequently imposed were not in force earlier thereby
saving much destruction the disastrous effects of which
was felt for many years after the beds were completely
depopulated almost beyond the power of reproduction
consequently when this source of supply faded it was
felt to be a great hardship as the population of Adelaide
had meanwhile greatly increased and the demand for
oysters with it.
1895 Diary and Letter
Book of the Inspector
of Oyster Fisheries
(Volume 2), 1892-95
Decline I am sorry to say that year by year the yield of our once
prolific oyster beds in the neighbourhood of Port
Lincoln, Coffins bay, and Yorkes Peninsula is growing
less in the supply, the reason for this is mostly owing to
the continual dredging and redredging over the same
beds, by so large a number of boats every year
employed, this continual dredging I may say for
upwards of 36 years to my knowledge has of course
brought the beds to the minimum quantity.
1911 Randall, W. G. 1911.
Report of the Chief
Inspector of Oyster
Fisheries on Oyster-
Fishing Industry.
House of Assembly,
South Australia
Recovery Reviewing the experience of the past 18 months, I
believe that there are fair prospects of the oyster
industry again becoming in time a valuable asset.
Patience is necessary, as oysters do not grow like
mushrooms. Past mistakes have to be atoned for, but if
absolute protection is assured to the cultivated areas the
progress is more likely to be reliable; much, indeed,
depends upon this
1911 Randall, W. G. 1911.
Report of the Chief
Inspector of Oyster
Fisheries on Oyster-
Fishing Industry.
Oyster
propagatio
n
SUGGESTED REMEDY - OYSTER CULTURE - The
next consideration was the best method of repopulating
the at present almost barren waters. Artificial
cultivation was believed to be the only practical
solution. Simply closing the beds had been tried with
123123

11
House of Assembly,
South Australia
apparently small benefit; just as well take off your crop
and sit on the nearest fence in the vain expectation of
seeing a fresh one spring up. … The work (report) was
put in hand in September of last year. Rubbish,
consisting mainly of kerosine and other tins, galvanized
iron, pots, pans, kettles, old iron, tanks, etc., was carted
to Proper Bay, lightered out to a ketch, and discharged
over carefully selected bottom: in addition about 50
tons of green mallee was cut and laid down. Early
October everything was ready for the spat season, now
close at hand. The locality selected for the undertaking
was the extreme south-western potion of Proper Bay ...
1893 Diary and Letter
Book of the Inspector
of Oyster Fisheries
(Volume 2), 1892-95
New bed … since the closing of the Spalding Cove oyster beds,
the Boats under licence for the current year are
dredging in Louth Bay on a bed of Oysters which has
been recently discovered extending over a large area of
sea ground (although not very thickly distributed) from
which I anticipate a fairly large supply of Oysters to the
Colony for some months to come.
1890 Diary and Letter
Book of the Inspector
of Oyster Fisheries
(Volume 1), 1886-92
New bed (Stansbury) Having resumed the usual inspection of the
grounds, and when off Oyster Bay Point, and about 1/2
a mile off land, here I hit upon a patch of fine large
oysters.
1888 Diary and Letter
Book of the Inspector
of Oyster Fisheries
(Volume 1), 1886-92
Settlement
of spat
… resumed the inspection of the Oyster beds in Kellidie
Bay I find that large quantities of young Oyster brood
having settled on the beds, since the Bays being closed.
1889 Diary and Letter
Book of the Inspector
of Oyster Fisheries
(Volume 1), 1886-92
Settlement
of spat
(Kellidie Bay) … the young Oysters and Oyster brood
on several beds are accumulating in large quantity in
fact all over the bay that could reasonably be hoped for,
the razor fish (?) very favourably also.
1888 Diary and Letter
Book of the Inspector
of Oyster Fisheries
(Volume 1), 1886-92
Market … the supply is greatly in excess of the market demand
- there is at the present time 300 bags of oysters laying
on the storage beds in Port Lincoln, more and above of
the market demand.
1889 Diary and Letter
Book of the Inspector
of Oyster Fisheries
(Volume 1), 1886-92
Market … there has been no difficulty in keeping the market
supplied, in fact double the quantity could have been
forwarded if required, the demand however is now on
the increase and will continue to increase as the summer
season advances. 365 bags of Oysters, has been
forwarded for the Steamer Ferret to Port Adelaide, and
out Ports during the past month of November.
1887 Diary and Letter
Book of the Inspector
of Oyster Fisheries
(Volume 1), 1886-92
Market … since the opening of Kellidie Bay and Port Douglas
for oyster fishing this season there has been twenty
cutters constantly employed in oyster dredging and the
catch has greatly exceeded the market demand… the
oysters are certainly far superior both in size and quality
to any in the Colony, still the demand during the
summer has been exceedingly small compared with that
of other years - owing I expect to the great depression
that exists in the colony at the present time.
124124

12
1888 Diary and Letter
Book of the Inspector
of Oyster Fisheries
(Volume 1), 1886-92
Market For the current year the number of boats is 16 and 27
men working the Boats, this decrease in the Oyster
industry is no doubt due in a large degree to the general
depression of the trade and consequent scarcity of
money which has of late prevailed throughout the
Colony.
B. Murat marine bioregion
Date Source Topic Record
1894
Diary and Letter
Book of the
Inspector of Oyster
Fisheries (Volume
2), 1892-95
Abundance
For the last 12 months been dredging oysters in Denial
and Smoky bay, (and) informed me, that oysters are
plentiful and that 8 to 10 bags of oysters (2 800 to 3 500
individuals) can be easily obtained in one days dredging,
and the oysters are of excellent quality and condition.
1840 Wallace-Carter, E.
1987. For They
Were Fishers.
Amphitrite
Publishing House,
Adelaide
Abundance “One of the earliest records of oysters was from the
explorer Edward Eyre who writing in his Journal in 1840
commented on regular fishing by the men at the southerly
bight of Streaky Bay.”
C. Eyre marine bioregion
Date Source Topic Record
1870
Wallace-Carter, E.
1987. For They Were
Fishers. Amphitrite
Publishing House,
Adelaide
Catch
quantities
“By 1870 some thirty sailing cutters, varying in
length from twenty-five to forty feet, were dredging
in the Coffin Bay area. Eighty or so men were
employed on the boats and the production average 60
000 bushels a year (some 18 000 wheatbags (6 300
000 individuals) full).”
Wallace-Carter, E.
1987. For They Were
Fishers. Amphitrite
Publishing House,
Adelaide
(Commissioner of
Police during his
visit to the Eyre
Peninsula on 12th
September 1849)
Catch
quantities
“My attention was called to this inlet (Coffin Bay)
during my stay in the Port Lincoln district because of
the quantity of oysters which were brought to Port
Lincoln in drays, deposited among the rocks in beds,
and, as opportunity offered, shipped to Adelaide in
small 'crafts' to supply the market, and there retailed
at one shilling and sixpence per down. Since this
discovery, no less than 100,000 oysters have been
brought to Adelaide and within the last few days two
cutters arrived with 100,000 more; these last were
brought direct from here. They appear to be
inexhaustible and so easily collected as may be
imagined from the fact that the natives on one
occasion collected in a few hours 15,000 ...”
125125

13
1888
Diary and Letter
Book of the Inspector
of Oyster Fisheries
(Volume 1), 1886-92
Decline
During last month 25 cutters arrived here from Port
Lincoln and began their dredging operation which
very soon tested the beds far better than I had the
opportunity of doing with one boat, the result being
that on several of the beds especially those situated in
deep channels, and from which the greatest supply of
Oysters were expected to be obtained, very few
indeed are to be found and others are completely
depopulated, but this is by no means the case with
every bed, for upon one bed just off the Dutton Bay
Jetty in shallow water and where bottom consist of a
hard rocky formation and free from the (?)
accumulation 200 bags were caught in about two
days, but you can easily form an idea how soon any
ordinary Oyster beds would disappear under such
large numbers of boats employed, and leave very
little behind to mark the spot, except some empty
shells.
1893 Diary and Letter
Book of the Inspector
of Oyster Fisheries
(Volume 2), 1892-95
Decline and
accumulati
on of
seaweed
I examined the beds in Kellidie Bay which were
closed on the 23 July 1889 and there have been no
boats dredging since the above date, consequently the
results of the increase of Oysters there, I am sorry to
say has proved very unsatisfactory. I find that the
oyster beds are not so prolific as I anticipated
considering the length of time have been closed. The
reason for this I find, is the great accumulation of
seaweeds and other marine sediment of every
description settled over the principal breeding
grounds, and has completely covered the old Oyster
shells, and all other such hard materials to which the
oyster spat could not obtain any solid holding
ground, thus causing the failure of the beds in
Kellidie Bay.
1881 Diary and Letter
Book of the Inspector
of Oyster Fisheries
(Volume 1), 1886-92
Oyster
propagation
Now there are few positions better than the last
named place (Kellidie Bay) for the propagation of the
oyster - plenty of land drainage from the ranges
beyond, and mud banks where the young oysters can
fatten and produce both fish and shell, but as there
are no razor fish thereon the young spat can not cling,
and the Bay became impoverished in a single season.
1887 Diary and Letter
Book of the Inspector
of Oyster Fisheries
(Volume 1), 1886-92
Transplant
of Pinna
bicolor
I must tell you that my time during the past month
has been principally taken up by collecting the Razor
Fish in Port Lincoln waters and transplanting them in
Coffins Bay, where they are non existant at the
present time…
1887 Diary and Letter
Book of the Inspector
of Oyster Fisheries
(Volume 1), 1886-92
Transplant
of Pinna
bicolor
The razor fish (transplanted) all along the mainland
side of Boston Bay have formed a new foundation for
the adhesion of oyster spat, three fourths of the
oysters obtained are got from the razor fish beds, on
much bottoms, where, but for the razor fish the oyster
spat would have no hold.
126126

14
1888 Diary and Letter
Book of the Inspector
of Oyster Fisheries
(Volume 1), 1886-92
New bed … resumed the usual inspection of Oyster beds in the
course of the day, I discovered a fresh bed of Oysters
about a mile South West of Grantham Island, on this
bed I believe to be about 200 bags of good
marketable Oysters.
1889 Diary and Letter
Book of the Inspector
of Oyster Fisheries
(Volume 1), 1886-92
Increased
supply
I am pleased to inform you, that since the division of
the beds have taken place, there has been a steady
increased supply of Oysters on the Port Alfred Coast
Yorke Peninsula, Port Lincoln Proper and Boston
Bay owing to such large quantities of razor fish
accumulating on the beds, and have formed new
foundation and the oyster spat adhering in large
quantities.
D. Spencer Gulf and Northern Spencer Gulf marine bioregion
Date Source Topic Reference
1912
McIntosh, S.
1913.
Fisheries—
Report of Chief
Inspector for
1912-13. House
of Assembly,
South Australia
Abundance
Oysters are known to be present on the east cost of
Spencer's Gulf, particularly from Port Victoria
southerly. ... Being satisfied that the razor fish supply was
considerable he (a fisherman) took out a licence, and it is
understood that he is securing fair returns. It is the first
licence taken out for oyster fishing on that portion of the
coast, and may lead to further discoveries.
E. St Vincent Gulf marine bioregion
Date Source Data Type Reference
1836 Perry, D. 1985.
Early Glenelg
and Holdfast
Bay. Research
Paper,
Adelaide
Early years
of fishery
“Oysters - When a number of fishermen took up their
trade in colonial South Australia they were individually
induced to push the capture to extremes without regard to
spawners and small fry and the consequence was that the
sea coast was denuded of its denizens by the eagerness of
the chase. To cite but one instance, in the early days of
the colony the whole of the coastline from Port Wakefield
to Surveyor's Point was the home of the oyster and there
were thousands on thousands there on a natural bed and
no sooner was the cupidity of the fishers aroused than
cutters cruised in those waters.”
1877 Diary and
Letter Book of
the Inspector of
Oyster
Fisheries
(Volume 1),
1886-92
Decline The same occurred about 26 years ago when the once
prolific beds on the Eastern shore of Yorke Peninsula
which supplied the demand of the colony, were destroyed
by the excessive dredging (which was carried on a few
years previously) thereby every available oyster caught...
Consequently the beds never recovered again until 3 or 4
years ago when the razorfish made a new foundation
127127

15
which are now here in large quantities, all along the coast
commencing from the northernmost end of the Gulf down
as far as Stansbury Bay, and adhering to them is a great
amount of young oysters and oyster brood, which
promise a three year supply of oysters to the Colony
when they become marketable size provided care and
judicious management be exercised.
1894 Diary and
Letter Book of
the Inspector of
Oyster
Fisheries
(Volume 2),
1892-95
Decline … having inspected the natural deposit of Oysters known
as Black Point or Port Alfred Beds. This beds have now
been closed for about four years but the progress of
young Oysters has not been satisfactory. In only one
locality did I find oysters of a marketable size and
quality, and in that place I should estimate that only a
very limited quantity could be taken, the remainder of the
beds appear to have in some places overgrown with weed
and sediment or every sort, which has so thickly covered
the ground, and has completely killed all the spat which
was being deposited at the time the beds were closed...
1866 Perry, D. 1985.
Early Glenelg
and Holdfast
Bay. Research
Paper,
Adelaide
Decline “By 1866 Holdfast Bay was not 'the bivalvular Goshen as
it once was' for the natural beds had been destroyed
through the stupidity and carelessness of the dredgers. A
few years previously an attempt had been made to lay
down artificial beds 'on the French principle' but failed in
consequence of the sites being ill-selected. Recourse was
only available from a 'course, flabby article from Port
Lincoln' or an expensive import from Sydney.”
Perry, D. 1985.
Early Glenelg
and Holdfast
Bay. Research
Paper,
Adelaide
Decline “Irrespective of cause of effect, regardless of legislative
enactment, the toilers of the sea dredged and dredged
until the demand overcame the supply. They paid little
regard to the fishery in which they were engaged; in no
case was a selection made, but the whole of the fish, great
or small, were drafted off to supply the city. The end
came and finally not a mollusc was available - not a
solitary native oyster remained and the dredgers were
constrained to seek fresh fields and pastures new. Coffin
Bay, Port Lincoln and other desirable spots then
furnished the gourmand with this luxury.”
1845 Perry, D. 1985.
Early Glenelg
and Holdfast
Bay. Research
Paper,
Adelaide
Decline and
legislation
“By 1845 the excessive removal of oysters from local
beds was cause for concern and a complainant pleaded
for appropriate government action. Alas, this was not
forthcoming.”
1853 Perry, D. 1985.
Early Glenelg
and Holdfast
Bay. Research
Paper,
Adelaide
Decline and
legislation
“When the falling away of supply was first discovered a
Bill, sponsored by Mr C.S. Hare was passed through the
Legislative Council in 1853 to encourage artificial beds
and, while its provisions were no doubt sounds and
sufficient from a legal point of view, it was rendered
practically useless by the want of knowledge among those
who took advantage of it as to the management of
beds. ... but the ground was sandy and quite unsuited to
oysters as it 'gave them nothing to hold by and as little to
live on.' Further, the little chance the oysters had of
coming to maturity in such circumstances was destroyed
by the careless manner of dredging for them. The unripe
128128

16
ones were not carefully returned to the bed but thrown
recklessly on to the living oysters, thousands of which
were smothered.”
1890 Diary and
Letter Book of
the Inspector of
Oyster
Fisheries
(Volume 1),
1886-92
Decline and
accumulation
of seaweed
(Yorke Peninsula) … In addition I tried all the waters off
Port Wakefield, Clinton, Port Price, and other places in
the neighbourhood in order to find some payable new
beds of oysters, particularly so, on the old bed off
Clinton, where some 30 years ago Oysters existed in
abundance, and now I find, the very large and exceptional
accumulation of mud seaweeds and other marine rubbish
having settled over the grounds, is a very serious obstacle
to the satisfactory growth of Oyster brood, the spat being
unable to obtain solid holding ground, consequently the
beds had faded into nothing.
1889 Diary and
Letter Book of
the Inspector of
Oyster
Fisheries
(Volume 1),
1886-92
Increased
supply
I am pleased to inform you, that since the division of the
beds have taken place, there has been a steady increased
supply of Oysters on the Port Alfred Coast Yorke
Peninsula, Port Lincoln Proper and Boston Bay owing to
such large quantities of razor fish accumulating on the
beds, and have formed new foundation and the oyster spat
adhering in large quantities.
1890
Diary and
Letter Book of
the Inspector of
Oyster
Fisheries
(Volume 1),
1886-92
Catch
quantities
… the dredging operation during the past three months on
the Port Alfred coast are being vigorously proceeded with
I may say however that no less than 1 300 bags of Oysters
(455 000 individuals) have been caught during that time
…
F. Ecological and environmental records
Date Source Data Type Reference
1935
Correspondence and
notes (assembled by
H. M. Hale) on oyster
beds and commercial
fisheries, 1926-36.
Letter from T. C.
Roughely to H. M.
Hale re culture of
NSW oysters in SA,
June 21, 1935
Ecology
and
Polydora
spp.
The habit of O. angasi of living in water where it is
never bared by the tide exposes it to a far greater risk
of attack by Polydora, and the fact that you can find
no evidence of attacks by the worm seems rather
propitious for the success of the growth of the NSW
oyster in similar situations. … It (polydora) appears
to have a less serious effect on O. angasi because of
the greater readiness with which that species can
deposit shelly material. … It is not that O. angasi is
attacked less, but that it is more capable of dealing
with the attacks. But from the fact that you can find
no evidence of the worm attaching your oysters I
should be inclined to assume that it is not virulent in
South Australia and that the NSW oysters should
stand a good chance of survival in submerged
situations.
1913 Randall, W. G. 1912.
Report of the Chief
Ecology Most, if not all, of the oyster-bearing waters are
practically local and in fairly shallow depths. The
129129

17
Inspector of Oyster
Fisheries on Oyster-
Fishing Industry.
House of Assembly,
South Australia
presence of shells of full-grown oysters that have
been found on wide stretches of the coast incline to
the belief that there may be important supplies in
deeper waters, for which it may be considered proper
that a search should be made.
1914 McIntosh, S. 1914.
Fisheries—Report of
Chief Inspector for
1913-14. House of
Assembly, South
Australia
Influence
of rainfall
OYSTER FISHERIES - Early in the summer months,
1914, the oysters began to deteriorate in condition,
and dead shells became numerous; as summer
advanced the position became more acute. These was
not the slightest sign of disease of any kind, the sole
cause of the trouble is the absence of food in the
waters, and the absence of ordinary rainfall is
accountable for this position. Although the
experience is regrettable, I pointed out in each annual
report, that given a succession of dry years losses
must follow, both in reproduction and in the welfare
of existing oysters; this has been fully borne out, and
is the experience of other countries. According to
statistics courteously furnished by the Meteorological
Bureau of South Australia, 1913 was the driest season
for 48 years, which is the period during which
records have been taken, the rainfall of Port Lincoln
being 13.23in., compared with 25.14in. in 1909-10,
and this latter year was most prolific in reproduction.
The condition of the oysters on the natural beds in the
nursery is exactly similar to that in the cultivated
areas.
1911 Randall, W. G. 1911.
Report of the Chief
Inspector of Oyster
Fisheries on Oyster-
Fishing Industry.
House of Assembly,
South Australia
Influence
of rainfall
Another important factor lies in the character of the
coming seasons. As has already been indicated, a
good rainfall materially assists growth and spat
production. The process of restoration should quicken
after the first two or three years, because the
replenishing powers of the accumulating stock will be
more rapidly augmented. Oysters may spat at 12
months old, but the best period of reproduction is
from three to six years.
1910 Randall, W. G. 1911.
Report of the Chief
Inspector of Oyster
Fisheries on Oyster-
Fishing Industry.
House of Assembly,
South Australia
Influence
of rainfall
SUGGESTED REMEDY - OYSTER CULTURE - I
believe that the fall of spat in the 1910 season was
unusually heavy; this is accounted for by an
exceptionally large rainfall in the winter months. In
that portion of Proper Bay where the "catchment" is
laid there are strong springs of fresh water coming in
which has a tendency to reduce the salinity of the sea
water and is, undoubtedly, conducive to prolific
spawning and assists growth. It has been proved
everywhere that wet seasons are advantageous to
oyster culture; accordingly, if dry seasons prevail we
must be prepared to anticipate poor results.
1914 McIntosh, S. 1914.
Fisheries—Report of
Chief Inspector for
1913-14. House of
Assembly, South
Australia
Cladophora
spp.
OYSTER FISHERIES - The closure to oyster-fishing
of Spalding Cove and Proper Bay expired on
February 15th, 1914. An examination of the oyster
beds was twice attempted, but owing to the
accumulation of marine fauna, it was not possible to
ascertain their condition. During the winter months,
under normal conditions, this material decays, and by
130130

18
the action of the tide much is removed. Early in
November of the present year permission was given
for two boats to prospect these waters, and dredging
was carried out under our personal supervision, but
the results were not satisfactory.
1913 McIntosh, S. 1913.
Fisheries—Report of
Chief Inspector for
1912-13. House of
Assembly, South
Australia
Cladophora
spp.
St. Vincent's Gulf - A considerable portion of the old
beds was covered with blanket weed (Cladophora),
which would appear to be closely allied to the
eelgrass found to be troublesome in the Canadian
Oyster Fisheries. It is considered probable that this
growth is swept over these shallower waters from the
deeper portions of the Gulf during the prevalence of
strong south-east and north-east winds in summer
time.
1913 McIntosh, S. 1913.
Fisheries—Report of
Chief Inspector for
1912-13. House of
Assembly, South
Australia
Cladophora
spp.
WEED (OYSTER RESERVE & NURSERY,
PROPER BAY) – During the early months of the
year the reserve suffered from an invasion of blanket
weed, a growth regarded as troublesome in St.
Vincent’s Gulf, and which enveloped the catchment.
It is hoped that the season’s spat has not been
seriously affected, because it should have become
established prior to the advent of the weed.
Fortunately this growth dies off in winter, and the
prevailing winds from the north-west to south-west
assist in dispersement.
1891 Diary and Letter
Book of the Inspector
of Oyster Fisheries
(Volume 1), 1886-92
Cladophora
spp.
Unfortunately however, owing to the fine weather
and calms that prevailed during the past fortnight or
three weeks the dredging boats have been unable to
work sufficiently to keep the grounds clear,
consequently a rapidly growing weed has covered the
beds to such an extent that the dredges cannot remove
it without much labour and loss of time. I may
mention that this weed generally appears about this
time of the year, especially on a shallow water beds,
and its effects are disastrous to growing oysters, in
fact many beds and patches that were known and
worked some years ago are now nothing but masses
of empty shells.
1888 Diary and Letter
Book of the Inspector
of Oyster Fisheries
(Volume 1), 1886-92
Influence
of seaweed
I would also point out that the beds in Mount Dutton
Bay, some of which are getting covered with sea
weed, as referred to in my previous report, are quite
ready for dredging operation which would remove the
weeds and improve the beds, there is an ample supply
for a few month of good Oyster available, in this Bay.
1888 Diary and Letter
Book of the Inspector
of Oyster Fisheries
(Volume 1), 1886-92
Dredging I would also point out that dredging is always
accompanied with a large amount of unavoidable
destruction to young oyster brood, and this increases
in proportion to the decrease of full grown Oysters
dredged, it is therefore necessary to close beds, not
when all the full grown Oysters are unobtainable but
when the young brood came up in the dredges in to
large a proportion to full grown ones, this was the
case with the Boston Bay beds...
1892 Diary and Letter Excess … I have carefully inspected the present supply of
131131

19
Book of the Inspector
of Oyster Fisheries
(Volume 1), 1886-92
oysters on
storage
beds
Oysters now lying on the storage beds in Port
Lincoln, and find that there are about 700 bags of
Oysters awaiting a market. The weekly catch at the
present time on the natural bed in Spalding Cove is in
excess of the market demand, consequently still
adding to the extraordinary large number of Oysters
that are already caught and laid on a very shallow
ground exposed to the inclemancy of the weather, of
which a large portion are dead, and still dying daily
on the beds to the great detriment of the Oystermen,
and the general public, and should this continue the
destruction will be still great.
1881 Diary and Letter
Book of the Inspector
of Oyster Fisheries
(Volume 1), 1886-92
Interaction
with Pinna
bicolor
… some of the best formation as yet known in the
History of the Oyster culture for the oyster spat to
cling, as many as fifty oysters, old and young, having
been found on one razorfish.
1912 McIntosh, S. 1913.
Fisheries—Report of
Chief Inspector for
1912-13. House of
Assembly, South
Australia
Interaction
with Pinna
bicolor
PROPER BAY, PORT LINCOLN - The three years'
closure of these beds expired on February 15th, 1912,
and their condition, although certainly improved, did
not warrant re-opening. The Honorable the Treasurer
approved of the closure being extended for a further
term of two years, at the expiration of which they
should have materially benefited by the spat from the
earliest cultivated oysters in the adjoining reserve
which will have become reproducing. It is noticed
that the natural "catchment" (razor fish) has
considerably increased as the result of the absence of
dredging.
1887 Diary and Letter
Book of the Inspector
of Oyster Fisheries
(Volume 1), 1886-92
Interaction
with Pinna
bicolor
The razor fish (transplanted) all along the mainland
side of Boston Bay have formed a new foundation for
the adhesion of oyster spat, three fourths of the
oysters obtained are got from the razor fish beds, on
much bottoms, where, but for the razor fish the oyster
spat would have no hold.
1913 McIntosh, S. 1913.
Fisheries—Report of
Chief Inspector for
1912-13. House of
Assembly, South
Australia
Interaction
with Pinna
bicolor
(Proper Bay and Spalding Cove) The five years
closure of these waters will expire on February 15th,
1914, at which time it is hoped that the process of
restoration may justify a recommendation for re-
opening. Razorfish, which is here the natural
catchment, have appreciably increased during the
period of protection.
1912 McIntosh, S. 1913.
Fisheries—Report of
Chief Inspector for
1912-13. House of
Assembly, South
Australia
Use of
catchment
in Oyster
Reserve
Spat Season, 1912 - Mallee bows only were used.
These answer better than metals, for although the
latter are good collectors, the oyster thereon display a
tendency to spread themselves and cannot be
removed where necessary without risk of injury. On
the boughs the oysters do not attach themselves so
closely and thus have more room to develop a good
shape. It is intended to experiment during the coming
season with limestone as catchment. Oysters in
Kellidie and Coffins Bay do well on limestone, which
there is a natural catchment; no razor fish are found
in these bays.
132132

20
Appendix S7.
Figure 1. Historical map identified within miscellaneous fisheries files in the State
Records of South Australia indicating the National Oyster Reserve at Proper Bay, Port
Lincoln, 1889.
133133

Chapter 6: Incorporating historical data into aquaculture
planning
6.1 Preface
Despite an increasing appreciation of the need to consider past ecosystem states and
ecological baselines in natural resource management, there remain few examples in which
the application of historical information to policy and management have been explicitly
considered or profiled. Due to this paucity of ‘case studies’, it is possible that the use of
historical data in management will continue to be limited, because scientists and managers
may not see the need, nor value, to such an approach. This chapter uses historical data to
inform several aspects of planning for aquaculture in South Australia. Quantitative and
qualitative data from the historical fishery for the oyster Ostrea angasi and information
relating to this activity, such as the introduction of a non-native species of oyster after
native oyster reefs deteriorated, were incorporated into existing management processes and
used to assist the setting of policy, thus demonstrating its value in this application. This
chapter is in press with the ICES Journal of Marine Science, for a special issue on the 2015
‘Oceans Past Symposium’, and is reprinted here with the permission from Oxford
University Press (Appendix C). The original manuscript can be sourced from the
publishers website:
http://icesjms.oxfordjournals.org/content/early/2015/11/02/icesjms.fsv191.abstract?sid=89
760be6-e709-4da5-8c7a-c634961198dc.
134134

6.2 Statement of authorship
Principal Author
Name of Principal Author (Candidate) Heidi K. Alleway
Contribution to the Paper
Conceptualised and designed the research, collated the historical data and generated the
statistics for planning, conducted consultation with government stakeholders, conducted the risk
assessment, and wrote and edited the manuscript.
Overall percentage (%) 80%
Signature
Date 24/07/2015
Co-Author Contributions
By signing the Statement of Authorship, each author certifies that:
xiii. the candidate’s stated contribution to the publication is accurate (as detailed above);
xiv. permission is granted for the candidate in include the publication in the thesis; and
xv. the sum of all co-author contributions is equal to 100% less the candidate’s stated contribution.
Name of Co-Author Ruth H. Thurstan
Contribution to the Paper Assisted with the conceptual development of the research, interpretation and application of the
results, and writing and editing the manuscript
Signature
Date 19/07/2015
Name of Co-Author Peter R. Lauer
Contribution to the Paper Conducted consultation with public stakeholders, assisted with incorporation of the statistics into
aspects of planning, and writing of the manuscript.
Signature
Date 21/07/2015
Name of Co-Author Sean D. Connell
Contribution to the Paper Assisted with the preparation of the manuscript.
Signature
Date 20/07/2015
Title of Paper Incorporating historical data in aquaculture planning
Publication Status A c c ep ted f o r Pub lic a tion
Public a tion S ty le
Publication Details ICES Journal of Marine Science. In press. DOI: 10.1093/icesjms/fsv191
Published
Submitted for Publication
135135

Incorporating historical data into aquaculture planning
Heidi K. Alleway1,2*, Ruth H. Thurstan3, Peter R. Lauer2, and Sean D. Connell1
1Southern Seas Ecology Laboratories, School of Biological Sciences and the Environment Institute, University of Adelaide, Adelaide, SA 5005, Australia2Primary Industries and Regions South Australia, Fisheries and Aquaculture, 25 Grenfell Street, Adelaide, SA 5000, Australia3Australian Research Council Centre of Excellence for Coral Reef Studies, School of Biological Sciences, The University of Queensland, St Lucia, QLD 4072,Australia
*Corresponding author: tel: + 61 438 449 096; e-mail: [email protected]
Alleway, H. K., Thurstan, R. H., Lauer, P. R., and Connell, S. D. Incorporating historical data into aquaculture planning. – ICES Journalof Marine Science, doi: 10.1093/icesjms/fsv191.
Received 9 May 2015; revised 28 September 2015; accepted 1 October 2015.
Marine historical research has made progress in bridging the gap between science and policy, but examples in which it has been effectively appliedremain few. In particular, its application to aquaculture remains unexplored. Using actual examples of natural resource management in the state ofSouth Australia, we illustrate how historical data of varying resolution can be incorporated into aquaculture planning. Historical fisheries recordswere reviewed to identify data on the now extinct native oyster Ostrea angasi fishery throughout the 1800 and early-1900s. Records of catch,number of boats fishing, and catch per unit effort (cpue) were used to test fishing rates and estimate the total quantity of oysters taken fromselect locations across periods of time. Catch quantities enabled calculation of the minimum number of oysters per hectare for two locations.These data were presented to government scientists, managers, and industry. As a result, interest in growing O. angasi increased and new areasfor oyster aquaculture were included in regulatory zoning (spatial planning). Records of introductions of the non-native oyster Saccostrea glomer-ata, Sydney rock oysters, from 1866 through 1959, were also identified and used to evaluate the biosecurity risk of aquaculture for this speciesthrough semi-quantitative risk assessment. Although applications to culture S. glomerata in South Australia had previously been declined, the in-clusion of historical data in risk assessment led to the conclusion that applications to culture this species would be accepted. The examples pre-sented here have been effectively incorporated into management processes and represent an important opportunity for the aquaculture industryin South Australia to diversify. This demonstrates that historical data can be used to inform planning and support industry, government, and so-cieties in addressing challenges associated with aquaculture, as well as natural resource management more broadly.
Keywords: aquaculture, historical data, historical ecological research, natural resource management, Ostrea angasi, oysters, planning.
IntroductionImpacts from the human use of aquatic resources are well known,but the time-scales over which these impacts have occurred haveonly recently become of interest to natural resource managers.Increasingly, there is evidence of the early onset of, for instance,overexploitation and habitat modification (e.g. Airoldi and Beck,2007; Erlandson and Rick, 2010), which has motivated an agendafor marine historical ecological research (Kittinger et al., 2014;Schwerdtner Manez et al., 2014). Historical research providesinsight into the magnitude and trajectories of past change and hasbeen used as a powerful validation of the value of incorporating his-torical data into contemporary natural resource management(Connell et al., 2008; Ban et al., 2014; Thurstan et al., 2014).
However, examples in which such research has been applied to plan-ning in aquatic resource use remain few and its effects on ocean gov-ernance, to understand and manage ecosystem changes, are notalways well understood.
Patterns of change in aquatic resources, particularly fisheriesresources, including species biomass, stock structure, or distribu-tion, have been attributed to fishing (Berkes et al., 2006; Pinnegarand Engelhard, 2008; Erlandson and Rick, 2010), but alternative re-source uses such as aquaculture have also occurred over long periodsof time, in some cases, for thousands of years (Costa-Pierce, 1987).Critically, the mere knowledge of past ecological states (e.g. histor-ical baselines for species’ abundances), can alter an individual’s ora community’s perception of the state of “naturalness’” of an
# International Council for the Exploration of the Sea 2015. All rights reserved.For Permissions, please email: [email protected]
ICES Journal of
Marine ScienceICES Journal of Marine Science; doi:10.1093/icesjms/fsv191
ICES Journal of Marine Science Advance Access published November 2, 2015
136136

environment, and therefore the degree to which it has changed andtheir expectations for its productivity (Jackson, 1997; Dayton et al.,1998; Connell et al., 2008). Although changes to community com-position due to climate change, species introductions, or wide-spread anthropogenic impacts or invasions may limit the scope ofcomparison between times (Greenstein and Pandolfi, 2008;Carlton, 2009; Hobday, 2011), particularly where the cumulativeimpact of multiple stressors is yet to be realized (Essl et al., 2015),pragmatic use of historical ecological models could provide in-formation to reduce uncertainty around our perspective and man-agement of aquatic resource use. Modelling approaches have beenused to bridge the gap between current and past ecosystem statesto allow for reconstruction of past ecosystems and their services,e.g. knowledge on population demographics and filtration capacityof oyster reefs (Mann et al., 2009; zu Ermgassen et al., 2013),and protein production via population modelling of former codbiomass (Rosenberg et al., 2005). Using a similar approach, histor-ical records and data that can inform aquaculture in present andfuture environments could be identified and reconstructed.
Over the last five decades, aquaculture has become the fastestgrowing global food production sector (Diana, 2009; FAO, 2014),which has in part been a response to the limited capacity of fisheriesto meet continued demand for seafood, a key source of protein(Godfray et al., 2010; Thurstan and Roberts, 2014). This growthhas presented challenges to the ecological sustainability of aquacul-ture, due to negative environmental impacts such as the introduc-tion of pollutants, the escape of non-native species, andoverexploitation of fish stocks for feed (Naylor et al., 2000; Diana,2009). However, the continued growth of global aquaculture pro-vides a means to meet demand for seafood in the future (Duarteet al., 2009) and, as a result, industries, sectors, and aquaculturepractices must develop to maximize production in an ecologicallysustainable manner (Naylor et al., 2000; Duarte et al., 2009;McClanahan et al., 2015). “Demand” includes developing nationshaving access to food, protein for nourishment, and income(Allison, 2011), which implies that there is a need for quantityas well as continuity in supply. But demand can also be drivenby global markets through expectations for seafood being diverse,of high quality and food secure. Hence, the challenges to the sus-tainable growth of aquaculture are complex and will be assisted bythe identification and use of a range of comprehensive socio-ecological data.
In southern Australia, oyster reefs have been classified as func-tionally extinct due to the impacts of overexploitation and asso-ciated stressors, including disease and poor quality coastal water(Beck et al., 2011). Oyster reefs formed by the native flat oysterOstrea angasi used to occur across more than 1500 km of coastlinein the state of South Australia and formed a significant commercialfishery from 1836 to 1910. However, the extent of both was notknown until recently (Alleway and Connell, 2015). During colonialsettlement in southern Australia (ca. 1836), the oyster industry har-vested O. angasi from more distant areas, after which they frequently“bedded down” the catch in places closer to port for later distribu-tion to market (Inspector of Fisheries, 1886). This activity was, inmany respects, a form of sea ranching. Oysters were occasionallyreported to die in large quantities in these areas during hot spellsor when demand for product was low, and in time the fisherycollapsed due to overharvesting and the overexploitation of oysterreefs (Randall, 1911, 1912). While a commercial fishery forO. angasi no longer exists, the species is endorsed for growing onapproximately half of the states’ oyster aquaculture licences.
Recovering the historical baseline thus provided the opportunityto explicitly consider the contemporary role of this species inaquaculture.
The South Australian aquaculture industry as a whole began in1969 with the importation of 50 bags (�6000 individuals) ofCrassostrea gigas, the Pacific oyster, from Tasmania (Olsen, 1994).Across all sectors, the industry contributes almost 55% of thestates’ total landed seafood value with a projected annual growthof around 8% (Econsearch, 2014), the second largest share ofgross value of production in Australia (Stephan and Hobsdawn,2014). Production centres on premium, high value products suchas the southern bluefin tuna (Thunnus maccoyii), and abalone(Haliotis species). Nearly 50 years after a modest beginning, SouthAustralia is focused on the sustainable development of aquacultureand maintains a high profile industry position (Stephan andHobsdawn, 2014). Production is managed using a comprehensiveprocess incorporating ecological data, e.g. habitat mapping of im-portant habitats, such as a seagrasses, and water quality testing,into the determination of aquaculture production locations andmodels of regional carrying capacity, to establish productionlimits, as well as ongoing data collection and reporting to meet legis-lated requirements for environmental monitoring (Lauer et al.,2015). Ecological and production-related data extending acrossmore than one or two decades has, however, had limited use and his-torical data have not been included in planning.
Oyster aquaculture in South Australia principally occurs for theintroduced species C. gigas, but government and industry have iden-tified O. angasi as an alternative species for culture and growers haverecognized the opportunity and value of diversifying their products.Government and industry-based investment is being made in diver-sification to meet local and global market demand and to reduce theconsequences of reliance on one species and the risk of a diseaseevent significantly affecting production (Roberts et al., 2013).Furthermore, as current industry awareness and interest ingrowing a native oyster species has recently increased, this hascreated a degree of support for further research and developmentof culturing techniques for this species. This is principally in relationto development in a commercial sense, but will also aid efforts toachieve conservation, recovery, and restoration of this significantlydegraded species (Beck et al., 2011; Alleway and Connell, 2015).
Using three actual examples of natural resource management inthe state of South Australia, we illustrate how historical data (“his-torical” being data collected more than three decades ago) can beused to inform aquaculture planning (“planning” being strategicdevelopment, regulation, policy, or management). The methodsused to identify and incorporate this type of data into decision-making are described and the value of this approach is discussed.Our aim is to raise the profile of historical data in natural resourcemanagement, in particular aquaculture, and to highlight opportun-ities for continuing to develop methods for its application. The needfor a secure global seafood supply implies that there will be increas-ing pressure placed on aquaculture to meet future demand.
MethodsHistorical data collationHistorical records held within the State Records of South Australia,the State Library of South Australia, and the South AustralianMuseum were reviewed for information regarding the nativeoyster, oyster fishing, and aquaculture in South Australia. Recordssourced included: annual government reports on the oyster
Page 2 of 10 H. K. Alleway et al.
137137

fishery (e.g. Randall, 1911); the diaries and travel journals of statefisheries inspectors (Inspector of Fisheries, 1886); and correspond-ence between the inspectors and the overseeing government agency.These records spanned the 1880s through the mid-1900s. Records ofcatch, catch rates, quantities of oysters sold, fishing effort, and loca-tions and depths of oyster beds were identified. During this review,records describing the translocation of a non-native oysterSaccostrea glomerata (Sydney rock oyster) from the eastern coastof Australia from at least 1885 to 1959 were identified, and locationsto which S. glomerata were translocated were collated. The survivalof S. glomerata was recorded (e.g. Randall, 1911), though the speciesdid not establish a wild population because it does not currentlyoccur within state waters (Wiltshire et al., 2010).
Locations of historical oyster bedsReferences to locations of commercial oyster fishing were used toidentify the historical distribution of beds. These locations were re-ferred to by fisheries inspectors as having “payable beds” or being“payable areas” (Inspector of Fisheries, 1886), meaning these loca-tions had densities of oysters sufficient to warrant commercialfishing by dredging. “Beds” are what are now widely termed oysterreefs; oysters in this formation grow in aggregations often in highdensities (Inspector of Fisheries, 1886; White et al., 2009).
Calculating historical catch quantitiesWithin the historical literature, we identified two locations, KellidieBay on Eyre Peninsula and Black Point on Yorke Peninsula, forwhich periods of continuous catch reporting occurred across dis-crete periods of time. Fishing records also existed for a further twolocations, Stansbury on Yorke Peninsula and Spalding Cove onEyre Peninsula, but these records contained disparate and missinginformation, and could not be used in isolation to calculate totalnumbers of oysters removed.
For the two locations where continuous catch reporting oc-curred, monthly catch recorded in bags (each containing �350oysters) were used to calculate total catch of oysters over 6 in in cir-cumference (Gazette, 1873), the minimum size limit, for the periodthat catch was recorded (see Supplementary material). Monthlycatch and references to the number of boats fishing at these locationswere then used to estimate average daily catch rates (bags of oystersboat21 d21) over the same period. We assumed that all recordedboats fished throughout the months for which catch was recorded,but that due to weather restrictions and the need to convey oysters tomarket, boats would not fish every day. Hence, to present a more ac-curate estimate of catch per unit of fishing effort, we tested twodegrees of fishing intensity; 1/3 of days per month spent fishingand 2/3 of days per month spent fishing (Table 1) and cross-
referenced these estimates with qualitative data sourced from his-torical records (see Supplementary material). This estimate wasthen used to fill gaps in the disparate data sourced for Stansburyand Spalding Cove. Estimated fishing intensity was applied to thenumber of boats reported fishing by the fisheries inspector and thedaily catch rate of oysters at these locations (see Supplementary mater-ial), to calculate a mean monthly cpue, andthusan estimate of the totalnumber of oysters removed from these beds.
Calculating historical densitiesDensity refers to the number of oysters per hectare (ha) of seabed.Owing to a minimum landing size of 6 in diameter, implementedin 1873, oysters ,6 in were not recorded and thus could not beincluded in our calculations. Area of available seabed (ha) was cal-culated for the two embayments on Eyre Peninsula, Kellidie Bayand Spalding Cove (Figure 1, Supplementary material). Polygonswere created in Google Earth Pro, based on historical references toareas fished, the limits of which were dictated by the entranceto the bay, and from which, fishing grounds historically referredto by a different name were excluded. The area of the polygon (inhectares) reflects the maximum area the oyster fleet would havefished at that time and, therefore, the maximum area of whichoysters and oyster reefs at that location would have been distributed.Total catch quantities calculated for those locations were divided bythe area of the embayment to estimate the minimum per hectare his-torical density of O. angasi (individuals .6 in).
Incorporating historical data into natural resourceplanningThe records collated and calculations made were utilized in threeformal processes of natural resource management for aquacultureplanning.
Consulting with government and industrySouth Australia’s Aquaculture Act 2001 permits aquaculture throughlicences and leases, which are prescribed for through regional zonepolicies. “Zone policies” inform spatial planning and describewhere, what species, and in what quantities products can occurwithin the zone boundaries, and are developed in consultationwith industry, stakeholders, and local community. In October2014, knowledge of the past ecological baseline of oyster reefs inSouth Australia (Alleway and Connell, 2015) and underlying histor-ical data were presented to the state’s research community throughan open forum and then targeted meetings with aquaculture scien-tists and natural resource managers. The knowledge that oyster reefshistorically occurred on the far west coast of South Australia wasused to inform the allocation of localized growing areas in that
Table 1. Average catch (bags d21 boat21) estimated from two scenarios of fishing rates, based on known total catch per month and numberof boats fishing in 1887, at Kellidie Bay, Eyre Peninsula.
DateBagsmonth21
Number ofboats fishing
Average catchboat21 month21
Average catchboat21 d21 1
3 fishing rateAverage catchboat21 d21 2
3 fishing rate
31 December 1886 470 22 21.36 2.07 1.0331 January 1887 520 22 23.64 2.29 1.1428 February 1887 392 22 17.82 1.91 0.9531 March 1887 276 22 12.55 1.21 0.6130 April 1887 220 22 10 1 0.531 May 1887 240 22 10.91 1.06 0.5330 June 1887 190 22 8.64 0.86 0.43Total 2 308 bags (807 800 individuals)
Incorporating historical data into aquaculture planning Page 3 of 10
138138

region and included in drafting of the Aquaculture (Zones—DenialBay) Policy. In November 2014, state government managers of theaquaculture sector presented this knowledge and the draft policyto oyster growers and the community.
Consultation centred on the draft zone policy, which was madepublicly available. Public and targeted meetings were held to answerquestions and concerns, such as the proposal of growing in specificlocations and whether the production quantities suggested mightcause environmental harm. A period for the receipt of written submis-sions regarding the draft policy was also held. A response document tothese submissions was then prepared, to highlight how variations tothe draft policy were made as a result of consultation, as well as afinal zone policy that incorporated these changes.
Assisting oyster productionIn collaboration with the peak representative body for the sector, theSouth Australian Oyster Growers Association (SAOGA), govern-ment managers have developed national and state strategies toreduce and mitigate against the risks of the Osteroid herpes virusmicrovariant-1 (OHVm-1) disease threat (Pacific oyster mortalitysyndrome, POMS). This disease, which affects C. gigas, has deci-mated the oyster-farming regions of Europe, New Zealand, andmore recently New South Wales and presents a high risk to SouthAustralia’s industry because of its reliance on this single species ofoyster (Roberts et al., 2013). Increasing production of O. angasi to
diversify the range of species produced through the oyster sector,to mitigate the economic effects of disease events, such as POMS,by enabling continued production of other species was recognizedas a strategy to reduce uncertainty in production and was thus pro-moted to industry by both SAOGA and the government.
At the request of government scientists and managers, historicaldata of the past occurrence of O. angasi and oyster reefs, includingdepth records and quantitative estimates of oyster density, were col-lated for their use in planning. These data were discussed with gov-ernment stakeholders, in particular scientists and managers, topromote a wider understanding of, for instance, the past presenceof oysters in contemporary growing locations, abundances ofoysters that historically occurred, and the ecological structure andfunction of these populations.
Conducting risk assessmentEcological risk assessment is used in the management of aquaticresources and is considered an important tool to an ecosystem-based approach (Smith et al., 2007). The process is used in fisher-ies management and continues to be refined because of the advan-tages it provides for explicit consideration of risks and in theincorporation of multiple objectives and differing stakeholderperspectives (Fletcher, 2005, 2014). The definition of risk assess-ment provided by the International Organisation of Standardsincludes the complete process of risk identification, analysis, con-sequence, likelihood, and evaluation (ISO, 2009). Analysing riskrequires the identification of “risk events”, which are then evalu-ated by quantifying the likelihood and consequence of their oc-currence (ISO, 2009). A lack of information is often cited as achallenge to risk assessment, but not assessing risk events due tolimited availability of data is effectively equivalent to the existingmanagement action, or inaction, being rated by default as accept-able (Fletcher, 2014).
A species of interest for the diversification of aquaculture in SouthAustralia is the non-native oyster S. glomerata. However, species exoticto South Australia are not permitted for release into state watersunless exempt by assessment and permit. Over the last two decades,applications made by industry to have this species assessed topermit growing have been rejected by government based on thespecies’ perceived risk that it could become established in the wildthrough intentional translocation or spawning and recruitmentfrom farmed oysters. Location-based historical records of “failed”translocations of this species were thus identified and incorporatedinto a risk-assessment framework.
On the basis that past and present environments may not be dir-ectly comparable, particularly due to climate change (Hobday,2011), and unknown variation in the accuracy of the source of his-torical data, we applied a series of questions to pre-assess: (i) the val-idity and (ii) the contemporary application of the historical records.These questions specifically sought to qualify whether the historicalrecords were likely to be accurate, rather than speculative, and con-tained information that could be applied to the contemporary en-vironment (full method in Supplementary material). Risk eventsassociated with the introduction of S. glomerata into SouthAustralia were identified, e.g. the risk of “escape” through spawningand recruitment of farmed oysters, and the historical data and spatialrecords of earlier translocations were considered. Departmental mon-itoring data, from 2001 onward, were used to identify temperature andsalinity profiles for six locations in which oyster growing currentlyoccurs. These data were considered alongside knowledge of theoptimal levels for the embryonic development, recruitment, and
Figure 1. Map of South Australia, (a) indicating state waters in whichaquaculture currently occurs, through leased and licensed water(shaded areas), and (b) the Eyre Peninsula and bays in whichcommercial fishing for the native oyster O. angasi historically occurred.
Page 4 of 10 H. K. Alleway et al.
139139
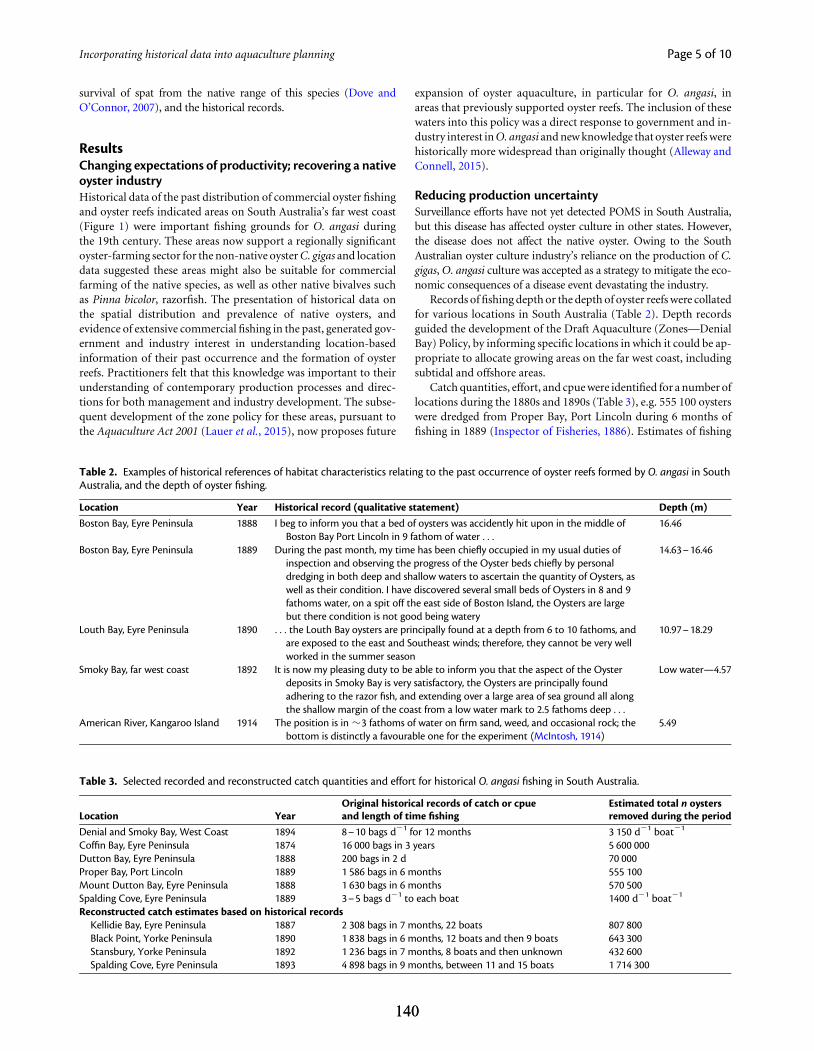
survival of spat from the native range of this species (Dove andO’Connor, 2007), and the historical records.
ResultsChanging expectations of productivity; recovering a nativeoyster industryHistorical data of the past distribution of commercial oyster fishingand oyster reefs indicated areas on South Australia’s far west coast(Figure 1) were important fishing grounds for O. angasi duringthe 19th century. These areas now support a regionally significantoyster-farming sector for the non-native oyster C. gigas and locationdata suggested these areas might also be suitable for commercialfarming of the native species, as well as other native bivalves suchas Pinna bicolor, razorfish. The presentation of historical data onthe spatial distribution and prevalence of native oysters, andevidence of extensive commercial fishing in the past, generated gov-ernment and industry interest in understanding location-basedinformation of their past occurrence and the formation of oysterreefs. Practitioners felt that this knowledge was important to theirunderstanding of contemporary production processes and direc-tions for both management and industry development. The subse-quent development of the zone policy for these areas, pursuant tothe Aquaculture Act 2001 (Lauer et al., 2015), now proposes future
expansion of oyster aquaculture, in particular for O. angasi, inareas that previously supported oyster reefs. The inclusion of thesewaters into this policy was a direct response to government and in-dustry interest in O. angasi and new knowledge that oyster reefs werehistorically more widespread than originally thought (Alleway andConnell, 2015).
Reducing production uncertaintySurveillance efforts have not yet detected POMS in South Australia,but this disease has affected oyster culture in other states. However,the disease does not affect the native oyster. Owing to the SouthAustralian oyster culture industry’s reliance on the production of C.gigas, O. angasi culture was accepted as a strategy to mitigate the eco-nomic consequences of a disease event devastating the industry.
Records of fishing depth or the depth of oyster reefs were collatedfor various locations in South Australia (Table 2). Depth recordsguided the development of the Draft Aquaculture (Zones—DenialBay) Policy, by informing specific locations in which it could be ap-propriate to allocate growing areas on the far west coast, includingsubtidal and offshore areas.
Catch quantities, effort, and cpue were identified for a number oflocations during the 1880s and 1890s (Table 3), e.g. 555 100 oysterswere dredged from Proper Bay, Port Lincoln during 6 months offishing in 1889 (Inspector of Fisheries, 1886). Estimates of fishing
Table 2. Examples of historical references of habitat characteristics relating to the past occurrence of oyster reefs formed by O. angasi in SouthAustralia, and the depth of oyster fishing.
Location Year Historical record (qualitative statement) Depth (m)
Boston Bay, Eyre Peninsula 1888 I beg to inform you that a bed of oysters was accidently hit upon in the middle ofBoston Bay Port Lincoln in 9 fathom of water . . .
16.46
Boston Bay, Eyre Peninsula 1889 During the past month, my time has been chiefly occupied in my usual duties ofinspection and observing the progress of the Oyster beds chiefly by personaldredging in both deep and shallow waters to ascertain the quantity of Oysters, aswell as their condition. I have discovered several small beds of Oysters in 8 and 9fathoms water, on a spit off the east side of Boston Island, the Oysters are largebut there condition is not good being watery
14.63– 16.46
Louth Bay, Eyre Peninsula 1890 . . . the Louth Bay oysters are principally found at a depth from 6 to 10 fathoms, andare exposed to the east and Southeast winds; therefore, they cannot be very wellworked in the summer season
10.97– 18.29
Smoky Bay, far west coast 1892 It is now my pleasing duty to be able to inform you that the aspect of the Oysterdeposits in Smoky Bay is very satisfactory, the Oysters are principally foundadhering to the razor fish, and extending over a large area of sea ground all alongthe shallow margin of the coast from a low water mark to 2.5 fathoms deep . . .
Low water—4.57
American River, Kangaroo Island 1914 The position is in �3 fathoms of water on firm sand, weed, and occasional rock; thebottom is distinctly a favourable one for the experiment (McIntosh, 1914)
5.49
Table 3. Selected recorded and reconstructed catch quantities and effort for historical O. angasi fishing in South Australia.
Location YearOriginal historical records of catch or cpueand length of time fishing
Estimated total n oystersremoved during the period
Denial and Smoky Bay, West Coast 1894 8–10 bags d21 for 12 months 3 150 d21 boat21
Coffin Bay, Eyre Peninsula 1874 16 000 bags in 3 years 5 600 000Dutton Bay, Eyre Peninsula 1888 200 bags in 2 d 70 000Proper Bay, Port Lincoln 1889 1 586 bags in 6 months 555 100Mount Dutton Bay, Eyre Peninsula 1888 1 630 bags in 6 months 570 500Spalding Cove, Eyre Peninsula 1889 3–5 bags d21 to each boat 1400 d21 boat21
Reconstructed catch estimates based on historical recordsKellidie Bay, Eyre Peninsula 1887 2 308 bags in 7 months, 22 boats 807 800Black Point, Yorke Peninsula 1890 1 838 bags in 6 months, 12 boats and then 9 boats 643 300Stansbury, Yorke Peninsula 1892 1 236 bags in 7 months, 8 boats and then unknown 432 600Spalding Cove, Eyre Peninsula 1893 4 898 bags in 9 months, between 11 and 15 boats 1 714 300
Incorporating historical data into aquaculture planning Page 5 of 10
140140

intensity extrapolated from these records suggested that one-thirdof time species fishing was likely to have reflected rates of historicalfishing effort. Using the estimated and tested rate of one-third oftime spent fishing (Table 1), additional location-specific catchrecords were calculated, e.g. an estimated 1 714 300 oysters weredredged from Spalding Cove, Eyre Peninsula during 9 months offishing in 1893 (Table 3).
In Kellidie Bay in 1873, the minimum density of oysters .6 inwas estimated at 870 oysters ha21, and in Spalding Cove in 1893,1250 oysters ha21 (Table 4). We considered these estimates conser-vative for the following reasons: the same locations were fished anumber of times over decades (Inspector of Fisheries, 1886;Randall, 1911), the figures accounted for only a single point intime, and estimates did not account for oysters smaller than 6 in.The area estimated would also not have held continuous stands ofoyster reefs, which were historically patchy in their distributionand their density variable (Inspector of Fisheries, 1886; Randall,1911), resulting in a smaller total area over which oysters used tooccur. Accurate knowledge of the historical area over which reefsused to occur, taking into account a higher degree of patchiness,would have increased the density of oyster per hectare estimated.
Incorporating historical data in risk assessmentFifteen locations were identified from the historical literature ashaving had releases of translocated S. glomerata, from 1885 to1959 (Figure 2). Appraisal of the validity and applicability of the his-torical records from which these data were sourced indicated thatthe validity of the data was “high” and that it could, therefore, beused with “high confidence” (Table 5). This rating was reinforcedby the data being reported solely by primary sources—fisheriesinspectors and museum specimens—who are trained personnelwith no known reason for reporting their observations withbias (see Supplementary material). Appraisal of the historical datain relation to its suitability for comparison to the current environ-ment indicated the information was “reasonably applicable”(Table 6). The historical data were, consequently, considered appro-priate for inclusion in risk assessment using a semi-quantitativeConsequence × Likelihood (C × L) approach (Fletcher, 2014).
“Risk events” regarding the introduction of the exotic S. glomer-ata and its growing in South Australia were broadly categorizedagainst the probability of its colonization and establishment, andthe probability of its spread, and within these categories, the morespecific risk events of spawning (release) from aquaculture leases,and recruitment, survival, and establishment of feral oysters aswell as their spread through accidental and intentional transloca-tion. Disease risk was also considered but was not informed by thehistorical records. Risk scores associated with these events wereassessed as “low” to “moderate”.
Through the risk assessment, researchers and managers con-cluded S. glomerata may spawn on aquaculture leases and recruitto the wild; however, the salinity of locations across SouthAustralia would likely limit their growth and hence the impactthey could have on the environment. Knowledge of multiple
historical translocations of this species without its subsequent estab-lishment provided confidence in the assessment that whileS. glomerata might survive, it is not likely that the species willform a persistent wild population. It was also concluded that thereremained a lack of information, often an outcome of risk assessment
Table 4. Minimum density of O. angasi oysters .6 in in circumference based on the maximum area available to fishing and oyster reefdistribution and reconstructed catch estimates.
Location Year Maximum area available (ha) Number of oysters caught >6 in Minimum density of oysters >6 in
Kellidie Bay 1887 928.5 807 800 870 oysters ha21
Spalding Cove 1893 1 370.8 1 714 300 1250 oysters ha21
Figure 2. Locations of historical introductions of Saccostrea glomerata(Sydney rock oyster) along the coastline of South Australia from 1885 to1959, as indicated by historical references within fisheries files of theState Records of South Australia and shell samples within the SouthAustralian Museum.
Table 5. Validity of information: 0–1 questions answered “yes” ¼low confidence of validity; 2–3 questions answered “yes” ¼moderate confidence; 4 questions answered “yes” ¼ high confidence.
Validity of information—questions provide anindication of the confidence with which historicalinformation can be used
Response forS. glomerata
Are multiple data points available? YesAre multiple sources or types of data available? YesDo primary information sources contribute .75%
of the data?aYes
Was the information written by a person in a positionof authority?b
Yes
aInformation sources included published government reports, departmentaldiaries and correspondence, and Museum records.bThe authority of the person reporting information may increase objectivityin the response provided. This question places less value on historical recordsthat are more difficult to authenticate or validate because of the author, e.g.personal statements in newspaper articles.
Page 6 of 10 H. K. Alleway et al.
141141

(Fletcher, 2014), but the historical data appreciably bridged thisknowledge gap. The policy outcome of the assessment was thatapplications to culture S. glomerata in South Australia would be for-mally received by the government. This species represents a newcommodity for the sector, which could support diversificationand security in production.
DiscussionReconstructed estimates of species’ or habitat distributions orabundance provide a means to bridge the knowledge gap betweenpast environments and their present use (Rosenberg et al., 2005;Mann et al., 2009). For example, contemporary aquaculture inopen seas can be characterized by uncertainty, including highmortality due to environmental impacts (e.g. changes in waterquality, and disease events; Nell, 2001; Roberts et al., 2013), butknowledge of the occurrence of past species and their distributioncan provide an informed position for industry and government’sto support the diversification of aquaculture, through the range ofspecies grown or spatial expansion and movement of aquaculturefacilities. Diversification could reduce the economic risks associatedwith disease or environmental events, because identifying poten-tial areas for the expansion or movement of aquaculture canprovide some security to production (Oglend and Tveteras, 2009).The value and efficacy of underpinning planning decisions foraquaculture, such as spatial planning, with historical data is exem-plified here.
A new focus on “native oyster aquaculture” in South Australiaillustrates the value of identifying past ecological baselines andusing historical data in natural resource management. Recoveringthe “lost” ecological baseline for O. angasi and oysters reefs inSouth Australia (Alleway and Connell, 2015) increased interest inthe growing of this species and generated the incorporation offurther historical data into multiple processes for aquaculture plan-ning. Locations of oyster reefs formed by O. angasi and calculationsof historical catch provided an evidence-based position for the de-velopment of aquaculture and planning activities in SouthAustralia. Limitations of the catch records and density calculationsapplied to planning include the application of several assumptions,e.g. assumed fishing intensities and an unknown measure of confi-dence. Additional data that could reduce the use of assumptions,or assist in determining a confidence rating, would be of value.The use of multiple data sources, including alternative sources,e.g. newspaper articles, or interviews with fishers to elicit inter-
generational data, is one method that can increase the certainty ofhistorical estimates (Pinnegar and Engelhard, 2008; Thurstanet al., 2014) and it might be possible to identify and collate addition-al historical records. However, the use of preliminary estimates, suchas the minimum oyster densities generated from the historical catchdata here, provide an earlier baseline for planning and an informedposition for engaging and consulting with stakeholders.
Refined density calculations could be made using spatiallayers that indicate habitat types or bathymetry data for shoals, sand-banks or mean low tide, and probable areas in which oysters wouldor would not historically have occurred. Records of the depthat which oysters occurred or were fished could also refine estimates,provided these records were complete for an embayment and couldbe incorporated into contemporary spatial data or mapping.Biological data on filtration rates and food consumption were alsonot available, but could, in time, be used to make comparisonsbetween the minimum historical oyster density and contemporarystocking densities, of the native oyster or other bivalve species. Itmight be possible to incorporate such calculations into models forcarrying capacity and marine spatial planning (Filguiera et al.,2014), or use these to compare past and present water filtrationrates and the residence time of water within embayments (e.g. zuErmgassen et al., 2013). Where the historical turnover of water isgreater than that achieved by naturally occurring bivalves, in com-bination with those cultured, such calculations could alleviate con-cerns about the carrying capacity of embayments and stockingdensities that are perceived to be high.
Increasing demand for seafood will result in multiple pressureson aquatic resources (Diana, 2009; Duarte et al., 2009; McClanahanet al., 2015), one of which will be the need to grow new or exoticspecies. Diversifying production provides a means to support food se-curity, because it can contribute to stable production quantities andcontinuity of supply. Market demand for a range of commoditiesand societal expectations for high quality food will also drive increaseddiversification in seafood. The culture of new species must, however,be evaluated against their potential impacts and the possible negativeeffects of a simplified and homogenous ecosystem (Howarth et al.,2014), which could result from the persistent and widespread intro-duction of exotic species in new areas. Risk assessment provides ameans to objectively identify and evaluate the potential impacts of ac-tivities, to reduce uncertainty through multiple lines of evidence(Fletcher, 2014). It also provides an informed, transparent, and ac-countable decision-making framework for the management ofaquatic resource use (McClanahan et al., 2015). Historical datacould, where available, support the qualitative and quantitative evalu-ation of risk events and be explicitly incorporated into risk assessmentacross the continuumof methodology, e.g. fromqualitative evaluationof the C × L of a risk event, through semi-quantitative application ofrisk ratings based on scores associated with C × L, and a fully quanti-tative approach that uses measured changes in ecosystems as a result ofhuman impact (Figure 3). These uses require testing, particularly forthe quantitative application, across a range of species, locations, andscenarios, preferably through species-specific suitability models withlong-term data (Karatayev et al., 2015). Historical information canbe incorporated immediately though, into risk assessment throughinforming the identification and qualitative consideration of riskevents, and perhaps pragmatic evaluation of C × L ratings.
The potential for aquaculture to result in social and ecologicalimpacts decrees a shift to physical systems and governance frame-works that can provide greater accountability (Duarte et al., 2009;Smith et al., 2010; Bush et al., 2013). Practices and management
Table 6. Applicability of information: 0–2 questions answered“yes” ¼ not applicable, 3–5 questions answered “yes” ¼ moderatelyapplicable; 6 questions answered “yes” ¼ very applicable.
Current applicability of information—questionsindicate whether the information applies to thecurrent setting
Response forS. glomerata
Does the information apply to the same species forassessment?
Yes
Does the information apply to the same geographicalarea for assessment?
Yes
Was the information reported ,20 years? NoWas the information reported ,50 years ago? YesWas the information reported ,100 years ago? YesAre the ecological conditions directly comparable to
those in the period for which the information wasrecorded (with particular attention to climate)?
No
Incorporating historical data into aquaculture planning Page 7 of 10
142142
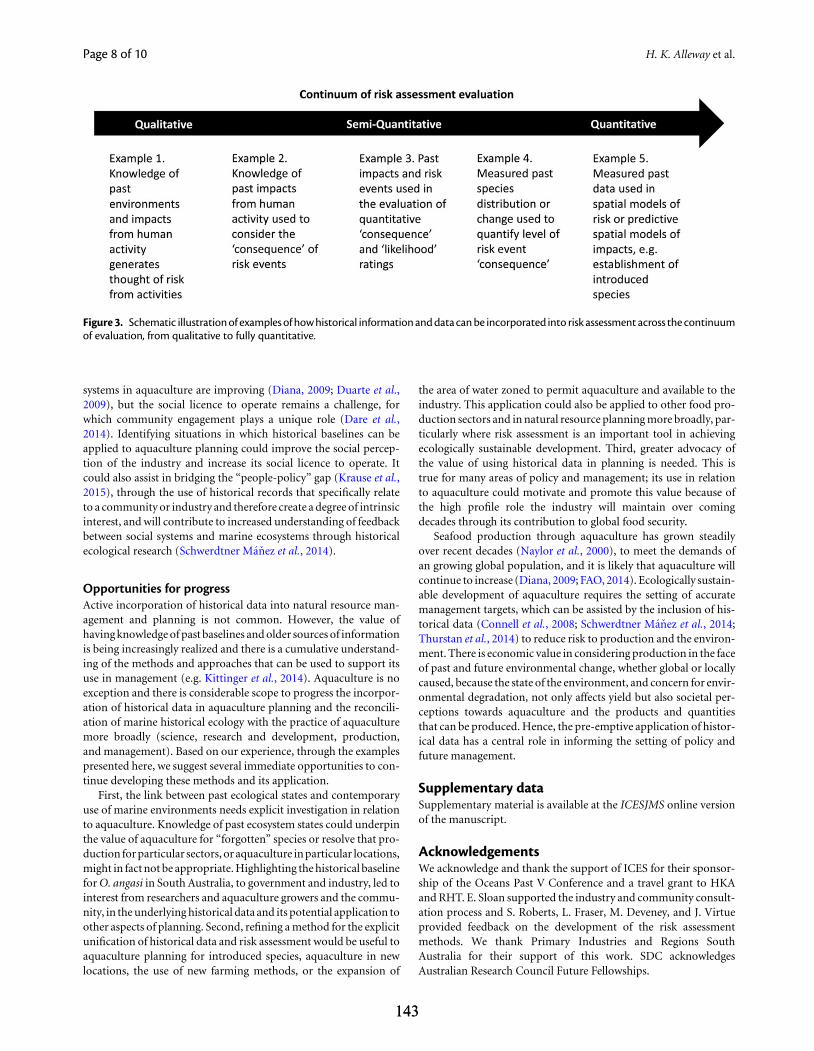
systems in aquaculture are improving (Diana, 2009; Duarte et al.,2009), but the social licence to operate remains a challenge, forwhich community engagement plays a unique role (Dare et al.,2014). Identifying situations in which historical baselines can beapplied to aquaculture planning could improve the social percep-tion of the industry and increase its social licence to operate. Itcould also assist in bridging the “people-policy” gap (Krause et al.,2015), through the use of historical records that specifically relateto a community or industry and therefore create a degree of intrinsicinterest, and will contribute to increased understanding of feedbackbetween social systems and marine ecosystems through historicalecological research (Schwerdtner Manez et al., 2014).
Opportunities for progressActive incorporation of historical data into natural resource man-agement and planning is not common. However, the value ofhaving knowledge of past baselines and older sources of informationis being increasingly realized and there is a cumulative understand-ing of the methods and approaches that can be used to support itsuse in management (e.g. Kittinger et al., 2014). Aquaculture is noexception and there is considerable scope to progress the incorpor-ation of historical data in aquaculture planning and the reconcili-ation of marine historical ecology with the practice of aquaculturemore broadly (science, research and development, production,and management). Based on our experience, through the examplespresented here, we suggest several immediate opportunities to con-tinue developing these methods and its application.
First, the link between past ecological states and contemporaryuse of marine environments needs explicit investigation in relationto aquaculture. Knowledge of past ecosystem states could underpinthe value of aquaculture for “forgotten” species or resolve that pro-duction for particular sectors, or aquaculture in particular locations,might in fact not be appropriate. Highlighting the historical baselinefor O. angasi in South Australia, to government and industry, led tointerest from researchers and aquaculture growers and the commu-nity, in the underlying historical data and its potential application toother aspects of planning. Second, refining a method for the explicitunification of historical data and risk assessment would be useful toaquaculture planning for introduced species, aquaculture in newlocations, the use of new farming methods, or the expansion of
the area of water zoned to permit aquaculture and available to theindustry. This application could also be applied to other food pro-duction sectors and in natural resource planning more broadly, par-ticularly where risk assessment is an important tool in achievingecologically sustainable development. Third, greater advocacy ofthe value of using historical data in planning is needed. This istrue for many areas of policy and management; its use in relationto aquaculture could motivate and promote this value because ofthe high profile role the industry will maintain over comingdecades through its contribution to global food security.
Seafood production through aquaculture has grown steadilyover recent decades (Naylor et al., 2000), to meet the demands ofan growing global population, and it is likely that aquaculture willcontinue to increase (Diana, 2009; FAO, 2014). Ecologically sustain-able development of aquaculture requires the setting of accuratemanagement targets, which can be assisted by the inclusion of his-torical data (Connell et al., 2008; Schwerdtner Manez et al., 2014;Thurstan et al., 2014) to reduce risk to production and the environ-ment. There is economic value in considering production in the faceof past and future environmental change, whether global or locallycaused, because the state of the environment, and concern for envir-onmental degradation, not only affects yield but also societal per-ceptions towards aquaculture and the products and quantitiesthat can be produced. Hence, the pre-emptive application of histor-ical data has a central role in informing the setting of policy andfuture management.
Supplementary dataSupplementary material is available at the ICESJMS online versionof the manuscript.
AcknowledgementsWe acknowledge and thank the support of ICES for their sponsor-ship of the Oceans Past V Conference and a travel grant to HKAand RHT. E. Sloan supported the industry and community consult-ation process and S. Roberts, L. Fraser, M. Deveney, and J. Virtueprovided feedback on the development of the risk assessmentmethods. We thank Primary Industries and Regions SouthAustralia for their support of this work. SDC acknowledgesAustralian Research Council Future Fellowships.
Figure 3. Schematic illustration of examples of how historical information and data can be incorporated into risk assessment across the continuumof evaluation, from qualitative to fully quantitative.
Page 8 of 10 H. K. Alleway et al.
143143

ReferencesAiroldi, L., and Beck, M. W. 2007. Loss, status and trends for coastal
marine habitats of Europe. Oceanography and Marine Biology: anAnnual Review, 45: 345–405.
Alleway, H. K., and Connell, S. D. 2015. Loss of an ecological baselinethrough the eradication of oyster reefs from coastal ecosystemsand human memory. Conservation Biology, 29: 795–804.
Allison, E. H. 2011. Aquaculture, fisheries, poverty and food security.
Ban, N. C., Kittinger, J. N., Pandolfi, J. M., Pressey, R. L., Thurstan, R. H.,Lybolt, M., and Hart, S. 2014. Chapter 9: Incorporating historicalperspective into systematic marine conservation planning. InMarine Historical Ecology in Conservation: Applying the Past toManage the Future. Ed. by J. N. Kittinger, L. McClenachan, K. B.Gedan, and L. K. Blight. University of California Press, Oakland,California.
Beck, M. W., Brumbaugh, R. D., Airoldi, L., Carranza, A., Coen, L. D.,Crawford, C., Defeo, O., et al. 2011. Oyster reefs at risk and recom-mendations for conservation, restoration, and management.BioScience, 61: 107–116.
Berkes, F., Hughes, T. P., Steneck, R. S., Wilson, J. A., Bellwood, D. R.,Crona, B., Folke, C., et al. 2006. Globalization, roving bandits, andmarine resources. Science, 311: 1557–1558.
Bush, S. R., Belton, B., Hall, D., Vandergeest, P., Murray, F. J., Ponte, S.,Oosterveer, P., et al. 2013. Certify sustainable aquaculture? Science,341: 1067–1068.
Carlton, J. T. 2009. Deep invasion ecology and the assembly of commu-nities in historical time. In Biological Invasions in MarineEcosystems. Ed. by G. Rilov, and J. A. Crooks. Springer-Verlag,Berlin.
Connell, S. D., Russell, B. D., Turner, D. J., Shepherd, S. A., Kildea, T.,Miller, D., Airoldi, L., et al. 2008. Recovering a lost baseline:missing kelp forests from a metropolitan coast. Marine EcologyProgress Series, 360: 63–72.
Costa-Pierce, B. A. 1987. Aquaculture in ancient Hawaii. BioScience, 37:320–331.
Dare, M., Schirmer, J., and Vanclay, F. 2014. Community engagementand social licence to operate. Impact Assessment and ProjectAppraisal, 32: 188–197.
Dayton, P. K., Tegner, M. J., Edwards, P. B., and Riser, K. L. 1998. Slidingbaselines, ghosts, and reduced expectations in kelp forest communi-ties. Ecological Applications, 8: 309–322.
Diana, J. S. 2009. Aquaculture production and biodiversity conserva-tion. BioScience, 59: 27–38.
Dove, M. C., and O’Connor, W. A. 2007. Salinity and temperature tol-erance of Sydney rock oysters Saccostrea glomerata during early on-togeny. Journal of Shellfish Research, 26: 939–947.
Duarte, C. M., Holmer, M., Olsen, Y., Soto, D., Marba, N., Guiu, J.,Black, K., et al. 2009. Will the oceans help feed humanity?BioScience, 59: 967–976.
Econsearch. 2014. The Economic Impact of Aquaculture of the SouthAustralian State and Regional Economies, 2012/13: a Report toPIRSA Fisheries & Aquaculture.
Erlandson, J. M., and Rick, T. C. 2010. Archaeology meets marineecology: the antiquity of maritime cultures and human impacts onmarine fisheries and ecosystems. Annual Review of MarineScience, 2: 231–251.
Essl, F., Dullinger, S., Rabitsch, W., Hulme, P. E., Pysek, P., Wilson,J. R. U., and Richardson, D. M. 2015. Historical legacies accumulateto shape future biodiversity in an era of rapid global change.Diversity and Distributions, 21: 1–14.
FAO. 2014. The State of World Fisheries and Aquaculture. Rome, Italy.96 pp.
Filguiera, R., Grant, J., and Strand, O. 2014. Implementation of marinespatial planning in shellfish aquaculture management: modelingstudies in a Norwegian fjord. Ecological Applications, 24: 832–843.
Fletcher, W. J. 2005. The application of qualitative risk assessment meth-odology to prioritize issues for fisheries management. ICES Journalof Marine Science, 62: 1576–1587.
Fletcher, W. J. 2014. Review and refinement of an existing qualitative riskassessment method for application within an ecosystem-basedframework. ICES Journal of Marine Science, 72: 1043–1056.
Gazette, S. A. G. 1873. The Oyster Fishery Act. In No. 13. Ed. by G. o. S.Australia. Government Printer, Adelaide.
Godfray, H. C. J., Beddington, J. R., Crute, I. R., Haddad, L., Lawrence,D., Muir, J. F., Pretty, J., et al. 2010. Food security: the challenge offeeding 9 billion people. Science, 327: 812–818.
Greenstein, B. J., and Pandolfi, J. M. 2008. Escaping the heat: range shiftsof reef coral taxa in coastal Western Australia. Global ChangeBiology, 14: 513–528.
Hobday, A. J. 2011. Sliding baselines and shuffling species: implicationsof climate change for marine conservation. Marine Ecology, 32:392–403.
Howarth, L. M., Roberts, C. M., Thurstan, R. H., and Stewart, B. D. 2014.The unintended consequences of simplifying the sea: making thecase for complexity. Fish and Fisheries, 15: 690–711.
Inspector of Fisheries. 1886. Diary and letter books of the Inspector ofOyster Fisheries. Department of Fisheries, Adelaide.
International Organisation of Standards ISO 31000. 2009. Risk manage-ment—principles and guidelines. International Organisation ofStandards, Geneva, Switzerland. 24 pp.
Jackson, J. B. C. 1997. Reef since Columbus. Coral Reefs, 16: S23–S32.
Karatayev, A. Y., Burlakova, L. E., Mastitsky, S. E., and Padilla, D. K.2015. Predicting the spread of aquatic invaders: insight from 200years of invasion by zebra mussels. Eological Applications, 25:430–440.
Kittinger, J. N., McClenachan, L., Gedan, K. B., and Blight, L. K. 2014.Marine Historical Ecology in Conservation: Applying the Past toManage the Future. University of California Press.
Krause, G., Brugere, C., Diedrich, A., Ebeling, M. W., Ferse, S. C. A.,Mikkelson, E., Perez Agundez, J. A., et al. 2015. A revolutionwithout people? Closing the people-policy gap in aquaculture devel-opment. Aquaculture, 447: 44–55.
Lauer, P. R., Lopez, L., Sloan, E., Sloan, S., and Doroudi, M. 2015.Learning from the systematic approach to aquaculture zoning inSouth Australia: a case study of Aquaculture (Zones—Lower EyrePeninsula) Policy 2013. Marine Policy, 59: 77–84.
Mann, R., Harding, J. M., and Southworth, M. J. 2009. Reconstructingpre-colonial oyster demographics in the Chesapeake Bay, USA.Estuarine, Coastal and Shelf Science, 85: 217–222.
McClanahan, T. R., Allison, E. H., and Cinner, J. E. 2015. Managing fish-eries for human and food security. Fish and Fisheries, 16: 78–103.
McIntosh, S. 1914. Fisheries-Report of Chief Inspector for 1913–1914.
Naylor, R. L., Goldburg, R. J., Primavera, J. H., Kautsky, N., Beveridge,M. C. M., Clay, J., Folks, C., et al. 2000. Effect of aquaculture on worldfish supplies. Nature, 405: 1017–1024.
Nell, J. A. 2001. The history of oyster farming in Australia. MarineFisheries Review, 63: 14–25.
Oglend, A., and Tveteras, R. 2009. Spatial diversification in Norwegianaquaculture. Aquaculture Economics and Management, 13:94–111.
Olsen, A. M. 1994. The history of the development of the Pacific oysterCrassostrea gigas (Thunberg) industry in South Australia.Transactions of the Royal Society of South Australia, 118: 253–259.
Pinnegar, J. K., and Engelhard, G. H. 2008. The “shifting baseline” phe-nomenon: a global perspective. Reviews in Fish Biology andFisheries, 18: 1–16.
Randall, W. G. 1911. Report of Chief Inspector of Oyster Fisheries onOyster-Fishing Industry.
Randall, W. G. 1912. Report of Senior Inspector of Oyster Fisheries onOyster-Fishing.
Incorporating historical data into aquaculture planning Page 9 of 10
144144

Roberts, S., Chalupa, A., Bombardieri, N., Kowalski, D., Deveney, M.,Lauer, P., Heaven, C., et al. 2013. Exercise SeaFox: testing aquaticanimal disease emergency response capabilities within aquaculture.44 pp.
Rosenberg, A. A., Bolster, W. J., Alexander, K. E., Leavenworth, W. B.,Cooper, A. B., and McKenzie, M. G. 2005. The history of oceanresources: modeling cod biomass using historical records.Frontiers in Ecology and the Environment, 3: 84–90.
Schwerdtner Manez, K., Holm, P., Blight, L., Coll, M., MacDiarmid, A.,Ojaveer, H., Poulsen, B., et al. 2014. The future of the Oceans Past:towards a global marine historical research initiative. PLoS ONE,9: e101466.
Smith, A. D. M., Fulton, E. A., Hobday, A. J., Smith, D. C., and Shoulder,P. 2007. Scientific tools to support the practical implementation ofecosystem-based fisheries management. ICES Journal of MarineScience, 64: 633–639.
Smith, M. D., Roheim, C. A., Crowder, L. B., Halpern, B. S., Turnipseed,M., Anderson, J. L., Asche, F., et al. 2010. Sustainability and globalseafood. Science, 327: 784–786.
Stephan, M., and Hobsdawn, P. 2014. Australian Fisheries andAquaculture Statistics 2013.
Thurstan, R. H., Campbell, A. B., and Pandolfi, J. M. 2014. Nineteenthcentury narratives reveal historic catch rates for Australian snapper(Pagrus auratus). Fish and Fisheries, in press.
Thurstan, R. H., and Roberts, C. M. 2014. The past and future of fishconsumption: can supples meet health eating recommendations?Marine Pollution Bulletin, 89: 5–11.
White, J. M., Buhle, E. R., Ruesink, J. L., and Trimble, A. C. 2009.Evaluation of Olympia oyster (Ostrea lurida Carpenter 1864)status and restoration techniques in Puget Sound, Washington,United States. Journal of Shellfish Research, 28: 107–112.
Wiltshire, K., Rowling, K., and Deveney, M. 2010. Introduced marinespecies in South Australia: a review of records and distributionmapping. ICES Document F2010/000305-1.
zu Ermgassen, P. S. E., Spalding, M. D., Grizzle, R. E., and Brumbaugh,R. D. 2013. Quantifying the loss of a marine ecosystem service: filtra-tion by the eastern oyster in US estuaries. Estuaries and Coasts, 36:36–43.
Handling editor: Mark Gibbs
Page 10 of 10 H. K. Alleway et al.
145145

SUPPLEMENTARY MATERIAL
Incorporating historical data into aquaculture planning
Heidi K. Alleway1,2, Ruth H. Thurstan3, Peter R. Lauer2, Sean D. Connell1
1 Southern Seas Ecology Laboratories, School of Biological Sciences and The
Environment Institute, University of Adelaide, Adelaide, South Australia, 5005,
Australia
2 Primary Industries and Regions South Australia, Fisheries and Aquaculture, 25
Grenfell Street, Adelaide, South Australia, 5000, Australia
3 Australian Research Council Centre of Excellence for Coral Reef Studies, School of
Biological Sciences, The University of Queensland, St Lucia, Queensland, 4072,
Australia
Appendix 1. Method for reconstructing historical records of catch quantities and
catch rates, based on changes across time and assumptions of fishing intensity.
Four locations with subsets of continuous data or multiple data points were identified
and used to make estimates about fishing rates and catch quantities. Monthly catch
recorded in bags at two locations, Kellidie Bay (Eyre Peninsula) and Black Point
(Yorke Peninsula) and references to the number of boats fishing at these locations
were used to estimate average daily catch rates, over 7 and 6 months respectively.
Catch rates were calculated for two different scenarios of fishing intensity; ⅓ and ⅔
of time (days) spent fishing per month. Scenarios of fishing intensity were estimates
only, based on an assumed number of days, but estimates were cross-referenced with
available anecdotal references of catch rates and catch per unit effort during the same
time period to increase certainty. These sources were derived from diaries and letter
books of the fisheries inspectors.
The estimates of fishing rates were then applied to a further two locations,
Stansbury (Yorke Peninsula) and Spalding Cove (Eyre Peninsula), which had non-
contiguous data but multiple data points of varied type, e.g. catch, daily or monthly
CPUE or effort, over a known period of time. These data points were used to populate
146146

tables of monthly catch, effort, CPUE, daily catch rate and the total number of
individuals caught. Monthly catch quantities, real and interpolated, were graphed and
catch in bags, at the end of each month, was translated from a moving average trend
line. Translated monthly catch estimates were summed to provide a total catch figure
(bags and individuals) over the known period of time.
Estimate 1: Kellidie Bay, Eyre Peninsula
Data within the diary of the Inspector lists quantities caught per month in Kellidie Bay
(Eyre Peninsula) from December 1886 to June 1887. The total number of bags caught
during the 7 months was 2 308 bags (807 800 individuals) from multiple beds within
the bay. A decline in the monthly catch was observed during this time from 470 bags
in December to 190 bags in June and though it was likely that some level of fishing
occurred after this date a letter from the Inspector to the Marine Board on the 9th June
1887 highlighted that; “The quantity of a marketable size have been so reduced that
each cutter cannot catch more than one bag per day …”. Fishing rates from June
onwards were likely greatly reduced after June 1887.
It was also recorded that 22 boats were dredging constantly during that time, at
that location. From these records the average monthly catch per boat was calculated.
Under a scenario of ⅓ time per month spent fishing the catch per day per boat was
initially 2.07 bags. Catch increased to 2.29 bags before steadily declining to 0.86
bags. A scenario of ⅔ time per month spent fishing showed an initial catch rate of
1.03 bags to a decline of 0.95 bags after 3 months, in February 1887. Taking into
account the above statement, and additional references that good fishing was at that
time still occurring - “The outer grounds in the outer Bays are not so prolific as those
beds which are situated in Kellidie Bay …” (letter to the Marine Board, 8th January
1887) - ⅔ of time spent fishing was considered to be too high and a fishing intensity
of ⅓ time per month was considered to be the likely fishing scenario.
Estimate 2: Black Point, Yorke Peninsula
A second estimate was generated from comparable monthly catch data at Black Point
(Yorke Peninsula) but in this example the number of boats dredging was initially
recorded as 12 and in later months 9 (Table 1). An interim daily catch rate of 4 to 5
bags per day to each boat fishing was recorded on April 14th 1890.
147147

Monthly catch increased initially and then decreased, from 410 bags to 179
bags in June 1890. Average daily catch rates per boat under a scenario of ⅓ time per
month spent fishing declined from 3.31 to 1.99 bags per day and under the scenario of
⅔ time per month fishing showed an initial catch rate of 1.65 bags to a decline of
0.99. Because it was recorded that 4 to 5 bags per day were being caught per boat the
⅔ fishing scenario was not likely and ⅓ fishing intensity, or less, was more realistic.
The decline in catch was similarly recorded as being a result of overfishing; on
21st August 1890 the Inspector reported; “In the morning off Port Alfred, or Black
Point, these grounds have been worked out, and I find no Cutters dredging here.”
These calculations are only estimates and there are limitations to the data
including the small sample set, the assumption that catch quantities were accurately
reported by the Inspector and that all boats were fishing at all times. It is likely that
there was fluctuation in the number of boats fishing and that monthly and daily catch
was higher on some boats than others however, these estimates provide an indication
of how much time was spent fishing by the oyster fleet as a whole.
Table 1. Average catch (bags per day per boat) estimated from two scenarios of
fishing intensity, known total catch per month and number of boats fishing, at Black
Point, Yorke Peninsula.
Date Bags month-1
Number of
Boats
Average
catch boat-1
month-1
Average
catch boat-1
day-1 at ⅓
fishing rate
Average
catch boat-1
day-1 at ⅔
fishing rate
31/01/1890 410 12 34.17 3.31 1.65
28/02/1890 429 12 35.75 3.83 1.91
31/03/1890 313 12 26.08 2.52 1.26
30/04/1890 290 9 32.22 3.22 1.61
31/05/1889 217 9 24.11 2.33 1.17
30/06/1889 179 9 19.89 1.99 0.99
TOTAL 1 838 bags (643 300 individuals)
148148

Estimate 3: A single bed, Stansbury, Yorke Peninsula
A mix of total monthly catch quantities, the number of boats fishing and specific
references to daily catch rates were identified for a bed just north of Stansbury (Yorke
Peninsula) from 5th October 1891 to the 5th June 1892. Assuming a fishing intensity of
⅓ time per month recorded and interpolated monthly catch rates were calculated. End
of month catch was translated from a moving average trend line with the total sum of
bags caught estimated to be 1 236 in 7 months (432 600 individuals) (Table 3).
Fishing occurred for at least 9 months but estimates of monthly catch were not able to
be made for the first and last months.
Table 2. A single bed north of Stansbury: catch and effort records with interpolated
quantities based on 1/3 fishing rate. Bold text = historical data reported through
records. Italicised text = assumptions applied and normal text = extrapolated. End of
month catch quantities translated from a moving average trend line between reported
and interpolated catch quantities (bags).
Date
Monthly
Catch
(bags) Effort CPUE
Daily Catch
Rate
Total
Individuals
Caught for
Month
05/10/1891 Boats dredging
31/10/1891 No
estimate
13/11/1891 320 8 boats dredging 40 bags month-1
boat-1
3.87 bags day-
1 boat-1
112 000
30/11/1891 320 112 000
05/12/1891 320 Assumed 8 boats
dredging
40 bags month-1
boat-1
3.87 bags day-
1 boat-1
112 000
31/12/1891 267 93 450
09/01/1892 247.92 Assumed 8 boats
dredging
30.99 bags
month-1 boat-1
2 to 4 bags
day-1 boat-1
(average 3
bags day-1
boat-1)
86 772
31/01/1892 217 75 950
28/02/1892 176 61 600
31/03/1892 129 45 150
30/04/1892 85 29 750
149149
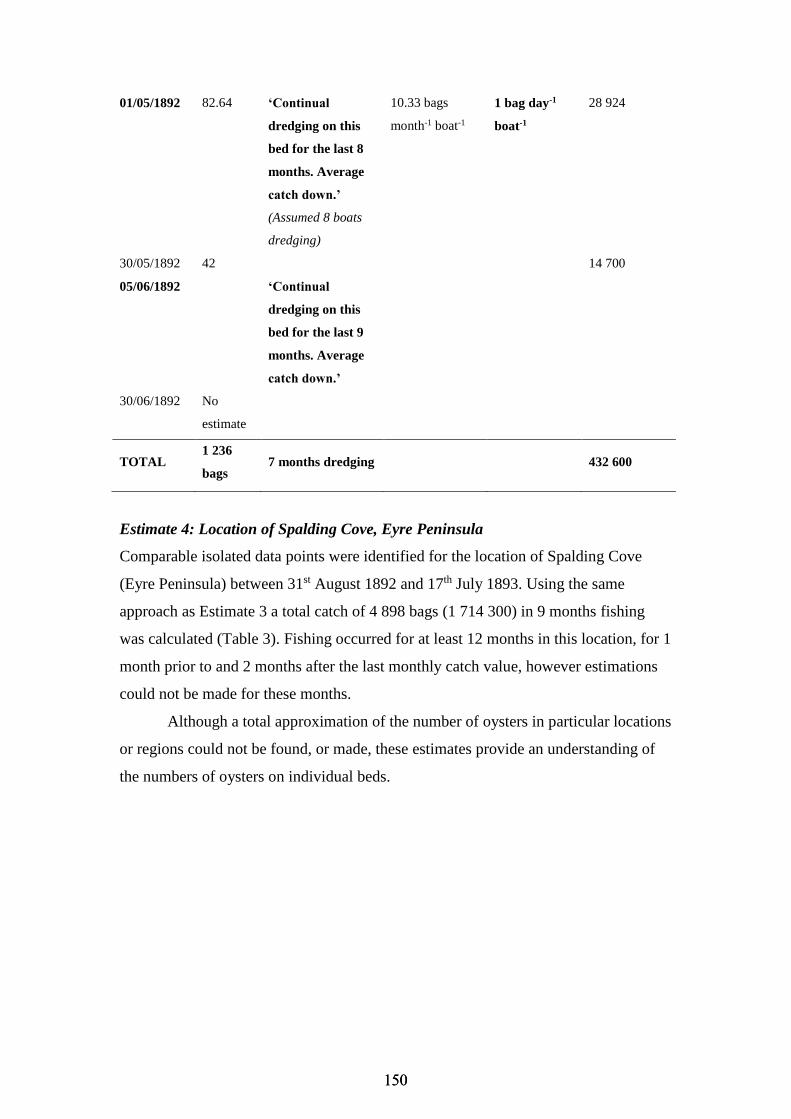
01/05/1892 82.64 ‘Continual
dredging on this
bed for the last 8
months. Average
catch down.’
(Assumed 8 boats
dredging)
10.33 bags
month-1 boat-1
1 bag day-1
boat-1
28 924
30/05/1892 42 14 700
05/06/1892 ‘Continual
dredging on this
bed for the last 9
months. Average
catch down.’
30/06/1892 No
estimate
TOTAL 1 236
bags 7 months dredging 432 600
Estimate 4: Location of Spalding Cove, Eyre Peninsula
Comparable isolated data points were identified for the location of Spalding Cove
(Eyre Peninsula) between 31st August 1892 and 17th July 1893. Using the same
approach as Estimate 3 a total catch of 4 898 bags (1 714 300) in 9 months fishing
was calculated (Table 3). Fishing occurred for at least 12 months in this location, for 1
month prior to and 2 months after the last monthly catch value, however estimations
could not be made for these months.
Although a total approximation of the number of oysters in particular locations
or regions could not be found, or made, these estimates provide an understanding of
the numbers of oysters on individual beds.
150150

Table 3. The location of Spalding Cove: catch and effort records with interpolated
quantities based on 1/3 fishing rate. Bold text = historical data reported through
records. Italicised text = assumptions applied and normal text = extrapolated. End of
month catch quantities translated from a moving average trend line between reported
and interpolated catch quantities (bags).
Date
Monthly Catch
(bags) Effort CPUE Daily Catch Rate
31/07/1892 No estimate
31/08/1892 1 011
06/09/1892 975 15 boats
dredging
65 bags
month-1 boat-1
6.5 bags month-1 boat-1
30/09/1892 876
31/10/1892 747
19/11/1892 1417 (in 4.5
months of fishing)
314.89
14 boats
licensed and
recorded catch
22.49 bags
month-1 boat-1
2.18 bags day-1 boat-1
30/11/1892 613
31/12/1892 472
12/01/1893 11 boats
dredging
25/01/1893 361.62 All boats
(Assumed 14
boats dredging)
25.83 bags
month-1 boat-1
2.5 bags month-1 boat-1
31/01/1893 371
28/02/1893 430
03/03/1893 433.86 (Assumed 14
boats dredging)
30.99 bags
month-1 boat-1
3 bags.day-1 boat-1
31/03/1893 278
11/04/1893 210 (Assumed 14
boats dredging)
15 bags
month-1 boat-1
1.5 bags.day-1 boat-1
30/04/1893 100
31/05/1893 No estimate
17/07/1893 Boats dredging
TOTAL 4 898 bags (1 714
300 individuals)
9 months
dredging
151151

Appendix 2. Estimated area of embayments, generated from polygons in Google
Pro and the consequent maximum area likely available for the historical
distribution of Ostrea angasi reefs in these locations.
Figure 1. Area of Kellidie Bay, Eyre Peninsula, and the maximum area available to
the historical distribution of oyster reefs formed by O. angasi and the fishing for this
species, in this location.
Figure 2. Area of Spalding Cove, Eyre Peninsula, and the maximum area available to
the historical distribution of oyster reefs formed by O. angasi and the fishing for this
species, in this location.
152152
Appendix 3. Information and method used to incorporate historical information
into risk assessment for non-native oyster species (Saccostrea glomerata)
aquaculture in South Australia.
Historical Data
Saccostrea glomerata has previously been introduced to South Australian waters, on a
number of occasions between at least 1866 and 1977. Olsen (1994) described some of
these introductions in relation to the development of oyster aquaculture in the state:
“Early attempts to grow rock oysters in southern Australia
An attempt in 1886-7 to acclimatise the Sydney rock oyster at Hobart, Tasmania was
unsuccessful (Saville-Kent 1887). A trial shipment of the same species spread out on
trays at Kelso, River Tamar, in northern Tasmania in 1948 by a Sydney rock oyster
grower failed too (Olsen 1965).
In 1933-4 attempts were made to cultivate young Sydney Rock oysters on a
commercial scale in South Australian waters. 228,000 oysters were laid out on trays
off the west bank of the Port River below the Osborne Power Station where an earlier
experimental consignment had reportedly grown very fast (Anon. 19341; Wallace-
Carter 1987). Other attempts to acclimatise the Sydney rock oysters were made in
1937 at Mt Dutton and Kellidie Bays without success.
A small consignment of juvenile Sydney rock oysters from a warm water
environment at a solar saltfield at Port Alma, Queensland was transferred in May
1976 into seawater of approximately similar salinity and temperature of the primary
pond of the solar saltfield at Dry Creek. Within 3 months 95% of the experimental
consignment died. Later the same year a second experimental consignment was
transferred from the same source and these oysters suffered 70% mortality within a
month. As a result of these experiments further translocation experiments into
quarantine areas at Dry Creek ceased (Melvin per comm.).
So far as the author is aware the last attempt to acclimatise Sydney rock
oysters in South Australia was in 1977 when oysters put into the commercial prawn
farm ponds at Port Broughton failed.
Thomson (1952) remarked that conditions of the waters of the southern states
are outside the natural range of the Sydney rock oyster.”
153153

1 ANON. (1934) Large scale farming of Sydney rock oysters in Port River. “The
Saturday Mail” 14 July, 1934.
Other sources reported earlier introductions, including Randall (1911):
“REPRODUCTION OF OYSTER TRANSPLANTED FROM FOREIGN WATERS.
Bearing on the possibility of reproduction of oysters that have been transplanted from
foreign waters, a particularly interesting case has come under observation. In March
last, in company with Mr. E. Nelson (the oyster merchant of Port Adelaide), and
inspection was being made of the laying beds under Jervis Bridge. Here are laid
down oysters for commerce from Queensland, New South Wales, New Zealand, and
our own. Clusters of young oysters were noticed growing on one of the bridge
cylinders. A number of there were forwarded to the Fisheries Department of New
South Wales, with a request that they might be identified and classified. The naturalist
to that department (Mr. David G. Stead) reported therein and stated that they
appeared to be Ostrea cucullata, or the common rock oyster of New South Wales.
Before finally deciding on the species Mr. Stead asked to be furnished with some of
the adult South Australian oysters in shell, and also the animal only preserved in
formalin. These were sent, and Mr. Stead reported them to belong to the species
Ostrea edulis var. In connection with his report he made the following interesting
comment :--“It is worthy of mention here that I consider it probably that Ostrea edulis
has only found its way to the east coast of Australia in recent geological times, viz.,
since the great subsidence of the land between Tasmania and Australia which made
Bass’s Strait, thus rendering the migration of southern forms to the east coast more
easy.” Pursuing our investigations, it was found that the supposed parent oysters
were taken up in New South Wales when the rivers were in flood and the waters
therefore brackish. They were laid down at Port Adelaide under similar conditions,
the Torrens and Sturt Rivers being flooded at the time. The conclusion arrived at is
that under these special circumstances reproduction had naturally taken place. This
reproduction question is presenting difficulties to oyster experts both in Europe and
America. For instance, there does not appear to be any authenticated instance of
French or Belgian oysters reproducing in Great Britain, or vice versa, and the same
applies to the east and west Pacific slopes of America. It will be readily realised that
the case of ascertained reproduction here mentioned will be an occasion of much
interest to student of ostreaculture, and worthy or recording here.”
154154

Also Randall (1912):
“By courtesy of the Fisheries Department of New South Wales we received a sack of
selected brood oysters (oystrea cuculllata) in September, 1911. These arrived in good
order, and were laid down in secluded positions at the extreme western end of the
oyster reserve. A severe easterly gale in February last brought in quantities of
seaweed, and this interfered with those exposed to the weed, which at the time were
thriving. The oysters in other parts are flourishing and well grown, but there are no
signs of reproduction.”
“Even if these foreign oysters prospered in our waters, the practical results
may be considered to be of doubtful value, because the sufficiently sheltered localities
suitable for the growth of rock oysters are comparatively small in area ; and it is just
possible that some pest might be introduced with them that we are free from.”
This same introduction was commented on two years later by McIntosh (1914):
“In September, 1911, a quantity of New South Wales’ oysters (Ostrea cucullata) were
procured from the Fisheries Department of that State, and laid down in the nursery.
At first they were thriving, increased in size, and were in good condition ; later on
they showed signs of depreciation, and during the past year have practically
disappeared. There can, I think, be no doubt that the result if to be attributed chiefly
to the effects of past dry season, the increased salinity of our waters being entirely
different to the character of those from which they were taken. No signs of
reproduction have been noticed. The apparent failure of these oysters need not, I
think, be viewed as a drawback, the South Australian oyster (Ostrea edulis) is one of
the best, and it is possible that the introduction of the New South Wales oyster into
our waters might lead to the presence of some pest that at present we are free from.”
An additional introduction in 1910 was commented on by McIntosh (1913), however
this may have been incorrectly reported and been a reference to the 1911 event:
“Experimental Transportation of Foreign Oysters—The rock oysters (Ostrea
cucullata) obtained from the New South Wales Fisheries Department in September,
1910, and laid down in secluded portions of the oyster reserve have made good
growth, and are in excellent condition, no signs of reproduction having been noticed ;
this was anticipated. In a previous report it was stated that even if this oysters should
prosper in our waters, the practical results may be considered to be of doubtful value,
155155

because the sufficiently necessary sheltered waters are limited, and it is just possible
that some pest might be introduced with them that we are free from.”
Numerous introductions were described by the Fisheries Inspector through
correspondence with the Marine Board and in his journal of travel and inspection.
These records were:
Source Record Date Location
Letter from
Inspector
(Dabovich) to
Marine Board, Port
Lincoln, February
1st 1889
… in accordance with arrangements
previously made I received from Mr.
Charles Atkins of Port Adelaide on
January 23rd two bags at a cost of 24
shilling of Sydney Rock Oysters
which I had instructed him to collect
for me in the locality of Jervois
Bridge, Port Adelaide River.
1889 Port River
Letter from
Inspector(Dabovich)
to Marine Board,
Port Lincoln,
February 1st 1889
I have been busily engaged planting
the contents of one bag in small
quantities in Port Lincoln Proper
Bay and neighbouring bays in
suitable places, well protected from
destruction either by stingray, sea
wash or marine accumulation. On
the 28th of January I proceeded
overland to Coffins Bay taking with
me the 2nd bag of Sydney Rock
Oysters in a once horse conveyance,
and immediately on arrival there
proceeded to deposit them in various
places which I deemed most suitable.
Jan.1889 Proper Bay
(Port
Lincoln)
and Coffin
Bay
Port Adelaide The Sydney Rock Oysters I planted Feb. Port
156156

November 2nd
1891, Letter from
Inspector
(Dabovich) to
Under Treasurer
in Port Lincoln waters in February
last, are thriving favourably but as
yet I could not observe any young
spat but this is all in good time yet.
1890 Lincoln
Journal of travel and
inspection, Sep. 23rd
1889 (Mount
Dutton Bay)
… I find that on some of the beds
there were a fair quantity of the
young Oyster brood settled since this
Bay being closed. The razor fish
which I placed there some time ago
are progressing favourably, also the
Sydney Rock Oysters which I put
there they thriving favourably.
1889 Mount
Dutton Bay
Journal of travel and
inspection, Mar.
26th 1891
… to inspect the Oyster beds in
Spalding Cove and also to lay down
the contense of one bag of the
Sydney Rock Oysters, which I have
collected in the Port Adelaide
River… I found the oysters there to
be plentiful and in a remarkably
good and healthy condition, but not
for market being to small.
Mar.
1891
Spalding
Cove
Journal of travel and
inspection, Oct. 28th
1891
… rowed to Salt Creek and other
places for the purposes to examine
the Sydney Rock Oysters which I
planted some months ago, found
them in very healthy condition but
could not see any young Brood.
1891 Salt Creek
(Coffin
Bay, West
Coast)
157157
The collections of South Australian Museum contain dry samples of S. glomerata,
although they do not contain additional information regarding in what form or why
they were collected (e.g. from a aquaculture, fouling on substrate or infrastructure, or
naturally occurring). These samples were collected from:
Port River
Point Riley
Franklin Harbour (Cowell) in
1910
Kingscote (Kangaroo Island) in
1959
Corny Point
Coffin Bay
Hindmarsh River
Outer Harbour
Although a secondary reference, Wallace-Carter (1987) described introductions in
additional locations including Victor Harbor:
“The importance of the oyster industry was made clear by the then Treasurer,
William B. Rounsevell, when introducing the amending Act of 1885. He said: 'The
oyster fishery at the present time is an important industry and anything that can be
done to increase its importance must result in benefit to the State.' He went on to talk
of planting the Sydney rock oyster on suitable parts of the coast and an unsuccessful
attempt that had already been made by a Member of the House to grow these oysters
at Port Victor (Victor Harbor). The failure he ascribed to the oyster being placed at
too great a depth.”
Introductions were reported in the early 1900s in Kellide Bay:
“Three years later he said, 'In 1889 there were twenty-eight boats employed in the
oyster fishing industry. Since then each year it has shown a decrease in the number
until now (1903) there are only five boats engaged. He went on to say that these five
were doing fairly well, dredging near Point Bolingbroke and in Louth Bay. He also
reported that the oysters in Port Douglas were quite good, those in Kellidie Bay were
more prolific and 'the Sydney rock oysters, planted there some years ago are thriving.”
Also:
“A Sydney rock oyster project was started that year – 1934 – but not by the oystermen.
An attempt was made to farm these oysters on a large scale in the Port River at
158158

Osborne. The newly-formed company – The South Australian Oyster Company – was
managed by J. M. Laman, whose family had been oyster farming in New South Wales
for the previous fifty years, according to the South Australian weekly newspaper, the
Mail. Their plan was to produce a million dozen oysters a year by 1938 of
thereabouts for South Australian and Western Australian consumption.
For about four or five months we have been carrying out experiments with Mr.
Laman, an oyster farmer from Port Stephens, New South Wales’, Chief Inspector
Walter Bruce said in 1934. ‘Those experiments have proved conclusively that the
Sydney rock oyster will do particularly well in South Australian waters, their growth
has been phenomenal. They have fattened more quickly than in their own state. …
On this occasion Chief Inspector Walter Bruce was wrong, as, like all other
attempts to farm Sydney rock oysters in South Australia, the venture was unsuccessful.”
Historical introductions
Collating the records indicated S. glomerata had previously been introduced at 16
locations in South Australia, between 1886 and 1977. The 1977 recorded was
excluded from consideration because it did not occur in the natural environment, i.e.
translocation was to saltfields. At some locations introductions occurred multiple
times over a number of decades. No records indicated these introductions led to the
long-term establishment of S. glomerata in South Australia. However, the relevance
and application of this information must be considered because it is historical.
Questions to evaluated the validity of the information and its applicability to the
current setting were developed and applied to the historical records and data.
159159

Pest Risk Assessment
Use of historical information in risk assessment
Assessment of historical information for S. glomerata in South Australia
Validity of Information:
1. Yes
2. Yes
3. Yes
4. Yes
Information can be used with ‘high confidence’
Validity of Information: The results of these questions provide an indication of the
confidence with which the information can be used.
1. Are multiple data points available?
2. Are multiple types or sources of data available?
3. Is more than 75 % of the information from a primary source?
4. Was the information written by a person in a position of authority?
0 to 1 questions answered ‘yes’ = Low confidence
2 to 3 questions answered ‘yes’ = Moderate confidence
4 questions answered ‘yes’ = High confidence
Current Applicability: The results of these questions indicate whether the information
applies to the current setting.
1. Does the information apply to the same species for assessment?
2. Does the information apply to the same geographical area for assessment?
3. Was the information reported less than 20 years?
4. Was the information reported less than 50 years ago?
5. Was the information reported less than 100 years ago?
6. Are the ecological conditions the same as the time period for in which the
information was recorded (give particular attention to temperature)?
0 to 2 questions answered ‘yes’ = Not applicable
3 to 5 questions answered ‘yes’ = Reasonably applicable
6 questions answered ‘yes’ = Very applicable
160160

Current Applicability:
1. Yes
2. Yes
3. No
4. No (NB: 1977 record excluded
because location used was
prawn farming ponds and salt
ponds, i.e. not a natural
environment.)
5. Yes
6. No
Information is ‘reasonably applicable’
Supplementary Material References
MCINTOSH, S. 1913. Fisheries-Report of Chief Inspector for 1912-13.
Parliamentary Papers. Adelaide, South Australia: House of Assembly.
MCINTOSH, S. 1914. Fisheries-Report of Chief Inspector for 1913-1914.
Parliamentary Papers. Adelaide, South Australia: House of Assembly.
OLSEN, A. M. 1994. The history of the development of the Pacific oyster
Crassostrea gigas (Thunberg) industry in South Australia. Transactions of the Royal
Society of South Australia, 118, 253-259.
RANDALL, W. G. 1911. Report of Chief Inspector of Oyster Fisheries on Oyster-
Fishing Industry. Parliamentary Papers. Adelaide, South Australia: House of
Assembly.
RANDALL, W. G. 1912. Report of Senior Inspector of Oyster Fisheries on Oyster-
Fishing. Parliamentary Papers. Adelaide, South Australia: House of Assembly.
WALLACE-CARTER, E. 1987. For They Were Fisheries: The History of the Fishing
Industry in SA, Adelaide, Amphitrite Publishing House.
161161

Chapter 7: Discussion
7.1 Summary of thesis
Although the spatio-temporal scale of human impacts can vary, anthropogenic influences
have pressured ecosystems over prolonged periods of time. These ecosystems now define
the way that species and habitats function and, as a result, our perspectives, expectations
and management. Accordingly, there is considerable value in understanding the changes
that have occurred, to species and habitats, and their drivers. The aims of my research were
to ascertain whether aquatic ecological baselines in temperate Australia have shifted and,
where they have, to reconstruct more representative baselines for use in ecology and
management.
In chapter two the model of mean trophic level (MTL) of fisheries catches was used to
evaluate whether fishing of higher trophic level species was leading to the ‘fishing down’
of marine food webs in South Australia. Using disaggregated catch statistics a decline in
the MTL of fisheries catches over time was identified, at a rate greater than the global per
decade average. This outcome was, however, the result of the expansion of catches at
lower trophic levels rather than fishing down. I included a historical data set in this
analysis – quantities of fish sold through the Adelaide Fish Market from 1936 to 1946 – to
test whether alternative data sources could, perhaps, be combined with contemporary
fisheries statistics and incorporated into the model of MTL. The inclusion of historical data
could be particularly useful for disaggregating or refining statistics in other regions and in
extending the time span of evaluation prior to 1950 after which the collection of global
fisheries statistics began. This is the starting point for current calculations, but may not
always reflect the time span over which changes have occurred.
Chapter three builds on this understanding, of patterns of change in fisheries in South
Australia, using ‘neo-Europe’ as the basis for impact, induced by European colonisation.
Neo-Europe (Crosby, 1986), a conceptual model from the discipline of history, was used
for this evaluation to take a cross-disciplinary approach to this research and to contribute to
the reconciliation of the disciplines of ecology and history (Szabó and Hédl, 2011). This
chapter challenged my own understanding and perspective of contemporary fisheries and
162162

ecology. Through the use of the conceptual model a past societal preference for inland
fisheries species was identified reflecting similar patterns of change in Europe, this being
the overexploitation of inland fisheries species in the neo-Europe’s. Hence, this chapter
proposed this transition was, in part, predicated on the societal expectations of settlers,
which establishes a new baseline for fisheries and aquatic ecosystems. Marine fisheries are
often the focus of fisheries science and management, however, earlier deterioration of
inland ecosystems might have contributed to an undue bias toward marine ecosystems and
an intergenerational amnesia regarding their past productivity and need for restoration.
But it is not only resource use that drives change in ecosystems. In chapter four I
evaluated the merit of societal concern toward a cryptogenic species, and, as a result, the
management actions expected by the community. Options driven by societal concern
alone, based on assumptions of a high degree of invasiveness were extreme measures such
as the introduction of a biological control agent. These options contrasted those that were
pursued based on an understanding provided by the empirical data, which indicated there
may be positive benefits to the presence of the species. Accordingly, there is a risk that the
potential benefits such species bring could be overlooked, particularly where society
perceives a species to be extremely invasive and drives a political agenda for their
eradication. Historical ecology, and shifting baselines, could be used more extensively to
inform the ecological context of invading species and options for their management. In
doing so, it would assist scientists, managers and society to appreciate the benefits and
costs of living with new species, especially where these species are confronting, which can
lead to politically motivated action as opposed to an evidence-based approach.
References to commercial fishing of Ostrea angasi and to ‘payable’ beds identified
through archival research for chapter four, identified areas for which the historical
occurrence of oyster reefs was not at all anticipated, i.e. the upper Spencer Gulf. This led
me to seek a greater understanding of the past distribution and abundance of native oyster
reefs across South Australia. Through archival searches I identified previously unused data
recounting a commercial fishery for the native species, which operated throughout the
1800s and early 1900s. A past ecological baseline for oyster reefs was reconstructed and
revealed that oyster reefs were historically distributed across more than 1,500 km of
coastline, but their characterisation of the nearshore environment had gradually been
163163

forgotten. This chapter illustrated the occurrence of the shifting baseline syndrome,
ecological and cognitive, implying that contemporary ecological baselines could require
reevaluation.
Chapter six then tested the application of historical data to the setting of management
targets. Qualitative information from archival sources was used to guide decision-making
and quantitative statistics of past commercial fishing for oysters were reconstructed to
underpin the planning process and consultation with government and industry
stakeholders. Conclusively, reconstructing the ecological baseline of the past prevalence of
oyster reefs (chapter five) stimulated a new focus on the ‘native oyster’, increasing the
profile of the species and suggesting value in rebuilding productivity previously lost due to
overexploitation, through aquaculture. This represented an important shift in government
thinking and policy.
7.2 Future research
Where there are sparser human populations or a more recent onset of destructive human
activities it may be anticipated that changes to species, habitats or ecosystems could be
nominal. Many such areas have, however, been transformed by anthropogenic influences
and the perception that little has changed, particularly within marine environments in
temperate areas of Australia, is incorrect. Management actions based on recent data, such
as fisheries statistics and fisheries management reference points built from data beginning
in the 1980s, could misrepresent the objectives of natural resource management,
ecologically sustainable development or conservation, which underpin an expectation of
species’ productivity and preservation. Accordingly, there is value in further research to
determine past ecosystem states and reconstruct more representative measures for
comparison. I suggest several improvements to this research and opportunities for
continued development.
This thesis focused on changes induced by anthropogenic influences, particularly those
proceeding European colonisation, hence it has an emphasis on the historical temporal
scale. Incorporating data from other disciplines across a longer termporal scale, or
investigating natural variation alongside the time series generated here through
paleoecological investigations, could improve the baselines reconstructed, as could the use
164164
of archaeological methods to evaluate change in ‘pre-European’ environments (Lotze and
Worm, 2009, Rick and Lockwood, 2012). It might also be possible to build on and refine
the historical approach used in chapters two and three. Calculations of mean trophic level
in chapter two could be refined if alternative sources of data were identified that could
increase the accuracy of catch estimates for tuna and key species of shark. Incorporating
market data into this model could also be tested in additional regions. The conceptual
model of Neo-Europe, which is largely qualitative, could be enhanced by underpinning its
use with a quantitative model. For example, population modeling could, perhaps, be used
to hindcast past stock estimates of key fisheries species (Rosenberg et al., 2005), in
particular Maccullochella peelii peelii (Murray cod), or a suite of community- or
ecosystem-level indicators, such as estimations of biomass or indices of community
diversity, could be generated through time (Fulton et al., 2005).
Identifying and interpreting patterns of change due to resource use is a primary aim of
historical ecological research, but the introduction of species to new landscapes over
hundreds and thousands of years can be the result of and contribute to significant
ecological legacies (Willis and Birks, 2006, Essl et al., 2015). For that reason, a further
research direction could be a broadening of the current focus of much historical ecological
research to encompass other aspects of ecology and natural resource management, in
particular invasion ecology. With respect to the presence of Pinctada albina sugillata in
the upper Spencer Gulf ecosystem, chapter four investigated several aspects of this issue
over a limited spatio-temporal scale and further research is needed to continue
disentangling the negative versus positive effects of its occurrence. Specifically, this
research should consider whether a cumulative negative impact could occur, arising from
multiple stressors (Simberloff and Von Holle, 1999), and whether the presence of Pc.
albina sugillata at the scale of individual Pinna bicolor, or local or regional spatial scales,
impacts factors other than condition such as recruitment success through stress,
displacement or competition.
As nature varies so does the lens, the science, through which it is evaluated (Kuhn,
1962). But science itself might be subject to secondary shifts in our perception of the
natural world through the action of the shifting baseline syndrome (Pauly, 1995). Fisheries
management was first implemented in South Australia in 1853, for the native oyster
165165

fishery. This framework has evolved over the past 160 years and it now provides a
comprehensive, thorough and highly regarded approach to natural resource management
that is underpinned by science. It is possible, however, that the continual focus on new and
more rigorous methods for research and regulation has made us unwilling to question the
baselines that we use or unaware of the value of continually seeking to improve their
accuracy through the inclusion of new data or the use of new methods, as these become
available. A lack of objective consideration, and critique, of the principles, assumptions, or
philosophical perspectives that shape our investigations can lead to the unexamined
acceptance of paradigms (Moon and Blackman, 2014, Williams and Gordon, 2014).
Conscious critique of the baselines that we use in ecology and management would be
valuable and could be taught (Williams and Gordon, 2014), and would provide a way
forward for addressing complex and prolonged management problems, such as overfishing
(Sáenz-Arroyo and Roberts, 2008).
7.3 Conclusions
Interest in the question “what is natural?” has gained momentum over the last two decades,
due to the identification and description of the shifting baseline syndrome (Pauly, 1995,
Dayton et al., 1998) and a growing appreciation for the antiquity of the impact of human
activity (Jackson, 2001, Erlandson et al., 2009, Erlandson and Rick, 2010). There is a need
to differentiate between variation that is natural and that which is induced by human
activity (Finney et al., 2002, Pandolfi et al., 2011), but our ability to reconcile this
difference will be challenged by a future of global change. Despite comprehensive systems
for, for example, biosecurity surveillance (Meyerson and Reaser, 2002), our ability to
discern whether a species is native or alien is limited by ecological and social challenges
and many species continue to be classified as cryptogenic (Carlton, 1996, Walther et al.,
2009, Webber and Scott, 2012). In such instances, where we cannot correctly interpret
natural versus human-mediated change, we risk missing the arrival of new native species
(Carlton, 1996) or the chance to capitalize on ecosystem services provided by introduced
species in landscapes that have been impacted and have a reduced potential for
productivity (Schlaepfer et al., 2011), as well as the opportunity to appreciate and benefit
from the recovery of past losses (Roman et al., 2015).
166166
The continual focus on producing more rigorous models in ecology, and more robust
methods of measurement, can predicate the need for new data and lead to the exclusion of
past data, the “erasure of history” (Graham and Dayton, 2002). This thesis demonstrates
that we may not always need new data; sometimes we merely need new ways of using old
data. Historical ecological research advocates for a cross-disciplinary approach to the
definition of ecosystems (Szabó and Hédl, 2011, Rick and Lockwood, 2012, Schwerdtner
Máňez et al., 2014). The integration of disparate and alternative information sources of
data from fisheries in South Australia, and the use of multiple lines of evidence across the
disciplines of ecology (including fisheries science) and history, permitted the
reconstruction of several ecological baselines. The baselines generated through this
approach contrast with the current contemporary approach to fisheries management, which
only considers information from the most recent decades despite the length of time over
which fishing has occurred and the availability of archival fisheries records.
Recovering and reconstructing past ecological baselines could increase managerial and
societal expectations so that environmental degradation can be slowed, if not reversed
(Dayton et al., 1998, McClenachan et al., 2012). Higher expectations, which align with the
past, forgotten productivity of many species and habitats, could improve our capacity to
recover past losses because people may now see the need and value of conservation
(Bohnsack, 2003) or restoration, which is increasingly called for in aquatic environments
(Pitcher, 2005, Humphries and Winemiller, 2009, Fitzsimons et al., 2015). Accordingly,
we must continue to seek better measurement of past ecological states and the changes that
have occurred through human activity and work to apply more accurate targets to natural
resource management. Historical baselines can be successfully reconstructed and used to
redefine our expectations for environments, which could provide a directive for their
recovery.
167167

References
AINLEY, D. G. & BLIGHT, L. K. 2009. Ecological repercussions of historical fish
extractions from the Southern Ocean. Fish and Fisheries, 10, 13-38. DOI: 10.1111/j.1467-
2979.2008.00293.x
AIROLDI, L. & BECK, M. W. 2007. Loss, status and trends for coastal marine habitats of
Europe. Oceanography and Marine Biology: An Annual Review, 45, 345-405.
ALLEWAY, H. K. & CONNELL, S. D. 2015. Loss of an ecological baseline through the
eradication of oyster reefs from coastal ecosystems and human memory. Conservation
Biology, 29, 795-804. DOI: 10.1111/cobi.12452
BAN, N. C., KITTINGER, J. N., PANDOLFI, J. M., PRESSEY, R. L., THURSTAN, R.
H., LYBOLT, M. & HART, S. 2015. Incorporating Historical Perspectives Into Systematic
Marine Conservation Planning. In: KITTINGER, J. N., MCCLENACHAN, L., GEDAN,
K. B. & BLIGHT, L. K. (eds.) Marine Historical Ecology in Conservation: Applying the
Past to Manage the Future. University of California Press.
BARRETT, J. H., ORTON, D. C., JOHNSTONE, C., HARLAND, J., VAN NEER, W.,
ERVYNCK, A., ROBERTS, C., LOCKER, A., AMUNDSEN, C., ENGHOFF, I. B.,
HAMILTON-DYER, S., HEINRICH, D., HUFTHAMMER, A. K., JONES, A. K. G.,
JONSSON, L., MAKOWIECKI, D., POPE, P., O'CONNELL, T. C., DE ROO, T. &
RICHARDS, M. 2011. Interpreting the expansion of sea fishing in medieval Europe using
stable isotope analysis of archaeological cod bones. Journal of Archaeological Science, 38,
1516-1524. DOI: 10.1016/j.jas.2011.02.017
BAUM, J. K., MYERS, R. A., KEHLER, D. G., WORM, B., HARLEY, S. J. &
DOHERTY, P. A. 2003. Collapse and conservation of shark populations in the Northwest
Atlantic. Science, 299, 389-392. DOI: 10.1126/science.1079777
168168
BECK, M. W., BRUMBAUGH, R. D., AIROLDI, L., CARRANZA, A., COEN, L. D.,
CRAWFORD, C., DEFEO, O., EDGAR, G. J., HANCOCK, B., KAY, M. C., LENIHAN,
H. S., LUCKENBACH, M. W., TOROPOVA, C. L., ZHANG, G. & GUO, X. 2011.
Oyster reefs at risk and recommendations for conservation, restoration, and management.
BioScience, 61, 107-116. DOI: 10.1525/bio.2011.61.2.5
BJORKMAN, A. D. & VELLEND, M. 2010. Defining historical baselines for
conservation: ecological changes since European settlement on Vancouver Island, Canada.
Conservation Biology, 24, 1559-1568. DOI: 10.1111/j.1523-1739.2010.01550.x
BOHNSACK, J. A. 2003. Shifting baselines, marine reserves, and Leopold's biotic ethic.
Gulf and Caribbean Research, 14, 1-7.
BOLSTER, W. J. 2006. Opportunities in marine environmental history. Environmental
History, 567-597.
BRANCH, T. A., LOBO, A. S. & PURCELL, S. W. 2013. Opportunistic exploitation: an
overlooked pathway to extinction. Trends in Ecology and Evolution, 28, 409-413. DOI:
10.1016/j.tree.2013.03.003
BRYARS, S. & ROWLING, K. 2009. Benthic habitats of eastern Gulf St. Vincent: major
changes in benthic cover and composition following European settlement of Adelaide.
Transactions of the Royal Society of South Australia, 133, 318-338.
BUTLER, A. & KEOUGH, M. J. 1981. Distribution of Pinna bicolor Gmelin (Mollusca:
Bivaliva) in South Australia, with observations on recruitment. Transactions of the Royal
Society of South Australia, 105, 29-39.
BUTLER, A., VICENTE, N. & DE GAULEJAC, B. 1993. Ecology of the pterioid
bivalves Pinna bicolor Gmelin and Pinna nobilis L. Marine Life, 3, 37-45.
169169

CALUYA, G. 2014. Fragments for a postcolonial critique of the anthropocene. In:
FRAWLEY, J. & MCCALMAN, I. (eds.) Rethinking Invasion Ecologies from the
Environmental Humanities. New York: Routledge.
CARLTON, J. T. 1996. Biological invasions and cryptogenic species. Ecology, 77, 1653-
1655.
CARLTON, J. T. 2009. Deep Invasion Ecology and the Assembly of Communities in
Historical Time. In: RILOV, G. & CROOKS, J. A. (eds.) Biological Invasions in Marine
Ecosystems. Berlin: Springer-Verlag.
CLAVERO, M. 2014. Shifting baselines and the conservation of non-native species.
Conservation Biology, 28, 1434-1436. DOI: 10.1111/cobi.12266
CONNELL, S. D., RUSSELL, B. D., TURNER, D. J., SHEPHERD, S. A., KILDEA, T.,
MILLER, D., AIROLDI, L. & CHESHIRE, A. 2008. Recovering a lost baseline: missing
kelp forests from a metropolitan coast. Marine Ecology Progress Series, 360, 63-72. DOI:
10.3354/meps0752
CRAWFORD, S. S. & MUIR, A. M. 2008. Global introductions of salmon and trout in the
genus Oncorhynchus: 1870-2007. Reviews in Fish Biology and Fisheries, 18, 313-344.
DOI: 10.1007/s11160-007-9079-1
CREIGHTON, C., BOON, P. I., BROOKES, J. D. & SHEAVES, M. 2015. Repairing
Australia's estuaries for improved fisheries production - what benefits, at what cost?
Marine and Freshwater Research, 66, 493-507. DOI: 10.1071/MF14041
CROSBY, A. W. 1986. Ecological Imperialism. The Biological Expansion of Europe, 900
- 1900, Cambridge, UK, Cambridge University Press.
DAKIN, W. J. & KESTEVEN, G. L. 1938. The Murray Cod (Maccullochella
macquariensis (Cuv et Val.)). Some experiments on breeding ; with notes on the early
stages and a reference to the problems of depletion and restocking. Research Bulletin No.
170170

1. Sydney, New South Wales: State Fisheries, Chief Secretary's Department, New South
Wales.
DANNEVIG, H. C. 1903. Murray Cod Fisheries. Extracts of Evidence collected by the
South Australian Authorities during October, 1900, with notes. Sydney: Department of
Fisheries, New South Wales.
DAVIS, M. A., CHEW, M. K., R.J., H., LUGO, A. E., EWEL, J. J., VERMEIJ, G. J.,
BROWN, J. H., ROSENZWEIG, M. L., GARDENER, M. R., CARROLL, S. P.,
THOMPSON, K., PICKETT, S. T. A., STROMBERG, J. C., DEL TREDICI, P.,
SUDING, K. N., EHRENFELD, J. G., GRIME, J. P., MASCARO, J. & BRIGGS, J. C.
2011. Don't judge species on their origins. Nature, 474.
DAYTON, P. K., TEGNER, M. J., EDWARDS, P. B. & RISER, K. L. 1998. Sliding
baselines, ghosts, and reduced expectations in kelp forest communities. Ecological
Applications, 8, 309-322.
DISSPAIN, M., WALLIS, L. A. & GILLANDERS, B. M. 2011. Developing baseline data
to understand environmental change: a geochemical study of archaeological otoliths from
the Coorong, South Australia. Journal of Archaeological Science, 38, 1842-1857. DOI:
10.1016/j.jas.2011.03.027
DORNELAS, M., GOTELLI, N. J., MCGILL, B., SHIMADZU, H., MOYES, F.,
SIEVERS, C. & MAGURRAN, A. E. 2014. Assemblage time series reveal biodiversity
change but not systematic loss. Science, 344, 296-299. DOI: 10.1126/science.1248484
DUARTE, C. M., CONLEY, D. J., CARSTENSEN, J. & SÁNCHEZ-CAMACHO, M.
2009. Return to Neverland: shifting baselines affect eutrophication restoration targets.
Estuaries and Coasts, 32, 29-36. DOI: 10.1007/s12237-008-9111-2
DUFFIELD, T. 1903a. Report of Inspector on Conservation of Fisheries, etc.
Parliamentary Paper. Adelaide, Australia: House of Assembly.
171171

DUFFIELD, T. 1903b. Report of the Inspector of Fisheries Re Use of Drum Nets on the
River Murray. Parliamentary Paper. Adelaide, Australia: House of Assembly.
DUFFIELD, T. 1909. Report Under Fisheries Act for the Period Ended June 30th 1909.
Parliamentary paper. Adelaide, South Australia: House of Assembly.
DUFFIELD, T. 1910. Report Under Fisheries Act for Year 1909-1910. Parliamentary
Paper. Adelaide, South Australia: House of Assembly.
DUFFIELD, T. 1912. Report of Chief Inspector of Fisheries for Year Ended June 30th,
1912. Adelaide, South Australia: House of Assembly.
DULVY, N. K., SADOVY, Y. & REYNOLDS, J. D. 2003. Extinction vulnerability in
marine populations. Fish and Fisheries, 4, 25-46. DOI: 10.1046/j.1467-2979.2003.00105.x
EDGAR, G. J. & SAMSON, C. R. 2004. Catastrophic decline in mollusc diversity in
eastern Tasmania and its concurrence with shellfish fisheries. Conservation Biology, 18,
1579-1588. DOI: 10.1111/j.1523-1739.2004.00191.x
EDYVANE, K. 1999a. Coastal and marine wetlands in Gulf St. Vincent, South Australia:
understanding their loss and degradation. Wetlands Ecology and Management, 7, 83-104.
EDYVANE, K. 1999b. Conserving Marine Biodiversity in South Australia - Part 2 -
Identification of areas of high conservation value in South Australia. Adelaide, South
Australia: South Australian Research and Development Institute.
ERLANDSON, J. M. & RICK, T. C. 2010. Archaeology meets marine ecology: the
antiquity of maritime cultures and human impacts on marine fisheries and ecosystems.
Annual Review of Marine Science, 2, 231-251. DOI:
10.1146/annurev.marine.010908.163749
172172

ERLANDSON, J. M., RICK, T. C. & BRAJE, T. J. 2009. Fishing up the food web?:
12,000 years of maritime subsistence and adaptive adjustments on California's Channel
Islands. Pacific Science, 63, 711-724.
ESSL, F., DULLINGER, S., RABITSCH, W., HULME, P. E., PYŠEK, P., WILSON, J. R.
U. & RICHARDSON, D. M. 2015. Historical legacies accumulate to shape future
biodiversity in an era of rapid global change. Diversity and Distributions, 21, 1-14. DOI:
10.1111/ddi.12312
ESTÉVEZ, R. A., ANDERSON, C. B., PIZARRO, J. C. & BURGMAN, M. A. 2014.
Clarifying values, risk perceptions, and attitutdes to resolve or avoid social conflicts in
invasive species management. Conservation Biology, 29, 19-30. DOI: 10.1111/cobi.12359
FERGUSON, G. J., WARD, T., YE, Q., GEDDES, M. C. & GILLANDERS, B. M. 2013.
Impacts of drought, flow regime, and fishing on the fish assemblage in southern Australia's
largest temperate estuary. Estuaries and Coasts, 36, 737-753. DOI: 10.1007/s12237-012-
9582-z
FINNEY, B. P., GREGORY-EAVES, I., DOUGLAS, M. S. V. & SMOL, J. P. 2002.
Fisheries productivity in the northeastern Pacific Ocean over the past 2,200 years. Nature,
416, 729-733.
FISHERIES, Inspector. 1886. Diary and letter books of the Inspector of Oyster Fisheries.
Adelaide: Department of Fisheries.
FITZSIMONS, J. A., HALE, L., HANCOCK, B. & BECK, M. W. 2015. Developing a
marine conservation program in temperate Australia: determining priorities for action.
Australian Journal of Maritime and Ocean Affairs, 7, 85-93. DOI:
10.1080/18366503.2015.1014020
173173
FOWLER, A. J. & LING, J. K. 2010. Ageing studies done 50 years apart for an inshore
fish species from southern Australia - contribution towards determining current stock
status. Environmental Biology of Fishes, 89, 253-265. DOI: 10.1007/s10641-010-9659-0
FOWLER, A. J., MCGARVEY, R., STEER, M. A. & FEENSTRA, J. E. 2014. The South
Australian Marine Scalefish Fishery Status Report - Analysis of Fishery Statistics for
2013/14. Report to PIRSA Fisheries and Aquaculture. SARDI Research Report Series No.
816. Adelaide: South Australian Research and Development Institute (Aquatic Sciences).
FULTON, E. A., SMITH, A. D. M. & PUNT, A. E. 2005. Which ecological indicators can
robustly detect effects of fishing? ICES Journal of Marine Science, 62, 540-551. DOI:
10.1016/j.icesjms.2004.12.012
GORDON, D. P., BEAUMONT, J., MACDIARMID, A., ROBERTSON, D. A. &
AHYONG, S. T. 2010. Marine biodiversity of Aotearoa New Zealand. PLoS ONE, 5,
e10905. DOI: 10.1371/journal.pone.0010905
GOZLAN, R. E., BURNARD, D., ANDREOU, D. & BRITTON, J. R. 2013.
Understanding the threats posed by non-native species: public vs. conservation managers.
PLOS ONE, 8, e53200. DOI: 10.1371/journal.pone.0053200
GRAHAM, M. H. & DAYTON, P. K. 2002. On the evolution of ecological ideas:
paradigms and scientific progress. Ecology, 83, 1481-1489.
GRIFFITHS, T. 1997. Ecology and Empire: Towards an Australian history of the world.
In: GRIFFITHS, T. & ROBIN, L. (eds.) Ecology and Empire. Environmental History of
Settler Societies. Victoria, Australia: Melbourne University Press.
GUSTAFSON, R. G., WAPLES, R. S., MYERS, J. M., WEITKAMP, L. A., BRYANT, G.
J., JOHNSON, O. W. & HARD, J. J. 2007. Pacific salmon extinctions: quantifying lost and
remaining biodiversity. Conservation Biology, 21, 1009-1020. DOI: 10.1111/j.1523-
1739.2007.00693.x
174174

HEIMAN, K. W. & MICHELI, F. 2010. Non-native ecosystem engineer alters estuarine
communities. Integrative and Comparative Biology, 50. DOI: 10.1093/icb/icq036
HIGGS, E., FALK, D. A., GUERRINI, A., HALL, M., HARRIS, J. A., HOBBS, R. J.,
JACKSON, S. T., RHEMTULLA, J. M. & THROOP, W. 2014. The changing role of
history in restoration ecology. Frontiers in Ecology and the Environment, 12, 499-506.
DOI: 10.1890/110267
HOBDAY, A. J. 2011. Sliding baselines and shuffling species: implications of climate
change for marine conservation. Marine Ecology, 32, 392-403. DOI: 10.1111/j.1439-
0485.2011.00459.x
HOLM, P. 2003. History of marine animal populations: a global research program of the
Census of Marine Life. Oceanologica Acta, 25, 207-211. DOI: 10.1016/S0399-
1784(02)01200-8
HUMPHRIES, P. & WINEMILLER, K. O. 2009. Historical impacts on river fauna,
shifting baselines, and challenges for restoration. BioScience, 59, 673-684. DOI:
10.1525/bio.2009.59.8.9
HYND, J. S. 1960. An analysis of variation in Australia specimens of Pinctada albina
(Lamarck) (Lamellibranchia). Australian Journal of Marine and Freshwater Research, 11,
326-364.
JACKSON, J. B. C. 2001. What was natural in the coastal oceans? Proceedings of the
National Academy of Sciences of the United States of America, 98, 5411-5418. DOI:
10.1073ypnas.091092898
JACKSON, J. B. C., KIRBY, M. X., BERGER, W. H., BJORNDAL, K. A., BOTSFORD,
L. W., BOURQUE, B. J., BRADBURY, R. H., COOKE, R., ERLANDSON, J. A.,
HUGHES, T. P., KIDWELL, S., LANGE, C. B., LENIHAN, H. S., PANDOLFI, J. M.,
PETERSON, C. H., STENECK, R. S., TEGNER, M. J. & WARNER, R. R. 2001.
175175

Historical overfishing and the recent collapse of coastal ecosystems. Science, 293, 629-
638. DOI: 10.1126/science.1059199
JOSEPHSON, E., SMITH, D. & REEVES, R. R. 2008. Historical distribution of right
whales in the North Pacific. Fish and Fisheries, 9, 155-168. DOI: 10.1111/j.1365-
2052.2008.00275.x.
KAY, A. M. & KEOUGH, M. J. 1981. Occupation of patches in the epifaunal
communities on pier pilings and the bivalve Pinna bicolor at Edithburgh, South Australia.
Oecologia, 48, 123-130.
KELLER KOPF, R., FINLAYSON, C. M., HUMPHRIES, P., SIMS, N. C. & HLADYZ,
S. 2015. Anthropocene baselines: assessing change and managing biodiversity in human-
dominated aquatic ecosystems. BioScience, 65, 798-811. DOI: 10.1093/biosci/biv092
KELLOGG, M. L., SMYTH, A. R., LUCKENBACH, M. W., CARMICHAEL, R. H.,
BROWN, B. L., CORNWELL, J. C., PIEHLER, M. F., OWENS, M. S., DALRYMPLE,
D. J. & HIGGINS, C. B. 2014. Use of oysters to mitigate eutrophication in coastal waters.
Estuarine, Coastal and Shelf Science, 151, 156-168. DOI: 10.1016/j.ecss.2014.09.025
KEOUGH, M. J. 1984. Dynamics of the epifauna of the bivalve Pinna bicolor: interactions
among recruitment, predation and competition. Ecology, 65, 677-688.
KIRBY, M. X. 2004. Fishing down the coast: historical expansion and collapse of oyster
fisheries along continental margins. Proceedings of the National Academy of Sciences of
the United States of America, 101, 13096-13099. DOI: 10.1073"pnas.0405150101
KLAER, N. L. 2001. Steam trawl catches from south-eastern Australia from 1918 to 1957:
trends in catch rates and species composition. Marine and Freshwater Research, 52, 399-
410. DOI: 10.1071/MF00101
KUHN, T. S. 1962. The Structure of Scientific Revolutions, The University of Chicago
Press.
176176

LARSON, B. M. H. 2005. The war of roses: demilitarizing invasion biology. Frontiers in
Ecology and the Environment, 3, 495-500.
LIGHTFOOT, K. G., PANICH, L. M., SCHNEIDER, T. D. & GONZALEZ, S. L. 2013.
European colonialism and the Anthropocene: a view from the Pacific coast of North
America. Anthropocene, 4, 101-115. DOI: 10.1016/j.ancene.2013.09.002
LOTZE, H. K., LENIHAN, H. S., BOURQUE, B. J., BRADBURY, R. H., COOKE, R. G.,
KAY, C. M., KIDWELL, S. M., KIRBY, M. X., PETERSON, C. H. & JACKSON, J. B.
C. 2006. Depletion, degradation, and recovery potential of estuaries and coastal seas.
Science, 312, 1806-1809. DOI: 10.1126/science.1128035
LOTZE, H. K. & WORM, B. 2009. Historical baselines for large marine animals. Trends
in Ecology and Evolution, 24, 254-262. DOI: 10.1016/j.tree.2008.12.004
LUDWIG, D., HILBORNA, R. & WATERS, C. 1993. Uncertainty, resource exploitation,
and conservation: lessons from history. Science, 260, 17-36.
LUEBBERS, R. A. 1978. Meals and menus: a study of change in prehistoric coastal
settlements in South Australia. PhD, University of Adelaide.
MACKENZIE, B. R., OJAVEER, H. & EERO, M. 2011. Historical ecology provides new
insights for ecosystem management: eastern Baltic cod case study. Marine Policy, 35, 266-
270. DOI: 10.1016/j.marpol.2010.10.004
MADIN, E. M. P., BAN, N. C., DOUBLEDAY, Z. A. & HOLMES, T. H. 2012. Socio-
economic and management implications of range-shifting species in marine systems.
Global Environmental Change, 22, 137-146. DOI: 10.1016/j.gloenvcha.2011.10.008
MANNING, A. D., LINDENMAYER, D. B. & FISCHER, J. 2006. Stretch goals and
backcasting: approaches for overcoming barriers to large-scale ecological restoration.
Restoration Ecology, 14, 487-492.
177177

MARBÀ, N., DÍAZ-ALMELA, E. & DUARTE, C. M. 2014. Mediterranean seagrass
(Posidonia oceanica) loss between 1842 and 2009. Biological Conservation, 176, 183-190.
DOI: 10.1016/j.biocon.2014.05.024
MCCLENACHAN, L. 2009. Documenting loss of large trophy fish from the florida keys
with historical photographs. Conservation Biology, 23, 636-643. DOI: 10.1111/j.1523-
1739.2008.01152.x
MCCLENACHAN, L., FERRETTI, F. & BAUM, J. K. 2012. From archives to
conservation: why historical data are needed to set baselines for marine animals and
ecosystems. Conservation Letters, 5, 349-359. DOI: 10.1111/j.1755-263X.2012.00253.x
MCINTOSH, S. 1913. Fisheries-Report of Chief Inspector for 1912-13. Parliamentary
Papers. Adelaide, South Australia: House of Assembly.
MCINTOSH, S. 1914. Fisheries-Report of Chief Inspector for 1913-1914. Parliamentary
Papers. Adelaide, South Australia: House of Assembly.
MEYERSON, L. A. & REASER, J. K. 2002. Biosecurity: moving toward a comprehensive
approach. BioScience, 52, 593-600.
MINEUR, F., LE ROUX, A. L., MAGGS, C. A. & VERLAQUE, M. 2014. Positive
feedback loop between introductions of non-native marine species and cultivation of
oysters in Europe. Conservation Biology, 28, 1667-1676. DOI: 10.1111/cobi.12363
MOON, K. & BLACKMAN, D. 2014. A guide to understanding social science research
for natural scientists. Conservation Biology, 28, 1167-1177. DOI: 10.1111/cobi.12326
MOONEY, H. A. & CLELAND, E. E. 2001. The evolutionary impact of invasive species.
Proceedings of the National Academy of Sciences of the United States of America, 98,
5446-5451. DOI: 10.1073/pnas.091093398
178178
MOORHOUSE, F. W. 1938. Report on the Operations of the Fisheries and Game
Department for the years 1936 - 1938. Adelaide, South Australia: Legislative Council.
MOORHOUSE, F. W. 1939. Annual Report on the Operations of the Fisheries and Game
Department for the Financial Year 1938-1939. Parliamentary Papers. Adelaide, South
Australia: Legislative Council.
MOORHOUSE, F. W. 1940. Annual Report of the Fisheries and Game Department for the
Financial Year 1939-1940. Parliamentary Papers. Adelaide, South Australia: Legislative
Council.
MOORHOUSE, F. W. 1941. Annual Report of the Operations of the Fisheries & Game
Department for the Financial Year 1940-1941. Parliamentary Papers. Adelaide, South
Australia: Legislative Council.
MOORHOUSE, F. W. 1942. Annual Report on the Operations of the Fisheries and Game
Department 1941-1942. Adelaide, South Australia: Legislative Council.
MOORHOUSE, F. W. 1943. Annual Report on the Operations of the Fisheries and Game
Department for the Financial Year 1942-43. Adelaide, South Australia: Legislative
Council.
MOORHOUSE, F. W. 1945. Annual Report on the Operations of the Fisheries and Game
Department for the Financial Years 1943-1945. Adelaide, South Australia: House of
Assembly.
MOORHOUSE, F. W. 1946. Annual Report on the Operation of the Fisheries and Game
Department. Adelaide, South Australia: House of Assembly.
MOORHOUSE, F. W. 1947. Annual Report on the Operations of the Fisheries and Game
Department for the Financial Year 1946-1947. Parliamentary Papers. Adelaide, South
Australia: House of Assembly.
179179

MOORHOUSE, F. W. 1948. Annual Report on the Operations of the Fisheries and Game
Department for the Financial Year 1947-1948. Adelaide, South Australia: House of
Assembly.
MOORHOUSE, F. W. 1949. Annual Report on the Operations of the Fisheries and Game
Department for the Financial Year 1948-1949. Adelaide, South Australia: House of
Assembly.
MOORHOUSE, F. W. 1950. Annual Report on the Operations of the Fisheries and Game
Department for the Financial Year 1949-1950. Adelaide, South Australia: Legislative
Council.
MOORHOUSE, F. W. 1951. Annual Report on the Operations of the Fisheries and Game
Department for the Financial Year 1950-1951. Parliamentary Papers. Adelaide, South
Australia: House of Assembly.
MOORHOUSE, F. W. 1952. Annual Report on the Operations of the Fisheries and Game
Department for the Financial Year 1951-1952. Adelaide, South Australia: House of
Assembly.
MOORHOUSE, F. W. 1953. Annual Report on the Operations of the Fisheries and Game
Department for the Financial Year 1952-1953. Parliamentary Papers. Adelaide, South
Australia: House of Assembly.
MOORHOUSE, F. W. 1954. Annual Report on the Operations of the Fisheries and Game
Department for the Financial Year 1953-1954. Parliamentary Papers. Adelaide, South
Australia: House of Assembly.
MOORHOUSE, F. W. 1955. Annual Report on the Operations of the Fisheries and Game
Department. Adelaide, South Australia: House of Assembly.
MOORHOUSE, F. W. 1956. Annual Report on the Operations of the Fisheries and Game
Department. Parliamentary Papers. Adelaide, South Australia: House of Assembly.
180180
MOORHOUSE, F. W. 1957. Annual Report of the Operations of the Fisheries and Game
Department for the Financial Year 1956-1957. Adelaide, South Australia: House of
Assembly.
MOORHOUSE, F. W. 1958. Annual Report of the Operations of the Fisheries and Game
Department 1957-1958. Adelaide, South Australia: House of Assembly.
MOORHOUSE, F. W. 1959. Annual Report of the Operations of the Fisheries and Game
Department for the Financial Year 1958-1959. Adelaide, South Australia: Legislative
Council.
NRC 2010. Invasive Species Inquiry. Natural Resources Committee. Adelaide: Official
Hansard Report: Parliament of South Australia.
NUNES VAZ, R. A. 2014. Chapter 4. Physical characteristics of Spencer Gulf. In:
SHEPHERD, S. A., MADIGAN, S. M., GILLANDERS, B. M., MURRAY-JONES, S. &
WILTSHIRE, D. J. (eds.) Natural History of Spencer Gulf. Adelaide: Royal Society of
South Australia Inc.
OSBORNE, M. A. 2001. Acclimatizing the world: a history of paradigmatic colonial
science. Osiris, 15, 135-151.
PANDOLFI, J. M., CONNOLLY, S. R., MARSHALL, D. J. & COHEN, A. L. 2011.
Projecting coral reef futures under global warming and ocean acidification. Science, 333,
418-422. DOI: 10.1126/science.1204794
PAPWORTH, S. K., RIST, J., COAD, L. & MILNER-GULLAND, E. J. 2009. Evidence
for shifting baseline syndrome in conservation. Conservation Letters, 2, 93-100. DOI:
10.1111/j.1755-263X.2009.00049.x
PAULY, D. 1995. Anecdotes and the shifting baseline syndrome of fisheries. Trends in
Ecology and Evolution, 10, 430.
181181
PAULY, D., CHRISTENSEN, V., DALSGAARD, J., FROESE, R. & TORRES JR., F.
1998. Fishing down marine food webs. Science, 279, 860-863.
PAULY, D. & WATSON, R. 2005. Background and interpretation of the 'Marine Trophic
Index' as a measure of biodiversity. Philosophical Transactions of the Royal Society B,
360, 415-423. DOI: 10.1098/rstb.2004.1597
PINNEGAR, J. K. & ENGELHARD, G. H. 2008. The 'shifting baseline' phenomenon: a
global perspective. Reviews in Fish Biology and Fisheries, 18, 1-16. DOI:
10.1007/s11160-007-9058-6
PIPER, L. & SANDLOS, J. 2007. A broken frontier: ecological implerialism in the
Canadian north. Environmental History, 12, 759-795.
PITCHER, T. J. 2001. Fisheries managed to rebuild ecosystems? Reconstructing the past
to salvage the future. Ecological Applications, 11, 601-617.
PITCHER, T. J. 2005. Back-to-the-Future: a fresh policy initiative for fisheries and a
restoration ecology for ocean ecosystems. Philosophical Transactions of the Royal Society
B, 360, 107-121. DOI: 10.1098/rstb.2004.1575
PRESTON, C. D. 2009. The terms 'native' and 'alien' - a biogeographical perspective.
Progress in Human Geography, 33, 702-713. DOI: 10.1177/0309132508105002
RICHARDSON, D. M. & PYŠEK, P. 2008. Fifty years of invasion ecology - the legacy of
Charles Elton. Diversity and Distributions, 14, 161-168. DOI: 10.1111/j.1472-
4642.2008.00464.x
RICK, T. C. & LOCKWOOD, R. 2012. Integrating paleobiology, archeology, and history
to inform biological conservation. Conservation Biology, 27, 45-54. DOI: 10.1111/j.1523-
1739.2012.01920.x
182182

RIJNSDORP, A. D., PECK, M. A., ENGELHARD, G. H., MÖLLMAN, C. &
PINNEGAR, J. K. 2009. Resolving the effects of climate change on fish populations. ICES
Journal of Marine Science, 66, 1570-1583. DOI: 10.1093/icesjms/fsp056
ROMAN, J., DUNPHY-DALY, M. M., JOHNSTON, D. W. & READ, A. J. 2015. Lifting
baselines to address the consequences of conservation success. Trends in Ecology and
Evolution, 30, 299-302. DOI: 10.1016/j.tree.2015.04.003
ROSENBERG, A. A., BOLSTER, W. J., ALEXANDER, K. E., LEAVENWORTH, W.
B., COOPER, A. B. & MCKENZIE, M. G. 2005. The history of ocean resources:
modeling cod biomass using historical records. Frontiers in Ecology and the Environment,
3, 84-90.
RUESINK, J. L., LENIHAN, H. S., TRIMBLE, A. C., HEIMAN, K. W., MICHELI, F.,
BYERS, J. E. & KAY, M. C. 2005. Introduction of non-native oysters: ecosystem effects
and restoration implications. Annual Review of Ecology, Evolution and Systematics, 36,
643-689. DOI: 10.1146/annurev.ecolsys.36.102003.152638
RUTHERFORD, H. & MILLER, D. 2011. Spatial Distribution of the Pearl Oysters
(Pinctada albina sugillata) within the upper Spencer Gulf, South Australia. A Report to
the Northern and Yorke Natural Resources Management Board. Adelaide, South Australia:
Department of Environment and Natural Resources.
SADOVY, Y. & CHEUNG, W. L. 2003. Near extinction of a highly fecund fish: the one
that nearly got away. Fish and Fisheries, 4, 86-99. DOI: 10.1046/j.1467-
2979.2003.00104.x
SÁENZ-ARROYO, A. & ROBERTS, C. M. 2008. Consilience in fisheries science. Fish
and Fisheries, 9, 316-327. DOI: 10.1111/j.1467-2979.2008.00276.x
SÁENZ-ARROYO, A., ROBERTS, C. M., TORRE, J. & CARIÑO-OLVERA, M. 2005a.
Using fishers' anecdotes, naturalists' observations and grey literature to reassess marine
183183

species at risk: the case of the Gulf grouper in the Gulf of California, Mexico. Fish and
Fisheries, 6, 121-133.
SÁENZ-ARROYO, A., ROBERTS, C. M., TORRE, J., CARIÑO-OLVERA, M. &
ENRÍQUEZ-ANDRADE, R. R. 2005b. Rapidly shifting environmental baselines among
fishers of the Gulf of California. Proceedings of the Royal Society B., 272, 1957-1962.
DOI: 10.1098/rspb.2005.3175
SÁENZ-ARROYO, A., ROBERTS, C. M., TORRE, J., CARIÑO-OLVERA, M. &
HAWKINS, J. P. 2006. The value of evidence about past abundance: marine fauna of the
Gulf of California through the eyes of 16th to 19th century travellers. Fish and Fisheries,
7, 128-146. DOI: 10.1111/j.1467-2979.2006.00214.x
SCHLAEPFER, M. A., SAX, D. F. & OLDEN, J. D. 2011. The potential conservation
value of non-native species. Conservation Biology, 25, 428-437. DOI: 10.1111/j.1523-
1739.2010.01646.x
SCHWERDTNER MÁŇEZ, K., HOLM, P., BLIGHT, L., COLL, M., MACDIARMID,
A., OJAVEER, H., POULSEN, B. & TULL, M. 2014. The future of the Oceans Past:
towards a global marine historical research initiative. PLoS ONE, 9, e101466. DOI:
10.1371/journal.pone.0101466
SHAUGHNESSY, P. D., GOLDSWORTHY, S. D. & LIBKE, J. A. 1995. Changes in the
abundance of New Zealand fur seals, Arctocephalus forsteri, on Kangaroo Island, South
Australia. Wildlife Research, 22.
SHEPHERD, S. A. 1983. Benthic communities of upper Spencer Gulf, South Australia.
Transactions of the Royal Society of South Australia, 107, 69-85.
SHEPHERD, S. A. & SPRIGG, R. C. 1976. Substrate, sediments and subtidal ecology of
Gulf St. Vincent and Investigator Strait. In: TWIDALE, C. R., TYLER, M. J. & WEBB,
184184

B. P. (eds.) Natural History of the Adelaide Region. Adelaide: Royal Society of South
Australia.
SIMBERLOFF, D., MARTIN, J.-L., GENOVESI, P., MARIS, V., WARDLE, D. A.,
ARONSON, J., COURCHAMP, F., GALIL, B., GARCIA-BERTHOU, E., PASCAL, M.,
PYŠEK, P., SOUSA, R., TABACCHI, E. & VILÀ, M. 2013. Impacts of biological
invasions: what's what and the way forward. Trends in Ecology and Evolution, 28, 58-66.
SIMBERLOFF, D. & VON HOLLE, B. 1999. Positive interactions of nonindigenous
species: invasional meltdown? Biological Invasions, 1, 21-32. DOI:
10.1016/j.tree.2012.07.013
SOL, D., VILÀ, M. & KÜHN, I. 2008. The comparative analysis of historical alien
introductions. Biological Invasions, 10, 1119-1129. DOI: 10.1007/s10530-007-9189-7
SOUSA, R., GUTIÉRREZ, J. L. & ALDRIDGE, D. C. 2009. Non-indigenous invasive
bivalves as ecosystem engineers. Biological Invasions, 11, 2367-2385. DOI:
10.1007/s10530-009-9422-7
STRAYER, D. L., EVINER, V. T., JESCHKE, J. M. & PACE, M. L. 2006. Understanding
the long-term effects of species invasions. Trends in Ecology and Evolution, 21, 645-651.
DOI: 10.1016/j.tree.2006.07.007
SZABÓ, P. 2010. Why history matters in ecology: an interdisciplinary perspective.
Environmental Conservation, 37, 380-387. DOI: 10.1017/S0376892910000718
SZABÓ, P. & HÉDL, R. 2011. Advancing the integration of history and ecology for
conservation. Conservation Biology, 25, 680-687. DOI: 10.1111/j.1523-
1739.2011.01710.x
TANNER, J. E. 2005. Three decades of habitat change in Gulf St. Vincent, South
Australia. Transactions of the Royal Society of South Australia, 129, 65-73.
185185
THURSTAN, R. H., BUCKLEY, S. M., ORTIZ, J. C. & PANDOLFI, J. M. 2015. Setting
the record straight: assessing the reliability of restrospective accounts of change.
Conservation Letters, In Press. DOI: 10.1111/conl.12184
THURSTAN, R. H., CAMPBELL, A. B. & PANDOLFI, J. M. 2014. Nineteenth century
narratives reveal historic catch rates for Australian snapper (Pagrus auratus). Fish and
Fisheries. DOI: 10.1111/faf.12103
TURVEY, S. T., BARRETT, L. A., YUJIANG, H., LEI, Z., XINQIAO, Z., XIANYAN,
W., YADONG, H., KAIYA, Z., HART, T. & DING, W. 2009. Rapidly shifting baselines
in Yangtze fishing communities and local memory of extinct species. Conservation
Biology, 24, 778-787. DOI: 10.1111/j.1523-1739.2009.01395.x
WALLACE-CARTER, E. 1987. For They Were Fishers: The History of the Fishing
Industry in SA, Adelaide, Amphitrite Publishing House.
WALTHER, G. R., ROQUES, A., HULME, P., SYKES, M. T., PYSĚK, P., KÜHN, I.,
ZOBEL, M., BACHER, S., BOTTA-DUKÁT, Z., BUGMANN, H., CZÚCZ, B.,
DAUBER, J., HICKLER, T., JAROŠÍK, V., KENIS, M., KLOTZ, S., MINCHIN, D.,
MOORA, M., NENTWIG, W., OTT, J., PANOV, V. E., REINEKING, B., ROBINET, C.,
SEMENCHENKO, V., SOLARZ, W., THUILLER, W., VILÀ, M., VOHLAND, K. &
SETTELE, J. 2009. Alien species in a warmer world: risks and opportunities. Trends in
Ecology and Evolution, 24, 686-693. DOI: 0.1016/j.tree.2009.06.008
WATSON, R., KITCHINGMAN, A., GELCHU, A. & PAULY, D. 2004. Mapping global
fisheries: sharpening our focus. Fish and Fisheries, 5, 168-177. DOI: 10.1111/j.1467-
2979.2004.00142.x
WEBBER, B. L. & SCOTT, J. K. 2012. Rapid global change: implications for defining
natives and aliens. Global Ecology and Biogeography, 21, 305-311. DOI: 10.1111/j.1466-
8238.2011.00684.x
186186
WILLIAMS, S. J. & GORDON, H. L. 2014. Paradigms and progress in conservation
science. Conservation Biology. DOI: 10.1111/cobi.12424
WILLIS, K. J. & BIRKS, H. J. B. 2006. What is natural? The need for a long-term
perspective in biodiversity conservation. Science, 314, 1261-1265. DOI:
10.1126/science.1122667
WILTSHIRE, K., ROWLING, K. & DEVENEY, M. 2010. Introduced marine species in
South Australia: a review of records and distribution mapping. SARDI Research Report
Series No. 468. Adelaide: Marine Environment and Ecology Marine Pests Subprogram,
SARDI Aquatic Sciences.
WORM, B., HILBORN, R., BAUM, J. K., BRANCH, T. A., COLLIE, J. S., COSTELLO,
C., FOGARTY, M. J., FULTON, E. A., HUTCHINGS, J. A., JENNINGS, S., JENSEN, O.
P., LOTZE, H. K., MACE, P. M., MCCLANAHAN, T. R., MINTO, C., PALUMBI, S. R.,
PARMA, A. M., RICARD, D., ROSENBERG, A. A., WATSON, R. & ZELLER, D. 2009.
Rebuilding global fisheries. Science, 325, 578-585. DOI: 10.1126/science.1173146
WORM, B., SANDOW, M., OSCHLIES, A., LOTZE, H. K. & MYERS, R. A. 2005.
Global patterns of predator diversity in the open oceans. Science, 309, 1365-1369. DOI:
10.1126/science.1113399
WU, R. S. S. & SHIN, P. K. S. 1998. Transplant experiments on growth and mortality of
the fan mussel Pinna bicolor. Aquaculture, 163, 47-62.
187187

Appendix A
188188

Appendix B
189189

190190
191191
192192

193193
194194

Appendix C
195195

196196