Reconciliation of Population, Labor Force and Job Growth in the WashCog Planning Region
66
Reconciliation of Reconciliation of Population, Labor Population, Labor Force and Job Growth Force and Job Growth in the WashCog in the WashCog Planning Region Planning Region Cooperative Forecasting Cooperative Forecasting Group Group April 5, 2005 April 5, 2005 Maryland Department of Planning Mark D. Mark D. Goldstein Goldstein
-
Upload
evangeline-shepard -
Category
Documents
-
view
20 -
download
1
description
Reconciliation of Population, Labor Force and Job Growth in the WashCog Planning Region. Cooperative Forecasting Group April 5, 2005. Mark D. Goldstein. Maryland Department of Planning. Components of Reconciliation. Population by Age and Sex Labor Force by Age and Sex Jobs by Place of Work - PowerPoint PPT Presentation
Transcript of Reconciliation of Population, Labor Force and Job Growth in the WashCog Planning Region

Reconciliation of Population, Reconciliation of Population, Labor Force and Job Growth Labor Force and Job Growth
in the WashCog Planning in the WashCog Planning RegionRegion
Cooperative Forecasting GroupCooperative Forecasting Group
April 5, 2005April 5, 2005
Maryland Department of Planning
Mark D. GoldsteinMark D. Goldstein

Components of ReconciliationComponents of Reconciliation
Population by Age and SexPopulation by Age and Sex Labor Force by Age and SexLabor Force by Age and Sex Jobs by Place of WorkJobs by Place of Work Net CommutationNet Commutation

What Was UsedWhat Was Used
Round 7 population for WashCog JurisdictionsRound 7 population for WashCog Jurisdictions MDP population by age distributions for MD MDP population by age distributions for MD
jurisdictionsjurisdictions VEC population by age distributions for WashCog VEC population by age distributions for WashCog
VA Jurisdictions; U.S. Census Bureau for D.C.VA Jurisdictions; U.S. Census Bureau for D.C. MDP projected LFPRs by ageMDP projected LFPRs by age Rnd 7 changes in jobs applied to BEA 2000 base Rnd 7 changes in jobs applied to BEA 2000 base
for all jurisdictionsfor all jurisdictions

Population Change, Wash COG Region, Population Change, Wash COG Region, Actual and RND 7 ProjectionsActual and RND 7 Projections
633.1
855.0
560.3
329.3
0
100
200
300
400
500
600
700
800
900
Tho
usan
ds
90s 00s 10s 20s
Source: U.S. Census Bureau and local planning offices

Population Change in the WashCog Region Population Change in the WashCog Region by Major Age Cohorts, 2000 - 2030by Major Age Cohorts, 2000 - 2030
742,550
621,500
0
100,000
200,000
300,000
400,000
500,000
600,000
700,000
800,000
20-64 65+
Source: Maryland Department of Planning
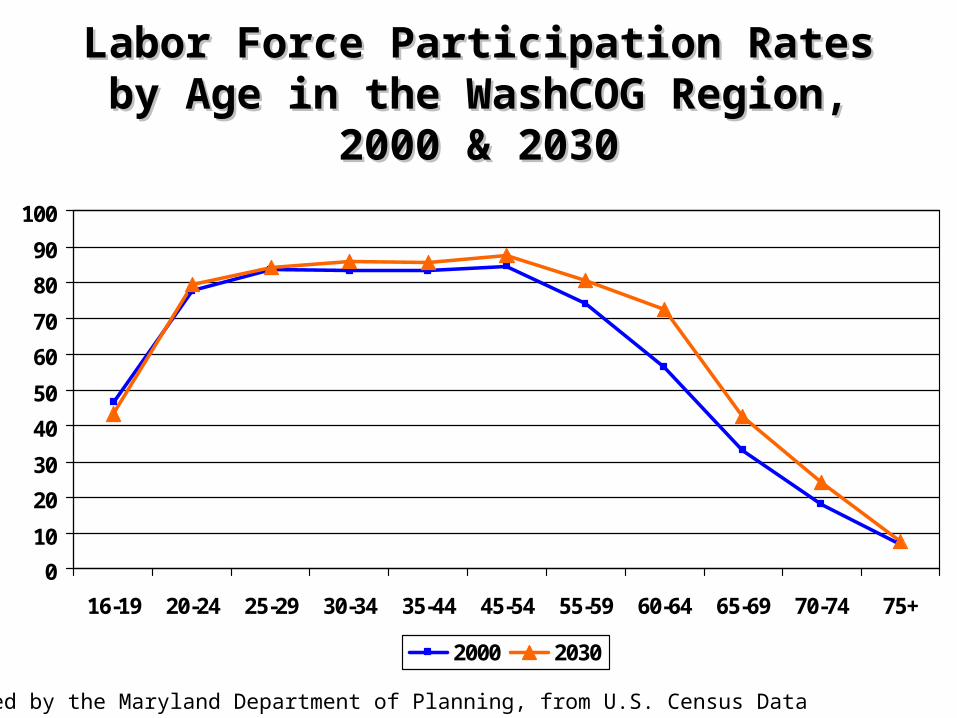
Labor Force Participation Rates by Age in Labor Force Participation Rates by Age in the WashCOG Region, 2000 & 2030the WashCOG Region, 2000 & 2030
0
10
20
30
40
50
60
70
80
90
100
16-19 20-24 25-29 30-34 35-44 45-54 55-59 60-64 65-69 70-74 75+
2000 2030
Prepared by the Maryland Department of Planning, from U.S. Census Data

Projected Percentage Point Change in L.F.P.Rs in the Projected Percentage Point Change in L.F.P.Rs in the Wash COG Region by Age, 2000 - 2030Wash COG Region by Age, 2000 - 2030
-3.3
1.60.7
2.5 2.1 2.8
6.5
16.2
9.8
6.3
0.4
-5.0
0.0
5.0
10.0
15.0
20.0
16-19 20-24 25-29 30-34 35-44 45-54 55-59 60-64 65-69 70-74 75+
Prepared by the Maryland Department of Planning

LFPRs: MDP Projections WashCog Region, LFPRs: MDP Projections WashCog Region, Population Ages 16+Population Ages 16+
71.570.6
69.9
68.2
63646566676869707172
2000 2010 2020 2030
MDP Proj
Source: Maryland Department of Planning

LFPRs: MDP Projections vs. Constant 2000 LFPRs LFPRs: MDP Projections vs. Constant 2000 LFPRs WashCog Region, Population Ages 16+WashCog Region, Population Ages 16+
70.669.9
68.269.4
67.2
64.9
71.5
63646566676869707172
2000 2010 2020 2030
MDP Proj Constant 2000
Source: Maryland Department of Planning

Projected Total Labor Force and Job Projected Total Labor Force and Job Growth in the WashCog Planning RegionGrowth in the WashCog Planning Region
239220.3
253
324.7
189
256.8
120
237.1
60
221.4
36
210.4
0
50
100
150
200
250
300
350
Tho
usan
ds
2000-2005 2005-2010 2010-2015 2015-2020 2020-2025 2025-2030
Labor Force Jobs
Source: The Maryland Department of Planning and local planning offices

Projected Population, Labor Force and Job Projected Population, Labor Force and Job Growth in the Washington Cog Region, Growth in the Washington Cog Region,
2000-20302000-20301,745,500
895,300
1,470,800
0
200,000
400,000
600,000
800,000
1,000,000
1,200,000
1,400,000
1,600,000
1,800,000
Population Labor Force Jobs
Source: The Maryland Department of Planning and local planning offices

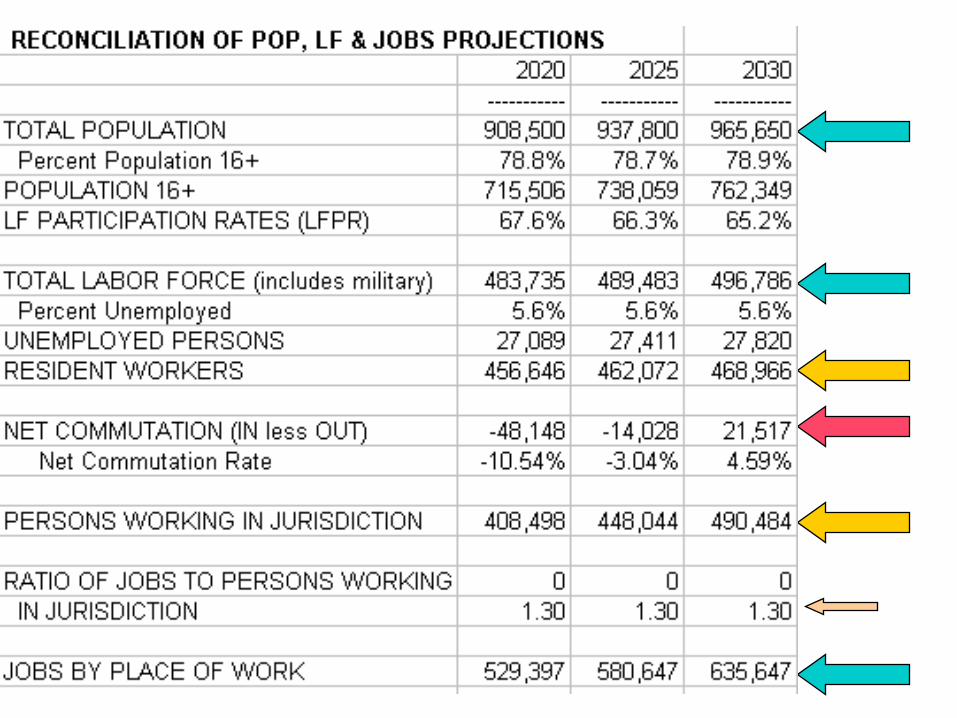
Reconciliation ProcessReconciliation Process
Given population, labor force and job Given population, labor force and job projections and a constant jobs/employed projections and a constant jobs/employed persons ratiopersons ratio
To balance: allow net commutation to fill in To balance: allow net commutation to fill in the gap between jobs and labor force totalsthe gap between jobs and labor force totals

Projected Population, Labor Force and Job Projected Population, Labor Force and Job Growth in Washington, D.C., 2000-2030Growth in Washington, D.C., 2000-2030
140,100
67,000
146,600
0
20,000
40,000
60,000
80,000
100,000
120,000
140,000
160,000
Population Labor Force Jobs
Source: The Maryland Department of Planning and local planning offices

Net Commutation for Washington, D.C.Net Commutation for Washington, D.C.
426,020
410,794
427,948
447,728
461,857 459,695462,999
475,935
360,000
400,000
440,000
480,000
1990 2000 2005 2010 2015 2020 2025 2030
Source: U.S. Census, U.S. BEA and the Maryland Department of Planning
An increase of 65,100 in net in commutation
between 2000 and 2030

Net Commutation Rate for Washington Net Commutation Rate for Washington D.C., 2000-2030 *D.C., 2000-2030 *
153.2%142.9% 139.5% 143.2%
150.1%155.3%154.2%
0%
20%
40%
60%
80%
100%
120%
140%
160%
180%
2000 2005 2010 2015 2020 2025 2030•== net commutation divided by resident workforce net commutation divided by resident workforce
Source: Maryland Department of Planning Source: Maryland Department of Planning

Projected Population, Labor Force and Job Projected Population, Labor Force and Job Growth in Arlington Co, 2000-2030Growth in Arlington Co, 2000-2030
53,450
36,700
87,400
0
10,000
20,000
30,000
40,000
50,000
60,000
70,000
80,000
90,000
Population Labor Force Jobs
Source: The Maryland Department of Planning and local planning offices

Net Commutation for Arlington Co.Net Commutation for Arlington Co.
55,033
47,600 47,491
57,132
66,099
73,12676,943
84,252
0
20,000
40,000
60,000
80,000
100,000
1990 2000 2005 2010 2015 2020 2025 2030
Source: U.S. Census, U.S. BEA and the Maryland Department of Planning
An increase of 36,650 in net in commutation
between 2000 and 2030

Net Commutation Rate for Arlington Co., Net Commutation Rate for Arlington Co., 2000-2030 *2000-2030 *
43.5%
50.3% 51.6%55.6%
47.6%
38.7%40.7%
0%
10%
20%
30%
40%
50%
60%
2000 2005 2010 2015 2020 2025 2030•== net commutation divided by resident workforce net commutation divided by resident workforce
Source: Maryland Department of Planning Source: Maryland Department of Planning

Projected Population, Labor Force and Job Projected Population, Labor Force and Job Growth in Alexandria City, 2000-2030Growth in Alexandria City, 2000-2030
30,100
20,150
49,600
0
5,000
10,000
15,000
20,000
25,000
30,000
35,000
40,000
45,000
50,000
Population Labor Force Jobs
Source: The Maryland Department of Planning and local planning offices

Net Commutation for Alexandria CityNet Commutation for Alexandria City
11,930
4,177
9,79111,599
13,185
16,40217,588
20,627
0
10,000
20,000
30,000
1990 2000 2005 2010 2015 2020 2025 2030
Source: U.S. Census, U.S. BEA and the Maryland Department of Planning
An increase of 16,450 in net in commutation
between 2000 and 2030

Net Commutation Rate for Alexandria Net Commutation Rate for Alexandria City, 2000-2030 *City, 2000-2030 *
13.2%
17.4% 18.2%
21.1%
14.4%
11.8%
5.3%
0%
5%
10%
15%
20%
25%
2000 2005 2010 2015 2020 2025 2030•== net commutation divided by resident workforce net commutation divided by resident workforce
Source: Maryland Department of Planning Source: Maryland Department of Planning
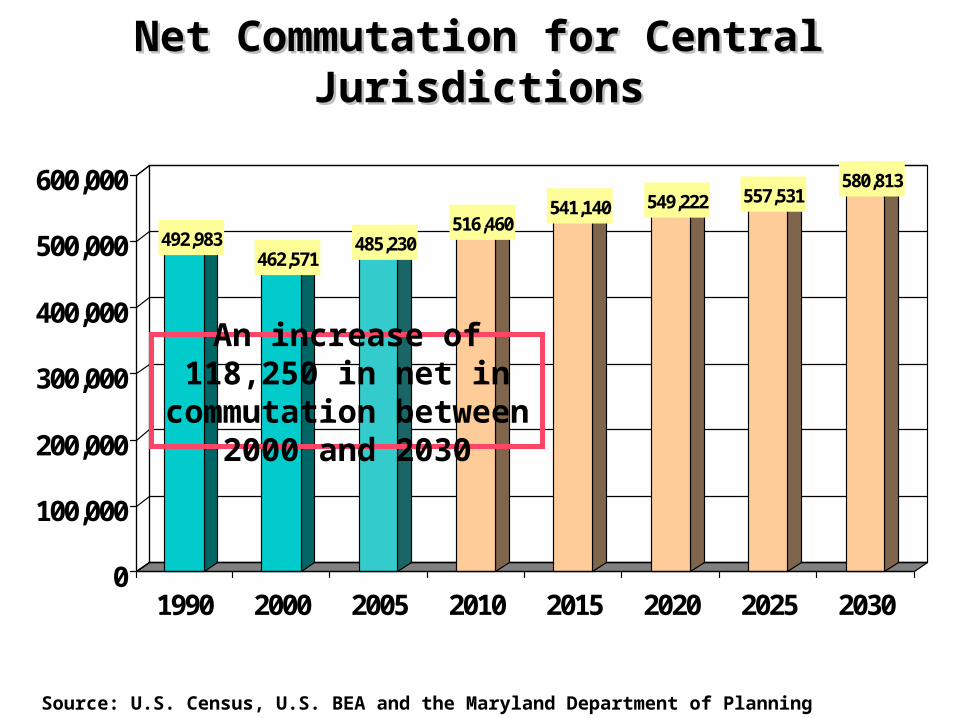
Net Commutation for Central JurisdictionsNet Commutation for Central Jurisdictions
492,983462,571
485,230516,460
541,140 549,222 557,531580,813
0
100,000
200,000
300,000
400,000
500,000
600,000
1990 2000 2005 2010 2015 2020 2025 2030
Source: U.S. Census, U.S. BEA and the Maryland Department of Planning
An increase of 118,250 in net in commutation
between 2000 and 2030

Net Commutation Rate for Central Net Commutation Rate for Central Jurisdictions Co., 2000-2030 *Jurisdictions Co., 2000-2030 *
100.9%
97.9%
96.6%
99.8%100.6%100.8%
100.2%
94%
95%
96%
97%
98%
99%
100%
101%
102%
2000 2005 2010 2015 2020 2025 2030•== net commutation divided by resident workforce net commutation divided by resident workforce
Source: Maryland Department of Planning Source: Maryland Department of Planning

Projected Population, Labor Force and Job Projected Population, Labor Force and Job Growth in Montgomery Co, 2000-2030Growth in Montgomery Co, 2000-2030
226,650
100,500
194,100
0
50,000
100,000
150,000
200,000
250,000
Population Labor Force Jobs
Source: The Maryland Department of Planning and local planning offices

Net Commutation for Montgomery Co.Net Commutation for Montgomery Co.
-28,388
-14,663
-37,542-34,456
-52,592-58,811
-53,991
-35,371
-13,402
8,111
-80,000
-40,000
0
40,000
1970 1980 1990 2000 2005 2010 2015 2020 2025 2030
Source: U.S. Census, U.S. BEA and the Maryland Department of Planning
A 42,600 turnaround in net commutation between
2000 and 2030

Net Commutation Rate for Montgomery Net Commutation Rate for Montgomery Co., 2000-2030 *Co., 2000-2030 *
-11.0%
-6.3%
-2.4%
1.5%
-9.7%-10.6%
-7.5%
-12%
-10%
-8%
-6%
-4%
-2%
0%
2%
4%
2000 2005 2010 2015 2020 2025 2030•== net commutation divided by resident workforce net commutation divided by resident workforce
Source: Maryland Department of Planning Source: Maryland Department of Planning

Projected Population, Labor Force and Job Projected Population, Labor Force and Job Growth in Prince George’s Co, 2000-2030Growth in Prince George’s Co, 2000-2030
164,150
65,700
241,700
0
50,000
100,000
150,000
200,000
250,000
Population Labor Force Jobs
Source: The Maryland Department of Planning and local planning offices

Net Commutation for Prince George’s Co.Net Commutation for Prince George’s Co.
-119,368 -123,773 -119,793
-102,117-108,762
-98,402
-79,084
-48,148
-14,028
21,517
-160,000
-120,000
-80,000
-40,000
0
40,000
1970 1980 1990 2000 2005 2010 2015 2020 2025 2030
Source: U.S. Census, U.S. BEA and the Maryland Department of Planning
A 123,650 turnaround in net commutation between
2000 and 2030

Net Commutation Rate for Prince George’s Net Commutation Rate for Prince George’s Co., 2000-2030 *Co., 2000-2030 *
-22.3%
-10.5%
-3.0%
4.6%
-17.5%
-25.4%-25.1%-30%
-25%
-20%
-15%
-10%
-5%
0%
5%
10%
2000 2005 2010 2015 2020 2025 2030•== net commutation divided by resident workforce net commutation divided by resident workforce
Source: Maryland Department of Planning Source: Maryland Department of Planning

Projected Population, Labor Force and Job Projected Population, Labor Force and Job Growth in Fairfax Co, 2000-2030*Growth in Fairfax Co, 2000-2030*
241,200
146,450
317,250
0
50,000
100,000
150,000
200,000
250,000
300,000
350,000
Population Labor Force Jobs
Source: The Maryland Department of Planning and local planning offices
* Includes City of Fairfax and City of Falls Church* Includes City of Fairfax and City of Falls Church

Net Commutation for Fairfax Co.*Net Commutation for Fairfax Co.*
-54,697
1,361 3,090
19,45324,818
47,427
74,442
93,507
-80,000
-40,000
0
40,000
80,000
120,000
1990 2000 2005 2010 2015 2020 2025 2030
Source: U.S. Census, U.S. BEA and the Maryland Department of Planning
An increase of 92,150 in net in commutation
between 2000 and 2030
* Includes City of Fairfax and City of Falls Church* Includes City of Fairfax and City of Falls Church

Net Commutation Rate for Fairfax Co., Net Commutation Rate for Fairfax Co., 2000-2030 *2000-2030 *
3.1%
6.9%
10.8%
13.5%
3.7%
0.5%0.3%0%
2%
4%
6%
8%
10%
12%
14%
16%
2000 2005 2010 2015 2020 2025 2030•== net commutation divided by resident workforce net commutation divided by resident workforce
Source: Maryland Department of Planning Source: Maryland Department of Planning

Net Commutation for Inner SuburbsNet Commutation for Inner Suburbs
-212,032
-135,212-158,264
-137,760
-108,257
-36,092
47,012
123,135
-250,000
-200,000
-150,000
-100,000
-50,000
0
50,000
100,000
150,000
1990 2000 2005 2010 2015 2020 2025 2030
Source: U.S. Census, U.S. BEA and the Maryland Department of Planning
A 258,350 turnaround in net commutation between
2000 and 2030

Net Commutation Rate for the Inner Net Commutation Rate for the Inner Suburbs, 2000-2030 *Suburbs, 2000-2030 *
-8.5%
-2.1%
2.7%
7.1%
-6.4%
-10.5%-9.5%
-12%
-10%
-8%
-6%
-4%
-2%
0%
2%
4%
6%
8%
2000 2005 2010 2015 2020 2025 2030•== net commutation divided by resident workforce net commutation divided by resident workforce
Source: Maryland Department of Planning Source: Maryland Department of Planning
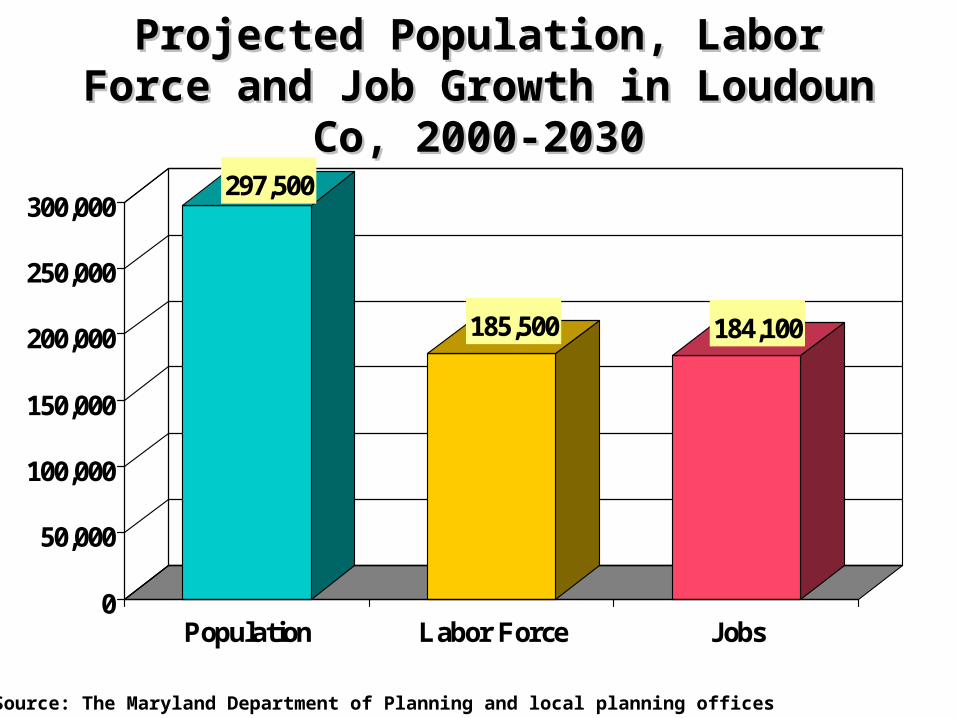
Projected Population, Labor Force and Job Projected Population, Labor Force and Job Growth in Loudoun Co, 2000-2030Growth in Loudoun Co, 2000-2030
297,500
185,500 184,100
0
50,000
100,000
150,000
200,000
250,000
300,000
Population Labor Force Jobs
Source: The Maryland Department of Planning and local planning offices

Net Commutation for Loudoun Co.Net Commutation for Loudoun Co.
-10,317 -13,076
-34,033
-48,025
-68,914
-82,676-75,107
-61,213
-90,000
-70,000
-50,000
-30,000
-10,000
10,000
30,000
1990 2000 2005 2010 2015 2020 2025 2030
Source: U.S. Census, U.S. BEA and the Maryland Department of Planning
An increase of 48,150 in net OUT commutation between 2000 and 2030

Net Commutation Rate for Loudoun Co., Net Commutation Rate for Loudoun Co., 2000-2030 *2000-2030 *
-27.1%
-32.5%
-28.0%
-22.2%
-31.4%
-24.8%
-14.0%
-35%
-30%
-25%
-20%
-15%
-10%
-5%
0%
2000 2005 2010 2015 2020 2025 2030•== net commutation divided by resident workforce net commutation divided by resident workforce
Source: Maryland Department of Planning Source: Maryland Department of Planning
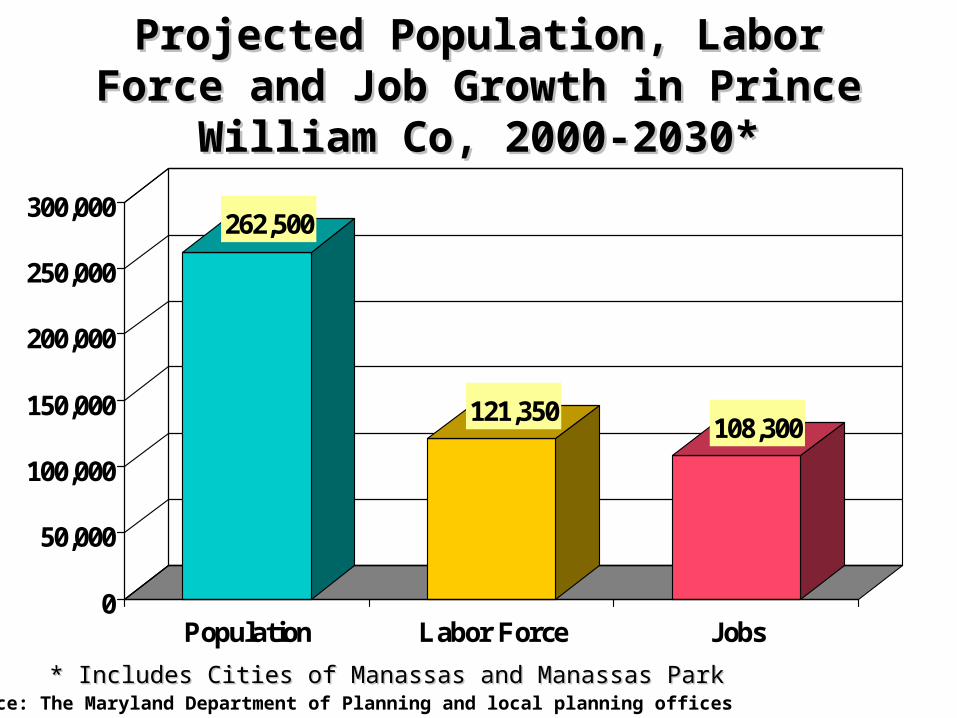
Projected Population, Labor Force and Job Projected Population, Labor Force and Job Growth in Prince William Co, 2000-2030*Growth in Prince William Co, 2000-2030*
262,500
121,350108,300
0
50,000
100,000
150,000
200,000
250,000
300,000
Population Labor Force Jobs
Source: The Maryland Department of Planning and local planning offices* Includes Cities of Manassas and Manassas Park* Includes Cities of Manassas and Manassas Park

Net Commutation for Prince William Co.*Net Commutation for Prince William Co.*
-54,030
-67,873
-94,495
-110,810-119,307 -117,246
-108,975-99,770
-130,000
-110,000
-90,000
-70,000
-50,000
-30,000
-10,000
10,000
30,000
1990 2000 2005 2010 2015 2020 2025 2030
Source: U.S. Census, U.S. BEA and the Maryland Department of Planning
An increase of 31,900 in net OUT commutation between 2000 and 2030
* Includes Cities of Manassas and Manassas Park* Includes Cities of Manassas and Manassas Park
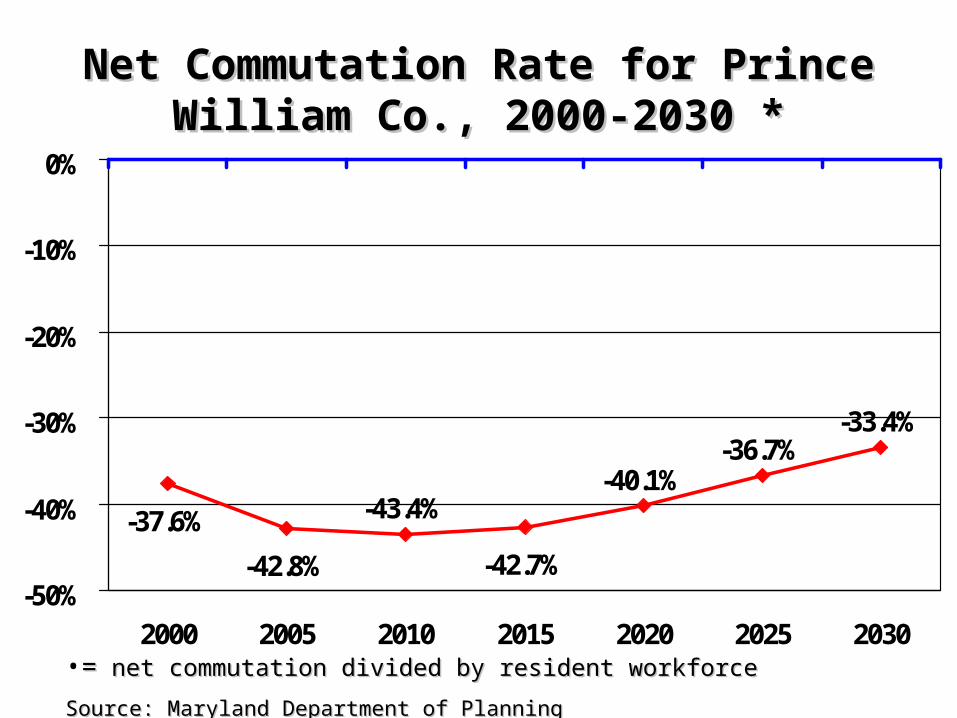
Net Commutation Rate for Prince William Net Commutation Rate for Prince William Co., 2000-2030 *Co., 2000-2030 *
-43.4%-40.1%
-36.7%-33.4%
-42.7%-42.8%
-37.6%
-50%
-40%
-30%
-20%
-10%
0%
2000 2005 2010 2015 2020 2025 2030•== net commutation divided by resident workforce net commutation divided by resident workforce
Source: Maryland Department of Planning Source: Maryland Department of Planning

Projected Population, Labor Force and Job Projected Population, Labor Force and Job Growth in Calvert Co, 2000-2030Growth in Calvert Co, 2000-2030
25,450
9,400 9,700
0
5,000
10,000
15,000
20,000
25,000
30,000
Population Labor Force Jobs
Source: The Maryland Department of Planning and local planning offices

Net Commutation for Calvert Co.Net Commutation for Calvert Co.
-2,061
-7,659
-11,795
-17,846-19,381
-21,553 -22,028 -21,320-20,138
-19,320
-30,000
-20,000
-10,000
0
1970 1980 1990 2000 2005 2010 2015 2020 2025 2030
Source: U.S. Census, U.S. BEA and the Maryland Department of Planning
A modest increase in net OUT commutation
between 2000 and 2030
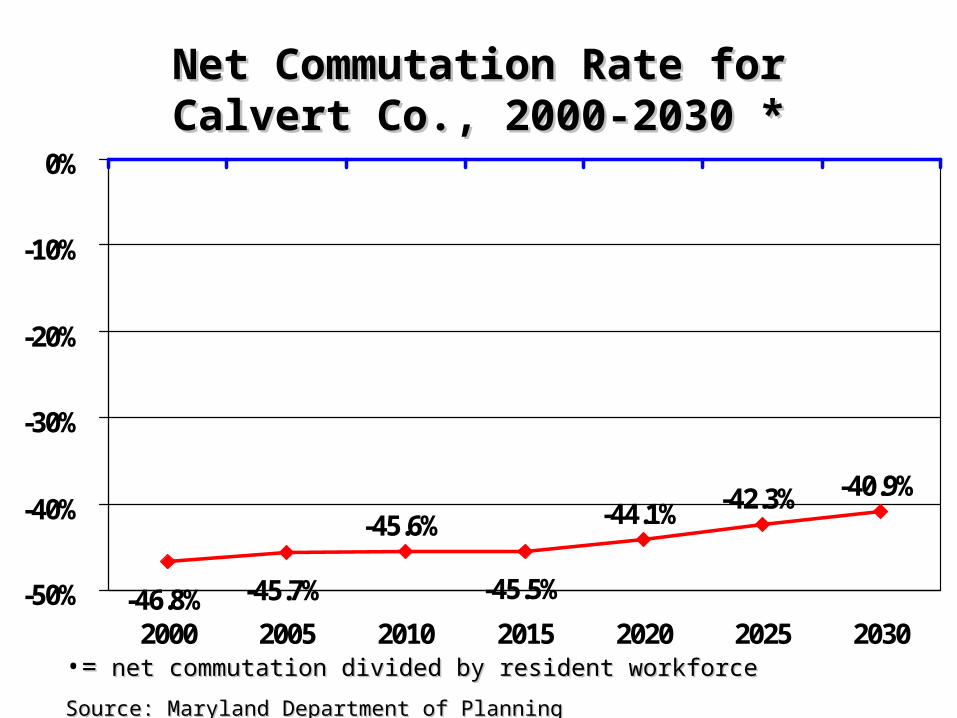
Net Commutation Rate for Calvert Co., Net Commutation Rate for Calvert Co., 2000-2030 *2000-2030 *
-45.6% -44.1% -42.3% -40.9%
-45.5%-45.7%-46.8%-50%
-40%
-30%
-20%
-10%
0%
2000 2005 2010 2015 2020 2025 2030•== net commutation divided by resident workforce net commutation divided by resident workforce
Source: Maryland Department of Planning Source: Maryland Department of Planning

Projected Population, Labor Force and Job Projected Population, Labor Force and Job Growth in Charles Co, 2000-2030Growth in Charles Co, 2000-2030
85,550
40,700
19,000
0
10,000
20,000
30,000
40,000
50,000
60,000
70,000
80,000
90,000
Population Labor Force Jobs
Source: The Maryland Department of Planning and local planning offices

Net Commutation for Charles Co.Net Commutation for Charles Co.
-3,413
-12,485
-22,244-25,478
-30,204-32,944
-38,859
-43,714-46,842
-50,624
-60,000
-50,000
-40,000
-30,000
-20,000
-10,000
0
1970 1980 1990 2000 2005 2010 2015 2020 2025 2030
Source: U.S. Census, U.S. BEA and the Maryland Department of Planning
An increase of 25,200 in net OUT commutation between 2000 and 2030

Net Commutation Rate for Charles Co., Net Commutation Rate for Charles Co., 2000-2030 *2000-2030 *
-41.2%
-46.7% -48.0% -49.5%-44.6%
-41.8%-40.5%
-60%
-50%
-40%
-30%
-20%
-10%
0%
2000 2005 2010 2015 2020 2025 2030•== net commutation divided by resident workforce net commutation divided by resident workforce
Source: Maryland Department of Planning Source: Maryland Department of Planning

Projected Population, Labor Force and Job Projected Population, Labor Force and Job Growth in Frederick Co, 2000-2030Growth in Frederick Co, 2000-2030
130,900
64,200
78,100
0
20,000
40,000
60,000
80,000
100,000
120,000
140,000
Population Labor Force Jobs
Source: The Maryland Department of Planning and local planning offices
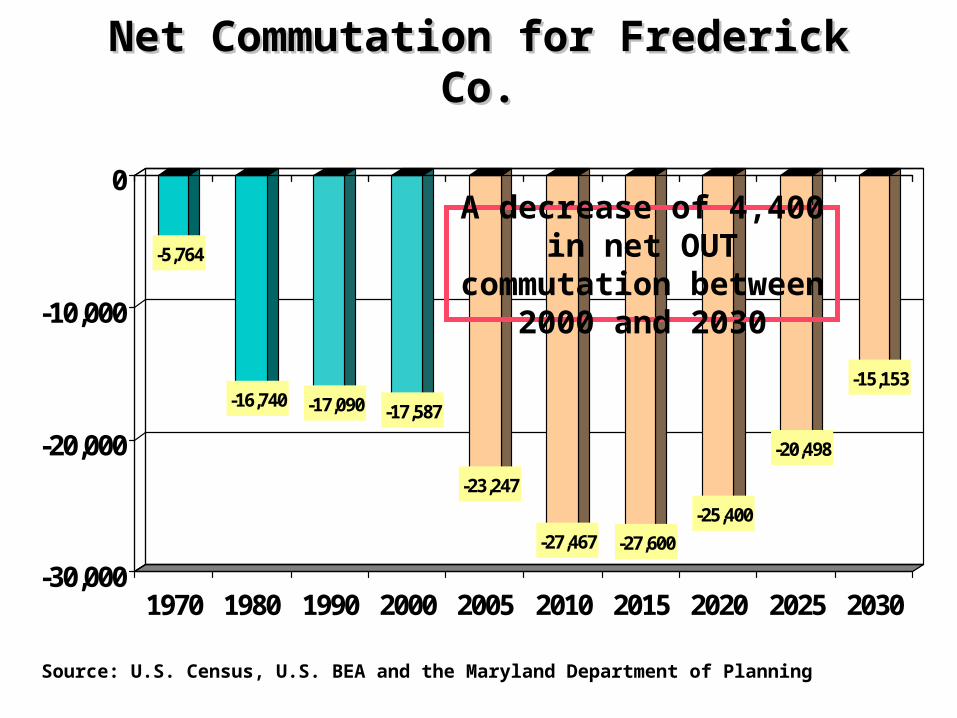
Net Commutation for Frederick Co.Net Commutation for Frederick Co.
-5,764
-16,740 -17,090 -17,587
-23,247
-27,467 -27,600
-25,400
-20,498
-15,153
-30,000
-20,000
-10,000
0
1970 1980 1990 2000 2005 2010 2015 2020 2025 2030
Source: U.S. Census, U.S. BEA and the Maryland Department of Planning
A decrease of 4,400 in net OUT commutation
between 2000 and 2030

Net Commutation Rate for Frederick Co., Net Commutation Rate for Frederick Co., 2000-2030 *2000-2030 *
-21.0%
-16.7%
-12.9%
-9.2%
-19.4%-19.8%
-16.9%
-30%
-20%
-10%
0%
2000 2005 2010 2015 2020 2025 2030•== net commutation divided by resident workforce net commutation divided by resident workforce
Source: Maryland Department of Planning Source: Maryland Department of Planning

Projected Population, Labor Force and Job Projected Population, Labor Force and Job Growth in Stafford Co, 2000-2030Growth in Stafford Co, 2000-2030
87,950
38,65034,900
0
10,000
20,000
30,000
40,000
50,000
60,000
70,000
80,000
90,000
Population Labor Force Jobs
Source: The Maryland Department of Planning and local planning offices

Net Commutation for Stafford Co.Net Commutation for Stafford Co.
-17,117-21,317
-27,030
-32,944 -33,847 -34,508-32,074
-29,312
-50,000
-30,000
-10,000
10,000
30,000
1990 2000 2005 2010 2015 2020 2025 2030
Source: U.S. Census, U.S. BEA and the Maryland Department of Planning
An increase of 8,000 in net OUT commutation
between 2000 and 2030

Net Commutation Rate for Stafford Co., Net Commutation Rate for Stafford Co., 2000-2030 *2000-2030 *
-45.6%-41.6%
-37.7%-33.8%
-43.5%-44.7%-43.4%-50%
-40%
-30%
-20%
-10%
0%
2000 2005 2010 2015 2020 2025 2030•== net commutation divided by resident workforce net commutation divided by resident workforce
Source: Maryland Department of Planning Source: Maryland Department of Planning

Net Commutation for Outer SuburbsNet Commutation for Outer Suburbs
-132,593
-163,177
-228,388
-273,744
-310,555-324,864
-303,634
-275,391 -275,391
-350,000
-300,000
-250,000
-200,000
-150,000
-100,000
-50,000
0
1990 2000 2005 2010 2015 2020 2025 2030
Source: U.S. Census, U.S. BEA and the Maryland Department of Planning
An increase of 112,200 in net OUTcommutation between 2000 and 2030

Net Commutation Rate for the Outer Net Commutation Rate for the Outer Suburbs, 2000-2030 *Suburbs, 2000-2030 *
-35.9% -35.2%-31.8%
-28.2% -28.2%
-36.3%-35.1%
-30.9%
-40%
-30%
-20%
-10%
0%
2000 2005 2010 2015 2020 2025 2030•== net commutation divided by resident workforce net commutation divided by resident workforce
Source: Maryland Department of Planning Source: Maryland Department of Planning
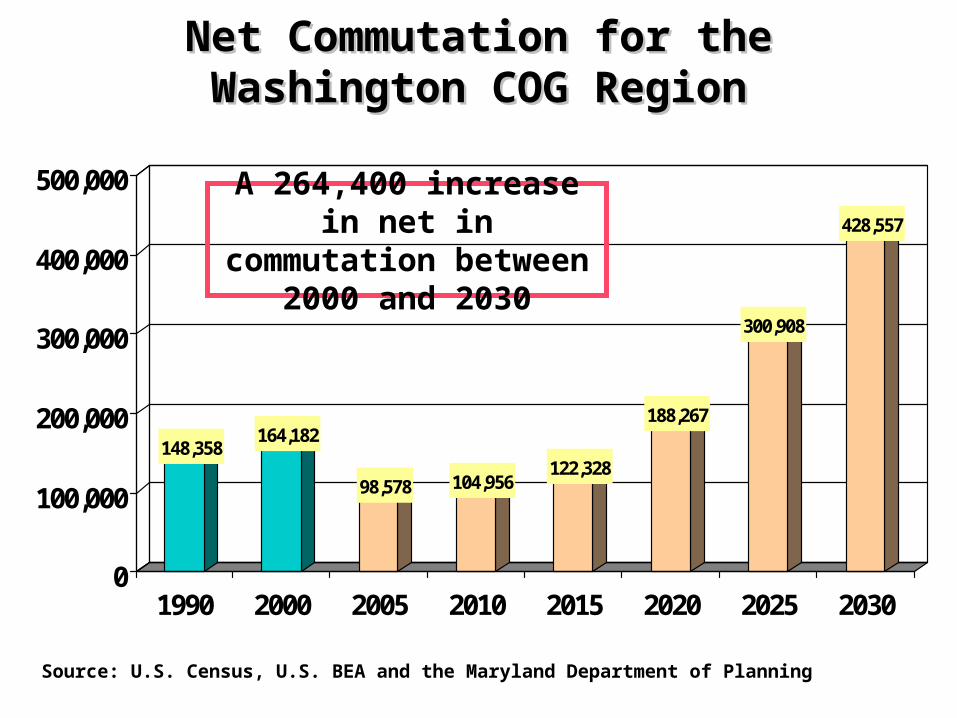
Net Commutation for the Washington Net Commutation for the Washington COG RegionCOG Region
148,358164,182
98,578 104,956122,328
188,267
300,908
428,557
0
100,000
200,000
300,000
400,000
500,000
1990 2000 2005 2010 2015 2020 2025 2030
Source: U.S. Census, U.S. BEA and the Maryland Department of Planning
A 264,400 increase in net in commutation between 2000
and 2030

Net Commutation Rate for Washington Net Commutation Rate for Washington COG Region, 2000-2030 *COG Region, 2000-2030 *
3.6%
5.9%
9.3%
13.1%
4.0%3.7%
6.8%
0%
2%
4%
6%
8%
10%
12%
14%
2000 2005 2010 2015 2020 2025 2030•== net commutation divided by resident workforce net commutation divided by resident workforce
Source: Maryland Department of Planning Source: Maryland Department of Planning
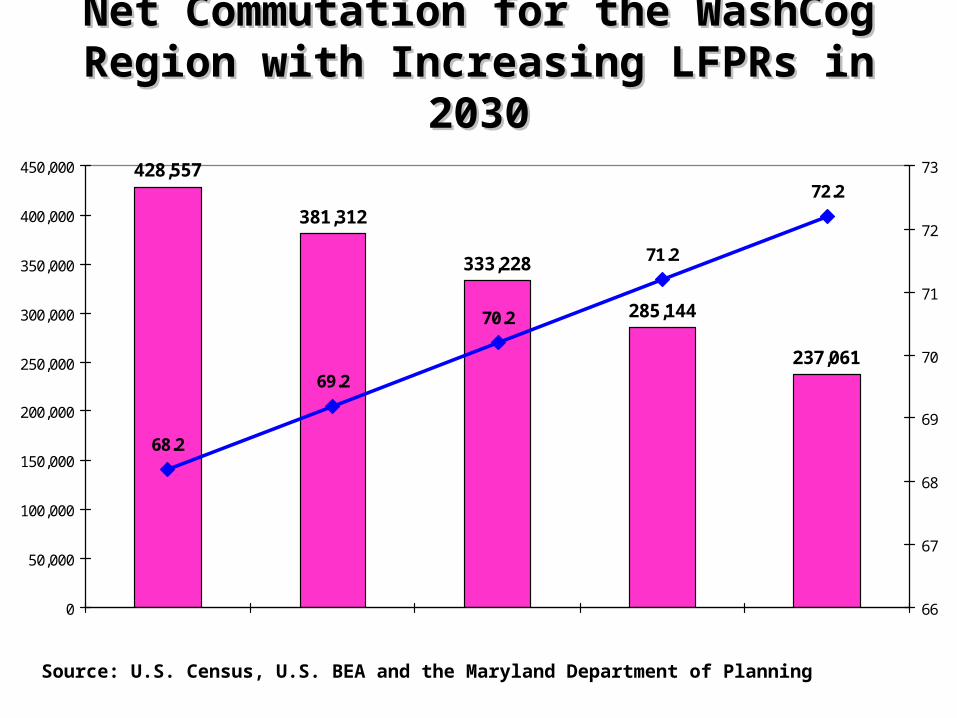
Net Commutation for the WashCog Region Net Commutation for the WashCog Region with Increasing LFPRs in 2030with Increasing LFPRs in 2030
428,557
381,312
333,228
285,144
237,061
68.2
69.2
70.2
71.2
72.2
0
50,000
100,000
150,000
200,000
250,000
300,000
350,000
400,000
450,000
66
67
68
69
70
71
72
73
Source: U.S. Census, U.S. BEA and the Maryland Department of Planning

Net Commutation and Rates for the Net Commutation and Rates for the WashCog Region in 2030WashCog Region in 2030
428,557
381,312
333,228
285,144
237,061
13.1
11.5
9.9
8.3
6.8
0
50,000
100,000
150,000
200,000
250,000
300,000
350,000
400,000
450,000
0
2
4
6
8
10
12
14
Source: U.S. Census, U.S. BEA and the Maryland Department of Planning

Percent of Net Commuters into Percent of Net Commuters into Washington COG Region in 2000Washington COG Region in 2000
48%
29%
9%
7%4%3%
Baltimore RegionVirginiaOther MarylandWest VirginiaPennsylavaniaOther
Source: The MNCPPC from U.S. Census,

Projected Population, Labor Force and Job Projected Population, Labor Force and Job Growth in the Baltimore Region, 2000-2030Growth in the Baltimore Region, 2000-2030
367,800
137,100
381,300
0
100,000
200,000
300,000
400,000
500,000
Population Labor Force Jobs
Source: The Maryland Department of Planning and local planning offices

Net Commutation for the Baltimore RegionNet Commutation for the Baltimore Region
-8,249
-40,354-49,496 -49,843 -55,806
-62,540
-43,660
1,719
61,939
107,438
-100,000
-60,000
-20,000
20,000
60,000
100,000
140,000
1970 1980 1990 2000 2005 2010 2015 2020 2025 2030
Source: U.S. Census, U.S. BEA and the Maryland Department of Planning
A 157,300 “turnaround” between 2000 and 2030

Projected Population, Labor Force and Job Projected Population, Labor Force and Job Growth in the Baltimore & Wash COG Growth in the Baltimore & Wash COG
Regions, 2000-2030Regions, 2000-2030
2,113,300
1,032,400
1,852,100
0
500,000
1,000,000
1,500,000
2,000,000
2,500,000
Population Labor Force Jobs
Source: The Maryland Department of Planning and local planning offices

Net Commutation for the Baltimore & Net Commutation for the Baltimore & Washington COG RegionsWashington COG Regions
98,862114,339
42,772 42,41678,669
189,986
362,847
535,995
0
100,000
200,000
300,000
400,000
500,000
600,000
1990 2000 2005 2010 2015 2020 2025 2030
Source: U.S. Census, U.S. BEA and the Maryland Department of Planning
A 421,650 increase in net in commutation between 2000
and 2030

Net Commutation Rate for the Baltimore Net Commutation Rate for the Baltimore & Washington COG Regions, 2000-2030 *& Washington COG Regions, 2000-2030 *
1.0%
4.1%
7.9%
11.6%
1.8%1.1%
3.1%
0%
2%
4%
6%
8%
10%
12%
14%
2000 2005 2010 2015 2020 2025 2030•== net commutation divided by resident workforce net commutation divided by resident workforce
Source: Maryland Department of Planning Source: Maryland Department of Planning
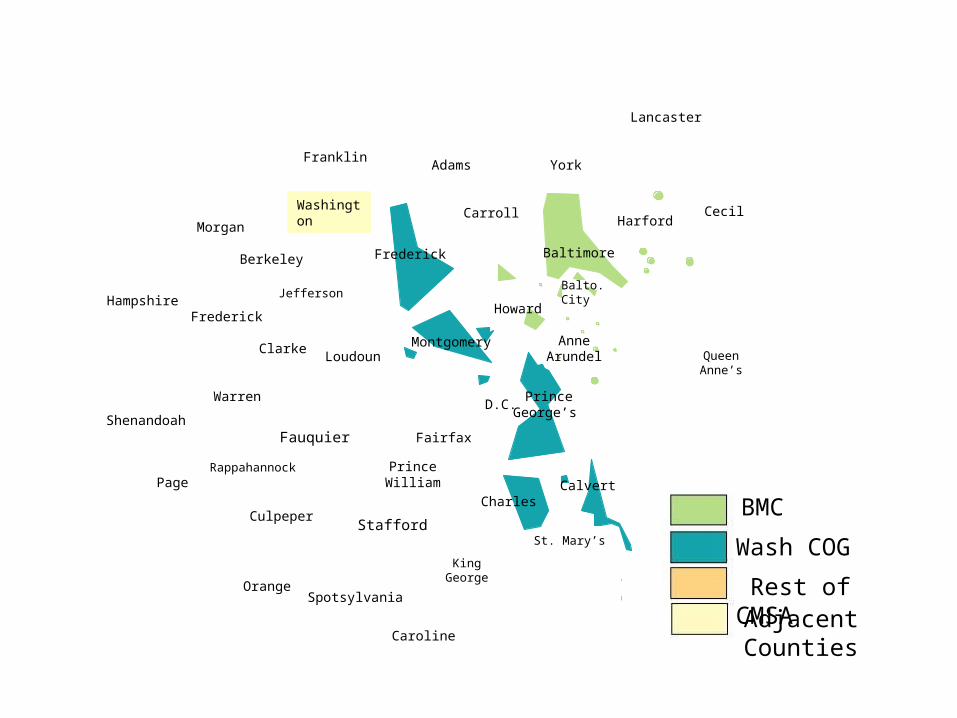
BMC
Wash COG
Rest of CMSAAdjacent Counties
Spotsylvania
Hampshire
Fauquier
Frederick
Frederick Baltimore
Harford
Balto.City
Howard
AnneArundel
Calvert
Montgomery
PrinceGeorge’s
Stafford
Charles
Loudoun
Jefferson
Clarke
Warren
Fairfax
D.C.
PrinceWilliam
Carroll CecilWashington
St. Mary’s
Caroline
KingGeorge
FranklinAdams York
Lancaster
Shenandoah
PageRappahannock
Culpeper
Orange
Morgan
Berkeley
QueenAnne’s