Recommended Best Practices for Lyophilization Validation ...
18
Research Article Recommended Best Practices for Lyophilization Validation—2021 Part I: Process Design and Modeling Feroz Jameel, 1 Alina Alexeenko, 2 Akhilesh Bhambhani, 9 Gregory Sacha, 4 Tong Zhu, 1 Serguei Tchessalov, 5 Lokesh Kumar, 6 Puneet Sharma, 6 Ehab Moussa, 1 Lavanya Iyer, 7 Rui Fang, 3 Jayasree Srinivasan, 4 Ted Tharp, 1 Joseph Azzarella, 8 Petr Kazarin, 2,10 and Mehfouz Jalal 2 Received 5 April 2021; accepted 29 June 2021; published online 18 August 2021 Abstract. This work describes lyophilization process validation and consists of two parts. Part I focuses on the process design and is described in the current paper, while part II is devoted to process qualification and continued process verification. The intent of these articles is to provide readers with recent updates on lyophilization validation in the light of community-based combined opinion on the process and reflect the industrial prospective. In this paper, the design space approach for process design is described in details, and examples from practice are provided. The approach shows the relationship between the process inputs; it is based on first principles and gives a thorough scientific understanding of process and product. The lyophilization process modeling and scale-up are also presented showing the impact of facility, equipment, and vial heat transfer coefficient. The case studies demonstrating the effect of batch sizes, fill volume, and dose strength to show the importance of modeling as well as the effect of controlled nucleation on product resistance are discussed. KEY WORDS: freeze-drying; lyophilization; process design; process optimization; controlled ice nucleation technology (CIN). INTRODUCTION Pharmaceutical product stability can often be improved by removing water or other solvents in a controlled manner through the process referred to as lyophilization or freeze- drying (1). Lyophilization serves as one of the most widely used techniques for manufacturing solid biopharmaceuticals, includ- ing but not limited to biologics (2) and vaccines (3), to achieve the intended shelf-life of the product during storage and shipping. Such improvement in stability enhancement is attrib- uted to limited hydrolytic reactions coupled with restricted mobility and/or conformational flexibility of the active molecule in presence of excipients. The pharmaceutical lyophilization involves three main steps (4): (1) freezing of the product which is initially in a solution to produce a matrix of ice and other crystallizable excipients while concentrating other solutes and the active pharmaceutical ingredient (API) within the interstitial voids; (2) primary drying, wherein ice is sublimed at low temperature, vacuum conditions; (3) secondary drying to remove unfrozen water, which may be adsorbed on the surface of the crystalline phase or is in the solute phase, carried out at temperatures well above that in the primary drying. The equipment and the processes are designed to ensure product sterility is maintained during the process of lyophilization. Furthermore, during the early stages of product development (pre-pivotal studies), there is a great emphasis on process design space as it allows for process understanding, process monitoring, and product characterization while establishing a rational line of sight to commercial manufacturing. The lyophilization process design, therefore, is a critical aspect of manufacturing process development for a lyophi- lized pharmaceutical product. A well-understood process can be scaled up and controlled, resulting in consistent quality attributes across product batches, which can be demonstrated by validation. Commercial product launch requires that the lyophilization process is successfully validated per country- specific regulatory expectations. This is especially important when there are changes to the product or process such as different dosage strengths or lyophilizer equipment. A critical understanding of the factors affecting the product quality associated with a lyophilization process can enable such changes to be carried out using fewer engineering runs. This 1 Abbvie, North Chicago, IL, USA. 2 Birck Nanotechnology Center, Purdue University, 1205 W State St., West Lafayette, IN 47907, USA. 3 Merck, Kenilworth, NJ, USA. 4 Baxter Healthcare, Bloomington, IN, USA. 5 Pfizer, Andover, MA, USA. 6 Genentech, South San Francisco, CA, USA. 7 BMS, New Brunswick, NJ, USA. 8 Fresenius Kabi, Buffalo, NY, USA. 9 Ultragenyx pharmaceutical Inc., Brisbane, CA, USA. 10 To whom correspondence should be addressed. (e–mail: [email protected]) AAPS PharmSciTech (2021) 22: 221 DOI: 10.1208/s12249-021-02086-8 1530-9932/21/0700-0001/0 # 2021 The Author(s)
Transcript of Recommended Best Practices for Lyophilization Validation ...

Research Article
Recommended Best Practices for Lyophilization Validation—2021 Part I:Process Design and Modeling
Feroz Jameel,1 Alina Alexeenko,2 Akhilesh Bhambhani,9 Gregory Sacha,4 Tong Zhu,1 Serguei Tchessalov,5
Lokesh Kumar,6 Puneet Sharma,6 Ehab Moussa,1 Lavanya Iyer,7 Rui Fang,3 Jayasree Srinivasan,4 Ted Tharp,1
Joseph Azzarella,8 Petr Kazarin,2,10 and Mehfouz Jalal2
Received 5 April 2021; accepted 29 June 2021; published online 18 August 2021
Abstract. This work describes lyophilization process validation and consists of two parts. Part I focuses onthe process design and is described in the current paper, while part II is devoted to process qualificationand continued process verification. The intent of these articles is to provide readers with recent updateson lyophilization validation in the light of community-based combined opinion on the process and reflectthe industrial prospective. In this paper, the design space approach for process design is described indetails, and examples from practice are provided. The approach shows the relationship between theprocess inputs; it is based on first principles and gives a thorough scientific understanding of process andproduct. The lyophilization process modeling and scale-up are also presented showing the impact offacility, equipment, and vial heat transfer coefficient. The case studies demonstrating the effect of batchsizes, fill volume, and dose strength to show the importance of modeling as well as the effect of controllednucleation on product resistance are discussed.
KEY WORDS: freeze-drying; lyophilization; process design; process optimization; controlled icenucleation technology (CIN).
INTRODUCTION
Pharmaceutical product stability can often be improved byremoving water or other solvents in a controlled mannerthrough the process referred to as lyophilization or freeze-drying (1). Lyophilization serves as one of the most widely usedtechniques for manufacturing solid biopharmaceuticals, includ-ing but not limited to biologics (2) and vaccines (3), to achievethe intended shelf-life of the product during storage andshipping. Such improvement in stability enhancement is attrib-uted to limited hydrolytic reactions coupled with restrictedmobility and/or conformational flexibility of the active moleculein presence of excipients. The pharmaceutical lyophilizationinvolves threemain steps (4): (1) freezing of the product which is
initially in a solution to produce a matrix of ice and othercrystallizable excipients while concentrating other solutes andthe active pharmaceutical ingredient (API) within the interstitialvoids; (2) primary drying, wherein ice is sublimed at lowtemperature, vacuum conditions; (3) secondary drying toremove unfrozen water, which may be adsorbed on the surfaceof the crystalline phase or is in the solute phase, carried out attemperatures well above that in the primary drying. Theequipment and the processes are designed to ensure productsterility is maintained during the process of lyophilization.Furthermore, during the early stages of product development(pre-pivotal studies), there is a great emphasis on process designspace as it allows for process understanding, process monitoring,and product characterization while establishing a rational line ofsight to commercial manufacturing.
The lyophilization process design, therefore, is a criticalaspect of manufacturing process development for a lyophi-lized pharmaceutical product. A well-understood process canbe scaled up and controlled, resulting in consistent qualityattributes across product batches, which can be demonstratedby validation. Commercial product launch requires that thelyophilization process is successfully validated per country-specific regulatory expectations. This is especially importantwhen there are changes to the product or process such asdifferent dosage strengths or lyophilizer equipment. A criticalunderstanding of the factors affecting the product qualityassociated with a lyophilization process can enable suchchanges to be carried out using fewer engineering runs. This
1 Abbvie, North Chicago, IL, USA.2 Birck Nanotechnology Center, Purdue University, 1205 W State St.,West Lafayette, IN 47907, USA.
3Merck, Kenilworth, NJ, USA.4 Baxter Healthcare, Bloomington, IN, USA.5 Pfizer, Andover, MA, USA.6Genentech, South San Francisco, CA, USA.7 BMS, New Brunswick, NJ, USA.8 Fresenius Kabi, Buffalo, NY, USA.9Ultragenyx pharmaceutical Inc., Brisbane, CA, USA.10 To whom correspondence should be addressed. (e–mail:
AAPS PharmSciTech (2021) 22: 221DOI: 10.1208/s12249-021-02086-8
1530-9932/21/0700-0001/0 # 2021 The Author(s)

can often be further supported by leveraging models topredict heat and mass transfer in various scenarios.
This work is the first of a two-part paper describing thecurrent state of lyophilization validation. Part I will focus onprocess design, while part II will discuss process qualificationand continued process verification. Also, both articles willprovide the authors’ perspectives on best practices forlyophilization validation as well as the use of modeling tosupport comprehensive and efficient validation. The intent ofthese articles is to provide readers with recent updates onlyophilization validation, supplementing past publications byJennings in 1986 (5) and Trappler in 2007 (6). Ever since thepublication of the latter report, several advances have beenattained in lyophilization technologies, process analyticaltechnology (PAT), computer modeling, and simulation toolsfor lyophilization process and equipment capability. Accord-ingly, an update of the best practices of the validation oflyophilization processes is needed especially given the surgein the number of therapeutic modalities in developmentpipelines that require lyophilization. This work is ourcommunity-combined opinion and industrial prospective onthe lyophilization validation process.
Part I of this best practices publication focuses on theearly lyophilization process design with an emphasis on thegeneration of a design space for a given product andequipment combination. In addition, strategies for engineer-ing runs during commercial scale-up are proposed, includingconsiderations for lyophilization cycle design and optimiza-tion, and equipment capability. The benefits of modeling asapplied to process design and scale-up are also discussed andillustrated through case studies, addressing challenges such asmultiple vial sizes, fill volumes, and dosage strengths. Productformulation and container closure systems, while related tolyophilization, are described in limited detail to the extentthat they are relevant to process design and scale-up. Newand upcoming approaches to process improvement (con-trolled ice nucleation or CIN for example), product monitor-ing, and process understanding (tunable diode laserabsorption spectroscopy or TDLAS and process analyticaltechnology or PAT for example) are also listed below with anemphasis on chemistry, manufacturing, and controls (CMC)requirements associated with manufacturing a safe, effective,and quality products.
LYOPHILIZATION PROCESS VALIDATION
Process validation is generally defined as “the collection,documentation, and evaluation of data from the earlydevelopment stages through commercial production to estab-lish a manufacturing process that is capable of consistentlydelivering a quality product” (7). In this regard, processvalidation involves a series of product and process develop-ment activities as well as manufacturing operations and isclassified into three main stages: process design, processqualification, and continued process verification. As part ofthe validation process, the drug product to be lyophilizedmust be well-defined and documented for its physical,chemical, and pharmaceutical properties, and all aspects offinished product such as moisture, sterility, dose uniformity,stability, etc. must be captured. Best practices and guidance
on process design are captured below with an emphasis onthe unit operation of freeze-drying only.
Stage 1—Process Design
The main goals of the process design stage are (1) tobuild and capture process knowledge and understanding and(2) to establish a strategy for process control (7). Thecommercial manufacturing process is defined during thisstage based on knowledge gained through developmentalexperiments and scale-up activities. The process designexperiments do not need to be performed under goodmanufacturing practice (GMP) conditions but must be basedon scientifically sound methods and should be adequatelydocumented and verified (7).
Building and capturing process knowledge and under-standing requires that all relevant data obtained during drugproduct and process development activities are collected anddocumented. At this stage, process design should consider thefunctionality and limitations of commercial manufacturingequipment due to geometry and design, scale effects, thevariability of component lots, environmental conditions, andmeasurement systems. Typically, risk analysis tools such asfailure modes and effects analysis (FMEA) or cause andeffect analysis can be used to evaluate critical variables thatcan potentially impact process performance and productquality and to guide the design of the studies required tobuild sufficient process understanding (8). It should be notedthat any change in either the equipment, facility, processitself, or even the test method should be well-evaluated toidentify and document the rationale and/or need for revali-dation or requalification. Computational models and simula-tions based on first principles can also help the design of theexperimental studies by establishing the relevant processparameter ranges to be tested and, in many cases, mayeliminate the need for a design of experiments (DoE) basedon statistical approach thereby simplifying the change man-agement process.
Based on the process knowledge and understandingobtained from laboratory and pilot-scale experiments, astrategy for process control is established to ensure theconsistency of product quality, typically by reducing and/oradjusting for input variation during manufacturing. In thelyophilization process design, a design space diagram isusually constructed to determine the safe operating zone forcritical process parameters. Process control typically involvesmonitoring critical equipment and process parameters andmay involve process analytical technologies (PAT) to enableadjusting the processing conditions to maintain criticalparameters within target limits. The control strategy, ingeneral, may include process parameters and critical qualityattributes (CQAs) related to the drug product, raw materials,and excipients, facility, operating conditions of the lyophilize,in-process checks (IPC), product specification along withtesting approach, and frequency of monitoring and control(Annex I). Closed-loop control of primary drying for processacceleration and utilization of Control Ice Nucleation (CIN),for example, has been a key area of discussion the communityto attain faster and uniform drying and minimize/eliminatefailure during scale-up process. These emerging topics and
221 Page 2 of 18 AAPS PharmSciTech (2021) 22: 221
their impact on process design would also be discussed insubsequent sections below.
Stage 2—Process Qualification
The goal of the process qualification (PQ) stage is todetermine if the process designed in stage 1 is reproduciblefor commercial manufacture and as such activities in thisstage should apply cGMP-compliant procedures. Stage 2involves qualification of the facility, equipment, and utilitiesas well as process performance qualification (PPQ). Furtherdetails on stage 2 as applied to lyophilization validation arewell documented in part II of the best practices paper. Itshould be noted, however, that the goal of process validationhere is to demonstrate that the lyophilization process leads tothe desired product characteristics and quality under all loadconditions (i.e., bracketing the minimum and maximum load)and thus a few different case studies demonstrating the powerof simple modeling to accommodate process and productchanges are highlighted in the “Power of Simple Modeling forProcess Optimization and Scale-up” section.
Stage 3—Continued Process Verification
The goal of stage 3 is to ensure that the process remainsin a state of control; that is, it consistently assures thecontinued process performance and product quality (7). Thus,as part of continued verification, process monitoring data areneeded to evaluate if the drying process performs asdocumented, including the performance of CPPs (criticalprocess parameters) within tolerance limit and thus the valueof in-process analytics (e.g., moisture, potency) and in-linePAT (e.g., TDLAS) cannot be overstated. Further details oncontinued process verification for pharmaceutical lyophiliza-tion are given in part 2 of this best practices paper.
STAGE 1—PROCESS DESIGN
Generation and Use of Design Space
Introduction to the Driving Forces and Resistances DuringPrimary Drying
The primary drying step in a lyophilization process isconducted to remove bulk ice from the frozen solution.This is accomplished by tuning shelf temperature andchamber pressure to achieve sublimation while controllingthe product temperature. The product temperature iscritical during the process, but it cannot be controlleddirectly. It should be noted that pre-lyo formulations arecharacterized by their glass transition (Tg’), eutectictemperature (Teu), and collapse temperature (Tc); theproduct temperature is monitored using a thermocouple;however, the drying operation itself is a time/temperature/pressure-driven process. It is desirable to operate at aproduct temperature as high as possible without causingfailure of the product. The failure is defined as the loss ofstructural integrity of the drying solid that often resultsfrom exceeding a critical product temperature. Thus,properties of the final formulated product such as Tc/Teu
are rendered critical and are well-characterized before
starting the drying process. Operating at a producttemperature that is as high as possible is desired becausethe driving force during primary drying is the difference inthe vapor pressure of ice between the sublimation frontand the chamber pressure. The temperature in thecondenser is typically less than approximately −60 °Cand the temperature at the sublimation front is typicallymuch higher. For example, the vapor pressure of ice at−60 °C is approximately 8.1 mTorr, and the vaporpressure of ice at the sublimation front at a temperatureof −20 °C is approximately 774.4 mTorr. The largepressure difference establishes a flow of water vapor fromthe area of high vapor pressure to the area of low vaporpressure making it advantageous to perform at the highestproduct temperature possible, creating the most efficientprocess. Resistance to heat and mass transfer in thisdynamic process renders controlling product temperatureconstant as drying progresses a challenging task. This isfurther described briefly below.
The resistance to heat transfer originates from thematerials through which the heat must travel to reach theproduct. These materials include the fluid flowing through theshelves, the stainless steel shelves, the primary packaging incontact with the shelves, and the air space between thebottom of the primary packaging and the shelves. The heattransfer coefficient of the primary container (Kv) differs fromcontainer to container and is dependent on the chamberpressure. The heat transfer coefficient represents the ratio ofthe heat flow from shelves to the product in a given vial, theouter cross-sectional area of the vial, and the temperaturedifference between the shelf surface and the product at thebottom of the vial (9). Therefore, it is important to measurethe Kv for the specific primary packaging container andchamber pressure; if the type and/or manufacturer of thepackaging changes, Kv needs to be measured again. Addi-tionally, since the free molecular heat conductivity changeswith pressure, the value of the apparent Kv also changes as afunction of pressure (9).
There is also resistance to the mass transfer of watervapor through the drying product (Rp). The water vapor musttravel from the sublimation front via the pores of the driedlayer and through the gap between the container andcontainer closure to reach the chamber. The factors thataffect Rp are the degree of supercooling before ice nucle-ation, the physical nature of the solids, the solids content, andthe location of the sublimation front within the drying solid(10). For example, solutions that undergo a high degree ofsupercooling will reach low product temperatures before icenucleation. It should be noted that product resistance can beaffected by annealing conditions and fill height (11). The icenucleation temperature affects the time available for thecrystallization of ice. Solutions that have less time for icecrystal growth will have small pores in the drying solid andthis increases the Rp. Similarly, high concentrations of solidswill also have narrow pores through which water vapormust travel. Finally, Rp is lowest at the onset of dryingand increases as the sublimation front travels to thebottom of the solid during drying. The Rp value ultimatelyused for drying solids is often based on the worst-casescenario when the sublimation front reaches the bottom ofthe drying solid.
Page 3 of 18 221AAPS PharmSciTech (2021) 22: 221

Equations for the First Principles of Heat and Mass Transfer
Data for the Kv of the vials and Rp of the product can becollected during the cycle and used in heat and mass transferequations to create a design space graph for primary drying.Kv is calculated using the following system of ordinarydifferential equations:
dqdt
¼ KvAv Ts−Tbð Þ ð1Þ
dqdt
¼ ΔHsdmdt
ð2Þ
where dqdt is the heat transfer rate in Joule·h−1, Kv is the
vial heat transfer coefficient in Joule·h−1·cm−2·°C−1, Av is theouter area of the vial in cm2, Ts is the temperature of the shelfsurface in °C, Tb is the temperature of the product in contactwith the bottom of the vial in °C, dm
dt is the mass flow rate ing·h−1, and ΔHs is the heat of sublimation of ice in Joule·g−1
(9). The equations are rearranged based on the data that areavailable to the following:
ΔHsdmdt
¼ KvAv Ts−Tbð Þ ð3Þ
Kv ¼ΔHs
dmdt
Av Ts−Tbð Þ ð4Þ
The vial heat transfer coefficient Kv changes as afunction of pressure due to the significant influence of gasconduction at the typical pressures encountered in pharma-ceutical freeze-drying (12). Kv is often characterized using atray of the specific vial or other primary packaging containerfilled approximately half full of water. The water is frozen anda vacuum is initiated as the shelf temperature is adjusted tothe shelf temperature planned for use with the product. Asshown in Eq. (4), the mass flow rate (or rate of ice loss), shelf,and product temperatures are needed to calculate Kv.
The rate of ice loss is calculated either gravimetrically orby measuring the in-process mass flow of water vapor atmultiple increments of chamber pressure using tunable diodelaser absorption spectroscopy (TDLAS) (13). For example, atray of vials can be equipped with type-T thermocouples thatare placed in vials located at the center, front, and back of thetray. TDLAS is a mass flow meter that is located in the ductthat connects the product chamber with the condenser. Theinstrument uses 2 lasers and 2 detectors to measure theconcentration and flow rate of water vapor traveling to thecondenser. The data are used in the first principles of heatand mass transfer equations to calculate Kv and Rp (14).Referring back to the tray of vials as per the example, the trayis transferred to the shelf of a lyophilizer and the vials are
frozen to −45 °C. When using TDLAS, an operational checkis performed for zero-velocity offset and then primary dryingis conducted at a shelf temperature specific to the product.The chamber pressure is set at 50 mTorr and the sublimationrate is monitored by TDLAS. The shelf is held at the setchamber pressure until a steady state is reached. Thechamber pressure setpoint is increased to 75 mTorr, 100mTorr, 125 mTorr, 150 mTorr, 175 mTorr, and 200 mTorr,allowing sublimation to reach an equilibrium at each setpoint.A representative plot of the process data is provided inFigure 1.
Approaches to obtaining information on Kv vary acrossindustry. Some approaches use a batch average value for Kv
(e.g., by using TDLAS) to develop a design space while othermethods determine the Kv based on the location of thecontainer on the shelf and between shelves by relying ongravimetric approaches. The end goal with thesecharacterizations is to understand what influences Kv and touse a consistent approach for the development of the designspace. Irrespective of the approach used, an analysis of Eq.(4) reveals that Kv can be obtained by measuring thenormalized mass flow rate and the temperature differentialbetween product (Tb) and shelf (Ts). To measure Tb, it isrecommended that the thermocouples should be placed at thebottom of the vial. As the sublimation front approaches thebottom, the measured temperature closely approaches thetemperature of the sublimation front. The vapor pressure, Pi,is then calculated by using a least-squares fit of the data. Thisyields an equation relating vapor pressure and producttemperature in the form (15):
Pi ¼ expATb
þ B� �
ð5Þ
where Tb is the temperature at the bottom of the frozenlayer and the values of constants A and B vary based on therange of temperatures being used. For temperatures between169 K and 273.16 K, which are typical for lyophilizationprocesses, A = − 6132.9 and B = 28.868 when Pi ismeasured in Pa (15,16).
Similarly, the mass flow rate can be either obtainedgravimetrically or using TDLAS as an in-line PAT tool. Itshould be noted that TDLAS is a non-invasive tool thatallows concurrent measurement of the mass flow rate duringthe freeze-dry cycle. An illustrative example of a TDLASprofile observed during a freeze-drying cycle wherein thebatch average mass flow rate is recorded as a function of timeis shown in Figure 2.
Using the mass flow data obtained from the TDLAS, theshelf temperature (Ts), and product temperature (Tb), Kv iscalculated for each chamber pressure in Joule·hr-1·cm-2·°C.A representative plot of Kv as a function of chamber pressureis provided in Figure 3.
Furthermore, as observed in Figure 2, the mass flow ratedecreases from about 5 h through 15 h before a largedecrease is observed. The sublimation rate decreases steadilyduring primary drying because the resistance to vapor flowincreases with the depth of the partially dried layer and thusRp.
221 Page 4 of 18 AAPS PharmSciTech (2021) 22: 221

The product dried cake resistance, Rp, in contrast to Kv,is assumed to be independent of shelf temperature andchamber pressure and is a function of formulation and dryingcharacteristics. Rp, given in cm2·Torr·h·g−1, is calculated usingthe following equation:
Rp ¼ Ap Pi−Pcð Þdmdt
ð6Þ
where Ap is the cross-sectional area of the product (usingthe inner diameter of the vial), Pi is the vapor pressure of iceat the sublimation front, and Pc is the chamber pressure.Using the mass flow rate, the partial pressure of ice, andpartial pressure of water vapor in the chamber, the resistanceis calculated in Torr·hr·cm2·g−1. Rp increases with time duringprimary drying with the maximum value of Rp observedtowards the end of primary drying (Figure 4). There is a sharp
increase in Rp directly after 17 h of primary drying time. Thisoccurs after all ice sublimes and resistance becomes afunction of diffusion of unfrozen water through the dryingsolid. Therefore, the point of highest resistance beforecomplete loss of ice is considered the point of the curve justbefore the rapid increase in Rp.
Rp and Kv are combined with the critical producttemperature for the product and the equipment capabilitycurve to create a design space graph. The calculations areentered into an Excel® macro (or equivalent software) tosolve the model equations and calculate the product temper-ature at different combinations of shelf temperature andchamber pressure. The calculations can also be conductediteratively to create the design space graph. In general,multiple methods can be used to complete the calculationsfor a design space as long as they are developed based on themain equations for Rp and Kv presented above (17). Somelyophilizers are equipped with software that allows for thedetermination of Rp and Kv in tandem and some equipmentdetermines Rp and Kv using manometric temperature mea-surement (18). It is worth noting that the design spacegenerated for lab-scale equipment cannot be directly appliedto commercial-scale lyophilizer since the scale-up procedureneeds to be performed with the parameters (i.e., Kv, Rp,minimum controllable pressure) adjusted accordingly (19).
Determination of Primary Drying conditions and Constructionof Design Space
The relationship between the process inputs, such aschamber pressure, shelf temperature, and the critical qualityattributes, can be described within a design space. TheInternational Council for Harmonization of Registration ofTechnical Requirements for Pharmaceuticals for Human Use(ICH) guidance Q8 (R2) defines “design space” as “themultidimensional combination and interaction of input vari-ables (e.g. material attributes) and process parameters thathave been demonstrated to assure quality.” Working withinthe design space is not considered a change. Movement out of
Fig. 1. Representative plot of process parameters during Kv measurement. TP refers to producttemperature probes numbered 1, 3, 15, and 16. CM refers to the capacitance manometer reading. PIRANIrefers to the Pirani Gauge reading
Fig. 2. Graph of mass flow rate of water vapor as a function of timefor the batch
Page 5 of 18 221AAPS PharmSciTech (2021) 22: 221

the design space is considered to be a change and wouldnormally initiate a regulatory post approval change process.Design space is proposed by the applicant and is subject toregulatory assessment and approval. The reader is remindedthat as part of continuous process verification, controls andrun charts from historical data allows for monitoring anyatypical patterns/trends in process parameters and any qualityattributes over time and thus assures the manufacturingprocess is in a state of control during the product lifecycle.
There are multiple approaches used for defining theappropriate conditions for primary drying. An empiricalapproach is to select the critical product temperatureregardless of the use of thermal characterization. The processis developed using a target product temperature, shelftemperature, and chamber pressure that provide acceptableappearance (no loss of structural integrity), residual moisture,and reconstitution characteristics as well as a stable andsterile product, at a laboratory-scale equipment. Subsequentcycles are conducted using shelf temperatures ±5 °C from theoriginal shelf temperature set point and ±20 mTorr aroundthe original chamber pressure set point to verify product andprocess robustness/tolerance. The space for the operation
would then be within the tested shelf temperatures andchamber pressures. The challenge with this approach is thatthe point of failure for the product may not be known and thebehavior of the formulation at low temperature may not beknown. Additionally, such an approach results in a non-optimized process thereby impacting the operational effi-ciency of the facility. These data are often crucial tounderstanding the physical behavior of the formulation andto developing a process with sufficient data to supportpossible future excursions during manufacturing.
A related approach is to use a statistical design ofexperiments. The experiments are designed by varying theprocessing factors such as shelf temperature and chamberpressure within a specified range. The experiments areconducted and the effect of the factors on drying time,product appearance, and stability is examined. Using statisticsin this manner does not necessarily account for the combinedinfluence of shelf temperature and chamber pressure onproduct temperature. Like in the first case, it is completelyfeasible to select different levels of shelf temperature andchamber pressure without even affecting the product temper-ature. This approach can provide a false sense of security ifthe influence of the process parameters on product temper-ature is not fully understood. Besides its lack of product andprocess understanding, this approach also suffers from non-optimal process parameters thereby reducing the operationalefficiency of the facility.
Both approaches described above, however, can result ina freeze-drying process that is completely acceptable. Thechallenge is that the studies may not be based on a thoroughscientific understanding of process and product.
An improved approach that is continually being refinedis the development of a primary drying design space. Thedesign space described below is based on first principles andincludes all relevant data needed to understand the product,process, and their interaction. The design space is createdusing data on the capability of the equipment, the Kv for thespecific vial, the Rp for the formulation, and the criticalproduct temperature (to characterize failure modes) for theproduct. The critical product temperature is defined throughthermal analysis and failure point studies during primarydrying. The two methods identify the product temperature atwhich failure occurs and the conditions at which they occur. Itis good practice to set the target product temperature a fewdegrees below the critical product temperature to ensure theproduct temperature of the vials located on the edges of theshelves does not approach the failure point.
The product resistance Rp and heat transfer coefficientKv define the governing relationship between shelf tempera-ture, chamber pressure, and product temperature needed toachieve the maximum sublimation rate without compromisingthe product quality. These data are used to calculate thecombinations of shelf temperature and chamber pressure thatensures that the product temperature remains below thedefined critical product temperature.
The use of the design space depends on knowing thevapor removal capability of the lyophilizer. The equipmentcapability is defined as the maximum sublimation rate (kg/h)for a given chamber pressure. The maximum sublimation rateat a given chamber pressure corresponds to the equipmentlimitation and in many cases represents the choked flow
Fig. 3. Representative plot of Kv as a function of chamber pressureand time
Fig. 4. Rp as a function of time with the highest resistance observedat approximately 17 h showing an Rp of 7 Torr·hr·cm2·g−1
221 Page 6 of 18 AAPS PharmSciTech (2021) 22: 221

conditions for lyophilizers designed with a spool piecebetween the product chamber and the condenser (20). Thechoked flow occurs when the flow of water vapor leaving thechamber reaches the speed of sound, and flow within thespool piece is the rate-limiting factor of water vapor reachingthe condenser (21). If a sublimation rate exceeds the vaporremoval capability of a lyophilizer at a given chamberpressure, a build-up of vapor will occur with the productchamber pressure increasing over the setpoint, reachingminimum controllable pressure Pmin. The value of Pmin as afunction of the sublimation rate is often determined using iceslabs on all shelves of the lyophilizer using the lowestpressure possible for the lyophilizer. The shelf temperatureis increased incrementally with pauses in between to deter-mine equilibrium pressure at a given sublimation rate (22,23).The challenge is that such ice slab experiments are oftendifficult to perform once the lyophilizer is used for routineproduction.
There are different methods for creating a primarydrying design space. One method is to construct a graphplotting the sublimation rate as a function of chamberpressure and temperature (Figure 5). This method providesthe conditions for the most efficient process and all of theconditions that ensure that product temperature remainsbelow the critical product temperature, but the graph doesnot include how processing time is affected by the conditions.Processing time may also increase when transferring theprocess to an aseptic environment where higher degrees ofsupercooling can be expected due to the clean environment.
A conservative approach is used to create the designspace by decreasing the critical product temperature toaccount for the warmer temperatures experienced by edgevials. This should prevent encountering product failure if theprocess conditions align with the equipment capability and/orcritical product temperature borders. It is good practice tochallenge the borders of the design space to determine thelikelihood of product failure, choked flow of the equipment,and to examine the effect of the processing conditions onprimary drying time.
The design space featured in Figure 5 does not includeprimary drying time within the graph. It depends on knowingthe effect of the process conditions on the primary dryingtime. This data can be obtained by testing the boundaries ofthe design space which also confirms the applicability of thedesign. Primary drying time may be longer when the processis transferred to full-scale manufacturing. This is typicallytested using a demonstration batch to confirm the cycle.
Fundamentally the same information presented in Fig-ure 5 can also be visualized using time within the graph(Figure 6). Incorporating time as a function of shelf temper-ature and chamber pressure allows for the prediction of totalprimary drying time for particular product within the safezone of operation. The safe zone of operation is between theborders for critical temperature and the minimum controlla-ble pressure (choke point).
Both graphs featured in Figures 5 and 6 are flexibleabout changing vial types, even from different manufacturers,if needed. A change in vial requires only the determination ofthe Kv for the vial and incorporating the data in the existinggraph if the fill volume does not drastically change as Rp is afunction of fill volume.
The first design space graph in Figure 5 assumes theworst-case Rp for the drying solid which occurs near the endof drying when ice is at the bottom of the drying solid. Thesecond design space graph simulates the process for eachprocess parameter combination. The latter approach providesthe changes in Rp with respect to the location of thesublimation front in the drying solid. Rp will be lowest atthe start of drying and increases as the sublimation frontlowers in the drying solid. This suggests that shelf tempera-ture and chamber pressure can be adjusted throughout theprocess based on the Rp. For example, more aggressiveconditions can be used at the beginning of the process whenRp is low. Also, different processing conditions within thedesign space can result in different Rp values for someformulations. Particularly, Rp can be affected by only freezingconditions during a lyo process (24). Primary drying shouldnot have any impact on Rp unless there is any loss in structuredue to collapse or meltback. The change in Rp within the safezone suggests that it is good practice to test the boundaries ofthe design space to confirm that the physical properties of thesolids are acceptable.
Engineering/Development Runs at Commercial Scale
It is a standard practice within the industry to performcommercial-scale runs testing the lyophilization processbefore moving forward with process performance qualifica-tion (PPQ) runs. At scale, runs are not a cGMP requirementbut are completed to minimize risk before proceeding toPPQ. Depending on the company, these runs may be referredto as engineering, development, or demonstration runs, but inall cases, the lyophilization process, along with other unitoperations in the formulation, filling, and inspection, is beingtested to identify any unexpected changes that might occurduring the transfer from small-scale runs or in tech transfer toa new site.
Fig. 5. Example of a primary drying design space graph showingsublimation rates as a function of pressure and temperature. Greenarea is the safe zone of operation. The red traces are the calculatedproduct temperature isotherms. The solid red trace is the experimen-tal critical product temperature. The black traces are the calculatedshelf temperature isotherms. The equipment capability is representedby the solid blue line
Page 7 of 18 221AAPS PharmSciTech (2021) 22: 221

Several different product filling strategies have beenembraced by the industry for the completion of engineeringruns. If possible, a surrogate or a placebo, formulationswithout the API, is used during development to minimizeAPI requirements. A placebo is the drug product formulationwithout any API, typically excipients and water for injection.The removal of the API can lead to different drying behaviorfor the remaining solution, and therefore may not be fullyrepresentative of the drug product formulation. In a surro-gate, the API is replaced with a material substitute, such ashuman serum albumin or Dextran-60 for a therapeuticprotein, in order to provide similar solution concentrationsand thermal behavior for the lyophilization process. Anotheroption to minimize API requirements while collecting data onthe active drug product is to first fill the lyophilizer with asurrogate and then replace surrogate vials with active vials atall locations where analytical testing would be performed.The number of engineering runs to be completed can varybased upon knowledge of the product formulation, lyophili-zation process, and equipment being used. Among theLyoHub (Advanced Lyophilization Technology Hub, (25))member companies, however, a single successful engineeringrun is the goal of technical transfers for a given dose. If thereare multiple-dose presentations for the same formulation, theengineering run strategy may be further minimized using abracketing approach to reduce the amount of formulateddrug product used within the studies.
The engineering run can provide a wealth of informationas part of the process evaluation and should be completed ina manner as close to the PPQ runs as possible while allowingappropriate time for analysis of data generated during therun. Goals from the run should be to confirm that producttemperature performance is within the acceptable limit, toperform a visual inspection of vials by location, and to
determine the total primary drying time at scale. A samplingof the run generally follows the five locations per shelf, whichare the front, back, center, left, and right sides of thelyophilizer, with a focus on appearance, residual moisture,reconstitution time, and any other product-specific attributesof interest. Visual inspection of the lot is also completed toassure uniform cake appearance for the batch. Based uponthe evaluation of the engineering run data, a decision to moveforward with the PPQ batches for a product is made.
POWER OF SIMPLE MODELING FOR PROCESSOPTIMIZATION AND SCALE-UP
There are several benefits of applying modeling de-scribed in the “Generation and Use of Design Space” sectionto the lyophilization process that helps both industry and thepatient besides gaining a better understanding of the process.By applying and implementing the modeling, one can reducethe number of experiments during the development thatwould free up resources and material requirements and inlimited cases may also result in a reduction in the cost ofgoods manufactured (COGM). By reducing the number ofexperiments, the development time can be reduced enablingfaster availability of medicine to patients with life-threateningdiseases. Additionally, modeling helps to better understandand design a robust process enabling the availability of a safeand high-quality drug to the patients.
The lyophilization processes can be modeled based onthe fundamental understanding of heat and mass transfergiven in the “Generation and Use of Design Space” section.At steady state, when heat input is equal to output, the heattransfer rate due to shelf heating and sublimation cooling ratecan be equated and the unknowns can be determined usingthe following equation (26):
Fig. 6. Graph for primary drying design space that incorporates time as a function ofchamber pressure and shelf temperature. The area under the critical temperature borderand minimum controllable pressure border shows the safe zone of operation where thedrying time increases with higher shelf temperature
221 Page 8 of 18 AAPS PharmSciTech (2021) 22: 221

Tpr;dmdt
; tPriDry
� �
¼ f Tsh;Pch;Kv Pchð Þ;Av; lpr;0;Rp; csolid� � ð7Þ
where lpr;0 ¼ Vfill
Ap
Development and Optimization of a Lyophilization Process
Historically, a lyophilization process is developed by trialand error methods where, for a given collapse temperature ofa formulation, experiments are performed with various shelftemperature and chamber pressure values until the outputparameters product temperature and product quality at theend of freezing and drying phases match with the targetproduct temperature and product quality attributes. Thisrequires several experiments to be run and consumes a lotof resources, time, and material. However, with the use/application of modeling, one can use key inputs to estimateoutput process parameters as outlined in Figure 7. Theseparameters must be obtained on a specific lyophilizer for thetarget product so that the model based on these inputs arerepresentative of the actual lyophilization process at thatspecific lyophilizer.
The quasi-steady one dimensional (1D) heat and masstransfer model described in the “Generation and Use ofDesign Space” section is usually referred to as the “Lyo-Calculator” and is illustrated below in the top portion ofFigure 8. There are two important ways of using the steady-state mathematical models or two models as illustrated inFigure 8(d–f):
1. If one knows Kv and Rp, one can calculate theunknown outputs (forward use)—the standard use ofa Lyo-calculator (9).
2. If one does not know Rp (or Kv ) to begin with but hasthe experimental cycle output, then one can analyzethe unknown Rp (or Kv ) by fitting (backward use)(19,27).
For a given collapse temperature, the predicted criticaloutput process parameters can be confirmed with a minimalnumber of experiments as illustrated in Figure 8.
Scale-up and Transfer
Another opportunity to use/apply modeling is duringscale-up and tech transfer to manufacturing between lyoph-ilizers. In the subsequent discussions, two lab-scale lyophi-lizers, named as LabLyo1 and LabLyo2, and two pilot-scalelyophilizers, PilotLyo1 and PilotLyo2, will be used asexamples.
During scale-up and tech transfer to manufacturing,differences in heat transfer (Kv) and mass transfer (includingchoke flow limit) and product resistance (Rp) arising fromdifferences in scale, design, and geometry of the freeze-dryer,product, and environment (Tn, class 100/particle-free envi-ronment) of the dryer need to be considered.
Class 100/Particle-Free Environment (Tn)
A key factor that needs to be considered during transferto manufacturing is the environment. The particle-freeenvironment in manufacturing affects the nucleation temper-ature which affects the morphology of ice. This in turn affectsthe product resistance (Rp), affecting the drying rate or masstransfer rate. Product resistance for an amorphous formula-tion product as a function of nucleation temperature wasdetermined and plotted as illustrated below in Figure 9 ausing the quasi steady-state model as described above. TheRp of the given formulation for a manufacturing environmentwhere the nucleation temperature is typically approximately−23 °C was estimated from the curve. The specific surfacearea obtained from Brunauer-Emmett-Teller (BET) analysiscan be further measured for each nucleation temperaturecase, which was found to linearly correlate with Rp byRambhatla et al (28). As per Figure 9 b, it was found thatfor a given product run on different lyophilizers in differentenvironments, the lower environment particle level in GMPconditions leads to lower ice nucleation temperature andtherefore higher Rp.
Equipment capability (minimum controllable chamberpressure as a function of sublimation rate)
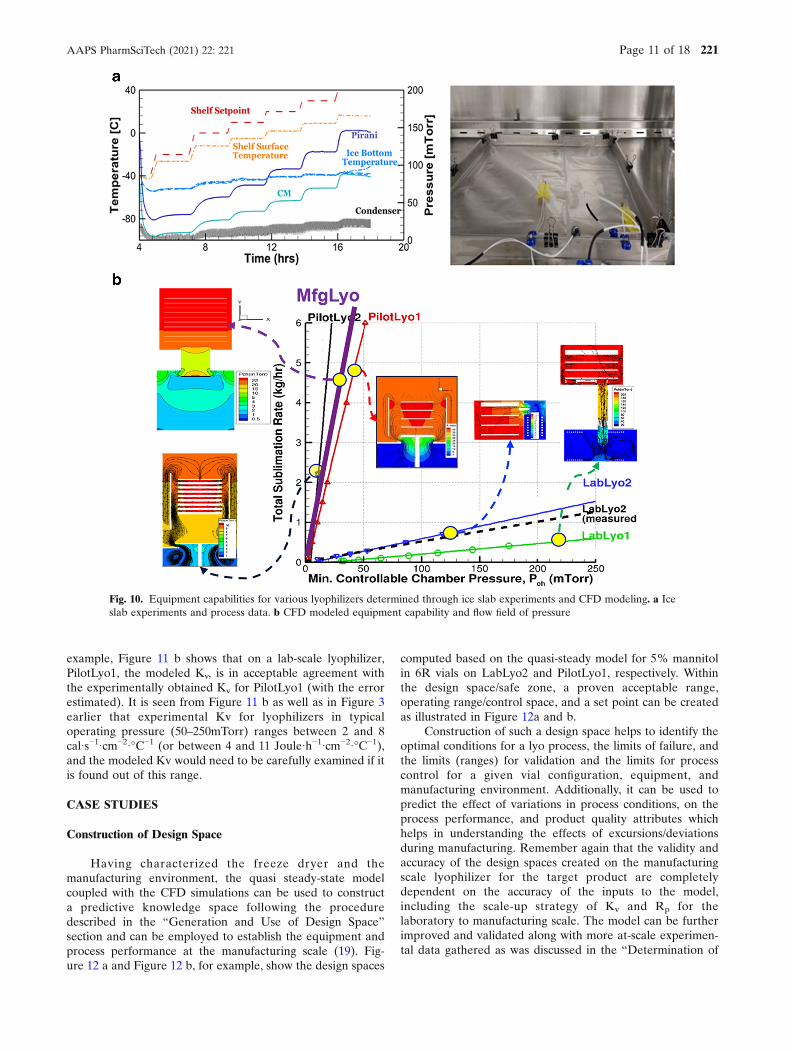
Typically, as part of the characterization of the freezedryer, the equipment capability—the safety boundary withoutlosing control of the chamber pressure—is assessed/determined through ice slab experiments (19) shown inFigure 10 a, which involve several experiments where theshelf temperature and chamber pressure are raised incremen-tally. The sublimation rate and the stable chamber pressureachieved are recorded and are plotted to determine theminimum controllable chamber pressure by the equipment ata given sublimation rate.
This is a cumbersome exercise and consumes significanttime on the manufacturing line. Using computational fluiddynamics (CFD), the equipment capability can be easilyestimated/predicted through simulations (19, 20) as illustratedbelow in Figure 10 b. Through CFD modeling, one also gainsa deeper understanding of the pressure distribution and vaporFig. 7. Lyophilization model inputs and outputs
Page 9 of 18 221AAPS PharmSciTech (2021) 22: 221

flow speed in the entire equipment which helps in under-standing process non-uniformity, condenser overloading, etc.
Heat Transfer Coefficient (Kv)
A sublimation test with water runs is performed todetermine the vial heat transfer coefficient (Kv) for a givendryer. Since Kv is dependent on vial configuration and
chamber pressure, every time either is changed, during thelife cycle management of the product, sublimation tests needto be performed. Changes in Kv due to changes in vialconfiguration and chamber pressure can be relatively easy topredict with the use of an ab initio heat transfer model that,as illustrated in Figure 11 a, considers the conductive,radiative, and solid contact heat transfer contributions insteadof running experiments on a manufacturing freeze dryer. For
Fig. 8. Heat and mass transfer modeling equations and the application in lyophilization process prediction/validation.Developed ab initio prediction models for the heat transfer coefficient (Kv). The overall Kv is computed ab initio as the sumof the solid contact, gas conduction, and radiative heat transfer components
Fig. 9. Effect of nucleation temperature and environment differences (particle-free/class 100 area) on mass transferdifferences (Rp). a Effect of nucleation temperature on Rp. b Effect of environment on Rp
221 Page 10 of 18 AAPS PharmSciTech (2021) 22: 221
example, Figure 11 b shows that on a lab-scale lyophilizer,PilotLyo1, the modeled Kv, is in acceptable agreement withthe experimentally obtained Kv for PilotLyo1 (with the errorestimated). It is seen from Figure 11 b as well as in Figure 3earlier that experimental Kv for lyophilizers in typicaloperating pressure (50–250mTorr) ranges between 2 and 8cal·s−1·cm−2·°C−1 (or between 4 and 11 Joule·h−1·cm−2·°C−1),and the modeled Kv would need to be carefully examined if itis found out of this range.
CASE STUDIES
Construction of Design Space
Having characterized the freeze dryer and themanufacturing environment, the quasi steady-state modelcoupled with the CFD simulations can be used to constructa predictive knowledge space following the proceduredescribed in the “Generation and Use of Design Space”section and can be employed to establish the equipment andprocess performance at the manufacturing scale (19). Fig-ure 12 a and Figure 12 b, for example, show the design spaces
computed based on the quasi-steady model for 5% mannitolin 6R vials on LabLyo2 and PilotLyo1, respectively. Withinthe design space/safe zone, a proven acceptable range,operating range/control space, and a set point can be createdas illustrated in Figure 12a and b.
Construction of such a design space helps to identify theoptimal conditions for a lyo process, the limits of failure, andthe limits (ranges) for validation and the limits for processcontrol for a given vial configuration, equipment, andmanufacturing environment. Additionally, it can be used topredict the effect of variations in process conditions, on theprocess performance, and product quality attributes whichhelps in understanding the effects of excursions/deviationsduring manufacturing. Remember again that the validity andaccuracy of the design spaces created on the manufacturingscale lyophilizer for the target product are completelydependent on the accuracy of the inputs to the model,including the scale-up strategy of Kv and Rp for thelaboratory to manufacturing scale. The model can be furtherimproved and validated along with more at-scale experimen-tal data gathered as was discussed in the “Determination of
Fig. 10. Equipment capabilities for various lyophilizers determined through ice slab experiments and CFD modeling. a Iceslab experiments and process data. b CFD modeled equipment capability and flow field of pressure
Page 11 of 18 221AAPS PharmSciTech (2021) 22: 221

Primary Drying conditions and Construction of DesignSpace” section.
Effect of Batch Sizes (Product Load), Fill Volume, and DoseStrength
Product load or batch size influences the processperformance, especially the primary drying time and heattransfer coefficient, and regulatory agencies expect revalida-tion of the process when the batch size is changed from withinthe validated range. For example, partial load drying processwere performed on LabLyo1 with 100%, 10%, 5%, and 2%loads, and the associated heat transfer coefficient, Kv, changesacross load sizes were studied using first principles heat
transfer model mentioned in earlier discussions. In Figure 13d, the modeled change in batch averaged Kv was comparedwith those experimentally extracted (29) (using quasi-steadystate model as shown in Figure 13a–c) and reached goodagreement (5~7% difference).
Similarly, regulatory agencies expect revalidation of theprocess when the fill volume and/or dose strength is changedas they influence the lyophilization process performance and,consequently, the product quality attributes. Mathematicalmodels based on quasi-steady-state, as described above, canbe used to evaluate and predict the impact of changes in thevial sizes, fill volume, and dose strength on the processperformance (product temperature) as illustrated below inFigure 14. Figure 14 a shows the modeled impact of changes
Fig. 11. Developed ab initio predictionmodels for heat transfer coefficient (Kv). The overall Kv is computed abinitio as the sum of the solid contact, gas conduction, and radiative heat transfer components q̇gas; q̇rad and q̇ctare the heat transfer rate through gas conduction; radiation and solid contact; respectively (9). a Threemechanisms of heat transfer to a vial. b Ab initio model vs. measured Kv for LabLyo2, 6R vial
Fig. 12. Design spaces created by coupled CFD and quasi-steady-state models to predict the equipment and processperformance and guide operation: Knowledge space includes the range of inputs that are studied (inside of purpleboundary); safe operating zone is bounded with choked flow limit and critical product temperature (blue region); controlzone is bounded by the preferred range of maximum product temperature and chamber pressure (inside of thick greentriangle or quadrilateral). The black traces are the calculated product temperature isotherms, where Teu is the experimentalcritical product temperature. The red traces are the calculated shelf temperature isotherms. The equipment capability isrepresented by the solid blue line (due to choked flow) and also the thin green line (due to condenser overload). a ForLabLyo2. b For PilotLyo1
221 Page 12 of 18 AAPS PharmSciTech (2021) 22: 221

in the fill volume on an amorphous-based formulation with12% solid on a lab-scale lyophilizer, and Figure 14 b showsthe impact of changing vial sizes for 1 mL of the sameformulation. Figure 14 c shows the modeled impact of thesolid content of sucrose.
The results of simulations/predictions can be used toassess whether the impact of those changes is significant,insignificant, or within the acceptable criteria and to decidethe need to revalidate the process or not. Similar to thedesign spaces presented in the “Construction of DesignSpace” section, again the validity and accuracy of thepredicted influence of the dosage form selection on thelyophilization process performance are completely dependenton the accuracy of the inputs to the model. The properties ofthe final formulated product such as Tc/Teu are critical andare a function of nature of API and corresponding dosestrength. In case of mAbs, for example, it is well documentedthat the delta between Tc and Tg’ increases as a function ofincreasing protein concentration thereby allowing dryingoperation to occur at higher temperature. Similarly, increas-ing fill volume (or correspondingly lowering vial dimensions)imposes greater vapor flow restrictions during the dryingprocess as illustrated in Figure 14 a and b. However,increasing concentration also results in an increase in masstransfer resistance (Figure 14 c) and thus caution must betaken to optimize the cycle for uniform drying without
causing cake collapse. Additionally, maximum batch sizeshould be established by taking not only the equipmentcapability such as minimum controllable chamber pressure asa function of sublimation rate but also by characterizingcritical process parameters and their corresponding impact onproduct quality attributes as documented in Patel et al. (21)and Kshirsagar et al. (23).
Controlled Ice Nucleation Technology and Its Effect onProduct Resistance
All solutions undergo supercooling during the freezingstep. Supercooling occurs when nucleation of ice occurs atsolution temperatures well below the equilibrium freezingpoint for the formulation. Conventional lyophilizers coolsolutions by decreasing the shelf temperature over a specifiedtime. Ice nucleation is not controlled during this approachand occurs randomly over a wide range of solution temper-atures. There is often a higher degree of supercooling in theaseptic manufacturing area compared with the preparation ofsamples in a laboratory environment. Controlling the tem-perature at which ice nucleates can drastically reduce thevariability between the vials on a shelf and between shelves,both at small scale and at full scale. Reducing the variabilitycan ensure all product in all vials dry at a similar rate andshould exhibit similar quality attributes such as appearance
Fig. 13. Effect of product load size differences on heat transfer, Kv. a Determination of tPri-Dry based on Pirani/CMconvergence onset, where the black, red, blue, and green solid lines are the Pirani pressure data for the 100%, 10%, 5%, and2% loads of 5% Mannitol on LyoStar3, respectively. b Lyo-Calculator fitting of Kv and Rp to tPri-Dry. The red dashed linewith spikes is the measured center vial temperature for the 100% load case, whereas the solid black, red, blue, and greensolid lines are the batch average temperature, fitted using using various Kv to tPri-Dry of the 100%, 10%, 5%, and 2% loads,respectively. c, d Experimental and predicted effect of load size in table and chart view, respectively. The percentageincrease of Kv (batch-averaged by fitting to tPri-Dry) relative to 100% load for 100%, 10%, 5%, and 2% partial loads onLyoStar II (in Patel et al. 2010, blue bar) and LyoStar 3 (experiment in dark orange bar and prediction in light orange bar),respectively
Page 13 of 18 221AAPS PharmSciTech (2021) 22: 221

residual moisture and reconstitution time. This can have anadded advantage of significantly reducing primary dryingtime. The possibilities for reducing variability and lyophiliza-tion processing time have increased the interest of pharma-ceutical companies in CIN.
Controlled ice nucleation is a recent technology usedduring the freezing step of lyophilization that can reduceinter-vial variability in ice nucleation temperature. Reducingthe variability in ice nucleation temperature can reduce thedifferences in product resistance, Rp, during drying so that allvials in the batch exhibit similar behavior. Besides, areduction in product resistance can reduce the drying timeespecially when nucleation occurs at higher temperatures. Areduction in Rp occurs when there is a decrease in the surfacearea of ice as a result of conducting CIN at warmertemperatures resulting in large ice crystals that leave behindlarge pores in the drying solid. This can additionally reducethe interfacial interactions for molecules that are sensitive tointeractions at the ice interface (30). The larger poresresulting from CIN may improve reconstitution time forhighly concentrated formulations and formulations containinglarge molecules by making it easier for the diluent topenetrate the lyophilized solid (31). Improvements in theappearance of lyophilized solids may also be a result (32, 33).
Multiple methods have been investigated for controllingthe nucleation of ice (34). Two CIN methods are available atfull scale and one is available at a laboratory scale. Themethods available at the laboratory and full scale includerapid depressurization using ControLyo® and the introduc-tion of an ice fog using VERISEQ® nucleation.FreezeBooster® also uses an ice fog for seeding nucleationand is available at a laboratory scale.
A recent survey conducted by LyoHub found that morethan 10 pharmaceutical companies are testing and/orimplementing rapid depressurization CIN technology at scale,for multiple modalities, including monoclonal antibodies,vaccines, and gene/cell therapy products. A similar number(more than 6–10) of pharmaceutical companies are testing icefog technology at scale, for monoclonal antibodies, vaccines,and small molecules. Both technologies are amenable toimplementation on new lyophilizers as well as to retrofittingcurrent lyophilizers. In either case, depending on the CINtechnology, modifications to the equipment design areneeded. For example, in ControLyo® technology, additionaldepressurization valve(s) may be installed on the lyophiliza-tion chamber. Further, the depressurization valves need to be
provided with additional nozzles to meet “Clean in Place”requirements. CIN software may be integrated into thelyophilizer control system or may be executed via a separatecontrol system, and the output CIN parameters may beevaluated either as part of the lyophilizer batch record orseparately using a validated system output when controllingCIN operation with a separate control system.
The typical goals for implementing CIN are to reducevariability and to reduce lyophilization processing time. Thereduction in processing time may be more substantial forsome formulations than for others. For example, amorphousformulations with low critical product temperatures oftenrequire conservative processing conditions to prevent col-lapse during primary drying. The conservative conditionsoften lead to longer than desired processing times. The use ofcontrolled nucleation for such formulations can drasticallyreduce processing time. Experiments conducted at BaxterHealthcare using a 5% sucrose solution suggest that theprocessing time can be reduced by as much as 25 h at alaboratory scale (Table I).
Several factors should be considered/studied at a labo-ratory scale when designing a process using CIN (Table II).One consideration is that the nucleation of ice starts at thetop of the formulation and proceeds downward. This is theopposite of what occurs when using conventional (random)nucleation.
The factors described in Table II should be consideredwhen designing studies at a laboratory scale. The time neededfor equilibration of temperature before ice nucleation maydiffer for different fill volumes and vial sizes. Insufficient
Fig. 14. Effect of a fill volume, b vial size, and c solid content concentration/Rp on Tpr(t) and tPriDry. In each subfigure, the red, green, and bluecurves are the predicted product temperature in primary drying for each of the three varied conditions. The black dashed dot lines are thecritical product temperature
Table I. Comparison of lyophilization cycle conditions for 5%sucrose 5 mL in a 10 mL vial
Technique Primarydrying shelftemperature(°C)
Primarydryingchamberpressure(mTorr)
Producttemperature(°C)
To t a lcyclet i m e(hours)
Conventional icenucleation
-25 100 -33 95
Controlled icenucleation at −5°C
-21 100 -34 70
221 Page 14 of 18 AAPS PharmSciTech (2021) 22: 221
equilibration time can prevent nucleation from occurringwhen desired. Ramp rates post-nucleation should also beconsidered. However, this is typically dictated by the capa-bility of the lyophilizer at full scale. Most lyophilizers cannotproceed any faster than about 1 °C/min at full scale.
Transferring the process to full scale relies on typicallyophilizer qualification as described in other sections of thisdocument. One of the important variables at full scaleincludes proving adequate control of shelf temperature undervarious load conditions. Increasing the thermal load in thelyophilizer may require longer hold times before ice nucle-ation to ensure equilibration of solution temperature in thevials.
Once the suitable CIN technology is selected, extensivecharacterization of the CIN process should be initiated. As ageneral strategy, small-scale CIN experiments may be firstperformed to determine the minimum (worst case) icenucleation conditions for successful CIN. Additional experi-ments may be performed to evaluate the impact of selectedCIN parameters on lyophilized cake attributes such asresidual moisture. This will help establish the boundaryconditions for the CIN process parameters to achieve thedesired process/product performance. Once the small-scaleranges are defined, CIN cycles may be performed at themanufacturing scale to establish the CIN parameter robust-ness at scale.
Proving the method is operational post-installation at themanufacturing scale may require engineering batches thatexamine the performance of the CIN method apart fromexamining the performance of other usually tested lyophili-zation parameters. For example, rapid depressurizationrequires that the gas leaves the chamber as fast as possible.This may be hindered by the size of the port, the actuationvalve, or if a sterilizing grade filter is used on the exit of theport. If so, additional ports may be necessary. Appropriateuse of the ice-fog method requires that the ice nuclei rapidlyflow into the product chamber and reach all vials located onall shelves. Therefore, it is important to consider the flowpatterns of the ice nuclei in the chamber.
Hold times and cooling ramp rates may be important indecreasing the variability of ice nucleation and crystal growth.Some studies suggest that some molecules may be sensitive tolong residence times in the freeze concentrate above the glasstransition (Tg’) and may adversely impact stability. Resultsfrom Merck labs showed that for certain proteins and viruses,longer time in solution (TIS) during the CIN shelf
temperature may lead to degradation during the frozen (35).This would necessitate limiting the pre-ice/post-ice nucleationhold time range, and might even render CIN an unfavorableoption in some cases.
Apart from the CIN parameter optimization/robustness,media fills also need to be performed to ensure that thecontents of the lyophilizer will remain sterile post CIN. CINconditions should be simulated (or even challenged) duringthe media fills. For example, during ControLyo®, media fillstudies may be performed to evaluate the ability of the fill-finish process (including CIN) to maintain sterility, usingworst-case CIN parameters (e.g., highest depressurizationmagnitude) as the worst case for sterility. The impact of highpressure on microbial growth may also need to be evaluatedbefore performing the media fills.
SUMMARY
The validation activities of pharmaceutical lyophilizationfor stage 1 (process design), stage 2 (process qualification),and stage 3 (continued process verification) are considered inthis work along with relevant case studies. In part I, theprocess design approach relying on generating a design spacefor a given product and equipment combination is presentedand illustrated with examples from practice. Applications ofmodeling in process design and scale-up are also presentedwhile showcasing the impact of facility, equipment, and Kv.New and upcoming approaches to process improvementproduct monitoring, and process understanding with anemphasis on CMC requirements are discussed as well.Furthermore, illustrative case studies are documented formultiple vial sizes, fill volumes, and dosage strengths todemonstrate the value of modeling. These activities are aimedat enhancing process understanding in preparation for stages2 and 3 of the validation processes described in thecompanion part II of the paper.
ACKNOWLEDGEMENTS
We thank Andrea Allmendinger (Roche), Dilbir Bindra(BMS), Xiaodong Chen (BMS), Pierre Goldbach (Roche),David Ochsenbein (Janssen), Reza Eivaskhani (Janssen),Sumit Luthra (Pfizer), Ronak Maheshwari (Amgen), EkneetSahni (Pfizer), Justin Stanbro (Merck), Zak Yusoff (SPScientific), and LyoHub members for the critical review ofthe manuscript and their valuable comments.
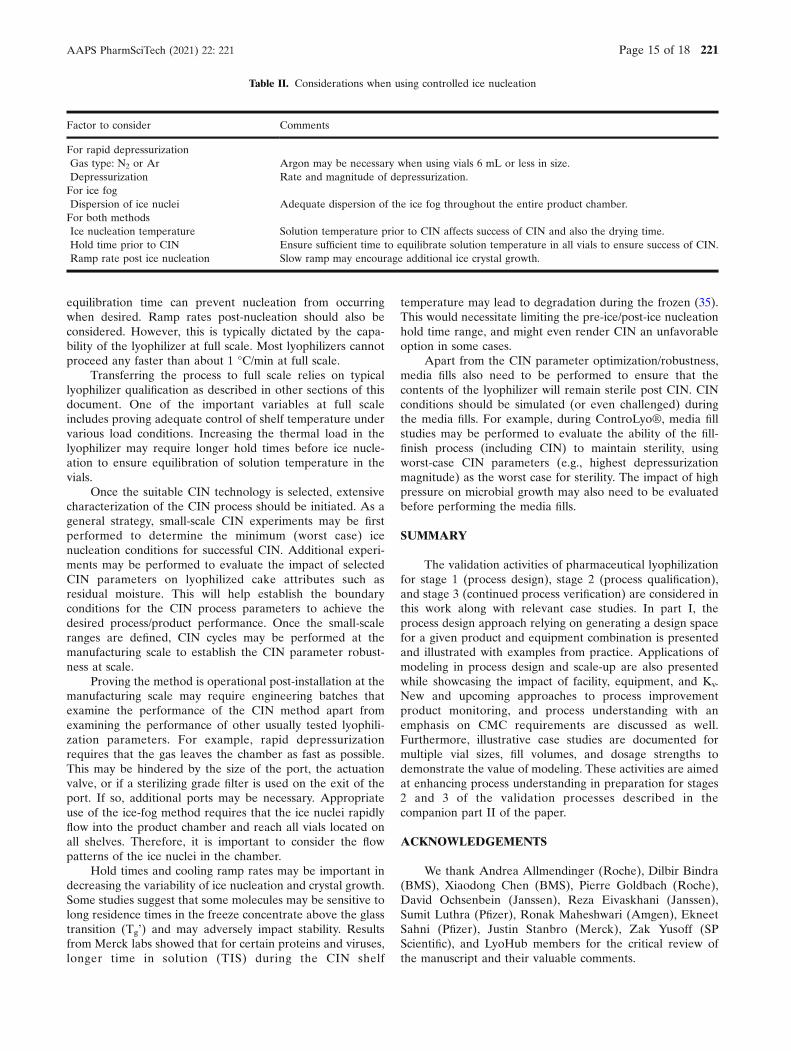
Table II. Considerations when using controlled ice nucleation
Factor to consider Comments
For rapid depressurizationGas type: N2 or Ar Argon may be necessary when using vials 6 mL or less in size.Depressurization Rate and magnitude of depressurization.For ice fogDispersion of ice nuclei Adequate dispersion of the ice fog throughout the entire product chamber.For both methodsIce nucleation temperature Solution temperature prior to CIN affects success of CIN and also the drying time.Hold time prior to CIN Ensure sufficient time to equilibrate solution temperature in all vials to ensure success of CIN.Ramp rate post ice nucleation Slow ramp may encourage additional ice crystal growth.
Page 15 of 18 221AAPS PharmSciTech (2021) 22: 221

AUTHOR CONTRIBUTION
Alina Alexeenko: Substantial contributions to the con-ception or design of the work; or the acquisition, analysis, orinterpretation of data for the work; and drafting the work orrevising it critically for important intellectual content; andfinal approval of the version to be published; and agreementto be accountable for all aspects of the work in ensuring thatquestions related to the accuracy or integrity of any part ofthe work are appropriately investigated and resolved.
Joe Azzarella: Revised the drafted works and assisted inensuring that questions related to the accuracy or integrity ofany part of the work were appropriately investigated andresolved.
Akhilesh Bhambhani: Substantial contributions to theconception or design of the work; or the acquisition, analysis,or interpretation of data for the work; and drafting the workor revising it critically for important intellectual content; andfinal approval of the version to be published; and agreementto be accountable for all aspects of the work in ensuring thatquestions related to the accuracy or integrity of any part ofthe work are appropriately investigated and resolved. Ac-countable for the work and end to end.
Rui Fang: Substantial contributions to the conception ordesign of the work; or the acquisition, analysis, or interpre-tation of data for the work; and drafting the work or revisingit critically for important intellectual content; and finalapproval of the version to be published; and agreement tobe accountable for all aspects of the work in ensuring thatquestions related to the accuracy or integrity of any part ofthe work are appropriately investigated and resolved. Ac-countable for the work and end to end.
Lavanya Iyer: contributed to the acquisition and inter-pretation of data for the work; authoring and revising thedraft. Accountable for all aspects of the work in ensuring thatquestions related to the accuracy or integrity of any part ofthe work are appropriately investigated and resolved.
Feroz Jameel: Substantial contributions to the concep-tion or design of the work; or the acquisition, analysis, orinterpretation of data for the work; and drafting the work orrevising it critically for important intellectual content; andagreement to be accountable for all aspects of the work inensuring that questions related to the accuracy or integrity ofany part of the work are appropriately investigated andresolved.
Mehfouz Jalal: Responsible for consolidating the infor-mation contributed by all the authors and compiling it into acohesive single document. He was also responsible for editingthe contents of the contributions and discussing with authorsregarding the information they provided for its clarity.
Petr Kazarin: Responsible for consolidating the informa-tion contributed by all the authors and compiling it into acohesive single document. He was also responsible for editingthe contents of the contributions and discussing with authorsregarding the information they provided for its clarity.
Lokesh Kumar: For paper I, led and drafted thecontrolled ice nucleation section. Also, did review of othersection(s) and final approval of the version to be published.
Sumit Luthra: Contributed to drafting the work andrevising it critically for important intellectual content
Ehab Moussa: Substantial contributions to the concep-tion or design of the work; or the acquisition, analysis, orinterpretation of data for the work; and drafting the work orrevising it critically for important intellectual content; andfinal approval of the version to be published.
Greg Sacha: Authored Sections 3 and 5 for paper 1 andprovided information and data for paper 2.
Puneet Sharma: paper 1—contributed as an author/reviewer for the following sections: Generation and use ofdesign space, and Engineering/development runs at scalepaper 2—contributed as an author/reviewer for followingsections: PPQ Protocol, Recommended analytical testing(discussion of differences in pCQAs of small molecules,biotherapeutics and vaccines), and Continuous processverification.
Jayasree Srinivasan: Substantial contributions to theconception or design of the work; or the acquisition, analysis,or interpretation of data for the work; and drafting the workor revising it critically for important intellectual content; andfinal approval of the version to be published; and agreementto be accountable for all aspects of the work in ensuring thatquestions related to the accuracy or integrity of any part ofthe work are appropriately investigated and resolved.
Serguei Tchessalov: In paper 1, contributed to theconcept of paper, participated in paper outlines and reviewedfinal content. In paper 2, co-author section on validation oflyo processes in alternative containers (dual chamber con-tainers and trays), participated in paper discussions andreviewed final content.
Ted Tharp: Involved in the original conceptual efforts oftopics of interest for the paper, leading and contributing to anumber of the subsections, and in the review and revisionprocess.
Tong Zhu: Substantial contributions to the conception ordesign of the work; or the acquisition, analysis, or interpre-tation of data for the work; and drafting the work or revisingit critically for important intellectual content; and finalapproval of the version to be published; and agreement tobe accountable for all aspects of the work in ensuring thatquestions related to the accuracy or integrity of any part ofthe work are appropriately investigated and resolved.
FUNDING
Alina Alexeenko: Paid employee of LyoHUB, PurdueUniversity, at the time of the project/paper drafting process.
Joe Azzarella: N/AAkhilesh Bhambhani: N/ARui Fang: N/ALavanya Iyer: N/AFeroz Jameel: N/AMehfouz Jalal: Paid employee of LyoHUB, Purdue
University, at the time of the project/paper drafting process.Petr Kazarin: Paid employee of LyoHUB, Purdue
University, at the time of the project/paper drafting process.Lokesh Kumar: N/ASumit Luthra: N/AEhab Moussa: No sponsorship or sources of material not
available commercially are applicable.Greg Sacha: N/A
221 Page 16 of 18 AAPS PharmSciTech (2021) 22: 221

Puneet Sharma: No sponsorship or sources of materialnot available commercially are applicable, during his time atGenentech.
Jayasree Srinivasan: N/ASerguei Tchessalov: All presented work was performed
internally and funded by PfizerTed Tharp: N/ATong Zhu: No specific funding is provided (on Abbvie
side) for the authors’ contribution to this paper.
DECLARATIONS
Conflict of Interest Alina Alexeenko: Proprietary work withJanssen
Joe Azzarella: NoAkhilesh Bhambhani: NoRui Fang: NoLavanya Iyer: NoFeroz Jameel: NoMehfouz Jalal: NoPetr Kazarin: NoLokesh Kumar: NoSumit Luthra: NoEhab Moussa: NoGreg Sacha: NoPuneet Sharma: NoJayasree Srinivasan: NoSerguei Tchessalov: NoTed Tharp: NoTong Zhu: No
Open Access This article is licensed under a CreativeCommons Attribution 4.0 International License, which per-mits use, sharing, adaptation, distribution and reproduction inany medium or format, as long as you give appropriate creditto the original author(s) and the source, provide a link to theCreative Commons licence, and indicate if changes weremade. The images or other third party material in this articleare included in the article's Creative Commons licence, unlessindicated otherwise in a credit line to the material. If materialis not included in the article's Creative Commons licence andyour intended use is not permitted by statutory regulation orexceeds the permitted use, you will need to obtain permissiondirectly from the copyright holder. To view a copy of thislicence, visit http://creativecommons.org/licenses/by/4.0/.
REFERENCES
1. Pikal MJ. Lyophilization. In Swarbrick J, Boylan J. Encyclope-dia of pharmaceutical technology.; 2002. p. 1299-1326.
2. Carpenter JF, Pikal MJ, Chang BS, Randolph TW. Rationaldesign of stable lyophilized protein formulations: some practicaladvice. Pharmaceutical research. 1997;14:969–75.
3. Blue JT, Sinacola JR, Bhambhani A. Process scale-up andoptimization of lyophilized vaccine products. In LyophilizedBiologics and Vaccines.: Springer; 2015. p. 179–210.
4. Tang X, Pikal MJ. Design of freeze-drying processes forpharmaceuticals: practical advice. 2004; 21: 191–200.
5. Jennings TA. Validation of the lyophilzation process. 1986..6. Trappler EH. Validation of lyophilization. In Agalloco JP,
Carleton FJ. Validation of pharmaceutical processes.: CRCPress; 2007.
7. U.S. Food and Drug Andministration. Guidance for industry,process validation: general principles and practices. Center forBiologics Evaluation and Research. US Department of Healthand Human Services: Rockville, MD. 2011.
8. Guideline ICHHT. Quality risk management. Q9, Current step.2005; 4: 408.
9. Pikal MJ, Roy ML, Shah S. Mass and heat transfer in vialfreeze-drying of pharmaceuticals: role of the vial. Journal ofPharmaceutical Sciences. 1984;73:1224–37.
10. Konstantinidis AK, Kuu W, Otten L, Nail SL, Sever RR.Controlled nucleation in freeze-drying: effects on pore size inthe dried product layer, mass transfer resistance, and primarydrying rate. Journal of Pharmaceutical Sciences. 2011;100:3453–70.
11. Lu X, Pikal MJ. Freeze-drying of mannitol–trehalose–sodiumchloride-based formulations: the impact of annealing on drylayer resistance to mass transfer and cake structure. Pharma-ceutical development and technology. 2004;9:85–95.
12. Nail SL. The effect of chamber pressure on heat transfer in thefreeze drying of parenteral solutions. Journal of the ParenteralDrug Association. 1980;34.
13. Gieseler H, Kessler WJ, Finson M, Davis SJ, Mulhall PA, BonsV, et al. Evaluation of tunable diode laser absorption spectros-copy for in-process water vapor mass flux measurements duringfreeze drying. Journal of Pharmaceutical Sciences.2007;96:1776–93.
14. Schneid SC, Gieseler H, Kessler WJ, Pikal MJ. Non-invasiveproduct temperature determination during primary drying usingtunable diode laser absorption spectroscopy. Journal of Phar-maceutical Sciences. 2009;98:3406–18.
15. Marti J, Mauersberger K. A survey and new measurements ofice vapor pressure at temperatures between 170 and 250K.Geophysical Research Letters. 1993;20:363–6.
16. Murphy DM, Koop T. Review of the vapour pressures of iceand supercooled water for atmospheric applications. 2005.
17. Giordano A, Barresi AA, Fissore D. On the use of mathemat-ical models to build the design space for the primary dryingphase of a pharmaceutical lyophilization process. Journal ofPharmaceutical Sciences. 2011;100:311–24.
18. Milton N, Pikal MJ, Roy ML, Nail SL. Evaluation of manomet-ric temperature measurement as a method of monitoringproduct temperature during lyophilization. PDA Journal ofPharmaceutical Science and Technology. 1997;51.
19. Zhu T, Moussa EM, Witting M, Zhou D, Sinha K, Hirth M,et al. Predictive models of lyophilization process for develop-ment, scale-up/tech transfer and manufacturing. EuropeanJournal of Pharmaceutics and Biopharmaceutics. 2018;128:363–78.
20. Shivkumar G, Kshirsagar V, Zhu T, Sebastiao IB, Nail SL,Sacha GA, et al. Freeze-dryer equipment capability limit:comparison of computational modeling with experiments atlaboratory scale. Journal of Pharmaceutical Sciences.2019;108:2972–81.
21. Patel SM, Chaudhuri S, Pikal MJ. Choked flow and importanceof Mach I in freeze-drying process design. Chemical Engineer-ing Science. 2010;65:5716–27.
22. Tchessalov S, Dixon D, Warne N. Principles of lyophilizationcycle scale-up. American Pharmaceutical Review. 2007;10:88.
23. Kshirsagar V, Tchessalov S, Kanka F, Hiebert D, Alexeenko A.Determining maximum sublimation rate for a productionlyophilizer: computational modeling and comparison with iceslab tests. Journal of Pharmaceutical Sciences. 2019;108:382–90.
24. Hottot A, Vessot S, Andrieu J. Freeze drying of pharmaceuti-cals in vials: influence of freezing protocol and sample config-uration on ice morphology and freeze-dried cake texture.Chemical Engineering and Processing: Process Intensification.2007;46:666–74.
25. pharmahub.org. [Online].; 2021 [cited 2021 June 7. Availablefrom: https://pharmahub.org/groups/lyo.
Page 17 of 18 221AAPS PharmSciTech (2021) 22: 221

26. Jameel F, Zhu T, Moussa EM, Mills BJ. Rational design of afreeze-drying process for protein products. In Development ofBiopharmaceutical Drug-Device Products.: Springer; 2020. p.499–537.
27. Kuu WY, Hardwick LM, Akers MJ. Rapid determination of drylayer mass transfer resistance for various pharmaceuticalformulations during primary drying using product temperatureprofiles. International Journal of Pharmaceutics. 2006;313:99–113.
28. Rambhatla S, Ramot R, Bhugra C, Pikal MJ. Heat and masstransfer scale-up issues during freeze drying: II. Control andcharacterization of the degree of supercooling. AAPSPharmSciTech. 2004;5:54–62.
29. Patel SM, Jameel F, Pikal MJ. The effect of dryer load on freezedrying process design. Journal of Pharmaceutical Sciences.2010;99:4363–79.
30. Fang R, Tanaka K, Mudhivarthi V, Bogner RH, Pikal MJ. Effectof controlled ice nucleation on stability of lactate dehydroge-nase during freeze-drying. Journal of pharmaceutical sciences.2018;107:824–30.
31. Geidobler R, Konrad I, Winter G. Can controlled ice nucleationimprove freeze-drying of highly-concentrated protein formula-tions? Journal of pharmaceutical sciences. 2013;102:3915–9.
32. Esfandiary R, Gattu SK, Stewart JM, Patel SM. Effect offreezing on lyophilization process performance and drugproduct cake appearance. Journal of pharmaceutical sciences.2016;105:1427–33.
33. Awotwe-Otoo D, Agarabi C, Read EK, Lute S, Brorson KA,Khan MA, et al. Impact of controlled ice nucleation on processperformance and quality attributes of a lyophilized monoclonalantibody. International journal of pharmaceutics. 2013;450:70–8.
34. Geidobler R, Winter G. Controlled ice nucleation in the field offreeze-drying: fundamentals and technology review. EuropeanJournal of Pharmaceutics and Biopharmaceutics. 2013;85:214–22.
35. Fang R, Bogner RH, Nail SL, Pikal MJ. Stability of freeze-driedprotein formulations: contributions of ice nucleation tempera-ture and residence time in the freeze-concentrate. Journal ofPharmaceutical Sciences. 2020;109:1896–904.
Publisher’s Note Springer Nature remains neutral with regardto jurisdictional claims in published maps and institutionalaffiliations.
221 Page 18 of 18 AAPS PharmSciTech (2021) 22: 221