
Lyophilization-induced reversible changesin the …lyophilization or freeze-drying of aqueous...
8
Proc. Natl. Acad. Sci. USA Vol. 92, pp. 10969-10976, November 1995 Biochemistry This contribution is part of the special series of Inaugural Articles by members of the National Academy of Sciences elected on April 25, 1995. Lyophilization-induced reversible changes in the secondary structure of proteins (Fourier-transform infrared spectroscopy/dehydration/a-helix/p-sheet/solid state) KAI GRIEBENOW AND ALEXANDER M. KLIBANOV* Department of Chemistry, Massachusetts Institute of Technology, Cambridge, MA 02139 Contributed by Alexander M. Klibanov, August 28, 1995 ABSTRACT Changes in the secondary structure of some dozen different proteins upon lyophilization of their aqueous solutions have been investigated by means of Fourier- transform infrared spectroscopy in the amide IHI band region. Dehydration markedly (but reversibly) alters the secondary structure of all the proteins studied, as revealed by both the quantitative analysis of the second derivative spectra and the Gaussian curve fitting of the original infrared spectra. Ly- ophilization substantially increases the ,8-sheet content and lowers the a-helix content of all proteins. In all but one case, proteins become more ordered upon lyophilization. Consider the common laboratory and bioindustrial process of lyophilization or freeze-drying of aqueous solutions of pro- teins. Suppose that this lyophilization is carried out such that no irreversible damage to the protein ensues-i.e., when the lyophilized protein is redissolved in water, it exhibits the same properties as prior to lyophilization. The question still remains whether the protein structure in the lyophilized form is native or whether the lyophilization has resulted in reversible protein denaturation. Apart from its biochemical interest, the answer has important biotechnological implications. For example, proteins that have been lyophilized (which is how research and pharmaceutical protein preparations are usually stored) un- dergo moisture-triggered aggregation (1). To understand the mechanism of this undesirable phenomenon and to develop rational strategies for its prevention, structural information on proteins in the solid-e.g., lyophilized-form is needed. In addition, lyophilized enzymes suspended in organic solvents have proven to be useful synthetic catalysts (2); enzyme structural data should help maximize their performance. The issue of protein conformation in the lyophilized form is controversial. For example, the results of Fourier-transform infrared (FTIR) spectroscopic investigations of hen egg-white lysozyme were interpreted to indicate that lysozyme structure in either aqueous solution or the lyophilized state is the same (3-6). This conclusion was supported by some hydrogen isotope-exchange studies (6, 7) but contradicted by others (8). Raman (9-11) and solid-state NMR (12) studies have sug- gested significant (reversible) structural changes occurring in lysozyme upon lyophilization. Likewise, recent hydrogen iso- tope-exchange/high-resolution NMR (13) and FTIR (14, 15) investigations of various proteins strongly point to lyophiliza- tion-induced reversible denaturation. Recent advances, both instrumentational and conceptual, in FTIR spectroscopy make it a method of choice for examining the structure of solid proteins. This has been illustrated by the scholarly work of Prestrelski et al. (14, 15), who have employed this methodology to quantify changes in the secondary struc- ture of proteins caused by lyophilization. Using the second derivatives of the vibrational spectra of proteins in the amide I band region (1600-1720 cm-1), these authors have calculated so-called correlation coefficients which reflect the overall changes in the secondary structure upon lyophilization. This approach, however, yields no quantitative information about changes in the individual structural elements-e.g., percent- ages of a-helices and (3-sheets. This is because although the FTIR bands in the amide I region directly correspond to these secondary structural elements (16, 17), the line broadening in the spectra of lyophilized proteins, combined with strongly overlapping bands, make such quantitation in this region arduous (15, 18). Another spectral region, the amide III band (1220-1330 cm-'), also reflects the secondary structure of proteins (19-21) and has been used to characterize structural changes qualitatively (22-26) and, in aqueous solution, even to quantify the individual secondary structure composition of proteins (19-21, 27). We have employed the IR amide III band region to inves- tigate quantitatively the reversible changes in the secondary structure of some dozen different proteins occurring upon lyophilization. Consequently, alterations in the individual structural elements have been determined. For all the proteins examined, lyophilization leads to a marked increase in the percentages of ,B-sheets, with a parallel drop in the percentages of a-helices and unordered structures. MATERIALS AND METHODS Materials. Bovine pancreatic trypsin inhibitor (BPTI), RNase A (90 Kunitz units/mg of protein), chymotrypsinogen A, porcine insulin (Zn2+ content of 0.5%), horse myoglobin (Mb) (95-100% purity), and cytochrome c (Cyt c) from the heart of tuna (98% purity), rabbit (97% purity), pigeon (99% purity), chicken (100% purity), horse (99% purity), dog (99% purity), and cow (99% purity) were obtained from Sigma. Recombinant human albumin (rHA) was a generous gift from Delta Biotechnology (Nottingham, U.K.). KBr for making pellets was from SpectraTech (Stamford, CT); acetone, pro- panol and D-sorbitol were from Aldrich. Lyophilization. All aqueous protein solutions to be lyoph- ilized were frozen in liquid nitrogen and applied to a Labconco (Kansas City) model 8 freeze-drier at a pressure of approxi- mately 10 ,um of Hg and a condenser temperature of - 50°C for at least 24 h. Concentrations of all proteins, except for BPTI, were 10 mg/ml in distilled water unless stated otherwise. BPTI and D-sorbitol were lyophilized, separately or together, from a concentration of 1 mg/ml at pH 3.5. The pH of solutions from Abbreviations: BPTI, bovine pancreatic trypsin inhibitor; Cyt c, cytochrome c; FTIR, Fourier-transform infrared; rHA, recombinant human albumin; Mb, myoglobin. *To whom reprint requests should be addressed. 10969 Downloaded by guest on April 24, 2020
Transcript of Lyophilization-induced reversible changesin the …lyophilization or freeze-drying of aqueous...

Proc. Natl. Acad. Sci. USAVol. 92, pp. 10969-10976, November 1995Biochemistry
This contribution is part of the special series of Inaugural Articles by members of the National Academy of Scienceselected on April 25, 1995.
Lyophilization-induced reversible changes in the secondarystructure of proteins
(Fourier-transform infrared spectroscopy/dehydration/a-helix/p-sheet/solid state)
KAI GRIEBENOW AND ALEXANDER M. KLIBANOV*Department of Chemistry, Massachusetts Institute of Technology, Cambridge, MA 02139
Contributed by Alexander M. Klibanov, August 28, 1995
ABSTRACT Changes in the secondary structure of somedozen different proteins upon lyophilization of their aqueoussolutions have been investigated by means of Fourier-transform infrared spectroscopy in the amide IHI band region.Dehydration markedly (but reversibly) alters the secondarystructure of all the proteins studied, as revealed by both thequantitative analysis of the second derivative spectra and theGaussian curve fitting of the original infrared spectra. Ly-ophilization substantially increases the ,8-sheet content andlowers the a-helix content of all proteins. In all but one case,proteins become more ordered upon lyophilization.
Consider the common laboratory and bioindustrial process oflyophilization or freeze-drying of aqueous solutions of pro-teins. Suppose that this lyophilization is carried out such thatno irreversible damage to the protein ensues-i.e., when thelyophilized protein is redissolved in water, it exhibits the sameproperties as prior to lyophilization. The question still remainswhether the protein structure in the lyophilized form is nativeor whether the lyophilization has resulted in reversible proteindenaturation. Apart from its biochemical interest, the answerhas important biotechnological implications. For example,proteins that have been lyophilized (which is how research andpharmaceutical protein preparations are usually stored) un-dergo moisture-triggered aggregation (1). To understand themechanism of this undesirable phenomenon and to developrational strategies for its prevention, structural information onproteins in the solid-e.g., lyophilized-form is needed. Inaddition, lyophilized enzymes suspended in organic solventshave proven to be useful synthetic catalysts (2); enzymestructural data should help maximize their performance.The issue of protein conformation in the lyophilized form is
controversial. For example, the results of Fourier-transforminfrared (FTIR) spectroscopic investigations of hen egg-whitelysozyme were interpreted to indicate that lysozyme structurein either aqueous solution or the lyophilized state is the same(3-6). This conclusion was supported by some hydrogenisotope-exchange studies (6, 7) but contradicted by others (8).Raman (9-11) and solid-state NMR (12) studies have sug-gested significant (reversible) structural changes occurring inlysozyme upon lyophilization. Likewise, recent hydrogen iso-tope-exchange/high-resolution NMR (13) and FTIR (14, 15)investigations of various proteins strongly point to lyophiliza-tion-induced reversible denaturation.Recent advances, both instrumentational and conceptual, in
FTIR spectroscopy make it a method of choice for examiningthe structure of solid proteins. This has been illustrated by thescholarly work of Prestrelski et al. (14, 15), who have employedthis methodology to quantify changes in the secondary struc-ture of proteins caused by lyophilization. Using the secondderivatives of the vibrational spectra of proteins in the amide
I band region (1600-1720 cm-1), these authors have calculatedso-called correlation coefficients which reflect the overallchanges in the secondary structure upon lyophilization. Thisapproach, however, yields no quantitative information aboutchanges in the individual structural elements-e.g., percent-ages of a-helices and (3-sheets. This is because although theFTIR bands in the amide I region directly correspond to thesesecondary structural elements (16, 17), the line broadening inthe spectra of lyophilized proteins, combined with stronglyoverlapping bands, make such quantitation in this regionarduous (15, 18). Another spectral region, the amide III band(1220-1330 cm-'), also reflects the secondary structure ofproteins (19-21) and has been used to characterize structuralchanges qualitatively (22-26) and, in aqueous solution, even toquantify the individual secondary structure composition ofproteins (19-21, 27).We have employed the IR amide III band region to inves-
tigate quantitatively the reversible changes in the secondarystructure of some dozen different proteins occurring uponlyophilization. Consequently, alterations in the individualstructural elements have been determined. For all the proteinsexamined, lyophilization leads to a marked increase in thepercentages of ,B-sheets, with a parallel drop in the percentagesof a-helices and unordered structures.
MATERIALS AND METHODSMaterials. Bovine pancreatic trypsin inhibitor (BPTI),
RNase A (90 Kunitz units/mg of protein), chymotrypsinogenA, porcine insulin (Zn2+ content of 0.5%), horse myoglobin(Mb) (95-100% purity), and cytochrome c (Cyt c) from theheart of tuna (98% purity), rabbit (97% purity), pigeon (99%purity), chicken (100% purity), horse (99% purity), dog (99%purity), and cow (99% purity) were obtained from Sigma.Recombinant human albumin (rHA) was a generous gift fromDelta Biotechnology (Nottingham, U.K.). KBr for makingpellets was from SpectraTech (Stamford, CT); acetone, pro-panol and D-sorbitol were from Aldrich.
Lyophilization. All aqueous protein solutions to be lyoph-ilized were frozen in liquid nitrogen and applied to a Labconco(Kansas City) model 8 freeze-drier at a pressure of approxi-mately 10 ,um of Hg and a condenser temperature of - 50°C forat least 24 h. Concentrations of all proteins, except for BPTI,were 10 mg/ml in distilled water unless stated otherwise. BPTIand D-sorbitol were lyophilized, separately or together, from aconcentration of 1 mg/ml at pH 3.5. The pH of solutions from
Abbreviations: BPTI, bovine pancreatic trypsin inhibitor; Cyt c,cytochrome c; FTIR, Fourier-transform infrared; rHA, recombinanthuman albumin; Mb, myoglobin.*To whom reprint requests should be addressed.
10969
Dow
nloa
ded
by g
uest
on
Apr
il 24
, 202
0

10970 Biochemistry: Griebenow and Klibanov
which proteins were lyophilized (adjusted by adding 0.1 NNaOH or HCl) was chosen to allow comparison with spectro-scopic results in the literature. For BPTI, it was pH 3.5 forcomparison with results of Desai et al. (13). Mb was lyophilizedfrom pH 7.0 since the crystals used for x-ray crystallography(28) were grown at this pH (29). For the same reason, pH 4.5was chosen for chymotrypsinogen (30), pH 5.7 was chosen forRNase A (31), and pH 6.4 was chosen for horse heart Cyt c(32). All other cytochromes were studied at pH 6.4 to allowcomparison with the horse heart protein. rHA was lyophilizedfrom pH 7.3 (33); the x-ray data were obtained at neutral pH(34). Insulin was lyophilized from pH 4.0.
Alternative Drying Methods for BPTI. Rotary evaporationand acetone precipitation were performed as described (35).Precipitation of BPTI from aqueous solution (100 mg/ml; pH3.5) with propanol was the same as with acetone.FTIR Measurements. FTIR spectra were measured by using
a Nicolet Magna-IR System 550 optical bench equipped witha MCT-B liquid-N2-cooled detector (11,700-400 cm-1),.Gebeam splitter on KBr substrate (7400-350 cm-'), and ahigh-intensity, air-cooled mid-IR Ever-Glo source (9600-50cm-1). The system, with a resolution specification of 0.5 cm-1,was controlled via an interface card by an analytical worksta-tion (486DX266 Intel processor). The system was aligned byusing the Nicolet OMNIC 1.2 software before the measurementsand every 3 h thereafter. The data collection and calculationof second derivative spectra were carried out with the samesoftware. The optical bench was purged with dry N2 to reduceinterfering water vapor IR absorption.The solution spectra of proteins in H20 were measured
using a 15-,um spacer (36) in a SpectraTech liquid cellequipped with CaF2 windows. Aqueous solutions of the orig-inal proteins and of the reconstituted powders were measuredat the same pH and concentration (2.5-5%). Protein powderswere measured at 1 mg of protein per 200 mg of KBr. Afterhomogenizing the lyophilized protein and KBr with an agatemortar and pestle, the powders were pressed into pellets byusing a SpectraTech Macro-Micro KBr Die Kit and a CarverLaboratory (Menomonee Falls, WI) 12-ton hydraulic press.This method introduces no artifactual structural changes (14,15). We verified that no appreciable water was absorbed duringthe procedure by measuring KBr pellets without protein. Atotal of 256 scans at 2 cm-1 resolution using Happ-Genzelapodization were averaged (14, 15).When necessary, spectra were corrected for the background
in an interactive manner. Subtraction of the water backgroundfor aqueous solutions was accomplished by using the NicoletOMNIC 1.2 software with the following goals: (i) a straightbaseline in the region of 1800-2500 cm-1, where proteins donot absorb (20), and (ii) disappearance of the broad bandaround 800 cm- I (19). For BPTI precipitated with acetone andco-lyophilized with D-sorbitol, the subtraction was performedon dry samples. In the former case, the spectrum revealedresidual acetone even after vacuum drying at 10 Am of Hg for24 h. The typical acetone IR absorption bands were subtractedto obtain the undisturbed protein vibrational spectrum. Cor-rection for D-sorbitol was performed on the basis of thedisappearance of the D-sorbitol IR bands in the fingerprintregion (37) of the spectrum. D-Sorbitol was lyophilized underconditions identical to those in its 1:1 (wt/wt) mixture withBPTI. This mixture was measured at 2.4 mg of BPTI per 200mg of KBr and at 1.2 mg of D-sorbitol per 200 mg of KBr; thelatter was used for subtraction.Each protein sample was measured at least five times. Each
spectrum was corrected for the background to obtain theprotein vibrational spectra and then analyzed by second de-rivatization (38, 39) and Gaussian curve fitting (21, 40). Thedetermined peak wavenumbers of the second derivative spec-tra, as well as those and areas of the fitted Gaussian bands,were averaged, and the standard deviations were calculated.
All spectra were analyzed by second derivatization in theamide I and III band regions for their component compositionby using the OMNIC 1.2 software. Second derivative spectrawere smoothed with an 11-point smoothing function (10.6cm-1) by using this software.
Overall structural changes occurring upon protein dehydra-tion were quantified by calculating the correlation coefficientr (14, 15) from the second derivative spectra in the amide I andIII spectral regions. The r value reflects differences of twospectra: for identical ones it is 1, for those with nothing incommon it is 0. The second derivative spectra used were storedas ASCIIxy pair data sets (one set of data per cm-'), and thecorrelation coefficients were calculated by using the SIGMAPLOT program for each individual spectrum of each samplewith respect to the averaged reference spectrum.
Gaussian curve fitting was performed by using the GRAMS/386 program (Galactic Industries, Salem, NH) on the original(nonsmoothed) protein vibrational spectra. The number ofcomponents and their peak positions were determined bysecond derivatization (38, 39) and used as starting param-eters. After optimization (40), each fit was performed with-out fixing the peak wavenumber, full width at half maximum,or height of individual bands. Note that due to a betterseparation of the individual bands, the problems encoun-tered in the analysis of the amide I region, leading to somesubjectivity (18, 40), are abolished. In all cases, a linearbaseline was fitted (20, 21). The secondary structural ele-ment content was calculated from the areas of the individualassigned bands and their fraction of the total area in theamide III region.Band Assignment in the Amide III Region. Table 1 sum-
marizes the results of the component analysis by secondderivatization and the secondary structure quantification byGaussian curve fitting in the amide III region for the proteinsstudied. In most cases, the discrepancy between the peakmaxima determined by these two methods was below 3 cm-'.Larger deviations observed for some components are still inthe range of published ones (21). The assignment of individualcomponents to secondary structural elements was as follows:a-helix, 1293-1328 cm-1; ,3-sheet, 1225-1250 cm-', and oth-ers, 1257-1288 cm-' (21). We independently verified everyassignment by comparison with x-ray structures, as well as withsecondary-structure estimates from FTIR spectra in the amideI region (17) and circular dichroism estimates (41, 42) whenavailable.
For proteins containing significant fractions of both a-helixand 13-sheet elements (BPTI, chymotrypsinogen, RNase A),the agreement between the secondary structure contents inTable 1 and the literature x-ray data is excellent. For BPTI insolution at pH 9.0, the calculated a-helix and P-sheet contentsof 19% ± 2% and 40% ± 1%, respectively, were very similarto those at pH 3.5 and 7.0 (Table 2) and agree with values of26% a-helix and 45% 13-sheet derived from the x-ray studies(43-45). The FTIR-derived parameters for RNase A (23% +2% a-helix and 45% ± 2% 1-sheet) agree with those calcu-lated (45) from the x-ray data (23% a-helix and 45% 13-sheet),as well as with other FTIR (21% a-helix and 50% 13-sheet) (17)and circular dichroism data (26% a-helix and 44% 13-sheet)(41). Finally, our data for chymotrypsinogen (13% a-helix and41% 1-sheet) agree with those from x-ray (11% ai-helix and46% 13-sheet) (45, 46), other FTIR (21% a-helix and 50%13-sheet) (17) and circular dichroism (9% a-helix and 36%13-sheet) (42) studies.An assignment issue has to be addressed concerning pro-
teins with high a-helix contents (Mb, Cyt c, and rHA). FTIRstudies in the amide I region have demonstrated that theextended chains connecting the a-helix cylinders absorb atfrequencies similar to those of 13-sheets (17). This is also thecase in the amide III region at 1245 cm-' (26). We indeedobserved a band at 1246 cm-1 for these proteins and no
Proc. Natl. Acad. Sci. USA 92 (1995)
Dow
nloa
ded
by g
uest
on
Apr
il 24
, 202
0

Proc. Natl. Acad. Sci. USA 92 (1995) 10971
Table 1. Infrared band positions in the amide III spectral region of various proteins, band areas determined by the Gaussian curve fitting,and band assignments
Band position*
Second Curve Area,Protein derivative fitting %*
BPTISolution 1317 ± 1
1306 ± 21290 ± 11282 ± 11263 ± 01247 ± 11237 ± 1
Powder 1315 ± 11304 ± 21288 ± 01263 ± 11246 ± 21234 ± 1
RNase ASolution 1318 ± 0
1310 ± 21293 ± 01283 ± 11264 ± 11249 ± 01236 ± 1
Powder 1313 ± 01293 ± 11283 ± 11262 ± 01245 ± 11233 ± 0
ChymotrypsinogenSolution 1318 ± 0
1303 ± 01288 ± 11280 ± 11266 ± 11256 ± 11248 ± 01234 ± 0
§Powder 1312 ± 0
1283 ± 11262 ± 11247 ± 11232 ± 1
rHASolution 1320 ± 0
1303 ± 01293 ± 01281 ± 11266 ± 21244 ± 11227 ± 1
Powder 1312 ± 01302 ± 11287 ± 11277 ± 1
1316 ± 11304 ± 11292 ± 11277 ± 31262 ± 11249 ± 11238 ± 01312 ± 2
1284 ± 11262 ± 11246 ± 11233 ± 1
1321 ± 01311 ± 01296 ± 11281 ± 31261 ± 11251 ± 11238 ± 01311 ± 01290 ± 11276 ± 21263 ± 11253 ± 21236 ± 2
1318 ± 01303 ± 11284 ± 01277 ± 01265 ± 01257 ± 21246 ± 01236 ± 11228 ± 11308 ± 11282 ± 01260 ± 01247 ± 11233 ± 0
1316 ± 11302 ± 11295 ± 11276 ± 11264 ± 01246 ± 11226 ± 21310 ± 01294 ± 11282 ± 11274 ± 1
Band position*
Assignmentt
8 + 1 a-Helix1 + 1 a-Helix
12 + 3 a-Helix25 ± 6 Unordered18 ± 9 Unordered6 + 2 13-Sheet
30 + 1 13-Sheet5 + 2 a-Helix* a-Helix
12 ± 2 Unordered28 ± 2 Unordered10 + 2 13-Sheet45 + 2 13-Sheet
4 + 0 a-Helix9 ± 0 a-Helix10 + 2 a-Helix8 ± 2 Unordered
23 ± 3 Unordered4 + 1 13-Sheet42 + 2 13-Sheet12 + 0 a-Helix6 + 1 a-Helix7 ± 0 Unordered9 ± 0 Unordered4 + 3 13-Sheet
62 + 3 13-Sheet
3 + 0 a-Helix10 + 1 a-Helix15 ± 1 Unordered3 ± 1 Unordered13 ± 1 Unordered15 ± 1 Unordered15 + 1 13-Sheet11 + 1 13-Sheet15 + 2 13-Sheet8 + 0 a-Helix
11 ± 0 Unordered23 ± 0 Unordered3 + 1 13-Sheet
55 + 0 13-Sheet
30 + 1 a-Helix1 ± 0 a-Helix
27 t 4 a-Helix15 ± 3 Unordered4 ± 1 Unordered
23 ± 1 Extended chain<1% 13-Sheet23 + 1 a-Helix7 + 0 a-Helix10 ± 1 Unordered4 ± 1 Unordered
SecondProtein derivative
1262 ± 11240 ± 11221 ± 0
Horse heart Cyt clSolution §
1315 ± 01300 ± 11283 ± 21276 ± 11264 ± 11244 ± 01235 ± 0
Powder §1312 ± 11303 ± 11284 ± 0-1270
1263 ± 01244 ± 11237 ± 0'1225
MbSolution 1319 ± 2
1314 ± 11296 ± 11279 ± 11270 ± 11247 ± 01233 ± 21221 ± 0
Powder 1311 ± 01301 ± 11284 ± 11261 ± 01245 ± 11233 ± 21221 ± 1
Zn-insulinSolution 1334 ± 2
1322 ± 11313 ± 11301 ± 11287 ± 11275 ± 11265 ± 11248 ± 01235 ± 1
Powder -13301313 ± 01299 ± 11287 ± 0
§1263 ± 11241 ± 11230 ± 0
Curve Area,fitting %*
1263 ± 01247 ± 11227 ± 0
1325 ± 21315 t 11298 ± 11282 ± 01274 t 11267 t 11243 ± 21233 ± 11325 ± 21310 ± 01298 ± 21284 ± 11272 ± 21261 ± 21249 ± 11239 ± 11225 ± 2
1322 ± 11308 ± 21294 ± 11282± 11270 ± 21247 ± 11230 ± 21222 ± 11312 ± 11298 ± 01282± 11259 ± 01247 ± 11236 ± 11218 ± 1
1332 ± 21322 ± 21313 ± 11299 ± 21285 ± 21275 ± 01265 ± 01249 ± 11237 ± 11327 ± 21312 ± 11294 ± 11281 ± 11274 ± 11265 ± 11251 ± 21232 ± 4
Assignmentt
11 ± 1 Unordered29 ± 1 Extended chain16 ± 1 ,3-Sheet
1 ± 1 a-Helix22 ± 2 a-Helix13 ± 2 a-Helix14 ± 2 Unordered1 ± 1 Unordered
19 ± 1 Unordered27 ± 3 Extended chain3 ± 2 13-Sheet5 ± 2 a-Helix12 ± 4 a-Helix6 ± 1 a-Helix14 ± 3 Unordered4 ± 2 Unordered20 ± 4 Unordered3 ± 2 Extended chain
23 ± 5 13-Sheet12 ± 2 13-Sheet
10 ± 3 a-Helix34 ± 3 a-Helix9 ± 2 a-Helix10 ± 4 Unordered20 ± 4 Unordered15 ± 2 Extended chain1 ± 1 13-Sheet1 ± 1 13-Sheet
21 ± 0 a-Helix7 ± 1 a-Helix
28 ± 1 Unordered17 ± 1 Unordered2 ± 1 Extended chain19 ± 0 13-Sheet6 ± 1 13-Sheet
7 ± 2 a-Helix3 ± 3 a-Helix8 ± 4 a-Helix
13 ± 2 a-Helix15 ± 3 Unordered3 ± 3 Unordered18 ± 5 Unordered17 ± 2 13-Sheet15 ± 3 13-Sheet4 ± 2 a-Helix8 ± 1 a-Helix
11 ± 1 a-Helix9 ± 0 Unordered3 ± 1 Unordered
13 ± 3 Unordered25 ± 7 13-Sheet27 ± 2 1-Sheet
*The ± values are the standard deviations calculated by analyzing three to five individual spectra in each case.tUnordered structures include turns and random coils. For a-helical proteins, the extended chain secondary structure is given individually to allowcomparison with FTIR results obtained in the amide I spectral region (17).*This component, visible as a shoulder in the second derivative spectra (see Fig. ID), was not amenable to the Gaussian curve fitting (see Fig. 2B)because of its weakness in the original spectra.§These components were not visible in the second derivative spectra. Nevertheless, the Gaussian curve fitting without them resulted in systematicdiscrepancies between the original spectra and the sums of the fitted bands. The components therefore had to be used.1Very similar parameters were obtained for tuna heart Cyt c (data not shown).
Biochemistry: Griebenow and Klibanov
Dow
nloa
ded
by g
uest
on
Apr
il 24
, 202
0

10972 Biochemistry: Griebenow and Klibanov
Table 2. Correlation coefficients and secondary structure contents for BPTI underdifferent conditions
Correlation Secondary structure, %Protein sample coefficient* a-Helix 13-Sheet Unorderedt
Aqueous solution*pH 3.5 1.0 21 ± 2 36 ± 2 43 ± 3pH 7.0 1.0 20 ± 2 43 ± 1 37 ± 3pH9.0 0.99 19±2 40± 1 41 ±3
Powder§Lyophilization 0.70 5 ± 2 55 ± 0 40 ± 2Co-lyophilization with sorbitol 1 13 ± 2 41 ± 2 46 ± 1Precipitation with acetone 1 2 ± 1 63 ± 4 35 ± 4Precipitation with propanol 0.51 4 ± 1 59 ± 1 37 ± 1Rotary evaporation 0.46 1 ± 1 72 ± 2 27 ± 1
Redissolved powderllLyophilization 0.99 20 ± 4 42 ± 2 38 ± 4Co-lyophilization with sorbitol 0.97 23 ± 2 42 ± 1 35 ± 3Precipitation with acetone -0.96 21 ± 3 40 ± 2 39 ± 4Precipitation with propanol 0.98 20 ± 3 40 ± 2 40 ± 4Rotary evaporation 0.99 25 ± 1 40 ± 2 35 ± 4
*All standard deviations for the correlation coefficients are below 2%. All correlation coefficients arecalculated (14, 15) for the amide III region vs. the aqueous solution at pH 3.5.tUnordered structures include turns and random coil secondary structural elements.tSolutions of BPTI in water.§A11 powders were obtained from aqueous solution at pH 3.5.tThe correlation coefficients of these samples could not be calculated. However, residual acetone andsorbitol in the pellets could be subtracted sufficiently to allow for the Gaussian curve fitting."For reconstitution, all dehydrated powders were redissolved in water and measured at pH 3.5 at the sameconcentration as the reference solutions.
significant bands at 1225-1240 cm-' (Table 1) typical forproteins containing 3-sheets (21). Since circular dichroismstudies indicate very low (-sheet contents for Cyt c and Mb(41), the 1246 cm-' band in these proteins was assigned to theextended chain secondary structures and bands at 1225-1240cm-1 to (3-sheet structural elements. For horse heart Cyt c, thecalculated a-helix content (36% ± 1%) agrees with thosederived from both x-ray data (36%) (32) and recent FTIR workusing Gaussian curve fitting of the amide I band (36%) (47).Our calculated (3-sheet content for this Cyt c (3%; Table 3) also
agrees with the x-ray (32) and circular dichroism data (41). Thesecondary structure compositions of oxidized horse and tunaheart Cyt c elucidated by our FTIR analysis coincide with thosefrom the x-ray analysis (32, 48). For Mb, our calculated a-helixcontent (53% ± 2%) is significantly below that estimated fromthe x-ray structure (80%) (28), although our calculated (3-sheetcontent (2%) agrees with the x-ray and circular dichroism data(41). The secondary structure calculated for rHA (58% ± 4%a-helix; 23% ± 1% extended chain) resembled x-ray estimates(67% a-helix; 33% turns and extended chain) (34).
Table 3. Secondary structure contents of various proteins
Secondary structure, %
Protein* Statet a-Helix ,3-Sheet UnorderedtBPTI Solution 21 ± 2 36 ± 2 43 ± 3
Powder 5 ± 2 55 t 0 40 ± 2rHA Solution 58 ± 4 0 42 ± 3
Powder 30 ± 1 16 ± 1 54 ± 2Mb Solution 53 ± 2 2 ± 1 45 ± 2
Powder 28 ± 1 25 ± 1 47 ± 2Horse heart Cyt c Solution 36 ± 1 3 ± 2 61 ± 5
Powder 23 ± 3 35 ± 2 42 ± 3Tuna heart Cyt c Solution 34 ± 2 2 ± 1 64 ± 2
Powder 19 ± 2 34 ± 3 47 ± 2RNase A Solution 23 ± 2 45 ± 2 32 ± 2
Powder 18± 1 66± 1 16± 1Chymotrypsinogen Solution 13 ± 1 41 ± 1 46 ± 1
Powder 8 ± 0 58 ± 1 34 ± 0Zn-insulin Solution 30 ± 3 32 ± 4 38 ± 2
Powder 23 ± 1 52 ± 5 25 ± 4
The secondary structures of proteins, both as an aqueous solution and as lyophilized powder, werecalculated from Gaussian curve fitting in the amide III band region.*For a discussion of the secondary structures calculated in this work compared with those from x-raystudies and other spectroscopic techniques, see Materials and Methods.tThe pH values of the protein aqueous solutions were as follows: 3.5 for BPTI, 7.3 for rHA, 7.0 for Mb,6.4 for both horse and tuna Cyt c, 5.7 for RNase A, 4.5 for chymotrypsinogen, and 4.0 for Zn-insulin.The protein powders were obtained by lyophilizing these aqueous solutions.*Unordered structures include turns, random coil, and extended chain secondary structural elements.
Proc. Natl. Acad. Sci. USA 92 (1995)
Dow
nloa
ded
by g
uest
on
Apr
il 24
, 202
0

Proc. Natl. Acad. Sci. USA 92 (1995) 10973
Our characterization of insulin yielded significantly lowera-helix and higher (3-sheet contents (30% and 32%, respec-
tively) than the x-ray structure (53% a-helix and 13% 3-sheet)(45, 49). This may be due to differences in the pH used in our
study and that for which the x-ray structure was determined(pH 6.6).The same assignments used for the solutions were employed
for the corresponding protein powders. Most spectra of de-hydrated proteins were simpler than those in aqueous solutionsdue to band broadening and disappearance of small bands(Table 1). Upon dehydration, some FTIR bands in the amideIII region undergo small shifts, as also observed for the amideI region (14, 15). Despite the observed band broadening indehydrated protein powders, the separation of individualbands is still sufficient for proper Gaussian curve fitting byusing the original vibrational spectra without resolution en-
hancement [required for the amide I quantification (18)].
RESULTS AND DISCUSSIONOur recent hydrogen isotope-exchange/high-resolution NMRwork (13) has unequivocally established that BPTI undergoessignificant reversible structural changes upon dehydration.However, the nature of these changes could not be quantified.Consequently, herein we employed an independent method-ology, FTIR spectroscopy, to address this issue in the same
system. FTIR spectroscopy is one of very few methods that
.>
a
co
~e0
0)
8
cc0s
a
co
Ie
1720 1680 1640 1600
wavenumber (cm-1)
allow for the quantification of protein secondary structuralelements in both the amorphous and solution states.
Initially, to confirm the perturbations in BPTI structureupon lyophilization, we compared the IR spectrum of the solidprotein with that in aqueous solution by using the secondderivative spectra in the amide I and III regions (Fig. 1). Thiswas accomplished by calculating the correlation coefficient r
(14, 15) for the spectrum of lyophilized BPTI by using that insolution as a reference (see Materials and Methods for details).The calculated values of r = 0.70 for the amide III region(Table 2) and r = 0.73 for the amide I region were very similar,thereby validating the use of the former spectral region.To appreciate the significance of a difference of some 0.3 in
the r values, we measured solution IR spectra of BPTI at twoadditional pH values, 7.0 and 9.0, and calculated the correla-tion coefficients vs. the solution at pH 3.5. The correlationcoefficients for the amide III and amide I regions, 1.0 and 0.99(Table 2) and 0.96 and 0.96 for pH 7.0 and 9.0, respectively, are
very close to unity, suggesting no appreciable structuralchanges, despite the 5.5-pH-unit variation. Hence, we con-
clude that r is not highly sensitive to structural alterations, sincechanges in the ionization state of ionogenic groups, whichcause spectral differences (50) and undoubtedly at least smallconformational perturbations, are not reflected in the calcu-lated numbers. Therefore, the r values obtained for lyophilizedBPTI, 0.70 in the amide III region, must represent ratherdrastic changes in the secondary structure. Thus, our analysis
1320 1280 1240 1200
wavenumber (cm-1)FIG. 1. Second derivative FTIR spectra (multiplied by -1) of BPTI in aqueous solution at pH 3.5 (A and C) and in the powder obtained by
lyophilization from that solution (B and D). The wavenumbers shown are the average values for the peaks and shoulders from five independentspectra. A and B depict the amide I region, and C and D depict the amide III spectral region.
1658±1 / 1643±1
1628±2
I
1645±1
B 1653±1
1660±2 \1670±2 \ 1615±1
1683±2 \ A1690±1~
1628±4I
Biochemistry: Griebenow and Klibanov
A
Dow
nloa
ded
by g
uest
on
Apr
il 24
, 202
0

10974 Biochemistry: Griebenow and Klibanov
of both spectral regions indicates that BPTI undergoes asignificant lyophilization-induced structural rearrangement.
Inspection of the second derivative spectra (Fig. 1) revealsadditional structural information not evident from the corre-lation coefficients. In the BPTI solution spectrum in the amideI region (Fig. 1A), two major bands at 1658 and 1643 cm-' areclearly visible. The former with a shoulder at 1665 cm-1 can beassigned to a-helix and random coil secondary structuralelements, respectively, whereas the latter arises from the/3-sheet (16, 51). BPTI lyophilized powder (Fig. IB) has onlyone major band in this spectral region at 1645 cm-'. Thesecond derivative spectrum of the aqueous solution of BPTI inthe amide III region (Fig. 1C) shows several well-resolvedbands, which were assigned to the secondary structural ele-ments according to Fu et al. (21) (Table 1). The major spectralchange upon lyophilization (Fig. 1D) is a significant broaden-ing (the full width at half maximum increased from 13 ± 1 to28 ± 2 cm-1) of the band at 1237 cm-l assigned to the /3-sheetstructural element. Comparison of Fig. 1 B and D demon-strates the superior band separation in the amide III region inthe solid state compared with that in the amide I region.
Inspection of the original spectra in the amide III regionqualitatively confirms the pronounced structural changes uponlyophilization (Fig. 2). The spectrum of lyophilized BPTI isdominated by a band at 1238 cm-' (Fig. 2B). The bandsoriginating from a-helix and unordered secondary structuralelements (1320-1263 cm-1), clearly visible in the solutionspectrum (Fig. 2A), appear only as shoulders in the lyophilizedpowder spectrum (Fig. 2B). This indicates a conversion froma-helix/unordered structure to /3-sheet structural elements.Comparison of the original and second derivative spectra
and the calculation of correlation coefficients, while instruc-tive, yield no quantitative information about variations in thea-helix and /3-sheet contents. To quantify the structuralchanges occurring upon lyophilization of BPTI, we performedGaussian curve fitting of the IR spectra in the amide III region(Fig. 2). The results (Table 2) reveal a drop in the a-helixcontent from 21% to 5% and a rise in the /3-sheet content from36% to 55% upon lyophilization. These data provide a quan-titative confirmation of the previous qualitative observations(13).
Desai et al. (13) further demonstrated that co-lyophilizationwith the lyoprotectant sorbitol lowered the magnitude of
Ag
e
o ~~d
a
3-~~~~~~2~
BPTI's structural rearrangement. We found (Table 2) thatBPTI co-lyophilized with sorbitol has a secondary structuresimilar to that observed in solution. In particular, the /3-sheetcontent is essentially the same, indicating that the protein core[which consists mainly of antiparallel /3-sheets (43, 44)] isconserved. Note, however, that the content of a-helices inBPTI, located on the periphery of the molecule (43, 44), is notfully conserved. The 13% a-helix content of BPTI in theco-lyophilizate with sorbitol is between that of the lyophilizedpowder (5%) and that in aqueous solution (21%). The calcu-lated correlation coefficients (for amide I region) also reflectthis partial structural preservation: 0.84 for the co-lyophilizatevs. 0.73 for BPTI lyophilized in the absence of sorbitol.To distinguish whether the observed structural changes in
BPTI are caused by the dehydration of the proteinperse or arespecific to lyophilization, we explored alternative drying meth-ods: precipitation with acetone or propanol and rotary evap-oration. When compared with the lyophilized powder, theresultant dried samples yielded correlation coefficients (Table2) indicative of larger structural changes. This is also seen inthe secondary structural compositions (Table 2). In particular,in the case of rotary evaporation, there is nearly twice as largean increase in the /3-sheet content when compared withlyophilization, and most of this rise comes from the drop in theunordered structure content. These findings are consistentwith those obtained by hydrogen isotope exchange/NMR (35),which demonstrated the superiority of lyophilization in con-serving BPTI's native structure compared with the alternativedehydration methods.Having established that BPTI's secondary structure under-
goes major rearrangements upon dehydration, an importantquestion was whether this phenomenon is reversible. Toanswer it, all dehydrated BPTI samples were redissolved inwater (pH 3.5), and their IR solution spectra were determined.The r values for these solutions vs. the protein solution priorto dehydration, as well as the secondary structure contents,show unequivocally (Table 2) that all dehydration-inducedstructural changes were fully reversible.Our BPTI data reveal that the a-helix content decreases and
the /3-sheet content increases upon dehydration. It was impor-tant to establish whether this is a general phenomenon. To thisend, we lyophilized 12 different proteins and quantified theirsecondary structural compositions from the IR spectra.
1350 1300 1250 1200 1350 1300 1250 1200
wavenumber (cm ) wavenumber (cm1)FIG. 2. FTIR spectra ofBPTI in aqueous solution at pH 3.5 (A) and the powder lyophilized from that solution (B) after the Gaussian curve-fitting
process. The results of the added Gaussian bands and the original spectra (solid lines) are superimposed and are nearly identical. The area of theindividual Gaussian bands (broken lines) has been used to calculate the secondary structure content. The individual bands were assigned as follows:(A) a, b, and c, a-helix; d and e, unordered; f and g, ,8-sheet; (B) a, a-helix; b and c, unordered; d and e, /3-sheet. The bands at -1205 cm-1 arenot an amide III vibration (21) and are presented solely for the fit. The band at around 1340 cm-' in the spectrum of the powder (B), which isof an unknown origin and not found in the BPTI spectrum in aqueous solution, was not assigned to any secondary structural element.
Proc. Natl. Acad. Sci. USA 92 (1995)
Dow
nloa
ded
by g
uest
on
Apr
il 24
, 202
0
Proc. Natl. Acad. Sci. USA 92 (1995) 10975
Among the proteins studied, there were seven forms of Cytc (from dog, rabbit, pigeon, chicken, bovine, horse, and tunahearts). Despite some differences in their primary structures,the IR spectra for the cytochromes were virtually identicalboth in solution and in the lyophilized states. The correlationcoefficients calculated for the Cyt c solutions vs. the one for thehorse heart Cyt c solution (pH 6.4) in the amide III region wereall >0.93 with the exception of tuna Cyt c (r = 0.87). Moreover,the correlation coefficients for the spectra of all lyophilizedCyt cs vs. the one for lyophilized horse Cyt c were all 20.97.Therefore, hereafter we consider only the FTIR data for thetwo most dissimilar cytochromes, those from horse and tunahearts.
Table 3 summarizes the secondary structures calculated foreight proteins in solution and in the lyophilized state. [We alsoquantified the secondary structural elements of the proteinsfollowing their reconstitution in water (data not shown) andestablished that all structural changes caused by lyophilizationwere reversible.] It is seen that all the proteins studiedexhibited pronounced secondary structural changes upon ly-ophilization: in every case, the a-helical content decreased andthe f3-sheet content increased significantly, although the mag-nitude of this effect varied among the proteins.Of the proteins studied, rHA exhibited the largest decrease
in a-helical content upon lyophilization, from 58% to 30%. Itsfl-sheet content rose from 0% to 16%, and the unorderedsecondary structure rose from 42% to 54%. It is noteworthythat rHA is the only protein in our study to exhibit an increasein unordered structure, indicating that this protein partiallyunfolds upon lyophilization.The data for Mb show a precipitous drop in the a-helix
content and a parallel increase in the fl-sheet content, whilethe fraction of unordered structures remains the same. Forboth cytochromes, significant decreases in the a-helical con-tent and =10-fold increases in fl-sheet content occurred upondehydration. The unordered structure of both cytochromesdecreased substantially, suggesting a higher structural order inthe lyophilized state. For RNase A, chymotrypsinogen, andinsulin, only minor decreases in the a-helix content but sub-stantial increases in the fl-sheet content took place uponlyophilization. For lyophilized insulin, these dehydration-induced structural changes are in line with recent Ramanspectroscopy findings comparing bovine Zn-insulin powderswith those dissolved in aqueous solutions (52). Note that for allthree proteins the percentage of the unordered structuresdrops upon lyophilization indicating an overall increase in thestructural order.For every protein studied, even those belonging to different
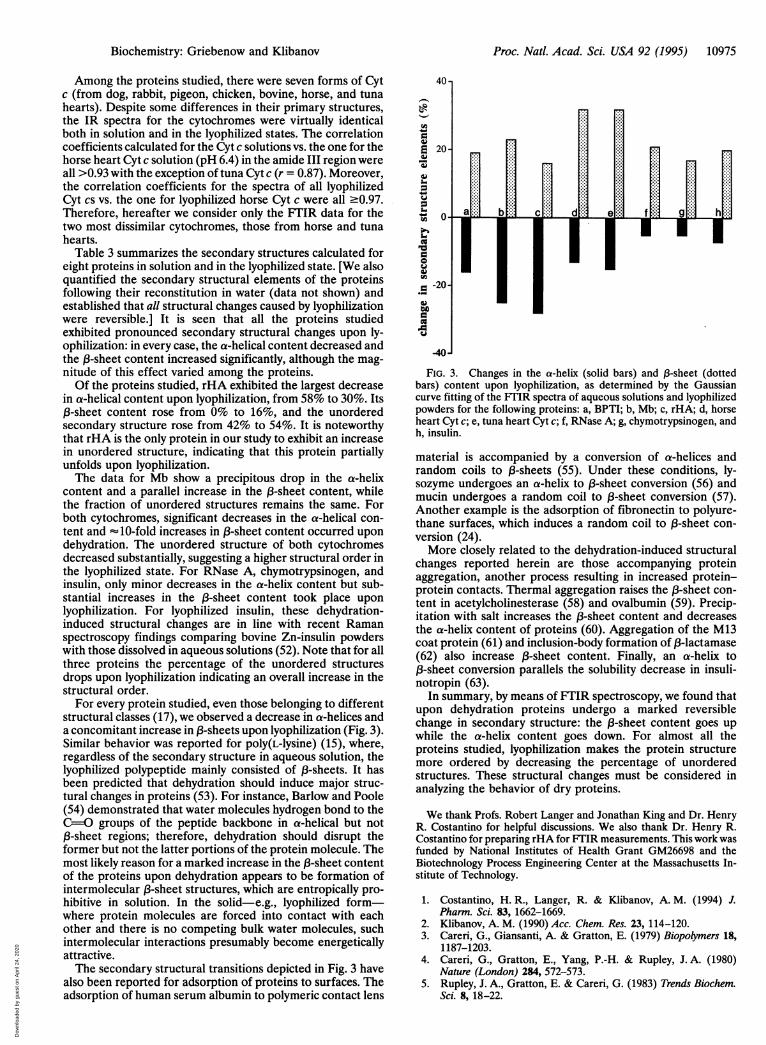
structural classes (17), we observed a decrease in a-helices anda concomitant increase in fl-sheets upon lyophilization (Fig. 3).Similar behavior was reported for poly(L-lysine) (15), where,regardless of the secondary structure in aqueous solution, thelyophilized polypeptide mainly consisted of fl-sheets. It hasbeen predicted that dehydration should induce major struc-tural changes in proteins (53). For instance, Barlow and Poole(54) demonstrated that water molecules hydrogen bond to theC=O groups of the peptide backbone in a-helical but notfl-sheet regions; therefore, dehydration should disrupt theformer but not the latter portions of the protein molecule. Themost likely reason for a marked increase in the fl-sheet contentof the proteins upon dehydration appears to be formation ofintermolecular fl-sheet structures, which are entropically pro-hibitive in solution. In the solid-e.g., lyophilized form-where protein molecules are forced into contact with eachother and there is no competing bulk water molecules, suchintermolecular interactions presumably become energeticallyattractive.The secondary structural transitions depicted in Fig. 3 have
also been reported for adsorption of proteins to surfaces. Theadsorption of human serum albumin to polymeric contact lens
1-
200
a:: b c d e f g9 h
0-PC
'0
-20-
FIG. 3. Changes in the a-helix (solid bars) and 13-sheet (dottedbars) content upon lyophilization, as determined by the Gaussiancurve fitting of the FTIR spectra of aqueous solutions and lyophilizedpowders for the following proteins: a, BPTI; b, Mb; c, rHA; d, horseheart Cyt c; e, tuna heart Cyt c; f, RNase A; g, chymotrypsinogen, andh, insulin.
material is accompanied by a conversion of a-helices andrandom coils to fl-sheets (55). Under these conditions, ly-sozyme undergoes an a-helix to fl-sheet conversion (56) andmucin undergoes a random coil to fl-sheet conversion (57).Another example is the adsorption of fibronectin to polyure-thane surfaces, which induces a random coil to fl-sheet con-version (24).More closely related to the dehydration-induced structural
changes reported herein are those accompanying proteinaggregation, another process resulting in increased protein-protein contacts. Thermal aggregation raises the fl-sheet con-tent in acetylcholinesterase (58) and ovalbumin (59). Precip-itation with salt increases the fl-sheet content and decreasesthe a-helix content of proteins (60). Aggregation of the M13coat protein (61) and inclusion-body formation of P-lactamase(62) also increase f-sheet content. Finally, an a-helix tofl-sheet conversion parallels the solubility decrease in insuli-notropin (63).
In summary, by means of FTIR spectroscopy, we found thatupon dehydration proteins undergo a marked reversiblechange in secondary structure: the f-sheet content goes upwhile the a-helix content goes down. For almost all theproteins studied, lyophilization makes the protein structuremore ordered by decreasing the percentage of unorderedstructures. These structural changes must be considered inanalyzing the behavior of dry proteins.
We thank Profs. Robert Langer and Jonathan King and Dr. HenryR. Costantino for helpful discussions. We also thank Dr. Henry R.Costantino for preparing rHA for FTIR measurements. This work wasfunded by National Institutes of Health Grant GM26698 and theBiotechnology Process Engineering Center at the Massachusetts In-stitute of Technology.
1. Costantino, H. R., Langer, R. & Klibanov, A. M. (1994) J.Pharm. Sci. 83, 1662-1669.
2. Klibanov, A. M. (1990) Acc. Chem. Res. 23, 114-120.3. Careri, G., Giansanti, A. & Gratton, E. (1979) Biopolymers 18,
1187-1203.4. Careri, G., Gratton, E., Yang, P.-H. & Rupley, J. A. (1980)
Nature (London) 284, 572-573.5. Rupley, J. A., Gratton, E. & Careri, G. (1983) Trends Biochem.
Sci. 8, 18-22.
Biochemistry: Griebenow and Klibanov
Dow
nloa
ded
by g
uest
on
Apr
il 24
, 202
0

10976 Biochemistry: Griebenow and Klibanov
6. Rupley, J. A. & Careri, G. (1991)Adv. Protein Chem. 41, 37-172.7. Schinkel, J. E., Downer, N. W. & Rupley, J. A. (1985) Biochem-
istry 24, 352-366.8. Baker, L. J., Hansen, A. M. F., Rao, P. B. & Bryan, W. P. (1983)
Biopolymers 22, 1637-1640.9. Yu, N.-T. & Jo, B. H. (1973) Arch. Biochem. Biophys. 156,
469-474.10. Poole, P. L. & Finney, J. L. (1983) Int. J. Biol. Macromol. 5,
308-310.11. Poole, P. L. & Finney, J. L. (1983) Biopolymers 22, 255-260.12. Gregory, R. B., Gangoda, M., Gilpin, R. K. & Su, W. (1993)
Biopolymers 33, 513-519.13. Desai, U. R., Osterhout, J. J. & Klibanov, A. M. (1994) J. Am.
Chem. Soc. 116, 9420-9422.14. Prestrelski, S. J., Arakawa, T. & Carpenter, J. F. (1993) Arch.
Biochem. Biophys. 303, 465-473.15. Prestrelski, S. J., Tedischi, N., Arakawa, T. & Carpenter, J. F.
(1993) Biophys. J. 65, 661-671.16. Surewicz, W. K. & Mantsch, H. H. (1988) Biochim. Biophys. Acta
952, 115-130.17. Byler, D. M. & Susi, H. (1986) Biopolymers 25, 469-487.18. Dong, A., Prestrelski, S. J., Allison, D. & Carpenter, J. F. (1995)
J. Pharm. Sci. 84, 415-424.19. Singh, B. R., Fuller, M. P. & Schiavo, G. (1990) Biophys. Chem.
46, 155-166.20. Singh, B. R., DeOliveira, D. B., Fu, F.-N. & Fuller, M. P. (1993)
SPIE 1890 (Biomol. Spectr. III), 47-55.21. Fu, F.-N., DeOliveira, D. B., Trumple, W. R., Sakar, H. K. &
Singh, B. R. (1994) Appl. Spectrosc. 48, 1432-1441.22. Kaiden, K., Matsui, T. & Tanaka, S. (1987) Appl. Spectrosc. 41,
180-184.23. Kato, K, Matsui, T. & Tanaka, S. (1987) Appl. Spectrosc. 41,
861-865.24. Pitt, W. G., Spiegelberg, S. H. & Cooper, S. L. (1987) in Proteins
at Interfaces, eds. Brush, J. L. & Horbett, T. A. (Am. Chem. Soc.,Washington, DC), pp. 324-338.
25. Wasacz, F. M., Ohlinger, J. M. & Jakobsen, R. J. (1987) Bio-chemistry 26, 1464-1470.
26. Jakobsen, R. J. & Wasacz, F. M. (1987) in Proteins at Interfaces,eds. Brush, J. L. & Horbett, T. A. (Am. Chem. Soc., Washington,DC), pp. 339-361.
27. Singh, B. R., Fu, F.-N. & Ledoux, D. N. (1994) Struct. Biol. 1,358-360.
28. Evans, S. V. & Brayer, G. D. (1990) J. Mol. Biol. 213, 885-897.29. Sherwood, C., Mauk, A. G. & Brayer, G. D. (1987) J. Mol. Biol.
193, 227.30. Wang, D., Bode, W. & Huber, R. (1985) J. Mol. Biol. 185,
595-624.31. Carlisle, C. H., Palmer, R. A., Mazumdar, S. K, Gorinsky, B. A.
& Yeates, D. G. (1974) J. Mol. Biol. 85, 1-18.32. Bushnell, G. W., Louie, G. V. & Brayer, G. D. (1990)J. Mol. Biol.
214, 585-595.33. Costantino, H. R., Langer, R. & Klibanov, A. M. (1995) Biol
Technology 13, 493-496.
34. He, X. M. & Carter, D. C. (1992) Nature (London) 358, 209-215.35. Desai, U. R. & Klibanov, A. M. (1995) J. Am. Chem. Soc. 117,
3940-3945.36. Singh, B. R. & Fuller, M. P. (1991) Appl. Spectrosc. 45, 1017-
1021.37. Carpenter, J. F. & Crowe, J. H. (1989) Biochemistry 28, 3916-
3922.38. Susi, H. & Byler, D. M. (1983) Biochem. Biophys. Res. Commun.
115, 391-397.39. Susi, H. & Byler, D. M. (1986) Methods Enzymol. 130, 291-311.40. Abbott, T. P., Wolf, W. J., Wu, Y. V., Butterfield, R. 0. &
Kleiman, R. (1991) Appl. Spectrosc. 45, 1665-1673.41. Provencher, S. W. & Glockner, J. (1981) Biochemistry 20, 33-37.42. Chen, Y.-H., Yang, J. T. & Martinez, H. M. (1972) Biochemistry
11, 4120-4131.43. Huber, R., Kukla, D., Ruhlmann, A., Epp, 0. & Formanek, H.
(1970) Naturwissenschaften 57, 389-392.44. Deisenhofer, J. & Steigemann, W. (1975) Acta Crystallogr. B 31,
238-250.45. Levitt, M. & Greer, J. (1977) J. Mol. Biol. 114, 181-293.46. Freer, S. T., Kraut, J., Robertus, J. D., Wright, H. T. & Xuong,
N. H. (1970) Biochemistry 9, 1997-2009.47. Heimburg, T. & Marsh, D. (1993) Biophys. J. 65, 2408-2417.48. Takano, T. & Dickerson, R. E. (1981) J. Mol. Biol. 153, 95-115.49. Blundell, T. L., Dodson, G., Hodkin, D. & Mercola, D. (1972)
Adv. Protein Chem. 26, 279-402.50. Venyaminov, S. Y. & Kalnin, N. N. (1990) Biopolymers 30, 1243-
1257.51. Ohlinger, J. M., Hill, D. M., Jakobsen, R. J. & Brody, R. S. (1986)
Biochim. Biophys. Acta 869, 89-98.52. Yeo, S.-D., DeBenedetti, P. G., Patro, S. Y. & Przybycien, T. M.
(1994) J. Pharm. Sci. 83, 1651-1656.53. Kuntz, I. D., Jr., & Kauzmann, W. (1974) Adv. Protein Chem. 28,
239-345.54. Barlow, D. J. & Poole, P. L. (1987) FEBS Lett. 213, 423-427.55. Castillo, E. J., Koenig, J. L., Anderson, J. M. & Lo, J. (1984)
Biomaterials 5, 319-325.56. Castillo, E. J., Koenig, J. L., Anderson, J. M. & Lo, J. (1985)
Biomaterials 6, 338-345.57. Castillo, E. J., Koenig, J. L., Anderson, J. M. & Jentoft, N. (1986)
Biomaterials 7, 9-15.58. Gorne-Tschelnokow, U., Naumann, D., Weise, C. & Hucho, F.
(1993) Eur. J. Biochem. 213, 1235-1242.59. Kato, A. & Takagi, T. J. (1988)Agric. Food Chem. 36, 1156-1159.60. Przybycien, T. M. & Bailey, J. E. (1989) Biochim. Biophys. Acta
995, 231-245.61. Spruijt, R. B., Wolfs, C. J. A. & Hemminga, M. A. (1989) Bio-
chemistry 28, 9158-9165.62. Przybycien, T. M., Dun, J. P., Valax, P. & Georgiou, G. (1994)
Protein Eng. 7, 131-136.63. Kim, Y., Rose, C. A., Liu, Y., Ozaki, Y., Datta, G. & Tu, A. T.
(1994) J. Pharm. Sci. 83, 1175-1180.
Proc. Natl. Acad. Sci. USA 92 (1995)
Dow
nloa
ded
by g
uest
on
Apr
il 24
, 202
0


![[Thomas a. Jennings] Lyophilization Introduction (BookFi.org)](https://static.fdocuments.in/doc/165x107/55cf94c3550346f57ba4379a/thomas-a-jennings-lyophilization-introduction-bookfiorg.jpg)