Recklessness in context: Individual and situational ...
29
Rollins College Rollins Scholarship Online Faculty Publications 1-2010 Recklessness in context: Individual and situational correlates to aggressive driving Paul B. Harris Rollins College, [email protected] John M. Houston Rollins College, [email protected] Follow this and additional works at: hp://scholarship.rollins.edu/as_facpub Part of the Psychology Commons is Article is brought to you for free and open access by Rollins Scholarship Online. It has been accepted for inclusion in Faculty Publications by an authorized administrator of Rollins Scholarship Online. For more information, please contact [email protected]. Published In Harris, P. B., & Houston, J. M. (2010). Recklessness in context: Individual and situational correlates to aggressive driving. Environment and Behavior, 42(1), 44-60. doi:10.1177/0013916508325234
Transcript of Recklessness in context: Individual and situational ...

Rollins CollegeRollins Scholarship Online
Faculty Publications
1-2010
Recklessness in context: Individual and situationalcorrelates to aggressive drivingPaul B. HarrisRollins College, [email protected]
John M. HoustonRollins College, [email protected]
Follow this and additional works at: http://scholarship.rollins.edu/as_facpub
Part of the Psychology Commons
This Article is brought to you for free and open access by Rollins Scholarship Online. It has been accepted for inclusion in Faculty Publications by anauthorized administrator of Rollins Scholarship Online. For more information, please contact [email protected].
Published InHarris, P. B., & Houston, J. M. (2010). Recklessness in context: Individual and situational correlates to aggressive driving.Environment and Behavior, 42(1), 44-60. doi:10.1177/0013916508325234
Recklessness in Context 1
Running head: RECKLESSNESS IN CONTEXT
Recklessness in Context: Individual and Situational Correlates to Aggressive Driving
Paul B. Harris and John M. Houston
Rollins College
Keywords: aggressive driving, unsafe driving, transactional world view, physical environment,
personality

Recklessness in Context 2
Abstract
Traffic related injury and fatality are major health risks in the United States and worldwide. One
contributor to road accidents is unsafe and aggressive driving practices. We examined individual
and situational aspects of aggressive driving by having 152 undergraduate students complete
self-report measures. Aggressive driving was related to personality variables such as hostility,
sensation seeking, and competitiveness, as well as to social variables such as driving without
passengers and characteristics of the target vehicle (e.g., passengers, age, and status of driver),
environmental variables (e.g., type of road, traffic, and weather), and temporal variables (e.g.,
time pressure and time of day).

Recklessness in Context 3
Recklessness in Context: Individual and Situational Correlates to Aggressive Driving
Historically, technological advancement has provided people with new ways of hurting
themselves and each other. During the late 19th and early 20th centuries, the development and
mass marketing of affordable automobiles paved the way for the very modern problems of
unsafe and aggressive driving. As early as 1885, the first year of the gasoline engine automobile,
inventor Karl Benz was overcome by the speed of his creation and crashed into a brick wall
(Panati, 1984). In the subsequent 123 years, both speed and accidents have increased as rapidly
as the popularity of the automobile itself.
Today, traffic accidents and deaths constitute a major worldwide health crisis. According
to the World Health Organization (WHO), traffic injuries account for about one quarter of global
injury related deaths (Peden et al., 2004). The WHO listed road traffic injuries as the ninth
leading cause worldwide of disability-adjusted life years lost and estimated that by 2020
accidents will be ranked as the third leading cause, under ischaemic heart disease and unipolar
major depression (Peden et al., 2004). In the United States, the National Highway Traffic Safety
Administration (NHTSA, 2007) reported that, in 2005, there were 6,159,000 police-reported
crashes resulting in 2,699,000 injuries and 43,442 deaths. In addition to the costs in human life
and suffering, the NHTSA (2007) estimated that the economic cost for crashes in 2005 was
230.6 billion dollars.
Although traffic accidents have a variety of causes, one contributor is unsafe and
aggressive driving behaviors. Our study examined individual and situational variables related to
aggressive driving. During the past decade, the bulk of the research examining psychological
aspects of aggressive driving has involved self-report measures. Many of these studies
conceptualized aggressive driving in terms of hostile emotions behind the wheel (Blanchard,
Barton, & Malta, 2000; Deffenbacher, Oetting, & Lynch, 1994; Ellison-Potter, Bell &

Recklessness in Context 4
Deffenbacher, 2001; Guofeng & Cundao, 2003; Wiesenthal, Hennessy, & Gibson, 2000) or
disruptive cognitive states such as driver stress, aggressive thoughts, or coping responses to
driving environments (Glendon et al., 1993; Mathews et al., 1998; Mathews, Tsuda, Xin, &
Ozeki, 1999). Our study adopted a third approach that emphasized self-reported aggressive
driving behavior (Aberg & Rimmo, 1998; Baxter et al, 1990; Houston, Harris, & Norman 2003;
Schreer, 2002). Based on this perspective, aggressive driving represents a pattern of unsafe
driving behaviors which can be assessed without reference to possible emotional or motivational
states. Accordingly, aggressive driving is operationally defined as the reported frequencies of
specific driving behaviors. For example, Houston, Harris, and Norman (2003) defined aggressive
driving as “a dysfunctional pattern of social behaviors that constitutes a serious threat to public
safety” (p. 269). In our study we utilized Houston et al. (2003) Aggressive Driving Behavior
Scale which operationalizes aggressive driving as “conflict behaviors” that are clearly directed
towards others (e.g., horn honking, rude gestures, accelerating to prevent passing) and “speeding
behaviors” (e.g., driving fast, close passing, tailgating) that may not be directed towards a
specific target but are still potentially injurious to the driver, other motorists, and pedestrians.
In our study, we adopted several precepts of the “transactional world view” (Altman &
Rogoff, 1987; Werner, Brown, & Altman, 2002). Altman and Rogoff (1987) defined the
transactional approach as, “the study of the changing relations among psychological and
environmental aspects of holistic unities” (p. 24). Aspects include people (social aspects), place
(environmental aspects), psychological processes (psychological aspects) and time (temporal
aspects). Although our research does not conform to a transactional approach in a number of
fundamental ways, we did utilize the four “aspects” of this approach in order to provide a more
holistic explanation of aggressive driving (see Figure 1).
The psychological factors in our study consisted of individual difference or personality

Recklessness in Context 5
variables. As illustrated in Figure 1, these variables included hostility, sensation seeking,
competitiveness, and gender. Hostile individuals may be more likely to drive aggressively
(Galovski & Blanchard, 2002; Norris, Matthews, & Riad, 2000) in that they are more easily
angered while driving (DePasquale, Geller, Clarke, & Littleton, 2001) and this anger increases
the probability of aggressive behavior behind the wheel (Deffenbacher, Huff, Lynch, Oetting, &
Salvatore, 2000). Sensation seekers may also be more likely to drive aggressively (Arnett, Offer,
& Fine, 1997; Dahlen, Martin, Ragan, & Kuhlman, 2005; Jonah, Thiessen, & Au-Yeung, 2001;
Matthews et al., 1999; Nell, 2002) in an attempt to alleviate boredom or as a means of thrill and
adventure seeking (i.e., aggressive driving is a form of “entertainment”). Competitive individuals
may perceive aggressive driving, such as speeding and unsafe passing, as a means to “win” or
compete against other drivers (Blanchard et al., 2000; Houston et al., 2003). Finally, with regard
to gender, young male drivers are at greater risk for accidents both in the United States (NHTSA,
2007) and worldwide (Peden et al., 2004); one potential cause for accidents is aggressive and
unsafe driving. In fact, males report more extreme forms of aggressive driving behavior such as
verbal confrontation or throwing objects (Blockey & Hartley, 1995; Hennessy & Wiesenthal,
1999; Simon & Corbett, 1996) and express more positive attitudes towards aggression than
females (Knight, Fabes, & Higgins, 1996). However, male and female drivers report comparable
levels of mild aggressive driving such as horn honking and tailgating.
In our study we examined two sets of social variables: the presence or absence of
passengers in the driver’s vehicle and social aspects of the target vehicle (i.e., the vehicle
towards which aggression is directed). Preusser, Fergusen, and Williams, (1998) reported that the
presence of passengers may increase accident risk for drivers under the age of 24, while Conner,
Smith, and McMillan (2003) found that young male drivers with male passengers are more
susceptible to social pressures to speed. In contrast to these findings, Shinar and Compton (2004)

Recklessness in Context 6
observed a more varied sample and found that the presence of passengers was related to
decreases in aggressive driving. Still other research by Baxter et al. (1990) indicated that
different types of passengers may affect different unsafe driving practices (e.g., older female
passengers decreased speeding but also decreased use of turn signals when changing lanes). At
this time, it appears that the role of passengers is not a simple one.
With the exception of status, there is very little research on target vehicle variables. With
regard to gender, research on other forms of aggression might lead us to expect that aggressive
driving would be most likely directed by men toward men (Daly & Wilson, 1988). However,
Asbridge, Smart, and Mann (2004) found no gender differences in the targets of road rage. With
regard to age and passengers, aggression towards elderly target drivers, or target vehicles
containing children as passengers, would violate social norms concerning these age groups. With
regard to target vehicle status, Doob and Gross (1968) found that lower status vehicles hesitating
at a green light were more likely that higher status vehicles to receive horn honks. However,
McGarva and Steiner (2000) failed to find status differences in retaliatory aggression when
participants were the target of honking by high or low status vehicles.
Although there are a variety of environmental factors that could increase aggressive
behaviors, many of these variables may not be salient to drivers or memorable when drivers self-
report aggressive behavior. Heat, for example, has been linked to aggression (Anderson, 1989)
and aggressive driving (Kenrick & MacFarlane, 1986) but it may not be realistic to expect
drivers to accurately recall whether they used their horns more or less in hot weather. In our
study we attempted to assess three environmental conditions that should be salient and
memorable to drivers: type of road (residential, commercial, interstate), traffic (light versus
heavy) and weather conditions (clear, rain, fog). Given the general literature on crowding, stress,
and aggression (Baum & Paulus, 1987), along with specific research on aggressive driving

Recklessness in Context 7
(Hennessy & Wiesenthal, 1999; Shinar, 1998; Shinar & Compton, 2004), we would expect
greater levels of aggressive and unsafe practices in high traffic, high stress conditions. Given the
increased traffic, aggression may also be more likely to occur on highway and 4-lane commercial
roads as opposed to residential roads. Social norms may also discourage aggressive driving in
residential neighborhoods. With regard to weather, Edwards (1999) found that drivers decrease
speeds under rainy and misty conditions. Because aggressive driving in inclement weather adds a
level of risk to both driver and target, it should be less likely than when the weather is clear.
Temporal variables in our study included time pressure and time of day. The role of
traffic congestion in aggressive driving, discussed earlier, may interact with time pressure to
increase aggressive driving (Karlberg, Unden, Elofsson, & Krakau, 1998; Shinar, 1998; Shinar,
Bourla, & Kaufman, 2004; Shinar & Compton, 2004). This is consistent with the literature on
aggression resulting from stress and frustration (Berkowitz, 1989; Geen, 1998). When time
pressured, as happens during rush hour, drivers may be frustrated by obstacles preventing them
from reaching their destination. When these obstacles turn out to be other drivers, conditions are
ripe for aggression. Time of day is linked to rush hour, congestion, and time pressure. In the
United States in 2005, the highest number of crashes within a given 3-hour period was 3:00 to
6:00 pm, corresponding to the afternoon rush hour (NHTSA, 2007).
In summary, we have hypothesized that aggressive driving will be related to individual
differences as well as to a variety of social, environmental, and temporal variables.
Method
Participants
Our participants were 152 undergraduate students (93 female and 59 male) at a small
liberal arts college. Participants ranged in age from 18 to 22 years, with a mean age of 19.70 (SD
= 1.07). Just over one third (36.7%) of participants reported that most of their driving experience

Recklessness in Context 8
was on the highway, with the remaining 63.3% reporting more experience with city driving.
Length of driving experience ranged from 1 to 8 years (M = 3.76, SD = 1.49).
Measures
We measured aggressive driving using the Aggressive Driving Behavior Scale (Houston,
Harris, & Norman, 2003) which includes two subscales: the Conflict Behavior Scale (aggressive
behaviors clearly directed towards other drivers) and the Speeding Scale (behaviors of drivers
who typically drive at higher speeds).
We administered four personality scales to predict aggressive driving. Hostility was
measured using Cook Medley Hostility Scale (Cook & Medley, 1954). Sensation seeking was
measured using two subscales from Form V of the Sensation Seeking Scale (Zuckerman,
Eysenck, & Esenck, 1978): the Thrill and Adventure Seeking Scale (people who seek out high
intensity sensory experiences) and the Boredom Susceptibility Scale (people who have a low
tolerance for low sensory situations). Competitiveness was measured using the Revised
Competitiveness Index (Houston, Harris, McIntire, & Francis, 2002).
We developed a questionnaire to measure the relationship of situational conditions to two
aggressive driving behaviors: horn honking and tailgating. These two behaviors were selected to
reflect the two subscales of the Aggressive Driving Behavior Scale (Houston et al., 2003).
Conflict Behavior was represented by the Horn Honking item, “honking when another driver
does something inappropriate.” The Speeding Scale was represented by the Tailgaiting item,
“following a slower car at less than a car length.”
For both Horn Honking and Tailgating items, we asked participants how likely they
would be to engage in the behavior under a variety of social, environmental, and temporal
conditions using a 7-point scale (1 = “not at all likely” to 7 = “very likely”). Social conditions
included Passengers (participant alone or with passengers) as well as aspects of the “target
Recklessness in Context 9
vehicle” (i.e., the vehicle that is the target of the aggressive acts). Target vehicle conditions
included Target Passengers (driver is alone, adult passengers, or juvenile passengers), Target
Gender, Target Age (driver is young, middle aged, or elderly), and Target Status as indicated by
a vehicle (appears expensive or inexpensive). Environmental conditions included Type of Road
(interstate, 4-lane commercial, or 2-lane residential roads), Traffic (light or heavy traffic), and
Weather (clear, raining, or foggy). Temporal conditions included Time Pressure (participant is
pressed for time or not) and Time of Day (morning, afternoon, or evening).
Results
Analysis of Individual Difference Variables
After participant Gender was dummy coded (Cohen & Cohen, 1983) with female as “0”
and male as “1”, we used two separate multiple regression analyses with simultaneous entry of
Gender and the other individual difference measures to predict the Conflict Behavior and
Speeding Scales of the Aggressive Driving Behavior Scale (Houston, et al, 2003). The results
from the two analyses are presented in Table 1.
Simple correlations indicated that scores on the Conflict Behavior Scale were positively
related to scores on Hostility, Boredom Susceptibility, and Competitiveness, and to being male.
However, only Hostility and Boredom Susceptibility remained as significant predictors in the
multiple regression analysis. The regression model predicting the Conflict Behavior Scale
explained 17% (adjusted R2) of the variance, F(5, 145) = 7.04, p < .01.
For the Speeding Scale, simple correlations indicated positive relationships with
Hostility, Thrill and Adventure Seeking, Boredom Susceptibility, and Competitiveness.
However, only Hostility, Thrill and Adventure Seeking, and Boredom Susceptibility remained as
significant predictors in the multiple regression analysis. The regression model predicting the
Speeding Scale explained 19% (adjusted R2) of the variance, F(5, 145) = 7.99, p < .01.

Recklessness in Context 10
Analysis of Situational Variables
We analyzed the situational variables using a series of mixed-model analyses of variance.
Different situational conditions were the within-subjects factors while Gender of participant was
the between-subjects factor. Analyses were conducted separately for Horn Honking and
Tailgating items. Means for these analyses are presented in Tables 2 through 5.
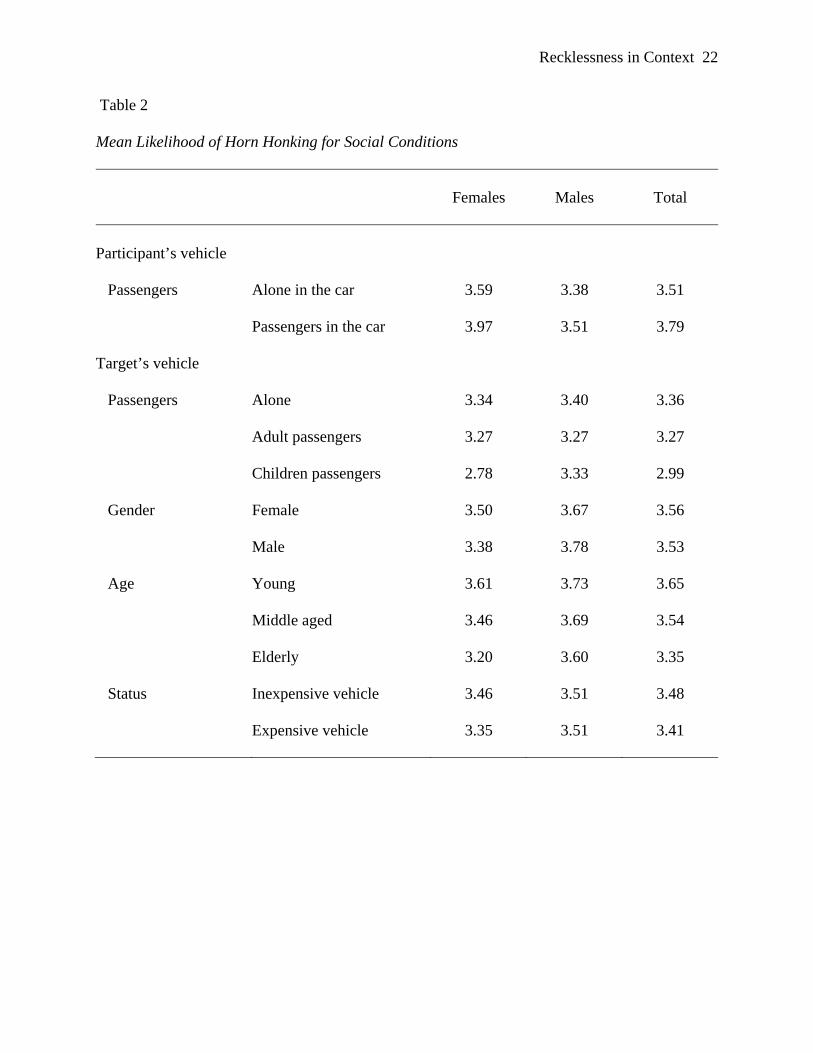
Horn Honking means for the Social items are presented in Table 2. A marginal effect for
Passengers indicated that participants reported more honking when alone than when others were
in the car, F(1, 144) = 3.83, p = .052. A significant main effect for Target Passengers, F(2, 288)
= 7.81, p < .01, was qualified by an interaction, F(2, 288) = 6.71, p < .01, with women reporting
significantly less honking when children were passengers in the target vehicle. A significant
main effect for Target Age indicated that participants were less likely to honk at elderly drivers,
F(2, 290) = 3.54, p = .03. There were no effects for Target Gender and Status.
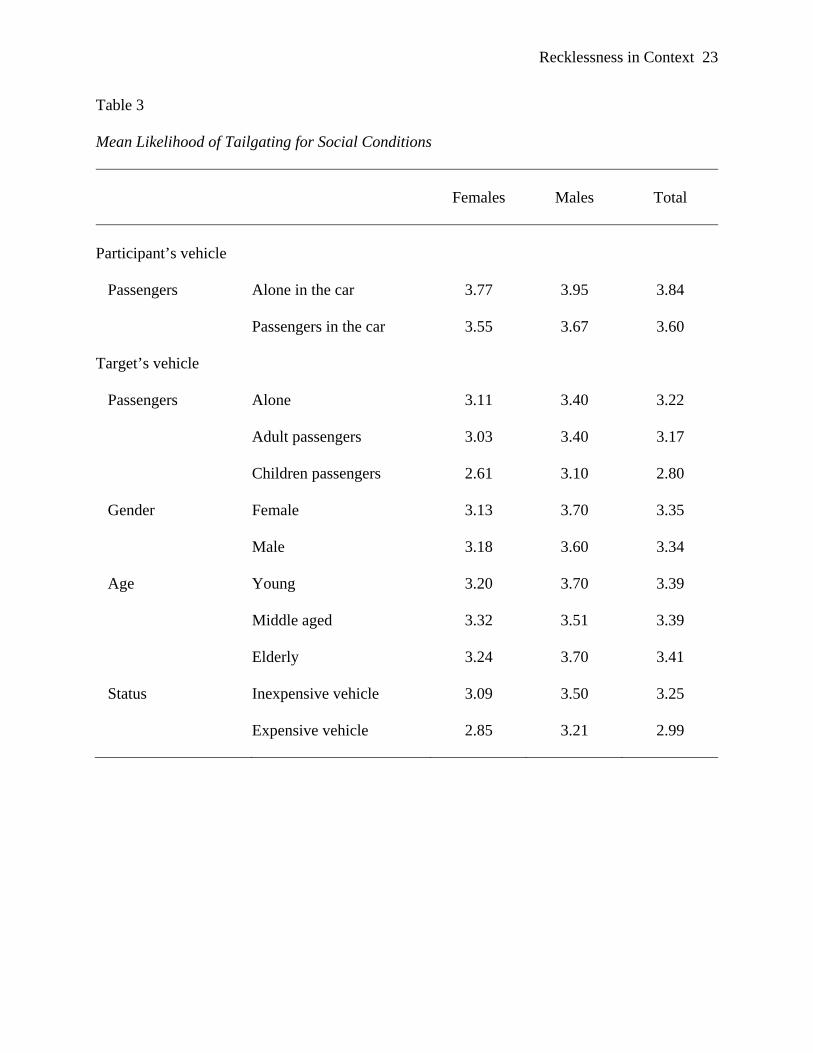
Tailgating means for the Social items are presented in Table 3. Although participants
reported more tailgaiting when alone, this effect was not significant, F(1, 149) = 3.22, p = .075.
There was a significant effect for Target Passengers, with participants reporting less Tailgaiting
when children were in the target vehicle F(2, 296) = 10.73, p < .01. There was also an effect for
Target Status with participants reporting greater reluctance to tailgate expensive vehicles F(1,
149) = 8.35, p < .01. Although there were no situational effects for Target Age and Gender, there
was a participant Gender effect for Target Gender, with men reporting higher scores on this
question regardless of Target Gender designation, F(1, 148) = 3.96, p = .048.
Horn Honking and Tailgaiting means for the Environmental items are presented in Table
4. For Horn Honking, a significant effect for Type of Road indicated more honking on smaller
roads as opposed to the highway driving, F(2, 290) = 4.62, p = .011. Participants also reported
more honking when Traffic was heavy F(1, 145) = 11.46, p < .01. The main effect for Traffic
Recklessness in Context 11
was qualified by an interaction which indicated that increased honking in heavy traffic was
particularly pronounced among women, F(1, 145) = 4.33, p = .04. There were no significant
Horn Honking effects for Weather. For Tailgating, there were effects for Type of Road, F(2,
298) = 16.96, p < .01, Traffic, F(1, 149) = 18.31, p < .01, and Weather, F(2, 296) = 59.25, p <
.01. Participants reported that they were more likely to Tailgate on smaller roads, in heavier
traffic, and when the weather was clear as opposed to rainy or foggy.
Horn Honking and Tailgaiting means for the Temporal items are presented in Table 5.
For Horn Honking, a significant main effect for Time Pressure, F(1, 145) = 97.21, p < .01, was
qualified by a marginal interaction effect, F(1, 145) = 3.82, p = .053. Both men and women
reported more honking when pressed for time, but this behavior was somewhat more pronounced
among women. A main effect for time of day, F(2, 290) = 5.45, p < .01, indicated that
participants were less likely to honk in the morning. For Tailgating, participants reported that
they were more likely to tailgate when pressured for time, F(1, 148) = 53.14, p < .01, and less
likely to tailgate in the morning, F(2, 294) = 7.30, p < .01.
Discussion
Using a framework drawn from the transactional world view (Altman & Rogoff, 1987;
Werner et al., 2002), we tried to account for an array of variables and illustrate the pattern of our
results for aggressive driving. This pattern of results is illustrated in Figure 2. Conflict
Behavior/Horn Honking was characterized by hostile and easily bored drivers under time
pressure while driving alone in heavy traffic on smaller roads during the afternoon or evening.
Time pressure and traffic appeared to be somewhat more of an issue for female drivers. Honking
was more likely to be directed toward non-elderly targets and, if the driver was female, less
likely if there were children in the target vehicle. Speeding/Tailgating was characterized by
hostile, easily bored, thrill seekers, driving under time pressure in heavy traffic on smaller roads

Recklessness in Context 12
during the afternoon or evening. These drivers were more likely to show restraint if the weather
was poor, if children were riding in the target vehicle, and if the target vehicle was expensive.
Our study is consistent with some of the previous research while adding some new
information to the literature. For example, our findings support literature on the link between
aggressive driving and such variables as driver hostility (Galovski & Blanchard, 2002; Norris et
al., 2000), sensation seeking (Arnett, Offer, & Fine, 1997; Dahlen et al., 2005; Jonah et al., 2001;
Nell, 2002; Matthews et al., 1999), competitiveness (Blanchard et al., 2000; Houston et al.,
2003), the status of the target vehicle (Doob & Gross, 1968), the presence of passengers in the
driver’s vehicle (Shinar & Compton, 2004), traffic and time pressure (Hennessy & Wiesenthal,
1999; Shinar, 1998; Shinar & Compton, 2004), and weather conditions (Edwards, 1999). Like
Hennessy and Wiesenthal (2001, 2002), we found comparable levels of mild aggression for
females and males; unlike previous studies our sample of females were more likely to honk when
time pressured and in heavy traffic. Other new findings relate to the age of individuals in the
target vehicle (i.e., children passengers and senior drivers inhibit aggression in our sample) and
time of day (low aggression in the morning). Also, we unexpectedly found less honking and
tailgating on the highway as compared to commercial and residential areas – perhaps drivers are
aware of the increased danger of these activities in this location? Research is needed to better
understand this finding.
While adding to the literature, our study is not without limitations. For example, our
sample was limited to college students in the 18 to 22 year age range. The pattern of results
found in this study may not apply older, more experienced drivers. This being said, our
undergraduate sample includes the highest risk age group with regard to aggressive and unsafe
driving practices (Hemenway & Solnick, 1993; Jonah, 1990; Parker, Reason, Manstead, &
Starling, 1995). In the United States, driver involvement in crashes during 2005 was highest for

Recklessness in Context 13
16-20 year olds followed by 21-24 year olds (NHTSA, 2007). Younger drivers may be at risk
because of a lack of experience, but there may also be clusters who are more hostile, higher
sensation seekers, more competitive, or lacking in impulse control (Deery & Fildes, 1999).
Like much of the research on aggressive driving, our study may be limited by the use of
self-report measures. We advocate the utility of the adopting the transactional framework (if not
the approach) to a variety of methodologies in order to gain a better understanding of aggressive
driving. The current literature relies extensively on personality scales and retrospective self-
report, but there are also studies using driving simulations, natural observation, experience
sampling (e.g., diaries, cell-phone interviews from the road), laboratory and field
experimentation, and archival data. Because each of these methods has its own strengths and
weaknesses, each could make a different contribution to our knowledge of this phenomenon. For
example, simulation data might allow us to examine roadway vegetation, an environmental
variable that may impact driver stress levels (Cackowski & Nasar, 2003) but that probably could
not be accurately remembered in retrospective self-reports. Other environmental variables, such
as information on temperature, weather, and road conditions might be better assessed using
natural observation, field experimentation, and archival data. In the end, it is doubtful that any
single methodology can do a better job of providing a holistic understanding of the phenomenon
when compared to a combination of methodologies.
In addition to its potential utility in research, the framework used in our study might
prove a valuable applied tool for education, treatment, and prevention. Along with research about
the causes of aggressive driving, scholars have been investigating ways prevent these practices
among average drivers and therapies to intervene with highly aggressive drivers (see Galovski,
Malta, & Blanchard, 2006, for a review). The approach used in our study could provide a
framework that would allow individuals to identify the psychological, social, environmental, and
Recklessness in Context 14
temporal aspects of their own unsafe driving practices. Once identified and understood, driving
instructors working with students, or therapists working with clients, could help individual
drivers to develop and implement strategies to deal with personal “triggers” without resorting to
aggressive behavior.
The National Highway Traffic Safety Administration (Subramanian, 2007) recently
reported that, “in 2004, motor vehicle traffic crashes were the leading cause of death for every
age 2 through 34” (p. 1). For the first 34 years of life, we are more likely to die in a vehicle crash
than of cancer, homicide, suicide, heart disease, accidental poisoning, congenital anomalies, etc.
These types of statistics illustrate the critical need for research on driving behavior. If aggressive
driving is part of the problem, then a better understanding of this phenomenon must be part of
the solution. We hope that as this type of research becomes more common, we will be better able
to determine how results can be translated into effective intervention and application.

Recklessness in Context 15
References
Aberg, L., & Rimmo, P. (1998). Dimensions of aberrant driver behaviour. Ergonomics, 41, 39-
56.
Altman, I., & Rogoff, B. (1987). World views in psychology: Trait, interactional, organismic,
and transactional perspectives. In I. Altman & D. Stokols (Eds.), Handbook of
environmental psychology (Vol 1, pp. 7-40). New York: Wiley-Interscience.
Anderson, C. A. (1989). Temperature and aggression: Ubiquitous effects of heat on occurrence
of human violence. Psychological Bulletin, 106, 74-96.
Arnett, J. J., Offer, D., & Fine, M. A. (1997). Reckless driving in adolescence: "State" and "trait"
factors. Accident Analysis and Prevention, 29, 57-63.
Asbridge, M., Smart, R. G., & Mann, R. E. (2004). The "homogamy" of road rage:
Understanding the relationship between victimization and offending among aggressive
and violent motorists. Violence and Victims, 18, 517-531.
Baum, A., & Paulus, P. B. (1987). Crowding. In I. Altman & D. Stokols (Eds.), Handbook of
environmental psychology (Vol 1, pp. 533-570). New York: Wiley-Interscience.
Baxter, J. S., Manstead, A. S., Stradling, S. G., Campbell, K. A., Reason, J. T., & Parker, D.
(1990). Social facilitation and driver behaviour. British Journal of Psychology, 81, 351-
360.
Berkowitz, L. (1989). Frustration-aggression hypothesis: Examination and reformulation.
Psychological Bulletin, 106, 59-73.
Blanchard, E. B., Barton, K. A., & Malta, L. (2000). Psychometric properties of a measure of
aggressive driving: The Larson Driver's Stress Profile. Psychological Reports, 87, 881-
892.
Blockley, P. N., & Hartley, L. R. (1995). Aberrant driving behaviour: errors and violations.

Recklessness in Context 16
Ergonomics, 38, 1759-1771.
Cackowski, J. M., & Nasar, J. L. (2003). The restorative effects of roadside vegetation:
Implications for automobile driver anger and frustration. Environment and Behavior, 35,
736-751.
Cohen, J., & Cohen, P. (1983). Applied multiple regression/correlation analysis for the
behavioral sciences (2nd ed.). Hillsdale, NJ: Lawrence Erlbaum Associates.
Conner, M., Smith, N, & McMillan, B. (2003). Examining normative pressure in the theory of
planned behaviour: Impact of gender and passengers on intentions to break the speed
limit. Current Psychology: Developmental, Learning, Personality, Social, 22, 252-263.
Cook, W., & Medley, D. (1954). Proposed hostility and pharisaic-virtue scales for the MMPI.
Journal of Applied Psychology, 238, 414-418.
Dahlen, E. R., Martin, R. C., Ragan, K., & Kuhlman, M. M. (2005). Driving anger, sensation
seeking, impulsiveness, and boredom proneness in the prediction of unsafe driving.
Accident Analysis & Prevention, 37, 341-348.
Daly, M., & Wilson, M. (1988). Homocide. New York: Aldine de Gruyter.
Deery, H. A., & Fildes, B. N. (1999). Young novice driver subtypes: Relationship to high-risk
behavior, traffic accident record, and simulator driving performance. Human Factors, 41,
628-643.
Deffenbacher, J. L., Huff, M. E., Lynch., R. S., Oetting, E. R., & Salvatore, N. E. (2000).
Characteristics and treatment of high-anger drivers. Journal of Counseling Psychology,
47, 5-17.
Deffenbacher, J. L., Oetting, E. R., & Lynch, R. S. (1994). Development of a driving anger scale.
Psychological Reports, 74, 83-91.
DePasquale, J. P., Geller, E. S., Clarke, S. W., & Littleton, L. C. (2001). Measuring road rage:

Recklessness in Context 17
Development of the Propensity for Angry Driving scale. Journal of Safety Research, 32,
1-16.
Doob, A. N., & Gross, A. E. (1968). Status of frustrator as an inhibitor of horn honking
responses. Journal of Social Psychology, 76, 213-218.
Edwards, J. B. (1999). Speed adjustment of motorway commuter traffic to inclement weather.
Transportation Research Part F: Traffic Psychology and Behaviour, 2, 1-14.
Ellison-Potter, P. A., Bell, P. A., Deffenbacher, J. L. (2001). The effects of trait driving anger,
anonymity, and aggressive stimuli on aggressive driving behavior. Journal of Applied
Social Psychology, 31, 431-443.
Galovski, T. E., & Blanchard, E. B. (2002). The effectiveness of a brief psychological
intervention on court-referred and self-referred aggressive drivers. Behaviour Research
and Therapy, 40, 1385-1402.
Galovski, T. E., Malta, L. S., Blanchard, E. B. (Eds.)(2006). Road rage: Assessment and
treatment of the angry, aggressive driver. Washington, D.C.: American Psychological
Association.
Geen, R. G. (1998). Aggression and antisocial behavior. In D. T. Gilbert, S. T. Fiske, & G.
Lindzey (Eds.), The handbook of social psychology (4th ed., Vol. 2, pp. 317-356). New
York: McGraw-Hill.
Glendon, A. I., Dorn, L., Matthews, G., Gulian, E., Davies, D. R., & Debney, L. M. (1993).
Reliability of the Driving Behavior Inventory. Ergonomics, 36, 719-726.
Guofeng, Z., & Cundao, H. (2003). A study of drivers’ mood state. Psychological Science
(China), 26, 438-440.
Hemenway, D., & Solnick, S. J. (1993). Fuzzy dice, dream cars and indecent gestures: Correlates
of driver behavior? Accident Analysis and Prevention, 25, 161-170.
Recklessness in Context 18
Hennessy, D. A., & Wiesenthal, D. L. (1999). Traffic congestion, driver stress, and driver
aggression. Aggressive Behavior, 25, 409-423.
Hennessy, D. A., & Wiesenthal, D. L. (2001). Gender, driver aggression, and driver violence: An
applied evaluation. Sex Roles, 44, 661-676.
Hennessy, D. A., & Wiesenthal, D. L. (2002). Aggression, violence, and vengeance among male
and female drivers. Transportation Quarterly, 56, 65-75.
Houston, J. M., Harris, P. B., McIntire, S., & Dientje, F. (2002). Revising the competitiveness
index using factor analysis. Psychological Reports, 90, 31-34.
Houston, J. M., Harris, P. B., Norman, M. (2003). The Aggressive Driving Behavior Scale:
Developing a self-report measure of unsafe driving practices. North American Journal of
Psychology, 5, 269-278.
Jonah, B. A. (1990). Age differences in risky driving. Health Education Research, 5, 139-149.
Jonah, B. A., Thiessen, R., & Au-Yeung, E. (2001). Sensation seeking, risky driving and
behavioral adaptation. Accident Analysis and Prevention, 33, 679-684.
Karlberg, L., Unden, L., Elofsson, S., & Krakau, I. (1998). Is there a connection between car
accidents, near accidencts, and Type A drivers? Behavioral Medicine, 24, 99-106.
Kenrick, D. T., & MacFarlane, S. W. (1986). Ambient temperature and horn honking: A field
study of the heat/aggression relationship. Environment and Behavior, 18, 179-191.
Knight, G. P., Fabes, R. A., & Higgins, D. A. (1996). Concerns about drawing causal inferences
from meta-analyses: An example in the study of gender differences in aggression.
Psychological Bulletin, 119, 410-421.
Matthews, G., Dorn, L., Hoyes, T. W., Davies, D. R., Glendon, A. I., & Taylor, R. G. (1998).
Driver stress and performance on a driving simulator. Human Factors, 40, 136-149.
Matthews, G., Tsuda, A., Xin, G., & Ozeki, Y. (1999). Individual differences in driver stress
Recklessness in Context 19
vulnerability in a Japanese sample. Ergonomics, 42, 401-415.
McGarva, A. R., & Steiner, M. (2000). Provoked driver aggression and status: A field study.
Transportation Research. Part F, Traffic Psychology and Behaviour, 3, 167-179.
National Highway Traffic Safety Administration, (2007) Traffic Safety Facts 2005: A
Compilation of Motor Vehicle Crash Data from the Fatality Analysis Reporting System
and the General Estimates System (NHTSA Report DOT HS 810 631). Washington D.C.:
National Center for Statistics and Analysis, U.S. Department of Transportation. Retrieved
June 1, 2007, from http://199.79.179.188/portal/nhtsa_static_file_downloader.jsp?file=
/staticfiles/DOT/NHTSA/NCSA/Content/TSF/2006/TSF2005.pdf
Nell, V. (2002). Why young men drive dangerously: Implications for injury prevention. Current
Directions in Psychological Science, 11, 75-79.
Norris, F. H., Matthews, B. A., & Riad, J. K. (2000). Characterological, situational, and
behavioral risk factors for motor vehicle accidents: A prospective examination. Accident
Analysis and Prevention, 32, 505-515.
Panati, C. (1984). Panati’s browser’s book of beginnings. Boston: Houghton-Mifflin.
Parker, D., Reason, J. T., Manstead, A. S., & Stradling, S. G. (1995). Driving errors, driving
violations, and accident involvement. Ergonomics, 38, 1036-1048.
Peden, M., Scurfield, R., Sleet, D., Mohan, D., Hyder, A. A., Jarawan, E., & Mathers, C.
(Eds.)(2004). World report on road traffic injury prevention. Geneva: World Health
Organization.
Preusser, D. F., Ferguson, S. A., & Williams, A. F. (1998). The effect of teenage passengers on
the fatal crash risk of teenage drivers. Accident Analysis and Prevention, 30, 217-222.
Schreer, G. E. (2002). Narcissism and aggression: Is inflated self-esteem related to aggressive
driving? North American Journal of Psychology, 4, 333-341.

Recklessness in Context 20
Shinar, D. (1998). Aggressive driving: The contribution of the drivers and the situation.
Transportation Research. Part F, Traffic Psychology and Behaviour, 1, 137-159.
Shinar, D., & Compton, R. (2004). Aggressive driving: An observational study of driver, vehicle,
and situational variables. Accident Analysis & Prevention, 36, 429-437.
Shinar, D., Bourla, M., & Kaufman, L. (2004). Synchronization of Traffic Signals as a Means of
Reducing Red-Light Running. Human Factors, 46, 367-372.
Simon, F., & Corbett, C. (1996). Road traffic offending, stress, age and accident history among
male and female drivers. Ergonomics, 39, 757-780.
Subramanian, R. (2007). Traffic Safety Facts Research Note: Motor vehicle traffic crashes as a
leading cause of death in the United States, 2005 (NHTSA Report DOT HS 810 742).
Washington D.C.: National Center for Statistics and Analysis, National Highway Traffic
Safety Administration, U.S. Department of Transportation. Retrieved June 1, 2007, from
http://www.nhtsa.dot.gov/portal/nhtsa_static_file_downloader.jsp?file=/staticfiles/DOT/
NHTSA/NCSA/Content/RNotes/2007/810742.pdf
Werner, C. M., Brown, B. B., & Altman, I. (2002). Transactionally oriented research: Examples
and strategies. In R. B. Bechtel & A. Churchman (Eds.), Handbook of environmental
psychology (pp. 203-232). New York: John Wiley & Sons.
Wiesenthal, D. L., Hennessy, D. A., & Gibson, P. M. (2000). The Driving Vengeance
Questionnaire (DVQ): The development of a scale to measure deviant drivers' attitudes.
Violence and Victims, 15, 115-136.
Zuckerman, M., Eysenck, S. B., & Eysenck, H. J. (1978). Sensation seeking in England and
America: Cross-cultural, age, and sex comparisons. Journal of Consulting & Clinical
Psychology, 46, 139-149.

Recklessness in Context 21
Table 1 Correlations and Standardized Beta Coefficients for Aggressive Driving Behavior Subscales
Conflict Behavior Speeding
Predictor Variables r β r β
Hostility .33** .27**
.33** .29**
Thrill and Adventure Seeking .10 .02 .25** .22**
Boredom Susceptibility .33** .23**
.26** .19*
Competitiveness .20* .10 .19*
.11
Gender (0=Female, 1=Male) .18* .05 .04 -.15
*p < .05. **p < .01.
Recklessness in Context 22
Table 2 Mean Likelihood of Horn Honking for Social Conditions
Females
Males
Total
Participant’s vehicle Passengers Target’s vehicle Passengers Gender Age Status
Alone in the car Passengers in the car Alone Adult passengers Children passengers Female Male Young Middle aged Elderly Inexpensive vehicle Expensive vehicle
3.59
3.97
3.34
3.27
2.78
3.50
3.38
3.61
3.46
3.20
3.46
3.35
3.38
3.51
3.40
3.27
3.33
3.67
3.78
3.73
3.69
3.60
3.51
3.51
3.51
3.79
3.36
3.27
2.99
3.56
3.53
3.65
3.54
3.35
3.48
3.41
Recklessness in Context 23
Table 3 Mean Likelihood of Tailgating for Social Conditions
Females
Males
Total
Participant’s vehicle Passengers Target’s vehicle Passengers Gender Age Status
Alone in the car Passengers in the car Alone Adult passengers Children passengers Female Male Young Middle aged Elderly Inexpensive vehicle Expensive vehicle
3.77
3.55
3.11
3.03
2.61
3.13
3.18
3.20
3.32
3.24
3.09
2.85
3.95
3.67
3.40
3.40
3.10
3.70
3.60
3.70
3.51
3.70
3.50
3.21
3.84
3.60
3.22
3.17
2.80
3.35
3.34
3.39
3.39
3.41
3.25
2.99

Recklessness in Context 24
Table 4 Mean Likelihood of Aggressive Driving for Environmental Conditions
Females
Males
Total
Horn honking behavior
Type of Road Traffic Weather
Freeway / interstate highway In-town 4-lane commercial area In-town 2-lane residential area Traffic is light Traffic is heavy Weather is clear Raining Fog
3.45
3.61
3.52
3.33
4.09
3.82
3.59
3.46
3.25
3.67
3.69
3.44
3.62
3.47
3.73
3.58
3.37
3.63
3.59
3.37
3.91
3.69
3.64
3.51
Tailgating behavior
Type of Road Traffic Weather
Freeway / interstate highway In-town 4-lane commercial area In-town 2-lane residential area Traffic is light Traffic is heavy Weather is clear Raining Fog
3.23
3.51
3.99
3.46
4.39
4.10
2.60
2.32
2.98
3.53
3.88
3.53
4.50
4.16
2.86
2.79
3.13
3.52
3.95
3.49
4.43
4.12
2.70
2.50

Recklessness in Context 25
Table 5 Mean Likelihood of Aggressive Driving for Temporal Conditions
Females
Males
Total
Horn honking behavior
Time Pressure Time of Day
Not pressed for time Pressed for time Morning (before noon) Afternoon (noon to 7 p.m.) Evening (after 7 p.m.)
3.05
4.63
3.38
3.63
3.85
3.11
4.16
3.38
3.55
3.53
3.07
4.46
3.38
3.60
3.73
Tailgating behavior
Time Pressure Time of Day
Not pressed for time Pressed for time Morning (before noon) Afternoon (noon to 7 p.m.) Evening (after 7 p.m.)
3.15
4.68
3.35
3.80
3.90
3.28
4.47
3.50
3.77
3.77
3.20
4.60
3.41
3.79
3.85
Recklessness in Context 26
Figure Captions
Figure 1. Research variables presented in a transactional framework.
Figure 2. Statistically significant results presented in a transactional framework.

Recklessness in Context 27
Aggressive Driving
Hostility
Sensation Seeking
Competitiveness
Gender
Driver Passengers
Target Passengers
Target Gender & Age
Target Status
Time Pressure
Time of Day
Type of Road
Traffic Density
Weather Conditions

Recklessness in Context 28
Honking (Conflict)
Smaller Roads
Heavy Traffic (Especially Females)
Driver is Alone
Children Not in Target Vehicle (Females Only)
Target Not Elderly
Hostile
Susceptible to Boredom
High Time Pressure (Especially Females)
Not Morning
Tailgating (Speed)
Smaller Roads
Heavy Traffic
Clear Weather
High Time Pressure
Not Morning
Children Not in Target Vehicle
Inexpensive Vehicle
Hostile
Thrill/Adventure Seeker
Susceptible to Boredom