RECENT SHORLINE EROSION RATES ALONG BLACK RIVER BAY ... · transported offshore. By filtering the...
137
RECENT SHORLINE EROSION RATES ALONG BLACK RIVER BAY, JAMAICA: EROSION AND RECOVERY AFTER HURRICANE IVAN IN 2004 A Masters Thesis Presented to The Graduate College of Missouri State University In Partial Fulfillment Of the Requirements for the Degree Master of Science, Geospatial Science and Physical Geography By Karen Louise Zelzer May 2015
Transcript of RECENT SHORLINE EROSION RATES ALONG BLACK RIVER BAY ... · transported offshore. By filtering the...

RECENT SHORLINE EROSION RATES ALONG BLACK RIVER BAY,
JAMAICA: EROSION AND RECOVERY AFTER HURRICANE IVAN IN 2004
A Masters Thesis
Presented to
The Graduate College of
Missouri State University
In Partial Fulfillment
Of the Requirements for the Degree
Master of Science, Geospatial Science and Physical Geography
By
Karen Louise Zelzer
May 2015

ii
Copyright 2015 by Karen Louise Zelzer

iii
RECENT SHORELINE EROSION RATES ALONG BLACK RIVER BAY,
JAMAICA: EROSION AND RECOVERY AFTER HURRICANE IVAN IN 2004
Geography, Geology, and Planning
Missouri State University, May 2015
Master of Science, Geospatial Science and Physical Geography
Karen Louise Zelzer
ABSTRACT
Rising sea level is threatening coastal areas, particularly those in the Caribbean which
rely heavily on tourism and marine resources to support local economies. The purpose of
this study is to analyze shoreline position along the south coast of Jamaica to determine
the locations and rates of coastal change. IKONOS satellite imagery sets for 2003, 2007
and 2012 were used to monitor land use and shoreline changes along Black River Bay,
including Galleon Beach Fish Sanctuary, in St. Elizabeth, Jamaica. In particular, the
effect of Hurricane Ivan in 2004 on shoreline changes was evaluated. Erosion rates were
significantly higher during 2003-2007, the period including Hurricane Ivan (-0.90 m/yr),
with reduced erosion rates and some recovery by deposition observed during the post-
hurricane period (0.21 m/yr). Little to no changes were observed along limestone
headlands and mangrove swamps with highest rates on sandy beaches lacking offshore
coral reef protection and exposed to storm waves. Overall, shoreline recession averaged -
0.31 m/yr during the study period with a peak erosion rate of -1.13 m/yr at Parrottee
Point. Within the next 10 to 30 years, an expected 9 km of mangrove swamps and over
100 buildings are at risk due to sea level rise and shoreline erosion.
KEYWORDS: shoreline, erosion, sea-level rise, Jamaica, climate change
This abstract is approved as to form and content
_______________________________
Robert Pavlowsky, PhD
Chairperson, Advisory Committee
Missouri State University

iv
RECENT SHORELINE EROSION RATES ALONG BLACK RIVER BAY,
JAMAICA: EROSION AND RECOVERY AFTER HURRICANE IVAN IN 2004
By
Karen Louise Zelzer
A Masters Thesis
Submitted to the Graduate College
Of Missouri State University
In Partial Fulfillment of the Requirements
For the Degree of Masters of Science, Geospatial Science and Physical Geography
May 2015
Approved:
__________________________________________
Robert Pavlowsky, PhD, Committee Chair
__________________________________________
Jun Luo, PhD, Committee Member
__________________________________________
Kevin Evans, PhD, Committee Member
__________________________________________
Julie Masterson, PhD, Dean, Graduate College

v
ACKNOWLEDGEMENTS
There a many people I would like to show my appreciation to for their help and
guidance throughout my research. First and foremost, I would like to thank my advisor
Dr. Robert Pavlowsky. Thank you for being patient with me and for your knowledge and
guidance through it all. I would also like to thank my committee members Dr. Jun Luo
and Dr. Kevin Evans for their technical support and advice as well as Xin Mou for his
help in image processing. I would like to thank Marc Owen for his help and guidance as
well as my fellow graduate students, specifically Emma Clegg, Avery Kunze and Adam
Mulling, for their support during this project.
Funding was provided for this project through a thesis research grant provided by
the Gradate College; Ozark’s Environmental and Water Resources Institute (OEWRI);
and through a faculty research grant awarded to Dr. Robert Pavlowsky.
Lastly, I would like to thank my family and friends for all of their support and
inspiration. Special thanks to my parents, Dan and Mary, who always supported my
decisions and always encouraged me to follow my passions. They are my heroes and
without their unwavering support and encouragement, none of this would have been
possible.

vi
TABLE OF CONTENTS
Chapter 1. Introduction ....................................................................................................... 1
Beach Concerns in Jamaica ................................................................................... 7
Purpose and Objectives ....................................................................................... 10
Benefits ................................................................................................................ 11
Chapter 2. Background ..................................................................................................... 14
Beach Morphology .............................................................................................. 14
Beach Morphology Model ..................................................................... 15
Wave Processes...................................................................................... 17
Sediment Budget .................................................................................... 20
Shoreline Types ................................................................................................... 21
Sandy Beaches ....................................................................................... 21
Headlands and Resistant Shorelines ...................................................... 24
Reef Protected Shorelines ...................................................................... 26
Artificial Shorelines ............................................................................... 27
Beaches as Environmental Indicators .................................................................. 30
Depositional Landforms......................................................................... 30
Seasonal Changes and Storm Events ..................................................... 31
Sea Level Rise in Jamaica ................................................................................... 35
Responding to Sea Level Rise ............................................................... 36
Chapter 3. Study Area ....................................................................................................... 39
Geography ........................................................................................................... 39
Geology ............................................................................................................... 43
Stratigraphy ............................................................................................ 43
Soils ....................................................................................................... 46
Climate ................................................................................................................ 48
Wave, Wind, and Storm Patterns ........................................................................ 48
Land Use .............................................................................................................. 52
Description of Zones ........................................................................................... 54
Level of Beach Protection ................................................................................... 55
Chapter 4. Methods ........................................................................................................... 60
Data Preparation and Processing ......................................................................... 61
Predicting Shoreline Change ............................................................................... 66
Classification of Shoreline Protection ................................................................. 67
Chapter 5. Results and Discussion .................................................................................... 69
Rates of Shoreline Change .................................................................................. 69
Influence of Shoreline Geology and Reef Protection .......................................... 83
Predicted Shoreline Change ................................................................................ 86
Threats and Responses to Coastal Resources ...................................................... 90
Summary ............................................................................................................. 91

vii
Chapter 6. Conclusions ..................................................................................................... 93
Literature Cited ................................................................................................................. 95
Appendices ...................................................................................................................... 105
Appendix A: Database sources. ......................................................................... 105
Appendix B: Georeferencing Coordinates and Corresponding RMS Error. ..... 105
Appendix C: Black River Bay Map with Transects. ......................................... 106
Appendix D: Photo Log. ................................................................................... 111
Appendix E: Percent of Shoreline Experiencing Change ................................. 115
Appendix F: Changes and Rates by Zones. ....................................................... 116
Appendix G: Trends in Shoreline Change. ....................................................... 117
Appendix H: Hot and Cold Spots. ..................................................................... 122
Appendix I: Predicted Shoreline Changes. ........................................................ 125

viii
LIST OF TABLES
Table 1. Changes in Beaches and Dunes from Hurricanes in 1995. ..................................33
Table 2. Stratigraphy of Southwest Jamaica ......................................................................44
Table 3. Zone Descriptions ................................................................................................54
Table 4. Imagery Database from Digital Globe. ................................................................61
Table 5. Uncertainties and Errors ......................................................................................66
Table 6. Vegetation Line Changes and Rates from 2003-2012 .........................................75
Table 7. Locations and Averaged Change and Rate for Hot Spots and Cold Spots ..........79
Table 8. Percent of Shoreline Type Along Black River Bay .............................................84
Table 9. Rates of Sandy Shores Due to Reef Protection from 2003-2012 ........................85
Table 10. Predicted Shoreline Change for the Next 10 to 30 Years ..................................86

ix
LIST OF FIGURES
Figure 1. Generalized Global SLR.......................................................................................4
Figure 2. Predicted Sea Level Trends. .................................................................................5
Figure 3. Coral Reef Protection Around Jamaica. ...............................................................8
Figure 4. Wave Dominated Beach Model. .........................................................................16
Figure 5. Dominated Wind Direction for the Caribbean. ..................................................18
Figure 6. Longshore Drift. .................................................................................................19
Figure 7. Generalized Beach Classification. ......................................................................23
Figure 8. Shoreline Composition. ......................................................................................25
Figure 9. Collapse of Seawalls...........................................................................................29
Figure 10. Storm Profiles. ..................................................................................................32
Figure 11. Beach Changes from Camber’s Study in 1997. ................................................34
Figure 12. Elevation of Jamaica.........................................................................................41
Figure 13. Elevation of Black River Bay ...........................................................................42
Figure 14. Geologic Formations in Black River Bay. .......................................................45
Figure 15. Soils in Black River Bay. .................................................................................47
Figure 16. General Storm Patterns in the Caribbean Region. ............................................49
Figure 17. Path of Hurricane Ivan Throughout the Caribbean. .........................................51
Figure 18. Hurricane Paths. ...............................................................................................51
Figure 19. Land Use at 3 m Elevations Within Black River Bay. .....................................53
Figure 20. Beach Protection by Vegetation. ......................................................................55
Figure 21. Shoreline Changes from 2003-2007 by Zone. ..................................................70

x
Figure 22. Shoreline Changes from 2007-2012. ................................................................77
Figure 23. Shoreline Changes from 2003-2012 .................................................................72
Figure 24. Rates of Change by Zones. ...............................................................................76
Figure 25. Spatial Shoreline Change from 2003-2012. .....................................................78
Figure 26. Changes in Vegetation Line by Zone. ..............................................................80
Figure 27. Property Damage due to Sea Level Rise and Shoreline Erosion. .....................88
Figure 28. Property Damage Along Black River Bay. ......................................................89

1
CHAPTER 1. INTRODUCTION
Coastal shorelines are dynamic since they represent the interface between marine-
driven wave and current forces and terrestrial geological and biological materials of
variable resistance (Bush and Young, 2009). In the coastal zone, geomorphic processes
involving wind and wave action are most effective in landform development including
bedrock headlands, coastal dunes, longshore bars, spits, and pocket beaches (Huggett,
2011). Beaches form on coastal shorelines where sediments from local sources
accumulate due to the influence of waves and currents (Bush and Young, 2009). Beaches
can form from a range of sedimentary clasts and grain sizes, from cobbles to fine sand.
Sandy beaches are the most desired beaches in the Caribbean region and are important for
economic, social, and ecological reasons. However, sandy shorelines are particularly
prone to changes in size and shape over human timescales due to variations in wave
energy including seasonal and annual time frames. Shoreline changes are caused by
changes in wind speed and patterns and intensity of storms such as hurricanes (Davidson-
Arnott, 2005).
The geomorphic impacts of natural processes and human activities on the
ecological balance of the coastal zone, including geomorphic processes and sediment
budget, need to be understood in order to plan for sustainable communities (Correa,
Alcantara-Carrio, and Gonzalez, 2005). The sediment budget indicates the balance
between sediment added or removed by natural or human action (Morton, 2002;
Richards, 2008). If sediment supply is relatively high, shorelines can resist erosion and
even build seaward by deposition. This is often where depositional landforms such as
2
beaches, spits, and bars form. If the supply of sediment is low, shorelines will erode and
disappear (Huggett, 2011).
Island nations in the Caribbean rely heavily on marine resources and coastal
tourism to support their economies (Cambers, 2009). Coral reefs, mangrove forests, and
sandy beaches are important economic, social, and ecological factors due to their link to
tourism as well as fisheries and local culture (Gable, 1997). Economic development on
island nations in the Caribbean began along the coast since it provided easy and
convenient settlement as well as resources to make a settlement successful (Small and
Nicholls, 2003). Accessibility to resources, ships and a food source created the
foundation for Caribbean settlement along the coastline. Over the past decades, the main
economic support for island nations in the Caribbean is tourism (Cambers, 2009).
Tourism in the Caribbean accounts for approximately 15 percent of the regions gross
domestic product (GDP) and is dependent on the attractiveness and condition of the
beaches, as well as the warm climate, and other marine factors (Bueno et al., 2008).
Resorts and cruise lines are the most popular forms of tourism for these islands, and they
are also located along the coast since it is the ideal location for accepting stop-over
tourists as well as the perfect balance of sea, sun and sand (Beekhuis, 1981). Tourism
also provides primary and secondary employment opportunities for the local population
in the form of accommodation work, retail trade, transport operations, construction, and
agriculture (Beekhuis, 1981).
Beaches are also important socially for population growth and for recreational and
cultural services (Jin, et al., 2003). Most major cities located on Caribbean islands are
located near the coast since these areas are usually the first settled upon arrival (Hanson

3
and Lindh, 1993). The beaches near these populated areas are used by tourist and locals
as a location for social activity. Bar and restaurant owners tend to locate their businesses
near beaches to increase revenue and appeal to the island’s public. This contributes to the
overall tropical island culture which identifies with the coastal zone (Gable, 1997).
In addition to beaches, coral reefs and mangroves are important ecologically for
habitats, fisheries, and the local culture (Gable, 1997). Coral reefs are structures made
from the buildup of calcium carbonate skeletons deposited by coral polyps. Coral reefs
create ecosystems suitable for fish and other aquatic organisms; and this provides a
primary food source for local populations (Burke and Maidens, 2009). Mangroves are
tropical trees that thrive in shallow marine settings. The roots of these trees are typically
the habitat for juvenile fish and shellfish species and help keep the overall coastal
ecosystem in balance (Lugo and Snedaker, 1974). The root systems are dense and serve
as traps for sediment from river input and onshore transport from nearshore sand bars.
This sediment trapping process acts as a natural seawall which reduces the rate of erosion
from large storm events (Beck, 2014) as well as regulating the amount of sediment being
transported offshore. By filtering the coastal sediment, this protects coral reefs, seagrass
and other aquatic organisms from being smothered in sediment and sediment-associated
pollutants (Rath, 2014).
Increased global temperatures have increased sea water temperature and changed
weather patterns worldwide (Cubasch, et al., 2013; Peterson, Stott, and Herring, 2012;
Seneviratne, et al., 2012). Recent trends of worldwide sea-level rise (SLR) threaten
beach stability. Sea level has fluctuated over geologic history. It is higher at times of
warmer global temperatures when there are fewer ice caps, and it is lower during glacial

4
periods when there is a greater volume of grounded global ice (Figure 1). This is
generally a natural process; however, climate scientists agree increased carbon emissions
from fossil fuel combustion have raised global atmospheric temperatures resulting in
increased ocean temperatures, thermal expansion, and increased rates of SLR. Over the
past 130 years, global sea level (GSL) rose by <1 mm/yr until about 1930 after which
rates increased to almost 2 mm/yr and are currently around 3.0-3.3 mm/yr (Figure 2)
(Cabanes, Cazenzve, and Provost, 2001; Davidson-Arnot, 2005; Gable, 1997; Williams,
2013; Church, et al., 2013).
Figure 1. Generalized Global Sea-Level Rise. Global sea-level rise trends showing major
times when sea level rose drastically due to changes in the climate. Source: Bollmann, et
al., 2010.

5
Figure 2. Predicted Sea Level Trends. Current observed GSL rates and predicted sea
level rates based on IPCC AR4. Data has been collected from the early 1900s to
2013. The predictions are based on previous trends and are expected to reach
between 0.18 m and 0.59 m depending on the rates at which the Greenland and
Antarctic ice sheets melt. Various models suggest different rates and are indicated by
the vertical bars. Source: Intergovernmental Panel on Climate Change (IPCC) WG1
Fourth Assessment Report, 2013.

6
In the Caribbean, SLR is a concern and threatens many of the islands. Recent
studies by Gable (1997), Robinson, Rowe, and Khan, (2005) and Davidson-Arnott (2005)
show an average increase in SLR from 1 to 2 mm/year over the past 100 years. More
recent sea-level rates have been calculated from 1955-96 with an average rate of 1.6
mm/yr (Cabanes, et al., 2001; Williams, 2013). This estimated rate has since increased to
3.0 to 3.3 mm/yr (Church, et al., 2013; Williams, 2013). As sea-level rises, beach
erosion rates tend to increase and shorelines tend to recede. The sediment budget for a
beach area becomes negative as more sediment is removed from the beach to offshore
storage or inland as overwash or inlet deposits (Huggett, 2011).
Rising sea level is causing more frequent and larger wave interaction with the
coastal zone, including potentially the impact of more powerful hurricanes (NASA,
2013). Erosion rates vary depending on tectonic setting, elevation, composition of the
beaches, and reef protection (Gable, 1997; Zhang, Douglas, Leatherman, 2004).
Shorelines with unconsolidated sediment such as sandy beaches are more susceptible to
wave action and will erode more rapidly (Dolotov, 1992). A study conducted in 2005
observed erosion rates along various coastal environments in Colombia. This coastline
consists of high igneous and limestone cliffs, low beaches, mangrove swamps, and deltas.
Erosion over the past 70 years was averaged to be between 0.43 m/yr and 0.71 m/yr
depending on location and environment. The study revealed increased erosion rates
ranging from 0.5 m/yr along the cliff faces and 4 m/yr along the beaches (Correa,
Alcantara-Carrio, Gonzalez, 2005). Another study observed comparable rates along the
coast of California, where the shorelines are made up of both rocky and sandy beaches as
well as cliffs and wave-cut benches. The cliff erosion rates were higher than the beach

7
rates at 0.3 m/yr and 0.2 m/yr respectively. These are averaged rates and some of the
beaches were accreting and the rates varied depending on protection, composition and
wave interaction. This led to a lower erosion rate for the beach environments (Hapke
Reid, and Richmond, 2009).
Beach Concerns in Jamaica
Jamaica is a country reliant on tourism and beach attractions to support its
economy (Richards, 2008). Recently, there have been concerns over the risk of beach
degradation and erosion due to SLR (Wong, et al., 2014). Northern Jamaica has ample
reef protection to resist beach erosion rates, but South Jamaica does not have this
protection (Figure 3). Along the south coast, patches of fringing reefs are more common
and have a higher percentage of dead coral opposed to living coral. This is likely due to
hurricane wave action damaging the reefs in this area (Charpentier, 2005).
Southern Jamaica is made up of small communities supported by small-scale
agriculture, fishing, and tourism activities. These communities are self-supporting for the
most part but rely on tourism to support their economies. In 2000, 26.7 percent of
Jamaica’s gross national product (GNP) was from the tourism industry (Thomas-Hope
and Jardine-Comrie, 2007). In contrast to the north coast, there are only a few “all-
inclusive” resorts along the south coast of Jamaica. These resorts attract tourists through
Jamaica’s tropical climate and sandy beaches – and these tourists then support the local
communities through souvenir shops, restaurants, and guided tours around the area
(Richards, 2008).

8
Fig
ure
3.
Cora
l R
eef
Pro
tect
ion A
round J
amai
ca. R
eef
pro
tect
ion i
s bas
ed o
n r
eef
shap
e, s
lop
e, o
rien
tati
on a
nd d
ista
nce
fro
m
the
shore
. E
xpose
d r
eefs
all
ow
wav
es t
o b
reak
on t
he
reef
fac
e an
d p
rovid
e th
e m
ost
pro
tect
ion. S
ourc
e M
GI,
2011 a
nd
Worl
d R
esourc
es I
nst
itute
, 2001.

9
Richards (2008), reports that rising sea levels are decreasing the amount of sandy
beaches along Jamaica’s shoreline and thereby decreasing the amount of tourist visits per
year. Roughly 2.5 percent of Jamaica’s shoreline is composed of sandy beaches and
seaside parks. The majority of these sandy beaches are located along the north,
northwest, west and southwest coasts. The eastern part of the island is mainly composed
of bluffs and headlands. The northern beaches are composed of white sand from the
erosion of offshore corals and calciferous algae. The southern beaches are composed of
darker sand due to the large portion of the sediment supply comes from river sediment
(Richards, 2008; Moses, 2008). Sandy beaches are the most vulnerable to changes in sea
level and the climate. These beaches are less consolidated than headlands or vegetated
shorelines so the geomorphic factors have a greater effect on these beaches. This makes
the reduction of energy reaching the sandy shoreline more important (Huggett, 2011).
Coral reefs line most of Jamaica’s shoreline. These reefs are located offshore and
are formed from the calcium carbonate skeletons of coral. The presence of these reefs
reduces the energy of waves from reaching the shoreline. It is estimated that 60 percent of
Jamaica’s shorelines are protected by fringing, patch or barrier reefs (Burke and Maidens,
2004). Most of these reefs are found along the northern and western part of the country
leaving the southern coast exposed to the full force of wave energy from storms and
rising sea levels. Sandy beach profiles with reef protection tend to be more stable and
change at a slower rate since low energy waves are the dominate wave type reaching the
shoreline (Munoz-Perez, Tejedor, Medina, 1999).

10
Purpose and Objectives
Most studies of sea-level effects on Jamaica have focused on either coral reefs or
beaches located on the north or west coast (Robinson, et al., 2012; Richards, 2008;
Robinson, Rowe, and Khan, 2005). Even though average beach erosion rates for Jamaica
have been reported to range from 0.23 to 0.30 m/year (Robinson et al., 2012), no studies
of beach erosion rates along the south coast have been completed. Long Beach in Negril
is located along the west coast and is one of the few beaches studied close to the
southwestern portion of Jamaica. Discussions with members of the communities in the
parishes of Westmoreland and Saint Elizabeth are aware that their beaches are
disappearing. However, the understanding as to why this is happening and where beach
loss is greatest is lacking. More scientific analysis is needed to increase our
understanding of beach erosion rates and their spatial variability along the south coast of
Jamaica. The purpose of this study is to determine the effect of recent sea level change
and other factors on erosion rates of sandy beaches along southern Jamaica with a focus
on the Black River Bay area. Black River Bay is the capital of St. Elizabeth Parish and
has an estimated population of over 5,000 residences. The economy of this town relies
on coastal resources and tourism which is vulnerable to SLR since the majority of the
town is at or below an elevation of 3 meters. Vulnerable areas within the bay that supply
resources to the area are the Galleon Fish Sanctuary and the Black River ecosystem.
Hurricanes are intense storm events that produce high-energy waves capable of
transporting large amount of sediment and changing the shoreline during a single event.
Hurricane Ivan occurred during September 2004 and passed within 32 km from the
southern coast of Jamaica. On average, the Caribbean region experiences 6 hurricanes per

11
year (NOAA, 2015), causing property damage, loss of life, homelessness, and disruption
of economies. They are the main threat to islands in the region, specifically to Black
River Bay due to its low elevation and sandy shoreline.
Remote sensing and satellite imagery is used to determine the shoreline changes
of Black River Bay beaches since 2003. The objectives of this thesis are:
(1) Geospatially determine patterns of shoreline erosion and accretion rates for 30 km of
shoreline over the past 9 years including the effects of Hurricane Ivan in 2004. Digitized
beach widths, vegetation lines, and water lines for each satellite image year were used to
determine erosion and deposition trends for the shoreline; (2) Determine the relationships
between erosion patterns and geology, vegetation, and reef protection. Shoreline zones
were classified according to land form type, reef protection, and seaward orientation to
evaluate erosion-deposition relationships. Each factor was assessed using the IKONOS
satellite images to determine how they influence erosion patterns of beaches along Black
River Bay; and (3) Use beach erosion rates, topography, and land use/vegetation
relationships to evaluate erosion risk to natural and cultural resources in the area.
Benefits
This is the first study on the south coast of Jamaica to measure erosion and
deposition rates with high resolution satellite imagery. The results of this study will
quantify beach erosion rates and patterns, suggest caused factors to explain erosion
patterns, and identify locations of higher and lower risk to beach erosion along Black
River Bay. This study will help to better understand the erosion patterns of the south
coast of Jamaica as well as aid to the overall understanding of how increased SLR and

12
hurricane events like Hurricane Ivan will affect sandy beaches; specifically the south
coast of Jamaica. The procedures developed and results will provide a baseline approach
on how to measure the rate of erosion or recovery of beaches by satellite imagery and
help to set up longer-term monitoring programs.
Information provided by this study will help the communities of southern Jamaica
understand erosion and deposition trends and help guide future coastal management.
Fish sanctuaries, such as the Galleon Beach Marine Protected Area in Black River Bay,
help monitor fish populations, fishing regulations, coral reefs, beach conditions and
coastal habitats. These sanctuaries are monitored by non-profit foundations such as
BREDS (www.breds.org) and SeaVibe (www.seavibe.org) and work with the community
to enforce and manage the fish sanctuary. Fish and coral populations are allowed to
increase and counter the effects of overfishing and habitat degradation which aid in
preventing increased coastal erosion.
Socially, results of this study can be used to raise awareness about coastal erosion
in Jamaica and can help encourage government response to help aid in coastal protection.
Fish sanctuaries and marine protected areas and the Beach Control Act have been created
by the government in Jamaica to help manage coastal resources for sustainable use.
Businesses such as Sandals (www.sandalsfoundation.org) have funded projects for the
communities to help decrease the effects felt by human activities. The Sandals
Foundation focuses on community, education, and environmental projects that help train
skilled workers, support educational facilities, and preserve reefs, marine life, beaches,
and the local flora and fauna (Sandals Foundation, 2010). However, most of these
projects and government responses are located elsewhere in Jamaica and has a limited

13
presence in Black River Bay. In 2009, the Galleon Fish Sanctuary was declared the first
and only marine sanctuary in Black River Bay, located between Malcolm Bay and
Hodges Bay. This was created to regulate fish populations and protect marine and
coastal resources from natural and anthropogenic threats (BREDS, 2014). For the most
part, the town of Black River is located at less than 3 meters above sea level. This
increased sea level will threaten the town and its infrastructure and natural resources.
Increased government involvement and management for this area is needed to monitor
shoreline changes, predict storm effects, and prepare for future risks.

14
CHAPTER 2. BACKGROUND
The coastal system is influenced by changes in SLR resulting from climate
change over timescales of decades to centuries (Bush and Young, 2009). Sandy beaches
in particular are some of the most dynamic areas on earth and susceptible to coastal
hazards such as storm surges, coastal erosion, and inundation. Factors affecting beach
erosion include: wave height and duration, coral reef protection, dune and beach
vegetation cover, beach orientation and angle, and composition determine the rate a
shoreline will erode and how vulnerable it is to SLR (Huggett, 2011; Bush and Young,
2009). The majority of beaches along the south coast of Jamaica are sandy, low-angled
beaches with little reef protection (Richards, 2008). The degree of beach protection,
wave action and type of sandy beaches found along Black River Bay will be discussed in
this chapter. This chapter will elaborate on the geomorphic characteristics and behavior
of beaches in the Jamaica setting.
Beach Morphology
Coastlines are influenced by both natural and human systems. The natural system
includes features like headland bluffs, beaches, sand dunes, lagoons, river mouths,
wetlands, and coral reefs. The human system includes structures that were built like sea
walls, buildings, roads, groins, and breakwaters. Sandy beaches are an equilibrium
landform within the coastal system and respond to changes in energy, sediment supply,
and resistance. Morphologic changes of beaches rely on factors such as wave, wind and
current energy, the sediment budget, and resistance factors such as coral reefs, bedrock,
and human barriers (Wong, et al., 2014).

15
A beach is generally a highly dynamic landform formed by wave action along
marine, estuarine, and lacustrine shorelines. A beach is commonly referred to as the
shoreline area between the lowest tide level and a physiographic feature such as a dune,
cliff or permanent vegetation indicates the landward extent of wave-induced sediment
transport or erosion (Masselink and Kroon, 2004). Beaches can be primarily composed
of silt, sand, or gravel sized grains depending on the energy of the environment. The
most vulnerable to erosion are sandy beaches.
Beach Morphology Model. Beach morphology is complex and depends on the
temporal and spatial scale. The scale can be extremely short such as seconds to measure
grain interactions, days to measure changes due to a single storm event, or the scale can
be much larger and cover shoreline evolution over decades or centuries (Tarbuck and
Lutgens, 2007). The morphology of a beach can be divided into two parts, the primary
profile and secondary morphological features. The overall beach profile is known as the
primary beach profile and is used to classify beaches (Masselink and Kroon, 2004). At
this scale, years and kilometers are used to measure the temporal and spatial changes of
the overall beach shape and movement. The features formed on the primary profile and
at smaller scales are known as secondary morphological features. These are features that
form on a temporal scale of hours to years and range in size from 10 to 1000 meters
(Masselink and Kroon, 2004). Some of the main secondary morphological features
include bars, berms, beach cusps, beach steps, and low tide terraces. These features can
help classify a beach, identify the erosional factors that are interacting with the beach and
can help predict what the beach profile might look like in the future (Masselink and
Kroon, 2004; Huggett, 2011).

16
A wave dominated beach model can be used to describe sandy beaches along the
south coast of Jamaica (Figure 4). This model is used for microtidal zones where beaches
experience less than a 2 m change in tides; therefore, tide processes are negligible and
waves are the main factor for changes in beach morphology (Short, 1996). Wave
dominated beaches are composed of three dynamic zones, the nearshore, the foreshore or
beach face, and the backshore. The nearshore is where waves approach the shore and
become shallower and more unstable until they break, usually at a bar. The surf zone is
within the nearshore and the foreshore and is the area after a wave breaks and interacts
with the shoreline. A berm crest is formed at the boundary between the foreshore and the
backshore. This is where sediment carried from a wave gets deposited and indicates the
high waterline. The backshore is the area where only the waves with the highest energy
will reach, which usually only occurs during a storm event (Huggett, 2011; Komar,
1976). The vegetation and waterline are focused on in this study to help determine
changes in the shoreline morphology.
Figure 4. Wave Dominated Beach Model. This model represents the typical beaches
along the south coast of Jamaica. Some variations in this model occur due to different
resistance factors such as sea walls and groins and due to different levels of reef
protection located offshore. The typical location of the vegetation line and waterline
are indicated in red. These features are used in this study to determine changes in
shoreline morphology. Modified from source: Firoozfer, Neshaei, and Dykes, 2014.

17
Resistance factors, such as coral reefs, will deflect or reduce the energy reaching
the shoreline and change the dynamics of the wave dominated model. The incoming
waves will break along the offshore side of the reef, reducing the amount of energy that
will eventually reach the shore by an average of 97 percent (Richards, 2008; Sheppard,
2005, Valentine, 2014). Headlands are more resistant to erosion and deflect the energy of
the wave away from the more vulnerable sandy beaches (Kohsiek, Hulsbergen, and
Terwindt, 1987). Humans try to recreate natural barriers by creating cement seawalls,
ripraps, groins, or artificial reefs. These are meant to direct or reduce the energy reaching
the shore as well as prevent sediment from being transported offshore (Huggett, 2001).
Wave Processes. Waves and the energy of ocean currents are the main factor for
changing the morphology of a beach. This energy is derived from differences in air
temperature which creates wind, as well as the rotation of the earth. A greater difference
in temperature creates a stronger wind. In the tropics, the air is warmer than at higher
latitudes. This warm air rises and is replaced by denser, colder air from either the north
or south creating a major wind belt. The wind then flows over the surface of the ocean,
creating a drag and forms a wave (Bascom, 1980). The energy of waves varies greatly
over the surface of the earth. The Caribbean is located in the Northeast Trade Wind belt
located north of the equator. Here, the air is constantly moving, creating waves which
strike the coastline at a fairly constant rate. Easterly winds dominate the Caribbean for
most of the year and are the dominate wind direction for Jamaica (Figure 5). Storm
events such as tropical storms and hurricanes occur multiple times a year in the
Caribbean usually from June to November. These storms create changes in wind
direction and produce high energy waves and storm swells which are capable of
18
transporting large amounts of sediment from the shoreline in a short amount of time
(Bascom, 1980; Richards, 2008; Huggett, 2011).
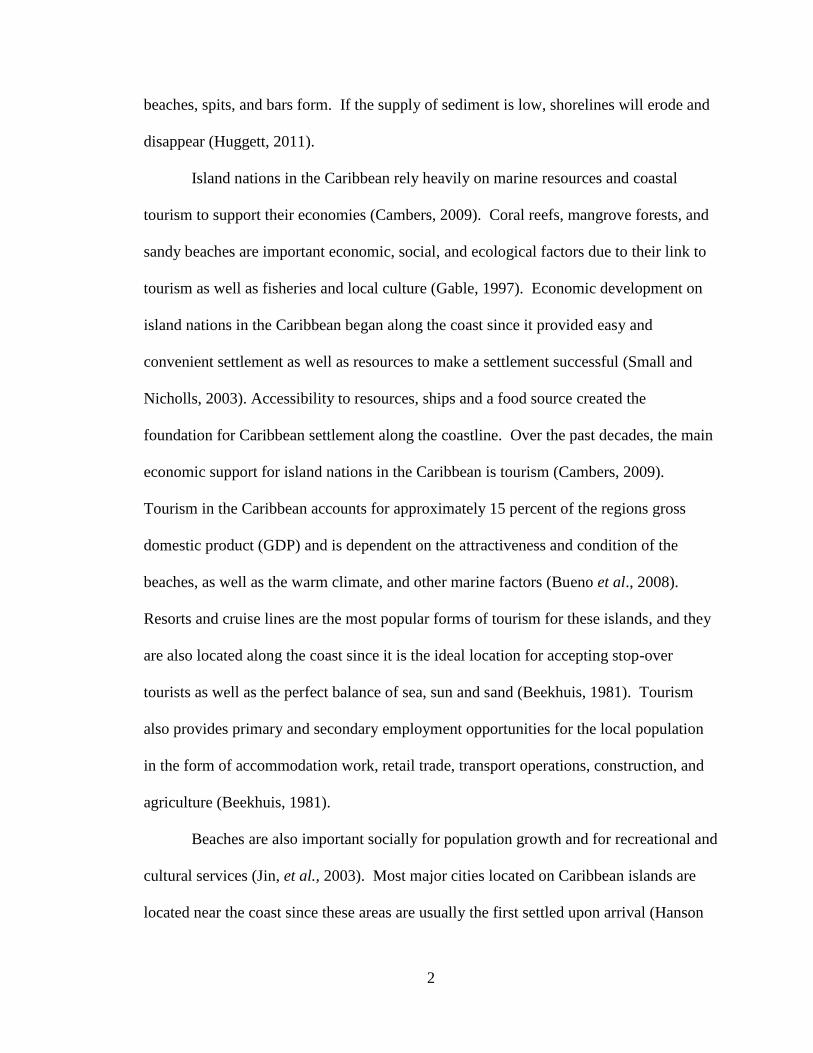
The dominant wave direction will influence the orientation and spatial location of
sandy beaches along a shoreline. Overtime, a beach can appear to move along the coast
and change its location (Hamblin and Christiansen, 2003). This natural process is called
longshore drift. This process indicates the relationship between sediment transport and
form changes along the coast. As waves approach the shoreline at a degree other than 90,
sediment will be moved in the direction of the dominate current (Figure 6). Overtime,
this will cause the beach to move along the shoreline in the direction of the current.
Figure 5. Dominate Wind Direction for the Caribbean. Jamaica is indicated in red and
the arrows show a generalized wind velocity for the region. Modified from Sverdrup,
Johnson, and Fleming, 1942.

19
Waves hitting the beach at a 90 degree angle will carry sediment to and from the beach
perpendicular to the shoreline. The shoreline will remain in its relative position with
variability either inland or offshore (Hamblin and Christiansen, 2003; Tarbuck and
Lutgens, 2007).
Figure 6. Longshore Drift. Longshorre drift of beach sediment due to longshore currents.
Waves hit the beach at an angle and move sediments down shore. Overtime the beach
moves in the direction of the current. Source: Pearson Prentice Hall, 2004.

20
Sediment Budget. The rate at which a coastline will erode or accrete depends on
the amount of sediment available. The net amount of sediment available for transport
and how sediment is stored in different beach features is described as the sediment budget
and it is an important concept for understanding shoreline in equilibrium. Beaches where
there is roughly the same amount of sediment transported to and from the beach are
classified as being in equilibrium. If more sediment is added than can be transported
offshore or along shore, the beach is accreting and will often appear as if the waterline is
moving seaward due to accretion (progradation). If more sediment is being transported
than deposited, then the beach is considered to be eroding and the waterline will move
landward (recession) (Hanson and Lindh, 1993; Short and Wright, 2006; Limber, Patsch,
and Griggs, 2008; Prothero and Schwab; 2004).
The beaches in Jamaica receive their sediment supply from the erosion of coral
reefs, limestone headlands, and from river discharges. The northern beaches are
composed of white, carbonate sands with a large amount originating from the erosion of
coral reefs located offshore. The process of eroding and breaking down the reefs’
calcareous skeleton into rubble, sand or silt and clay, is called bioerosion and is done by
organisms such as pufferfish, parrotfish, hermit crabs, urchins, barnacles and sponges
(Glynn, 1997). These organisms help sculpt the reef and produce sediment that
eventually ends up depositing on the adjacent shoreline. This creates a healthy sediment
supply and helps to keep the reef and beach system in equilibrium. Caribbean reefs are
bioeroding at an estimated rate of 0.96 to 3.67 kg CaCO3 /m /yr (Perry, et al., 2014). This
sediment is bioeroded by organisms and chemical processes and then transported from
the offshore reefs and deposited on the shoreline (Perry, et al., 2014; Holl; 2003). Reefs

21
are less common along the southwest coast of Jamaica, so the majority of sediment for
these beaches originate from nearby river systems (Richards, 2008). The reefs in Black
River Bay account for only 1.6 percent of Jamaica’s coral reefs. Within Black River Bay,
55 percent of the shoreline is protected by fringing reefs. This is less than the northern
part of the island where the average percent of shoreline protection is roughly 70 percent
(ReefBase, 2015) therefore, bioerosion is greater and more sediment from coral reefs is
produced.
Shoreline Types
Caribbean shorelines are varied and range from headlands to sandy beaches.
Different shoreline features respond to hurricanes, rising sea levels, and human
interactions differently. The shoreline types focused in this study are the main features
found along the shorelines of southwestern Jamaica but are also commonly found
throughout the Caribbean.
Sandy Beaches. These make up roughly 20 percent of the world’s coastline and
are more common in microtidal regions (Masselink and Kroon, 2004). Most of the
Caribbean is classified as a microtidal environment, so wave dominated beaches are the
most common. These beaches experience persistent ocean swells and constant wave
interactions (Huggett, 2011). Storm events generally lower beach gradients, widen
beaches and increase beach erosion by changing the wave interaction with the beach face
(Chambers, 1997). A general understanding of beach formation is that high-energy
waves tend to form wide, flat, fine grained beaches whereas more protected lower energy
beaches tend to be narrower, steeper and can often form rip currents. A more detailed
beach classification system was created by Short and Wright (2006). This system groups

22
beaches into dissipative, intermediate, or reflective beaches (Figure 7). This study will
only focus on the beaches most commonly found in Jamaica.
Dissipative Beaches. These are generally high-energy wave environments where
waves average 2.5 meters in height and the beaches are composed of fine grained sand.
High-energy environments produce large waves that transport sediment offshore creating
a wide, low angled surf zone with offshore bars parallel to the shore. Waves tend to
break on these bars and can reform multiple times before reaching the shore. These
beaches are generally straight and featureless but the presence of headlands or reefs
decrease and redirect the wave energy and can cause an overall crescent shape or cusps
and berms to form (Short, 1996). A dissipative beach can also form in low-energy
environments where very fine sand is present and where there is an abundance of sand
(Hesp, 2012). These beaches are heavily affected by storm events such as hurricanes and
often show high signs of erosion during these events (Huggett, 2011; Short, 1996).
Intermediate Beach. These types of beaches experience less wave energy and are
more dynamic than dissipative beaches. One type of intermediate beach is a low tide
terrace or ridge-runnel. This type of beach is composed of fine to medium sand and a
relatively steep beach face. Small, shallow rips can form, creating weak currents between
the bar and beach face. Cusps can form along the backshore where high swells may
reach during storm events (Huggett, 2011; Short,1996).
Reflective Beaches. These beaches are the lowest energy beach type. They are
generally steeper with coarser sand (0.4mm) and wave heights between 0 and 1 m and
tend to be narrower than the other beach types and often display a berm. These beaches
could also be moderate to high-energy beaches with coarse to gravel sized grains (Hesp,

23
2012). They are usually well protected and located on highly sheltered coasts where
embyments are formed and commonly found behind coral reefs (Huggett, 2011; Short,
1996). These beaches display little temporal variability and remain relatively stable
unless there is a drastic increase in wave height and energy in which beach erosion will
rapidly occur (Short and Wright, 2006).
.
Figure 7. Generalized Beach Classification. The classification system is based
on Short and Wright (2006). Beach scales are exaggerated.

24
Beaches within Black River Bay are predominantly dissipative since the wave
energy is high in many areas. The beaches are dominantly fine grained with a low slope
angle. The shorelines that have reef protection are generalized as intermediate beaches,
specifically low tide terrace beaches. These have a slightly steeper slope and cusps are
generally found on the beach face. The areas where intermediate beaches are thought to
dominate are along the south portion of the study area, past Parrottee Point. The beach
classifications for Black River Bay are based off of observations and profile
measurements from satellite imagery.
Headlands and Resistant Shorelines. Coastal headlands are rocky shorelines
surrounded by water on three sides and usually adjacent to a bay. These headlands are
composed of bedrock and are more resistant to changes made from waves and other
coastal processes. More resistant shorelines made of bedrock can be composed of either
hard or soft rock. The hard rock is more resistant to wave forces and will change at a
slower rate, usually over centuries to millennia. A softer rock will change more rapidly,
usually over a few decades. A less resistant soft rock such as a clay or silt rock is
usually adjacent to a more resistant hard rock like limestone (Geomorphic Solutions,
2010). Differential erosion from waves and abrasion cause the soft rock to erode at a
faster rate than the hard rock, causing a bay to form. The sediment eroded from the rocky
shoreline deposits in the bay and forms a crescent beach surrounded by headlands
(Huggett, 2014; British Broadcasting Corporation (BBC), 2014).
Headlands are usually high bluffs where waves break and are diffused into the
bay. The headland takes the full force of the energy produced by waves and the more
sheltered bay receives refracted waves which are lower in energy (Figure 8). Since

25
headlands receive more energy from waves than the adjacent bays, the erosion rate of
these landforms are greater than in the bays; however, headlands are more stable than
beaches. Beaches are more mobile and easily changed making geomorphic changes more
noticeable on human timescales (Huggett, 2011). Shorelines where headlands are absent
are where the highest rates of erosion and changes are observed since the beaches and
shorelines are exposed to the full force of the energy from waves and movement is not
restricted (Tarbuck and Lutgens, 2007).
Figure 8. Shoreline Composition. Headlands, such as limestone bluffs, are more
resistant to wave processes but receive the full force of wave energy. Waves are
refracted into the adjacent bays. Source: British Broadcasting Corporation
(BBC), 2014.

26
Reef Protected Shorelines. Similar to headlands, coral reefs are a resistant
feature that provides shoreline protection from wave energy. The type and condition of a
coral reef determines the amount of energy absorbed from wave and storm events from
reaching the shoreline. Coral reefs can absorb an overall average of 97 percent of the
energy from wind produced waves (Valentine, 2014; National Oceanic and Atmospheric
Administration, 2013; The Nature Conservancy, 2014). In general, as waves approach a
reef, they break on the reef crest, releasing most of the wave’s energy. Reefs that are
exposed above the surface of the water provide a higher level of protection than
submerged reefs (Carey, 2014). There are two types of coral reefs found along the coast
of Jamaica and vary in the level of shoreline protection. A fringing reef is the most
common and are either connected to the shore or located very close to the shoreline. A
barrier reef is located offshore usually within 1,000 m from the shore and separated from
the shore by a lagoon. Often these reefs are damaged by storms. Overtime, they can
become so damaged only patch reefs remain (Microdocs, 2012). Thus, SLR and
increased storm intensity can reduce coral reef protection.
In addition to shoreline protection, coral reefs are a productive ecosystem
important to the fishing community, and provide sediment through bioerosion for the
adjacent beaches as well as coastal protection from waves and storm events (Beck, 2014).
Most coral reefs are located in shallow, tropical regions and are home to 25 percent of all
the known species of marine life which include around 4,000 fish species and 800 reef-
building corals (Burke, et al., 2011). Since 2003, the fishing industry for members of the
Caribbean Community (CARICOM) has produced and consumed fish products above the
global average of 16.4 kg per capita. CARICOM members such as Barbados, Belize,

27
Grenada, Jamaica, St. Kitts, and St. Lucia, have produced between 14.2 to 52.2 kg per
capita in 2003 of fish products making this industry important to the Caribbean economy
(CARICOM Secretariat, 2013).
Reefs are at risk and require protection from natural and anthropogenic factors. It
is estimated that 30 percent of the world’s reefs are seriously damaged and 60 percent
could be lost by 2030 (UNEP-WCMC, 2006). Overfishing, pollution, coral mining,
sedimentation, tropical storms, and coral bleaching are all serious threats to coral reefs.
As these structures are damaged or destroyed, the fishing industry is threatened as well as
an important source of income for many coastal communities. Damaged reefs also allow
more energy to reach the shoreline, increasing the rate of shoreline erosion. These reef
systems should be managed along with other coastal resources to help insure their
existence in the future (UNEP-WCMC, 2006).
Artificial Shorelines. Structures built to protect shorelines from the natural
process of erosion are being constructed to protect infrastructure built too close to the
shoreline. These artificial structures, such as seawalls, groins, and breakwaters are used
as a management practice to deflect wave energy and change the natural flow of sediment
along the coast. This process is usually called hard stabilization (Tarbuck and Lutgens,
2007) and has a varied degree of success (Pilkey and Wright, 1988).
Hard structures are designed to trap sediment to increase beach widths or to
prevent waves from eroding the shoreline to the point where infrastructure will be
damaged. Structures such as groins are built perpendicular to the shoreline and trap
sediment within updrift cells to slow sediment transport and reduce sediment loss.
However, these structures interfere with the natural process of longshore drift and usually

28
too much sediment collects on the windward side of the groin so that the lee side
becomes sediment deprived (Tarbuck and Lutgens, 2007). Seawalls and breakwaters are
built parallel to the shore to resist wave energy directly and prevent excessive erosion due
to waves and storm swells. Seawalls are built on the shore to prevent loss of property and
infrastructure whereas breakwaters are built offshore and act similar to reef systems by
reducing wave energy. The problem with these structures is that reflected or dissipated
waves create a scour at the base of the structure and cause erosion to occur without
allowing sediment to be replenished. This disrupts the equilibrium of the beach system
and the area on the seaward side of the wall will erode and often cause the structure to
collapse (Figure 9). Building these hard structures only helps a few and degrades or
destroys natural beaches (Tarbuck and Lutgens, 2007; Twu and Liao, 1999).

29
Figure 9. Collapse of Seawalls. Seawalls are built on shorelines to protect a beach or
infrastructure. The incoming waves hit the wall and reflect in a downward motion.
This causes souring to occur at the base, increasing erosion. Eventually the structure
may collapse. Source: Spiegel, 2013.

30
Beaches as Environmental Indicators
Beaches are dynamic and can be used to understand changes in the environment.
Beaches are formed by waves and respond to changes in seasons, storm events, and
sediment supply by either eroding, accreting, or relocating down shore. The level of
sediment transport between waves and a beach depends on the level of protection by
vegetation or landforms and the level of human interaction with the shoreline. Rising sea
levels are pressuring coastal regions and beaches are one of the first features to feel the
full effect of climate change and increased sea levels.
Depositional Landforms. Wave processes and currents influence the movement
of sediment and create erosional and depositional landforms. Depositional landforms
such as spits, bars, barriers, forelands, coastal dunes, and beaches are relatively mobile
and will change over human timescales or during a single storm event (Huggett, 2011;
Tarbuck and Lutgens, 2007). These landforms form when there is an adequate source or
supply of fine grained sediment such as the sediment discharged from the Black River.
These depositional landforms are found along the south coast of Jamaica and can be used
to help determine the direction of longshore currents and dominate wave direction. A
spit is an accumulation of sand that projects out into a bay and is only attached to the
shore on one side. Spits can either be long and straight with a hook-like shape (hooked
spit) or shaped more like a triangle where the length of the spit is less than the width
(foreland spit). Areas where spits form are usually places where the shoreline abruptly
changes direction and the spit only receives longshore movement on one side (Huggett,
2011). A bar is a straight accumulation of sand that forms parallel to the shore. Bars can
become barriers and cut off a bay to form a lagoon. These depositional landforms often

31
form in shelter areas and are usually formed when a spit complexly seals off a body of
water. Coastal dunes can form along the shoreline and are formed by wind energy;
however the sediment that forms these dunes is important to the sediment supply being
removed or added to the coastal zone. Beaches are the most common depositional
landform and will form in bays as pocket beaches and along shorelines where sediment
can be deposited (Huggett, 2011; Tarbuck and Lutgens, 2007).
Seasonal Changes and Storm Events. Changes in wave energy and direction
due to seasons and storm events can be seen in changes in beach morphology. Generally,
the changes in energy during the seasons create summer and winter beach profiles.
Storms and wave heights generally increase from fall into the winter during hurricane
season from late August through November. This creates flatter beaches due to increased
wave energy. Beaches with a low angle will show a greater geomorphic change due to
storms since wave swells are able to travel further inland and interact with berms,
vegetation and stored sediment (Bascom, 1980). During these storm events, berms
typically erode and the fine grained beach tends to flatten as sand is pulled offshore and
deposited on offshore bars (Figure 10). The beach may appear to be growing and
becoming wider; however, the vegetation line and berm line are damaged or eroded
which actually cause the shoreline to regress. During late spring to early summer waves
are generally calmer and smaller so beaches tend to recover as sand is slowly returned
from the offshore bars onto the beach and berm. The rate vegetation recovers is slower
than beach recovery and if multiple storm events occur during one season, a beach will
have less time to recover and the geomorphic changes due to erosion are greater
(Robinson, Rowe, and Khan, 2005).

32
Hurricanes and strong storm events produce large storm swells with average
heights doubling normal wave heights. These waves are capable of changing beach
profiles over short timeframes of hours or days (Bosser et al., 2000; Daniel and
Abkowitz, 2005). These beaches will recover during non-storm events. Studies on the
level of beach change during storm events have been increasing during the past 30 to 40
years. Cambers (1997) explains the profile changes on Caribbean islands during two
major hurricanes; Hugo in 1988 and Luis in 1995. The study documents periods ranging
1 to 10 years on islands in the Lesser Antilles (Anguilla, Antigua-Barbuda, British Virgin
Islands, Dominica, Grenada, Montserrat, St. Kitts/Nevis, St. Lucia, St. Vincent, and the
Grenadines) (Cambers, 1997). Monitoring stations where placed along the shoreline of
Figure 10. Storm Profiles. General beach profile change before and after a
hurricane or strong storm event. Level of profile change is exaggerated.
Source: University of South Florida, 2015.

33
Island
Distance to Center
of Hurricane Luis
(km)
Average Change
in Profile Area
(percent)
Average Change
in Beach Width
(m)
Average Retreat
of Veg/Dune
Line (m)
Barbuda 5 -40 -1.1 -17.5
Anguilla 28 -40 -8.7 -8.9
Antigua 40 -23 -4.9 -4.9
St. Kitts 70 -6 -3.2 -4
Nevis 90 -30 -5.7 -5.2
Montserrat 90 -31 -10.9 -3.5
Dominica 180 -24 -6.7 -2.5
these islands and data was collected quarterly and immediately after a large storm event.
These measurements were taken using simple surveying techniques by staff members of
the COSALC coordinating centers. The profile and width of the beaches are then
averaged for each year and the first year was used as the baseline. On average, 70
percent of the beaches were eroding and 30 percent were accreting. This trend changed
drastically after a hurricane event in which the profile areas decreased from 6 to 40
percent (Cambers, 1997). Included are Cambers’ table (Table 1) and Camber’s graph
(Figure 11) displaying the results that hurricanes have a large effect on the shape and rate
of change on beach profiles.
Table 1. Changes in Beach and Dunes from Hurricanes in 1995. Source: Cambers, 1997.

34
Global warming has been indicated as a possible reason for hurricane
intensification as well as accelerating SLR (Mousavi, 2010). As more CO2 enters the
atmosphere, the greenhouse effect causes the surface of the oceans and the air above it to
increase. Warmer air is able to hold more moisture, so evaporation occurs in tropical
areas. Preexisting climatic disturbances begin to interact with the moisture in the heated
atmosphere, causing a spiral to form and eventually a hurricane. The lighter and warmer
the air is above the storm, the more time the hurricane has to build up strength.
Therefore, rising global temperatures favor stronger storm systems (Mousavi, 2010). The
threat of stronger storms and rising sea level increases risks to coastal zones. Higher
water levels mean more water displacement onto the land. This increases the rate at
0
10
20
30
40
50
60
70
80
1988 1989 1990 1991 1992 1993 1994 1995 1996
Pro
file
Are
a (s
q. m
.)
Year
Figure 11. Beach Changes from Cambers’ Study in 1997. The diamond indicates the data
collected before Hurricane Hugo (red) and Hurricane Luis (orange). The graph shows the
drastic change before and after a hurricane and the smaller changes between extreme storm
events.
Hugo
Luis

35
which waves interact with the shoreline, ultimately removing more sediment than lower
sea levels (Hubbard, 1992).
Sea Level Rise in Jamaica
Studies by Robinson and Hendry (2012), Robinson et al., (2012), and Robinson,
Rowe, and Khan, (2005) explain the history of sea level changes during the Holocene and
the effects on Jamaican shores. At the beginning of the Holocene, global temperatures
increased as the climate transitioned from a glacial to an interglacial period. The melting
of ice sheets caused sea level to rise gradually by roughly 6 mm/yr. This equals a total
displacement of 25 meters within the first 4,000 years (Robinson, Rowe, and Khan,
2005). This was a gradual increase until around 14,000 years ago when sea level rapidly
increased to 4.5 cm/yr (Robinson, Rowe, and Khan, 2005). This trend of gradual then
rapid SLR continued until 6,000-7,000 years ago. After this initial rise, sea level
fluctuated and followed a slowly increasing trend to where sea level is today (Donoghue
and White, 1995).
Recently, SLR has accelerated due to thermal expansion of the ocean due to
global warming (Bueno et al., 2008). While SLR can have natural causes, SLR has been
accelerating due to burning of fossil fuels and the release of greenhouse gases (Causes of
Climate Change, 2013). The most extensive research conducted in Jamaica on shoreline
erosion has been along Long Bay in Negril. This is located along the west coast of
Jamaica. Studies by Mondon and Warner, (2012), Robinson and Hendry (2012) and
Robinson et al. (2012), produce a wide range of erosion rates along this shoreline. Over
the past 30 to 60 years, erosion rates have been measured from 0.23 to 0.30 m/yr for the

36
whole of Long Bay. In some areas, erosion rates have been measured to be as high as
0.59 m/yr over a 37 year span (Robinson et al, 2012).
Longshore drift has been observed along the beaches in Negril and Vere. Notable
coastal recession has been observed in both areas over a 30 to 50 year period. Spits and
barrier bars have disappeared and occurred elsewhere along the shoreline (McKenzie,
2012; Robinson, Rowe, and Khan, 2005). Each shoreline is different and the effects of
SLR on beaches are site specific. Continued research is needed to understand how
specific shorelines around Jamaica will respond to rising sea levels.
Responding to Sea Level Rise. Rising sea levels and associated shoreline
changes are pressuring coastal communities in the Caribbean including Jamaica (Gable,
1997). The “Coasts at Risk” index rates which coastlines are most at risk of floods,
tsunamis and SLR based on exposure and vulnerability. Jamaica is one of the top 20
countries most at risk (Coasts at Risk, 2014). Most shoreline erosion studies have
occurred in other countries or along the north coast of Jamaica. There is major concern
about the degree of property loss, reduced tourism, and degradation of coral reefs and
fisheries related to SLR throughout Jamaica, specifically along the south coast of Jamaica
(Richards, 2008).
To help reduce the pressures of SLR on the beaches in Negril, the local
government has made some attempts at beach restoration. A recent article from The
Gleaner by Veira (2014) explains the current proposed solutions and the repercussions
the plans will have on the local community and its beaches. Proposed solutions in 2007
by a local engineer, Smith Warner were: sand nourishment, nearshore breakwaters, reef
extension and a combined solution. Other proposed solutions for beach restoration

37
included restoring mangroves, sea grasses and coral reefs along with improvements in
water quality. These latter proposals have largely been ignored by the government and
The National Environment and Planning Agency (NEPA). Instead, NEPA started
designing rubble mound breakwaters along the ends of the beach (Veira, 2014).
The local stakeholders have expressed their concerns about the project stating it
will affect businesses, tourism, daily traffic, and a loss of revenue (Veira, 2014). The
environmental and economic factors and repercussions must be considered in any
restoration project. This proposed idea will deflect most of the daily wave action from
reaching the beach as well as waves produced from storm events. This case study
strengthen the need for a better understanding of SLR and erosion rates in Jamaica since
its effects are already being felt by the local communities.
There are many proposed solutions for dealing with shoreline erosion. Some
solutions are more permanent, effective and less expensive than others. In Negril, the
nearshore breakwater structures will require nine months for construction, 53,280 cubic
meters of armor stone, and cost roughly US$20 million - US$40 million to construct
(Veira, 2014). The breakwater structures will reduce the wave heights by 0.1-0.3 m and
reduce the wave energy up to 30 percent, therefore, reducing the erosion rate by up to 50
percent (Mondon and Warner, 2012). These breakwater structures act as an artificial
barrier reef but are costly to build.
Other possible solutions are to replenish the sand supply by bringing in sediment
from inland, adding it to the existing beach. This could double the width of the beach;
however is only a temporary fix and has a lifespan of 20-25 years. Reef extension or
rebuilding of a dying reef would reduce the wave energy hitting the shoreline and have a

38
similar effect as the breakwater solution (Veira, 2014). Mangrove restoration or the
restoration of other coastal vegetation would also be a solution as this would create new
habitats for marine and coastal life as well as act as natural seawalls, allowing the natural
flow of sediment to occur, unlike the anthropogenic structures (Thampanya et al., 2006).
All these solutions and their repercussions need to be taken into account when proposing
a coastal plan. Understanding the dynamics of the shoreline will improve the decision-
making process.

39
CHAPTER 3. STUDY AREA
Black River Bay is located on the southwest coast of Jamaica in the parish of St.
Elizabeth. It is one of Jamaica’s oldest towns and is the parish capital with an estimated
population of 5,717 in 2009 (St. Elizabeth Parish Development Committee, 2013). The
town was founded sometime before 1685 as a port city at the mouth of the Black River
where the export of logwood allowed the town to expand and prosper until it was
declared the parish’s capital in 1773 (Jamaica National Heritage Trust, 2011). The town
became an important port for the slave trade and became the main economic and
commercial center for the parish. By the early 1900’s, Black River was the second most
important town in Jamaica with Kingston being the most important. Black River grew in
wealth and in 1893 became the first Jamaican town to be lit by electricity. In 1903, Black
River became the first town to have cars and telephones (Fiwi Roots Jamaica, 2007).
Today, Black River is a medium-sized town, where the seaport is less important and
environmental tourism and fishing are the main industries (Jamaica National Heritage
Trust, 2011). The area has also become a destination for tourist looking to experience the
historic Jamaican culture along with the typical tropical experience of sun, sand, and sea.
Geography
Jamaica is the third largest island of the Greater Antilles located in the Caribbean
Sea; approximately 150 km south of Cuba (Moses, 2008). Jamaica’s has a high interior
reaching 2,256 m in the Blue Mountains, surrounded by a coastal plain that is less than
3.2 km wide in most areas along the north and south coast and slightly wider along the
east and west coast (Figure 12) (Richards, 2008). The island has an area of 10,911 km2

40
and the coastline is roughly 895 km in length and described as irregular, varying from
sandy beaches, mangrove swamps, to limestone bluffs. The southern coast of the island
has a shallow shelf of less than 36 m and extends 8-32 km from the shore where barrier
reefs, sand clays and low reef protection are found (Richards, 2008).
The area of Black River Bay used in this study includes roughly 30 km of
shoreline composed of sandy beaches and limestone headlands. The area begins roughly
500 m northwest of the Fonthill Nature Reserve beach and ends 1.5 km east of Parrottee
Point. Most of these beaches are dissipative beaches and located 1 to 3 meters above sea
level (Figure 13). The main beaches focused on in this study are Fonthill Beach Park,
Hunts Bay, Malcolm Bay, and Parrottee Point. Hunts Bay and Malcolm Bay are sandy
beaches with limestone headlands on either side of the beach. Parrottee Point is a sand
spit located in the southern portion of the study area and has high protection from coastal
dunes and fringing reefs along the southeastern part of the shoreline.

41
Fig
ure
12. E
lev
atio
n o
f Ja
mai
ca.

42
Figure 13. Elevation of Black River Bay. The main beaches of this study are
indicated.

43
Geology
The island of Jamaica is located on the northern edge of the Caribbean plate
which is adjacent to the North American Plate. The Cayman Trench runs between Cuba
and Jamaica, separating the North American plate from the Caribbean plate (Moses,
2008). During the upper Cretaceous period, subduction of the North American Plate
under the Caribbean plate created an uplift of crust that formed the core of Jamaica. A
series of marine submergences after the island was formed and caused a limestone mantle
to deposit which formed almost two-thirds of the island (Asprey and Robbins, 1953).
The western portion of the island is dominated by post-Eocene carbonates overlaying the
Cretaceous basement rock.
Stratigraphy. The Black River Bay is mainly composed of alluvium deposited
on top of limestone formations. The carbonates in this area are divided into the White
and Yellow Limestone groups (Table 2). The White Limestone, specifically the Troy
Formation, dominates the outcrops in the study area. The Troy Formation is the lowest
unit in the White Limestone Group and consists of dolostones and crystalline limestones.
This unit was formed during the Mid-Eocene and is a compact, well-bedded,
recrystalliszed limestone with little to no fossils present. The Montpelier Limestone
Formation is composed of two lithofacies; the Monteague/Cobre and the Montpelier Beds
(Robinson and Mitchell, 1999). These are not distinguishable from each other and have
been grouped at the Montpelier Formation. The geology within the Black River Bay
(Figure 14) is composed of few limestone outcrops of the White Limestone group. Most
of the low-lying area surrounding the Black River is covered with alluvium deposits
(Mitchell, 2004).

44
Group Formation Period Age
Alluvium*Pleistocene and
Holocene
2.5 million years
ago to present
White LimestoneMontpelier Limestone Mid- Miocene 23 to 5.3 million
years ago
Bonny Gate to
Troy Limestone Mid-Eocene55.8 to 33.9
million years ago
Yellow
Limestone**Masenmure Paleocene
65.5 to 55.8
million years ago
Jerusalem-Thickett River
Limestoneto
Tom SpringLate Cretaceous
Birch Hill
* Not a formation
**Not all units are included for the Yellow Limestone Group
99.6 to 65.5
million years ago
Bolded text represents main layers in Black River Bay
There are a series of faults throughout Jamaica with a dominantly NNW-SSE
trend. The major fault in the Black River region is the Montpelier Newmarket Belt
(Figure 14). This belt is highly deformed and has caused some NE-SW shortening and
NW-SE extension in the area and is believed to be a reverse fault with an upthrown block
to the NE (Wiggins-Grandison and Atakan, 2004). The area west of the major fault
accreted over a series of transgression events.
Table 2. Stratigraphy of Southwest Jamaica. Source: Robinson and Mitchell, 1999.

45
Figure 14. Geologic Formations in Black River Bay. Alluvium deposits are
not included in this formations map but alluvium covers most of the area
surrounding the Black River. Source: Robinson and Mitchell, 1999.

46
Soils. Black River Bay is located in the Coastal Plain Region where it is sheltered
by rain-bearing monsoon winds and is composed of dry, flat to gently undulating coastal
plains. These plains are formed by lacustrine or marine and river sediments (Hennemann
and Mantel, 1995). The area is mainly composed of five different soil series: The Crane,
Bonny Gate, Carron Hall, Cashew, and Hodges. An unnamed series makes up a large
portion of the bay surrounding the Black River, this series will be labeled Coastal
Swamps for the purpose of this study. The Cashew and Hodges formations are not found
along the coast and are associated with higher elevations of greater than 5 meters. They
are mainly composed of clay loam or silica sand (Ministry of Agriculture, 1989). The
Bonny Gate series is located in the southern portion of the bay where the elevation is
generally higher (> 5 m). This series is a stony loam that consists of large bedrock clasts
and residuum (Ministry of Agriculture, 1989) and represents an upland or hillslope area.
The majority of Black River contains the Coastal Swamp, Crane, and Carron Hall (Figure
15) which are located at lower elevations (between 1 m and 5 m) with gentle to nearly
level slopes. The Coastal Swamps are composed of gravely clay loam and are likely
fluvial or lacustrine deposits. The Crane series is a coarse loam and are likely dune or
sand barriers. This series is located along the shoreline as well as the area around and
behind Parrottee Pound. This could indicate the location of a previous shoreline before
sea level fell during the Wisconsin glaciation (late Pleistocene) and fluvial sediments
were deposited. The sea level then rose during the interglacial period, creating the
current shoreline (Ministry of Agriculture, 1989; Mickelson and Colgan, 2003). The
Carron Hall series is clay and likely old weathered colluvium that overlies bedrock or
residuum (Ministry of Agriculture, 1989).
47
Figure 15. Soils in Black River Bay.

48
Climate
Jamaica’s climate is tropical and similar to the other Greater Antilles with an
average temperate ranging between 72°F and 88°F, year round along the coast. It is
located in the Northern Trades belt which creates small seasonal temperature ranges.
June through August is the country’s warmest months and the stormiest months run from
June through November. This is when the risk for a hurricane is heightened (Richards,
2008). The annual precipitation rate averages 1,980 mm, with higher rates along the east
coast. The Blue Mountains receive around 7,620 mm a year (World Travel Guide, 2014)
and the south coast receives the least amount of rainfall at roughly 813 mm a year
(Meteorological Service, 2002).
Wave, Wind, and Storm Patterns
The Caribbean Sea is composed of different water masses that originate from the
North or South Atlantic. The dominate surface current is a westward direction starting
from the Lesser Antillies Islands until the area south of Jamaica before taking a more
northwestern direction (Centurioni & Niiler, 2003). This current is known as the
Caribbean Current and is caused by the northeast trade winds and the southeast trade
winds converging in the Intertropical Convergence Zone (ITCZ). Hurricanes tend to
form in the ITCZ and travel westward (Figure 16). Tropical cyclones such as tropical
storms and hurricanes form in this region of the Atlantic Ocean. Often, these storms start
as tropical depressions which are strong storm systems that develop a cyclonic (counter-
clockwise) rotation due to pressure changes (U.S. Geological Survey, 2012).
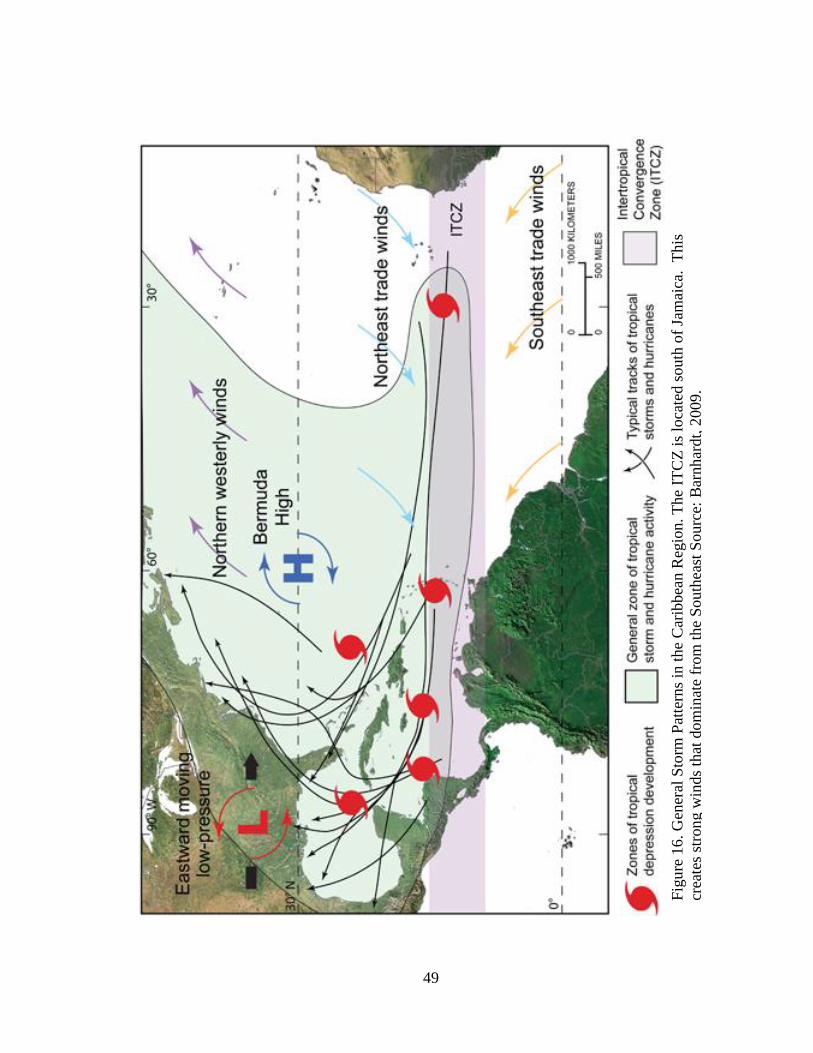
49
Fig
ure
16. G
ener
al S
torm
Pat
tern
s in
the
Car
ibbea
n R
egio
n. T
he
ITC
Z i
s lo
cate
d s
outh
of
Jam
aica
. T
his
crea
tes
stro
ng w
inds
that
dom
inat
e fr
om
the
South
east
Sourc
e: B
arnh
ardt,
2009.

50
The recent major storm that hit Jamaica was Hurricane Ivan. This was a category
5 storm that occurred in September 2004. This hurricane followed an unusual path
(Figure 17 and 18) that started off the West coast of Africa, traveled between 32 to 40 km
of the southern coast of Jamaica before heading northwest and making landfall in
Alabama, United States (ECLAC, 2004). Sustainable winds reached speeds of 180 km/hr
accompanied by rainfall several times the normal average for the southern coast. This
resulted in flooding, mass wasting and 595 million US dollars’ worth of damage.
Seventeen people were killed and over 369,000 people were directly affected, making
Ivan one of the worst hurricanes to hit Jamaica since Hurricane Gilbert in 1988 (ECLAC,
2004). Ivan was the second hurricane to affect the southern coast of Jamaica in 2004
with Hurricane Charley occurring first on August 10. Charley was only a category 1
hurricane but brought strong wind and rain, mainly affecting the parishes of St. Elizabeth
and Manchester (ECLAC, 2004).

51
Figure 17. Path of Hurricane Ivan Throughout the Caribbean. Source:
NOAA, 2015.
Figure 18. Hurricane Paths. General path of Hurricane Ivan (black)
and Hurricane Charley (red) off the coast of Jamaica in 2004.
Source NOAA, 2015.

52
Waves approach the south coast of Jamaica mainly from the east and become
almost parallel as the waves enter the bay. Waves generally follow the topography of the
sea floor causing the waves to approach a bay roughly parallel to the shore until they
interact with headlands or reefs. As the waves near the shore, drag pulls them closer to
the headlands where they will break and reflect into the bays. The presence of fringing
and barrier reefs will cause the waves to break and decrease in energy before reaching the
shore. The waves will refract slightly off of the reefs and then continue on towards the
shore (Bascom, 1973).
Land Use
The highest density of urban infrastructure in Black River Bay is located around
and downshore from the mouth of the Black River. Most residential buildings are located
along the southern portion of the bay between the mouth of the Black River and before
Parrottee Bay. The area around the Black River is fertile and an important habitat for fish
and wildlife (Jamaica National Heritage Trust, 2011). This made the area around the
river an ideal location for early settlement.
The Black River is one of Jamaica’s longest rivers measuring 53.4 km in length
and is supported by many tributaries. The river originates as an underground stream in
the mountains of Manchester and flows westward, disappearing again for a distance until
it reemerges in St. Elizabeth. The river flows into the Upper Morass (Jamaica’s largest
swampland) before it flows into the sea. The water of the Black River is clear but the
river receives its name for the dark black sediment that lines the riverbed (Jamaica
National Heritage Trust, 2011).

53
Most of the land surrounding the Black River is at or below 3 m making it
vulnerable to inundation from storm events and SLR. A large portion of infrastructure is
located within 100 m from the coast and below 3 m (Figure 19). Other than the area
around the Black River, most of the land use along the bay is fields, mangroves, or
herbaceous wetlands.
Figure 19. Land Use at 3 m Elevation Within Black River Bay.

54
Zone Name Boundary DescriptionLength
(m)Geology Landuse Elevation*
4350 Non-limestone (100) Herbaceous wetland
(71)
1 m (100)
Fields (29)
3550 Non-limestone (42) Herbaceous wetland
(80)
1 m (100)
Troy (58) Field (20)
17501 Troy (100) Herbaceous wetland
(46)
1 m (100)
Field (54)
1950 Troy (100) Field (100) 1 m (100)
1900 Troy (100) Field (76) 1 m (100)
Urban (23)
6. Black River
Bay East
Mouth of Black River to
start of Parrottee Pond
4450 Troy (100) Urban (100) 1 m (100)
3150 Troy (46) Urban (100) 1 m (71)
Non-limestone (54) 3 m (29)
19010 Non-limestone (100) Urban (100) 3 m (100)
Herbaceous wetland
(84)
2700 Non-limestone (100) Herbaceous wetland
(61)
3 m (55)
Mangrove (38) 5 m (44)
3850 Non-limestone (67) Mangrove (50) 5 m (68)
Montpelier (32) Field (21) > 5 m (32)
Short Open Dry (29)
*Elevation within 100 m of the shoreline
10. Starve Gut
Bay
9. Parrottee Point
Parrottee Pond
Parrottee Bay: from edge
of pond to headland
Parrottee Point: Headland
to start of straight
shoreline
Start of straight shoreline
to end of study area
1. Fonthill
5. Black River
Bay West
8. Parrottee Bay
7. Parrottee Pond
2. Malcolm Bay
3. Hunt Bay
4. Hodges Bay
Headland point to start to
headland point
Malcolm Bay: Headland to
Headland
Hunts Bay: Headland to
Headland
Hodges Bay to start of
Urban area
Start of Urban area to
mouth of Black River
Description of Zones
Black River Bay was split into ten zones based on geographic features. These
zones act as boundaries to help explain where erosion or accretion is occurring and where
the shorelines are stable. The zones include geologic formations, land use, and elevation
ranging from 1 to 5 m (Table 3). Each zone includes a main geomorphic feature such as
a bay, river, or point and uses the local names for these features.
Table 3. Zone Descriptions. Description of zone boundaries and the percent of
geologic formations, land use, and elevation that is found in each zone. Percent of
total shoreline is in parentheses.

55
Level of Beach Protection
The beach is the boundary between land and sea and is where waves interact with
the land. Waves drive the development and movement of beaches, but the interaction
with coastal features also influences the orientation and spatial movement of beaches.
Coastal features in Black River Bay that influence beach morphology are coastal
vegetation, reef protection, headlands and land use.
Coastal vegetation acts as a natural buffer for the shoreline against wave agitation
and rising sea levels. The roots of coastal plants hold sediment and prevent waves from
carrying the sediment offshore (Figure 20). This creates a more stable and increased
energy is needed to change the morphology of the beach (Gedan, et al., 2010; Mimura
and Nunn, 1998; Dahdouh-Guebas, et al., 2005).
Figure 20. Beach Protection by Vegetation. Mangroves and coastal vegetation traps
sediment and stabilizes the beach, preventing excessive beach erosion. Vegetation
also protects the shoreline from large storm surge by acting as a natural seawall.
Modified from CoastvsErosoin, 2015.

56
The type of coastal vegetation and level of coverage determines how stable the
beach is and the level of protection. The type of substrate is less important than
vegetation type for coastal erosion so the focus will be on the latter (Coups et al., 1996).
Along Black River Bay, there are mangroves, beach grass, and grassy coastal plains
(Asprey and Robbins, 1953). The level of coverage can be broken down in to high,
medium, and low coverage. High coverage plants have large, deep root systems and are
permanent plants such as mangroves and coastal trees. Medium coverage will be plants
with shallower root systems and are less permanent such as coastal grass and smaller
trees. Low coverage will be plants with shallow root systems, sparsely dense and less
permanent such as dune grass and beach grass. These low vegetation areas are also areas
that have been disturbed and cleared due to urban development.
Along Black River Bay, mangrove forests and herbaceous wetlands make up
9.96percent and 33.8percent of the shoreline respectively, providing a high level of
shoreline protection for these areas. Mangroves are stable, woody plants that grow in
forests in saline coastal habitats and have a dense root system. Herbaceous wetlands are
non-woody, leafy plants that attract wildlife and provide some protection from coastal
processes since they are usually densely populated (Silberhorn, 1994). The presence of
mangroves along shorelines have decreased erosion rates and in some cases promoted
progradation. Areas of mangrove deforestation generally show increased erosion rates
since the sediment is not restrained and free to move. This indicates that mangroves are
important to coastal protection from ersoin, storm events and rising sea levels
(Thampanya, et al., 2006).

57
Vegetation found along Black River Bay are pioneer plants, low creeping plants,
para grass, scrub and various large wooded trees (Asprey and Robbins, 1953). Pioneer
plants are a group of species that are usually the first to grow in disturped ecosystmes
such as coastal zones after a large storm event. The root systems are generally shallow
and they are easliy removed when the coastal zone is disturbed. These plants provide low
protection and often form in patches along the backshore or coastal dunes (Allaby, 2004).
Low creeping plants are usually found on coastal dunes or further from the beach face
and have shallow roots. They provide a bit more protection than pioneer plants but are
still catagorized as low protection. Para grass a group of grazing or pasture vegetation.
The root system is usually shallow but the land coverage is greater than the previously
mentioned vegetaion types . This type of vegetation provides a medium level of
protection against coastal erosion. Scub is a common term for a mixture of shrubs and
para grass that forms further inland and had and increase in protection level since the
roots are deeper and the plants are generally more stable than grasses or pioneer plants
(Allaby, 2004). Lastly, there are a variety of large stable trees, other than mangroves that
can occur along the shoreline. These trees can vary in density but are often found
sparingly along the shoreine. The densely populated areas are concidered to have a high
protection level since the roots are deep and the plants are stable (Asprey and Robins,
1953).
Landforms also influence how beaches erode and change over time. The coastal
landforms found along Black River Bay are depositonal landforms, reefs, and limestone
headlands. The level of landform protection can be grouped into high or low protection
based on if a landform is prescent in the area or not. Beaches with a high level of

58
protection from landforms will be areas where fringing reefs are located offshore or
headland bluffs are located adjacent to the beach. Low protection level will be areas
where these landforms are absent and the beach recieves the majority of the wave’s force
(Huggett, 2011; Tarbuck & Lutgens, 2007).
Beaches are the boundary between land and the ocean and have a high level of
land use and developemnt within 100 m from the coast. Storm swells can reach to
heights of 4 to 8 meters above normal wave heights (Morton, 2003; Stewart, 2004)
making areas near the shore at low elevations highly vulneravle to inundation and
erosion. Most of Black River Bay is less than 5 m above sea level making this area
highlly vulnerable in rising sea levels.
As sea-level rises, the shoreline along Black River Bay will expect to erode,
become inundated, and change geomorphologically. Normal wave and storm swells
interaction with the backshore will increase and cause the vegetation along the coast
tobecome damaged and receed. This will cause the shoreline to become more unstable as
the level of vegetation protection is decreased. As the shoreline’s protection is decreased,
waves will have a greater effect on sediment transport and beaches will tend to move
inland or elsewhere causing an expected loss of the overall shoreline (Sorensen ,
Weisman, and Lennon, 1984). Sediment transported from the shore and deposited
offshore will effect reef systems and hinder their productiviy and possible cause them to
become damaged or die (Rogers, 1990). This will further decrease the level of shoreline
protection causing more wave energy to reach the shore and increase erosion rates. The
infalstructure along the coast will likely become damaged or lost (Huggett, 2011;
Cambers, 1997). This will effect the tourism economy, local busnesses, and the

59
community of Black River since the coast supports a large part of their economy and
food source.

60
CHAPTER 4. METHODS
Images used in this study were taken by the Quickbird and GeoEye satellites. The
Quickbird satellite was launched October 18, 2001 and orbits at an altitude of 450 km at a
speed of 7.1 km/second. The orbit time is 93.5 minutes and produces the largest swath
width of any available commercial satellite. This produces images with resolutions as
detailed as 0.6 m/pixel. Standard images like the ones used in this study are
radiometricallly corrected, sensor corrected, geometrically corrected and mapped to a
cartographic projection and have uniform pixel spacing throughout the whole image
(DigitalGlobe, 2006).
The GeoEye-1 satellite was launched September 6, 2008 and orbits at an altitude
of 770 km at a speed of 7.5 km/second. It has an orbit time of 98 minutes and capable of
producing images with 0.46-0.5m/pixel resolution. All Standard images from
DigitalGlobe have been rectified and have a Root Mean Square Error of 2.3 m. This error
will be added to the error found during the georeferncing stage (Satellite Imaging
Corporation, 2004).
IKONOS satellite images were used to identify beach features, such as berms,
dunes, vegetation, coral reefs, and anthropogenic structures. Field surveys and Global
Positioning System (GPS) cameras were used to evaluate current placement and
conditions of beaches in the study area. IKONOS satellite images were purchased from
Digital globe for the study area. The images acquired were from the Quickbird satellite
for April 2003 and December 2007 and from the GeoEye satellite for March 2012. All
sets of images included both panchromatic and multispectral images (Table 4). The
panchromatic images were the primary source for this study.

61
Image Source Image Band Acquisition DateSpatial
Resolution
Radiometric
ResolutionRMS Error
QuickBird Multispectral April 2003 2.4 m 16 bit
QuickBird Panchromatic April 2003 0.6 m 16 bit
QuickBird Multispectral December 2007 2.4 m 16 bit
QuickBird Panchromatic December 2007 0.6 m 16 bit
GeoEye Multispectral March 2012 2 m 11 bit
GeoEye Panchromatic March 2012 0.5 m 11 bit
0.297 pixels
0.452 pixels
0.325 pixels
Data Preparation and Processing
The first step to monitoring a shoreline is to assemble any preexisting information
about the study area such as historic land use or previous field surveys of beaches in the
study area. Geographic Information System (GIS) layers of land use, geology and soil
for the Black River Bay area was obtained from Mona-Geoinformatics Institute (MGI)
and used in conjunction with satellite images to interpret the conditions and behaviors of
sandy beaches along the shoreline. GIS data layers including elevation and coral reef
locations were acquired from various sites including World Resources Institute and
GeoCommunity. A full list of data sources can be found in Appendix A.
After the preexisting information is gathered, the next step is to prepare the data
and to determine the uncertainties associated with the data source and the measurement
method (Thieler, et al., 2013). The IKONOS images were examined for spatial
resolution and bit size. They were then mosaicked using the georeference image method
and then each image was georectified to an ESRI basemap. The accuracy of each
georectified image is examined through ground control points (GCP) and the root mean
square (RMS) error which is found by using the equation:
RMS error = [(xb – xi)2 + (yb – yi)
2] ½ (1)
Table 4. Imagery Database from Digital Globe.

62
where xb and yb are the coordinates for the basemap and xi and yi are the coordinates for
the image being georectified (Linder, 2009; Hughes, McDowell, and Marcus, 2006). The
RSM error determines how accurate the images are georectified to the basemap by using
GCPs. GCPs link the satellite images to the corresponding location on the earth’s surface
by creating a regression equation (Equation 1) that indicates how far in the x and y
direction each pixel should be moved to rectify the image. A first order polynomial
regression is created for each image using the GCPs. The distance the GCPs are from the
regression line is measured by the RMS error which is automatically generated in
ArcMap (Linder, 2009). This RMS error indicates the number of pixels the GCPs need
to move in order to become perfectly rectified. Any RMS values under 1.0 are
acceptable and values close to zero are desired since this indicates accuracy between the
images (Schmitz et al., 2008). A manual check to compare measurements between
photos was performed and compared to the maximum RMS error. GCP from 10 well
defined locations where measured to the shoreline and rates were calculated. An error of
0.22 m was determined for the three photos.
For this study, a minimum of four, evenly distributed GCPs were used; mainly
building corners, intersections between roads and other well-defined objects to georectify
each of the images. The RMS error for each GCP calculated during the georectification
process can be found in Appendix B. Since the RMS for the 2003, 2007, and 2012
images were 0.297, 0.452, and 0.325 pixels respectively, the georectification was
successful and the images were warped to the map projection, Universal Transverse
Mercator (UTM) WGS 84, zone 18N using a first order polynomial transform algorithm
(El-Asmar and Hereher, 2010; Chen, Hsu, and Lee, 2004). The equation:

63
Georectification error = (RMS error) * (Image Pixel Length) (2)
where the RMS error and the image pixel length is was used to find a the georectification
error for each image (Linder; 2009). The maximum error of 0.27 m from the photos was
used to determine the maximum georectification error for the study.
The coastal zone is defined as the boundary between water and land. Therefore,
the high water line (HWL) and the vegetation line are used in this study to determine the
placement of the shore and are identified by the vegetation line and the beach swash zone
(Leon and Tavares Correa, 2004). The vegetation line is a hard line easily identified by
satellite images and is used to indicate the back or end of the beach area (Robinson et al.
2012). For this study, the vegetation line will be used as the main indicator for overall
shoreline change since it represents a more permanent loss over the nine year period.
Coastal grass can be removed easily due to coastal development and other disturbances.
This was taken into consideration during the digitization process; therefore, the use of the
vegetation line is the most accurate depiction of shoreline change for this study. Changes
in the waterline are varied and depend on tides and seasons; therefore, the use of the
waterline for determining shoreline change is less accurate for the method used in this
study and would be more appropriate for studies where beach profiles and water heights
are monitored monthly. Changes in beach widths are beneficial to observe but for this
study it is not a good indicator for changes in shoreline position or for determining the
rate of beach erosion or recovery. A beach width can increase due to increased wave
energy by decreasing the beach slope. Sediment is transported offshore and erosion has
technically occurred; however, from a spatial observation, the beach appears to have
increased in size. Without the beach slope and observations in beach profiles, the

64
changes in beach widths are a less accurate depiction of shoreline changes and therefore,
will not be used to determine the rate of shoreline change for Black River Bay.
After georectifing the images to insure accuracy, the images were digitized by
hand for each year at a 1:1250 scale. A baseline was created 100 m offshore to measure
the spatial movement of the shoreline. A transect was created with 50 meter spacing and
a measurement for beach width, change in vegetation line and change in waterline were
then taken at each of the 593 transects (Appendix C) . The study area was then split into
10 zones based on physical features such as bays, headlands or urban areas. The
measurements were then graphed by zone for the full area and trends were identified.
Box plots show variation in rates by zones. The circles in the box plot graphs represent
outliers 1.5 times the box length and the asterisk represents outliers 3 times the box
length.
Fieldwork was conducted during January 2014. A team of 9 members split into 3
groups to conduct beach surveys along two beaches within the study area to identify
geomorphic features and to become familiar with the study area. A photo log (Appendix
D) was created to document beach conditions along Hunts Bay and Parrottee Point.
Locations of the waterline (beach toe), berm line and vegetation line were noted for
locations along Parrottee Point and Hunts Bay. Field observations were used as a field
check to compare and understand features seen in the satellite photos. The field
observations determined Parrottee Point had a sandy dune system located along the
southeastern stretch and no protection on the western portion. Hunts Bay was observed
as a sandy shoreline with mangrove forests protecting each side of the beach. Fringing

65
reefs were identified offshore of the dune systems along Parrottee Point and Starve Gut
Bay and also located around Hunts Bay and Hodges Bay.
A manual measurement error (MME) was determined by duplicating the
digitation process for a 2 km section along the southern portion of the study area. A new
line was digitized along the 2 km sample area and measurements of the waterline and
vegetation line for each year were taken at transects 500 to 540. The new measurements
were then compared to the original measurements and a percent change equation was
used to determine the accuracy between the datasets by calculating a percent difference
between the measurements (Hapke and Reid, 2007; Bolstad and Smith, 1992). The
manual error was calculated to be between 0.33 m and 0.39 m for the waterline and
vegetation line respectively (Bolstad and Smith, 1992).
The error for georectification and the manual measurement error were then added
to the maximum error from the satellites to determine the overall uncertainty and
detection limit used for this study:
Measurement Uncertainties (m) = [(Georectification error)2 + (MME)2 +
(Satellite RMS error)2]1/2 (3)
Therefore; the measurement uncertainty is [(0.27 m)2 (0.39 m)2 + (2.3 m)2]1/2 =
2.4 m indicating that the detection limit is ±2.4 m and all measurements between -2.4 m
and +2.4 m are considered to have no change (Hapke and Reid, 2007). The annualized
retreat rate uncertainty (m/yr) based on the image errors is calculated by taking the value
calculated from Equation 3 and dividing the value by the studied time period of nine
years. This comes out to an annual rate uncertainty of ±0.3 m/yr (Hapke and Reid,

66
Uncertainties or Errors Values
Satellite Image RMS error 2.30 m
2003 RMS error 0.30 pixels
2007 RMS error* 0.46 pixels
2012 RMS error 0.32 pixels
2003 Georectification error 0.18 m
2007 Georectification error* 0.27 m
2012 Georectification error 0.16 m
Manual Measurement error 0.39 m
Measurement Uncertainty ± 2.40 m
*Used as Maximum error
2007). A summary of the errors (Table 5) were used to determine the maximum errors
used in the study.
Predicting Shoreline Change
SLR is currently rising at a 0.003 m/yr rate and is predicted to increase to 0.18 to
0.59 m/yr by 2100 (Church et al., 2013). This will cause increased coastal inundation
and increased wave interaction with the shoreline. Coastal erosion will likely increase
putting coastal resources and infrastructure at risk. There are different models used to
predict the level of inundation SLR will have a coastal area (FitzGerald et al., 2008).
Predicted shoreline erosion calculated from the shoreline changes and SLR over the nine
year study was used to predict erosion rates. In many studies the Bruun rule is used to
predict the displacement along a shoreline due to SLR; however, the beach slopes are
unknown for the study area so this method would be better used with field studies
Table 5. Uncertainty and Error Values

67
associated with beach profile measurements (Schwartz, 1967; Dubois, 1975). Since the
beaches are all assumed to be low angled, the generalized assumption used by the IPCC
of 1:100 movement will be used for this study. This states that 1 unit of SLR will result
in 100 units of inland movement. (Wong et al., 2014; Church et al., 2013; FitGerald et
al., 2008). Therefore, SLR of 0.003 m/yr results in a 0.3 m inland movement. The
equation based on Robinson et al., (2012):
Shoreline ChangeYears = (Movement due to SLR)* Years +
(Erosion Rate of Black River Bay)*Years (4)
will be applied to the overall shoreline as well as for each zone for 10, 20 and 30 years to
predict the estimated shoreline change along Black River Bay.
Classification of Shoreline Protection
The shoreline was grouped into classifications of vulnerability based on reef
protection, the presences of sandy beaches, vegetation, and resistant shorelines. Coral
reefs were classified as a low, medium, or high level or protection based on if they are
present along the shoreline and the distance they are located from the shoreline.
Shorelines that lack a reef are classified as low reef protection. Shorelines where a reef is
located roughly 700 m from the shore are considered offshore reefs and provide a
medium level of protection. Areas along the shore where reefs are located within 300 m
are considered nearshore reefs and classified as providing a high level of reef protection.
Areas along the shoreline were identified as either a sandy beach a non-sandy
beach. The locations where sandy beaches were identified were used to understand the
relationship between erosion rates and reef protection. Vegetation located within 100 m

68
from the shoreline was identified as mangrove swamps, wetlands, or other. Resistant
shorelines such as headlands, bluffs, or seawalls were identified and classified as either
natural or artificial.

69
CHAPTER 5. RESULTS AND DISCUSSION
The results of this study indicate that most of the sandy beaches along Black
River Bay have changed since 2003 either by erosion or accretion. The most change
occurred during the storm period from 2003 to 2007 when Hurricane Ivan passed in
2004. According to the vegetation line, 50 percent of the measured transects experienced
and only 3 percent experienced accretion and 47 percent experienced no measureable
change during the storm period (Appendix E). During the post-storm period from 2007
to 2012, only 10% of the transects experienced erosion while 25 percent experienced
accretion and 65 percent experienced no measurable change. Of the transects measured
during this time, 47 percent experienced no change during the storm period and 66
percent during the post-storm period. This pattern suggests that a relatively long segment
of the shoreline in Black River Bay is stable with most change occurring in ‘hot spot’
erosion areas or ‘cold spot’ accretion areas which are mainly unprotected beaches along
the coast where sand sediment can be easily transported onshore, offshore, or alongshore
by wave currents.
Rates of Shoreline Change
Overall Trends. Erosion and deposition trends vary among different landforms
and among the different geographic zones (Figure 21 to 23). More variability is seen in
the southern zones where most of the sandy shorelines are located.

70
Figure 21. Shoreline Changes from 2003 to 2007 by Zone.
Top graph shows vegetation line differences and the bottom
graph shows waterline differences. Zones descriptions are in
Table 3.
Zones
Zones

71
Figure 22. Shoreline Changes from 2007 to 2012 by Zone. Top
graph shows vegetation line differences and the bottom graph
shows waterline differences. Zones descriptions are in Table 3.
Zones
Zones

72
Figure 23. Shoreline Changes from 2003 to 20012 by Zone. Top
graph shows vegetation line differences and the bottom graph
shows waterline differences. Zones descriptions are in Table 3.
Zones
Zones

73
Within Black River Bay, shorelines located near the seaward side of the bay are
expected to experience greater changes and vary more due to higher wave energies and
current velocities. During the storm period from 2003 to 2007, zones 1 through 5 showed
little to no change in both the vegetation and waterline. The greatest change occurs in the
southeastern part of Black River Bay from zones 6 through 9 where erosion dominates
with the largest change occurring at zones 8 and 9. These zones are Parrottee Bay and
Parrottee Point and almost all of the shoreline in these zones is composed of sandy
beaches which are the most vulnerable to changes due to storms. This area is also located
outside of the large bay and is exposed to more frequent waves, higher energy waves, and
higher current velocities. High variability in both vegetation and waterline is seen in
zone 8 where waves appear to lack a dominate direction. There is also a break in reef
protection in the middle of the zone which could be possible reasons behind large
variability in the zone. Zone 9 has the largest outliers which are due to the disappearance
of a foreland spit along Parrottee Point.
After an intense storm event, wave energy will decrease and return to natural,
daily currents. Sediment will be transported back to shore and the shoreline will start to
recover. In some cases, depositional landforms will appear due to an access of sediment
being delivered back to the shore. During the post-storm period from 2007 to 2012,
zones 1 through 4 experienced no change in the vegetation line but a seaward movement
of the waterline in zones 1 and 2. This is due to the formation of a hooked spit in zone 1
at Fonthill Park where access sand was being deposited. Since the vegetation line does
not recover during the post-storm period for this zone, an overall erosion trend was
observed. The southern portion of Black River Bay generally experienced recovery of

74
the vegetation line and waterline in all zones except in zone 8 where a mix of erosion and
recovery occurred. The greatest amount of recovery during this time appears to have
occurred in zone 10. This area has a high level of reef protection as well as coastal dunes
on the back shore. This could possibility be due to the storm’s energy being reduced
from fringing reef protection and was only able to transport a small amount of sand from
the shoreline. The sand that was removed was then easily replaced during the post-storm
period due to the large sediment supply from the dunes and sediment bars located just
offshore.
Overall, the net change in the shoreline from 2003 to 2012 was erosional with
areas of varying degrees of recovery and stability (Table 6 and Figure 24). The averaged
shoreline changes and estimated rates for each zone are summarized in Appendix F. The
vegetation line was used to calculate the annual rate of -0.31 m/yr for the entire study
area. The greatest rate of erosion occurred in zone 9 at -7.90 m/yr over the 4.25 year
period. Most of this erosion likely occurred during Hurricane Ivan in 2004 and has since
recovered at a rate of roughly 3.32 m/yr. If this rate continues, it will theoretically take
an estimated 21 years to recover the sediment lost during Ivan. The greatest recovery
during the post-storm period occurred in zone 6 with a maximum rate of 3.20 m/yr.
Accretion is expected here since it is a back bay where waves are calmer and located
south of the Black River where river sediments are likely deposited.

75
Mea
nM
inM
axM
ean
Min
Max
Mea
nM
in
Max
1. F
ont
hill
87
-0.7
2-2
.94
0.3
0-0
.16
-2.7
00.0
0-0
.42
-2.9
00.2
90.5
6
2. M
alco
lm B
ay72
-0.6
6-1
.90
0.0
1-0
.12
-0.7
00.5
0-0
.37
-1.9
00.0
10.5
4
3. H
unt B
ay33
-0.1
0-1
.00
1.1
30.0
30.0
00.4
0-0
.03
-1.0
41.1
30.1
3
4. H
odge
ns B
ay40
-0.5
5-1
.50
0.0
00.0
8-0
.25
0.8
0-0
.22
-1.3
00.2
20.6
3
5. B
lack
Riv
er B
ay W
est
39
-0.4
4-0
.79
0.0
00.2
90.0
01.7
5-0
.05
-0.8
01.7
50.7
3
6. B
lack
Riv
er B
ay E
ast
88
-0.2
0-1
.70
1.2
31.0
6-0
.30
3.2
00.4
7-1
.70
3.1
50.8
0
7. P
arro
ttee
Pond
170
-0.7
5-1
.50
0.5
60.2
0-0
.60
1.0
0-0
.25
-1.7
00.9
70.9
5
8. P
arro
ttee
Bay
38
-1.3
1-1
.90
0.0
0-0
.10
-1.4
01.2
0-0
.67
-2.9
21.2
41.2
1
9. P
arro
ttee
Poin
t54
-2.8
8-7
.90
1.2
00.4
4-1
.20
2.4
0-1
.13
-8.0
92.0
33.3
2
10. S
tarv
e G
ut B
ay78
-1.3
8-2
.70
0.0
00.4
0-0
.30
1.0
4-0
.44
-2.9
80.2
81.7
8
-0.9
00.2
1-0
.31
1.0
7
Mea
n R
ecove
ry
Rat
es
Ann
ual R
ate
(m/y
r)
2003-0
7 R
ates
(m
/yr)
2007-1
2 R
ates
(m
/yr)
2003-1
2 R
ates
(m
/yr)
Tra
nsec
ts
(n)
Geo
grap
hic
Zone
Tab
le 6
. V
eget
atio
n L
ine
Chan
ges
and R
ates
fro
m 2
003 t
o 2
012.

76
Figure 24. Rates of Change by Zones. Variability is greatest where sandy
shorelines are located. The southern portion of Black River Bay is predominately
sandy shoreline. (a) Rates of change in vegetation line from 2003-2012, (b) rates
of change in waterline from 2003-2012, (c) rates of change in beach widths from
2003-2012.
(a)
(b)
(c)

77
Spatial Changes. Changes in location of a shoreline are due to the greater
frequency or rate of erosion or accretion at a site. Increased rates in erosion or accretion
will cause the waterline and vegetation line to respond by either moving landward or
seaward. Along Black River Bay, the shoreline occurred changes along the southern
portion of the bay, in zones 7 through 9, during the storm period (Figure 25). The
shoreline moved landward as it eroded the back shore trying to replace the sediment
removed during this period. There is greater spatial variability in the waterline than the
vegetation line since the waterline moves and responds to changes in the sediment budget
faster than the vegetation line. Sediment lost during a storm event can recover and
accrete along a shoreline, increasing the beach width and moving the waterline seaward,
faster than vegetation can recover. This often causes a lag in the relationship between
waterline and vegetation line.

78
Figure 25. Spatial Shoreline Change from 2003 to 2012. The change in the
vegetation line (a), waterline (b) and beach width (c) along the shoreline of Black
River Bay. The 2003 shoreline was used as the baseline. During the 9 year study
period, the vegetation line and waterline experienced the greatest change in zones 7
through 9 with the greatest recovery in zone 6. The beach widths follow the trends
of both the vegetation and waterline.
(a)
(b)
(c)
Offshore
Land
Land
Offshore

79
Label Zone(s)
Transects
(n)
Average Shoreline
Change (m)
Rate of Change
(m/yr)
HS 1 1 35-61 -12.7 -1.4
HS 2 3 127-150 -10 -1.1
HS 3 8 436-454 -15.2 -1.7
HS 4 9 465-474 -42.3 -4.7
CS 1 3-4 ~151-221 0 0
CS 2 6 319-338 15.8 1.8
CS 3 10 571-593 0 0
Hot and Cold Spots. Trends in vegetation line change for each period and help
determine hot spots and cold spots for each zone. Each hot spot and cold spot experience
different average shoreline change and rate of change for the nine year period (Table 7)
and are seen as a group of spikes in the data (Figure 26). Graphs for the waterline and
beach widths can be found in Appendix G. The shaded bar is used to represent the areas
below the detection limit and can be considered to experience no change over the time
period. Transects with a positive value indicate accretion/progradation of the shoreline
and negative values indicate erosion/recession of the shoreline. Four main hot spot areas
are seen along the bay in zones 1, 2, 8 and 9 while the main cold spot areas are in zones
3, 5, 6 and the last half of zone 10.
Table 7. Locations and Averaged Change and Rate for Hot Spots and Cold Spots.

80
Fig
ure
26. C
han
ges
in V
eget
atio
n L
ine
by Z
one.
T
he
aver
age
chan
ge
for
each
zone
is d
ispla
yed
bel
ow
the
zone
num
ber
and
all
hav
e an
un
cert
ainty
of
±2.4
m. N
egat
ive
val
ues
indic
ate
erosi
on.

81
Hot Spots. Hot spots are areas along the shore where erosional factors dominate
and there are high rates of erosion (Appendix H). These areas are generally found in high
energy environments where there is low protection from reefs or vegetation. The hot spot
located in zone 1 (HS 1) is mainly due to a sand bar and the area directly upshore and
downshore from the bar from transects 35 to 61. The bar closes off a lagoon and has
little permanent vegetation making it vulnerable to changes from storm events. The
average erosion loss for this bar is -12.7 m and an estimated -1.4 m/yr erosion rate.
The hot spot in zone 3 (HS 2) is due to the erosion along the eastern portion of
Malcolm Bay with some erosion along the western section of the bay (transects 127
through 150) where the waves mainly hit. As waves approach Malcolm Bay, they hit at
the western portion of the bay and deflect carrying sediment downshore and depositing
the sediment in this area. This is where the main part of the sandy beach is located and
experienced an average loss of -10 m and an average rate of -1.1 m/yr. There is a high
amount of cloud coverage on the 2003 QuickBird image so shoreline position for this
year could not be determined and is not included in the hot spot’s averaged loss and
erosion rate.
Parrottee Pond in zone 8 is where HS 3 it located. This area has some reef
protection located roughly 650 to 750 meters offshore. There is a break in reef protection
between transects 436 and 454 which is mainly where the highest shoreline loss in the
zone occurred. This area experienced an average loss of -15.2 m at an average rate of -
1.7 m/yr. Most of this loss occurred during 2003 to 2007 and is likely due to Hurricane
Ivan and other strong storms.

82
The largest hot spot (HS 4) located along the bay occurs in zone 9 at Parrottee
Point. This area is a sand spit and experienced an average loss of -42.3 m between
transects 465 and 475 with a maximum loss of -78 m at the tip of the point. An average
erosion rate of -4.7 m/yr occurred in this location with some accretion located roughly
1,250 m downshore. It is likely that the sediment removed during the storm period from
the point was deposited along this downshore location during the post-storm period.
Cold Spots. Shoreline locations where accretion or no change was experienced are
termed cold spots. These areas are the least likely to experience property loss since the
land has prograded or remained stable over the measured time period and are expected to
continue this trend. The most stable locations (CS 1) are in zones 3 and 4 where there are
two pocket beaches protected by vegetated headlands and fringing reefs. Some erosion
occurs in areas where there is a break in reef protection but the overall trend for the area
is stability and little to no change during the nine years.
The area where the largest accretion experienced was in zone 6 (CS 2) between
transects 319 and 338. This area is located roughly 2,100 m downshore from the mouth
of the Black River. Sediment discharged from the river is the likely origin for the
accretion during the post-storm period. The shoreline is also located in a back bay where
calmer waves reach the shore and deposition is allowed to occur. This area experienced
an average gain of +15.8 m and an average accretion rate of +1.8 m/yr. The southeastern
section of zone 10 (CS 3) between transects 571 to 593 is the most stable area within the
study area with no change experienced during the 9 year period. This area is composed
of limestone bluffs with an elevation of >5 m. Therefore, this area is the most resistant to
changes in the shoreline.

83
Influence of Shoreline Geology and Reef Protection
The areas that are predominantly sandy beaches showed the largest change in
shoreline and are the most affected by intense storm events. In Black River Bay, sandy
beaches make up 74 percent of the shoreline while a mix of headlands, mangroves and
rocky shores make up the remaining 26 percent (Table 8). Coral reefs protect 55 percent
of the shoreline and are expected to reduce the rate at which sandy shorelines erode.
Resistant shorelines, both natural (headlands and bluffs) and artificial (seawalls) can
influence how waves interact with the shoreline. These areas remained relatively stable
over the nine year period with the exception of the shoreline in front the seawall.
Shoreline vegetation such as mangrove forests and wetland swamps make up 70 percent
of the shoreline and the coastal area within 100 m from the shore. Mangroves provide
some shoreline protection in zones 1 and 2 where they are present at headlands and
directly along the shore.

84
Pre
sent
Not
Pre
sent
Sandy
Shore
Non-
Sandy
Mangro
ve
Wetlands
Oth
er
Natu
ral
Art
ific
al
Urb
an
14,3
50
15%
9%
8%
14%
1%
7%
3%
4%
1%
0%
1%
23,6
00
12%
1%
13%
9%
5%
11%
0%
0%
3%
0%
1%
31,6
50
6%
1%
6%
2%
5%
3%
0%
3%
4%
0%
0%
42,0
00
7%
6%
2%
2%
6%
0%
0%
6%
5%
0%
5%
51,9
50
7%
7%
5%
6%
0%
0%
0%
5%
1%
1%
6%
64,4
00
15%
0%
0%
15%
0%
13%
1%
0%
0%
0%
8%
73,2
00
11%
10%
2%
10%
0%
6%
0%
5%
0%
0%
2%
81,9
00
6%
6%
2%
5%
3%
0%
10%
1%
2%
0%
0%
92,7
00
9%
9%
0%
9%
0%
4%
5%
0%
0%
0%
0%
10
3,9
00
13%
7%
7%
3%
5%
7%
0%
6%
3%
0%
0%
Shore
line
Tota
ls29,6
50
100%
55%
45%
74%
26%
51%
19%
30%
18%
1%
24%
Reef
Pro
tection
Sandy S
hore
line
Resi
stant
Shore
line
Geogra
phic
Zone
Zone L
ength
(m)
Tota
l %
of
Shore
line
Vegeta
tion
Tab
le 8
. P
erce
nt
of
Shore
line
Type
Alo
ng B
lack
Riv
er B
ay.

85
Geographic
Zone
Transects
(n) Sandy
Transects
(n)
Low
Reef
Transects
(n)
Med
Reef
Transects
(n)
High
Reef
Reduced
Shoreline Erosion
1 87 -0.37 35 0.5 0 50 -0.72 No
2 72 -0.42 67 -0.47 0 5 0 Yes
3 33 -0.12 27 -0.12 0 6 0 Yes
4 40 -0.65 7 -0.81 0 33 -0.43 Yes
5 39 -0.03 21 -0.02 0 18 -0.03 Neither
6 88 0.54 88 0.54 0 0 No
7 64 -0.25 10 -0.02 54 -0.28 0 No
8 38 -0.49 6 -1.17 33 -0.34 0 Yes
9 54 -1.13 5 -2.75 49 -0.93 0 Yes
10 78 -0.6 33 -0.19 50 -0.67 0 No
Reef protection is expected to reduce the rate of shoreline erosion; however, in
Black River Bay, this is not always the case. A clear relationship cannot be determined
between the rates of shoreline change and reef protection along the bay (Table 9). Some
segments of the shoreline show reduced rates in locations where reefs are present such as
zone 8. This zone has a medium level of reef protection from offshore reefs. The rate of
erosion from 2003 to 2012 was observed to be lower at -0.34 m/yr where reefs are
present opposed to -1.17 m/yr in areas without reef protection. Other zones, such as zone
10, experienced higher erosion rates in areas where reef protection was high. Along the
shoreline in zone 10, shorelines with reef protection experienced a rate of -0.67 m/yr
opposed to -0.19 m/yr where reef protection is absent. Some of these areas were
limestone bluffs and narrow beaches. This indicates that other factors such as wave
energy and substrate likely have a larger influence on beach morphology and erosion
rates than the presence of coral reefs. Coral reefs are still an important factor to a healthy
marine ecosystem but their importance to shoreline protection along Black River Bay is
unclear.
Table 9. Rates of Sandy Shores Sue to Reef Protection from 2003 to 2012 (m/yr).
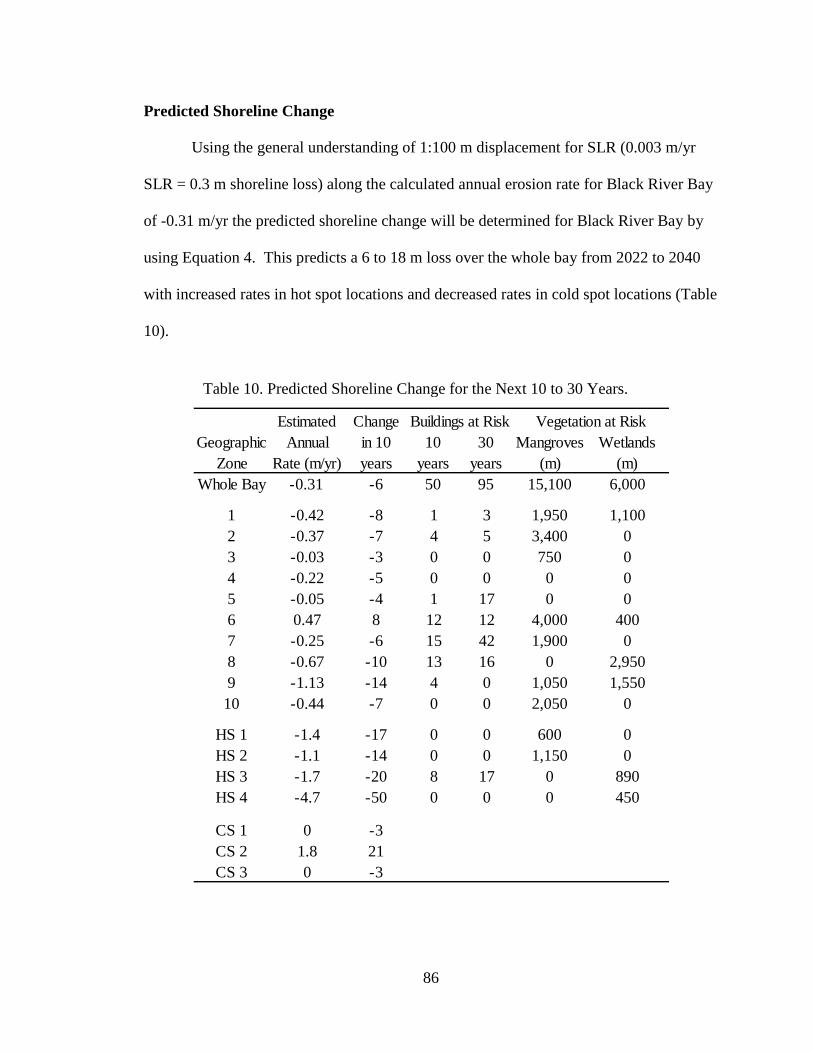
86
10
years
30
years
Mangroves
(m)
Wetlands
(m)
Whole Bay -0.31 -6 50 95 15,100 6,000
1 -0.42 -8 1 3 1,950 1,100
2 -0.37 -7 4 5 3,400 0
3 -0.03 -3 0 0 750 0
4 -0.22 -5 0 0 0 0
5 -0.05 -4 1 17 0 0
6 0.47 8 12 12 4,000 400
7 -0.25 -6 15 42 1,900 0
8 -0.67 -10 13 16 0 2,950
9 -1.13 -14 4 0 1,050 1,550
10 -0.44 -7 0 0 2,050 0
HS 1 -1.4 -17 0 0 600 0
HS 2 -1.1 -14 0 0 1,150 0
HS 3 -1.7 -20 8 17 0 890
HS 4 -4.7 -50 0 0 0 450
CS 1 0 -3
CS 2 1.8 21
CS 3 0 -3
Buildings at Risk Vegetation at RiskChange
in 10
years
Estimated
Annual
Rate (m/yr)
Geographic
Zone
Predicted Shoreline Change
Using the general understanding of 1:100 m displacement for SLR (0.003 m/yr
SLR = 0.3 m shoreline loss) along the calculated annual erosion rate for Black River Bay
of -0.31 m/yr the predicted shoreline change will be determined for Black River Bay by
using Equation 4. This predicts a 6 to 18 m loss over the whole bay from 2022 to 2040
with increased rates in hot spot locations and decreased rates in cold spot locations (Table
10).
Table 10. Predicted Shoreline Change for the Next 10 to 30 Years.

87
The estimated erosion rates of -0.31 m/yr will cause an estimated loss of 18
meters in the next 30 years. This will affect sandy beaches, coastal vegetation and
coastal buildings. Hot spot areas will experience a greater loss in the shoreline
(Appendix I) such as an estimated 60 m at HS 3 and up to 150 m at HS 4. These
predictions are the maximum expected loss and are based off of extreme erosion events.
The area downshore of the Black River (CS 2) is hard to predict since little to no change
was observed during the storm period and a large rate of recovery was observed during
the post-storm period. This is likely due to the discharge from the Black River as well as
the calm waters since the shoreline is located in a back bay, furthest away from seaward
currents. Changes in SLR, storm events, and protection measures will influence how the
shoreline changes. Since the effects these factors will have on future shoreline position is
hard to predict, the estimated shoreline changes and the predictions for this study can
change in response to these factors.
Sea level rise is expected to increase so the rates calculated along Black River
Bay will increase in relation to the rate SLR is changing. The number and intensity of
storm events that will occur in this area will also cause a change in erosion rates. Storm
events are likely to increase in intensity in relation to changes in SLR and global
temperatures. More intense storms will transport more sediment and cause greater
changes along the shoreline. The presences of artificial structures such as the seawall at
transects 258 to 260 will likely protect the shoreline behind it to some degree. The beach
in front of the wall will most likely disappear within the next 10 to 20 years and the wall
might even fail within the next 20 to 30 yrs. This will then allow the shoreline behind the
wall to erode and become vulnerable to SLR and coastal erosion.

88
Property damage is already occurring along segments in Black River Bay. One
example is a series of buildings located at transect 398 (Figure 27 and 28) where SLR and
shoreline erosion has damaged the building and it is not located at the waterline. In the
next 10 years, the most seaward building will likely be lost and in 30 years the second
building could also be permanently damaged. This threat of shoreline loss is predicted
along the shoreline in zones 5, 7 and 8 where increased erosion rates were observed.
Predictions indicate that roughly 50 urban structures are at risk within the next 10 years
and 95 within the next 30 years. The predictions also indicate that roughly 9 km of
mangrove forests and 4 km of coastal wetlands located within 100 m of the shoreline will
be at risk to SLR, inundation and shoreline erosion in the next 10 to 30 years.
Figure 27. Property Damage Due to SLR and Shoreline Erosion. Picture
taken in January, 2014.

89
Figure 28. Property Damage Along Black River Bay. A loss of -6 meters is
expected in 10 years and -18 meters in the next 30 years. This loss of shoreline
will damage properties such as the condos seen above.

90
Threats and Responses to Coastal Resources
The increased removal of sediment due to increased erosion rates and SLR will
harm the fringing reefs located in the bay. The deposition on the reefs will decrease the
amount of light availed for photosynthesis and make filter feeding difficult for corals.
This will cause the corals to become stressed and expel the algae zooxanthellae. This
leads to coral bleaching and potentially the death of the reef ecosystem (James, 1982).
As these reef systems deteriorate, the shoreline protection the reefs provide will decrease
and the marine ecosystem will deteriorate. This could lead to increased rates of erosion
along the shoreline where reef protection is observed to reduce rates. The deterioration
of reefs will also affect fish population and the fishing industry. The creation of marine
statuaries such as Galleon Bay Fish Sanctuary will help limit the effects felt by human
forces in hopes to preserve the fish and coral populations.
Coastal ecosystems located in wetlands and mangroves will also become damaged
and deteriorate as SLR increases and the shorelines erode. Limiting deforestation and
replanting deforested areas will help decrease the rate of erosion along Black River Bay.
Allowing the natural flow of sediment while protecting the back shore from increased
wave interactions are the main benefit of maintaining coastal vegetation as well as
providing a healthy habitat for coastal wildlife.
Artificial structures such as seawalls can be a temporary solution for land
protection. These structures limit the flow of sediment and can become costly to
maintain. They will reduce the rate of erosion along the back shore and the area behind
the structure which can be beneficial in some cases. The seawall located in Black River
Bay was built to protect a road from shoreline erosion. In 2003, there was roughly 8 m of

91
shoreline on the seaward side of the seawall, this decreased to roughly 4 to 5 meters in
2007. By the end of the study period in 2012, the shoreline increased to about 5 to 6
meters. This means, on average, the shoreline in front of the seawall eroded by -0.46
m/yr and had an average loss of -4.5 m. The recover for this segment is minimal and, as
expected, has not fully recovered from the storm period. These structures should be used
only with a coastal management plan to insure the shoreline in front of the wall is not
being depleted at an alarming rate. Often, seawalls with evenly spaced holes along the
base allow some sediment to be returned to the beach and can yield more effective results
than a completely solid structure.
Summary
The prediction of shoreline erosion is an estimation since many factors besides
SLR are needed in order to determine the spatial pattern of erosion and recovery. All
factors must be considered when determining the vulnerability of a shoreline, including
coral reef protection, vegetation coverage, wave energy, and shoreline geology. Sandy
beaches will spatially change faster than headlands or highly vegetated areas which will
remain more stable over time. Areas less than 3 m will flood easily during storm events
and areas between 3-5 meters will flood often during extreme storm events. Sandy
beaches will erode at a faster rate than more resistant areas such as headlands,
mangroves, and sea walls. If the estimated loss in shoreline occurs, over 65 buildings
will be lost or at risk and all 1300 buildings are at risk of inundation.
Pocket beaches such as Fonthill Beach, Malcolm Bay, and Hunts Bay will
spatially change faster than other parts of the bay. Parrottee Point is a sand spit and

92
highly vulnerable to spatial changes in shoreline position. The area downshore of the
Black River is an area that experienced accretion and could continue to accrete in the
next 10 to 30 years. The areas with the least risk of erosion are the headlands adjacent to
Malcolm and Hunts Bay in zones 3 and 4 and the bluffs located at the southern portion of
the study area. These areas will see little to no spatial change over the next 30 years.

93
CHAPTER 6. CONCLUSIONS
The island of Jamaica relies on its shorelines for coastal resources and economic
support through tourism and the fishing industry. Sea-level rise is stressing coastal
communities through the risk of inundation and increased rates of erosion due to
increased wave interactions and large swells produced during storm events such as
Hurricane Ivan in 2004. Black River Bay, located along the southwest coast, is a
vulnerable area to SLR and erosion since the majority of the area is located at or below 3
m elevation and the amount of reef protection is low compared to the northern portion of
the island.
The use of satellite images helped to geospatially determine the changes along
Black River Bay from 2003 to 2012 in response to normal wave interactions and changes
due to Hurricane Ivan. Relationships between the digitized vegetation line and waterline
were used to determine changes in beach widths and spatial changes along the shoreline.
These changes, along with a shoreline classification, were used to determine the most
vulnerable areas within the study area and to determine overall shoreline erosion and
recovery rates along the shoreline and used to predict shoreline changes for the next 10 to
30 years.
An overall erosion rate for Black River Bay from 2003 to 2012 was found to be
-0.31 m/yr. The average rate during the storm period between 2003 and 2007 was higher,
at a rate of -0.90 m/yr while recovery of the shoreline was observed during the post-storm
period from 2007 to 2012. A rate of +0.21 m/yr was observed during this period which
allowed most of the sediment to be returned to the shore and some coastal vegetation to
recover, but not completely.

94
Black River Bay has fringing reefs as well as open shorelines which influence
where erosion is higher and where shorelines are more stable. The presence of coastal
vegetation such as mangroves also influences the rate of erosion along the shoreline. Hot
spots were located in the areas with little to no protection with the exception of Parrottee
Point which experienced the highest rate of erosion due to the disappearance of a foreland
spit. Cold spots were located in some areas where fringing reefs were located within 300
m from the shore and mangrove headlands were present. An exception to this
observation was the shoreline located downshore from the mouth of the Black River.
This area has little to no reef protection and has the most coastal development while
experiencing a large accretion rate.
Predicted loss of land was calculated using the current SLR rate of 0.003 m/yr as
well as the calculated rate of change for the bay. An average loss of 6 to 18 meters is
expected within the next 10 to 30 years respectively. Predicted loss is higher in hot spots
and lower in cold spots as expected. Coastal management plans should be created to help
combat and limit the effects felt by shoreline erosion. The protection and preservation of
coral reefs and coastal vegetation is important. Artificial structures should be used only
with coastal management to insure the effects will be beneficial to the coastal
communities and the surrounding environment.

95
LITERATURE CITED
Allaby, M., 2004. Pioneer plant. A Dictionary of Ecology
http://www.encyclopedia.com/doc/1O14-pioneerplant.html.
Asprey, G. F., and Robbins, R. G., 1953. The vegetation of Jamaica. Ecological
Monographs, 12, 359-412.
Barnhardt, W. A. 2009. U.S. geological survey 2008 report: Coastal change along the
shore of Northeastern South Carolina: The South Carolina coastal erosion study.
United States Geological Survey.
Bascom, W., 1980. Waves and Beaches. Garden City: Anchor Books.
Beck, M., 2014. Coasts at risk: an assessment of coastal risks and the role of
environmental solutions. United Nations University-Institute for Environmental
and Human Security, The Nature Conservancy, Coastals Resources Center at
University of Rhode Island Graduate School or Oceanography.
Beekhuis, J. V., 1981. Tourism in the Caribbean: Impacts on the economic, social, and
natural environments. Ambio, 10(6), 325-331.
Bollmann, M.; Bosch, T.; Colijn, F.; Ebinghaus, R.; Froese, R.; Gussow, K.; et al., 2010.
World ocean review 2010: Living with the oceans. Hamburg: maribus gGmbH.
Bolstad, P., and Smith, J., 1992. Errors in GIS: Assessing spatial data accuracy. Journal
of Forestry, 90(11), 21-29.
Bosser, K.; Levoy, F.; Flageollet, J. C.; Monfort, O., and Rousset, H., 2000. Trade wind
intensification and hurricanes on a Caribbean beach, Martinique Island: A
comparison of their morphological impacts from field experiments and numerical
simulations. Journal of Coastal Research, 877-889.
BREDS., 2014. Galleon Fish Sanctuary. BREDS- Treasure Beach Foundation:
http://www.breds.org/projects_ongoing.php.
British Broadcasting Corporation (BBC)., 2014. Coasts. BBC:\
http://www.bbc.co.uk/bitesize/ks3/geography/physical_processes/coasts/revision/
3/.
Bueno, R.; Herzfeld, C.; Stanton, E., and Ackerman, F., 2008. The Caribbean and
climate change. Stockhom: Environment Institute and Global Development and
Environment Institute, Tafts Universtiy.

96
Burke, L., and Maidens, J., 2004. Reefs at Risk in the Caribbean. Washington, D.C.
World Resources Institute.
Burke, L.; Reytar, K.; Spalding, M., and Perry, A., 2011. Reefs at risk revisited.
Washington, DC: World Resources Institute.
Bush, D. M., and Young, R., 2009. Coatal features and processes. The Geological Society
of America, 47-67.
Cabanes, C.; Cazenave, A., and Provost, C., 2001. Sea level rise during past 40 years
determined from satellite and in situ observations. Science, 840-842.
Cambers, G., 2009. Caribbean beach changes and climate change adaptation. Aquatic
Ecosystem Health & Management, 12(2), 168-176.
Cambers, G., 1997. Beach changes in the Eastern Caribbean Island: Hurricane impacts
and implications for climate change. Journal of Coastal Research, 29-47.
Carey, B., 2014. Coral reefs provide protection from stroms and rising sea levels,
Stanford research finds. Standford News.
http://news.stanford.edu/news/2014/may/coral-reef-protect-051314.html.
CARICOM Secretariat., 2013. Fisheries. Caribbean Agribusiness:
http://www.agricarib.org/primary-dropdown/fisheries.
Causes of Climate Change., 2013. United States Encironmental Protection Agency
http://www.epa.gov/climatechange/science/causes.html.
Coasts at Risk., 2014. Coasts at risk: an assessment of coastal risks and the role of
environmental solutions. United Nations University-Institute for Environmental
and Human Security, The Nature Conservancy, Coastals Resources Center at
University of Rhode Island Graduate School or Oceanography.
Centurioni, L. R., and Niiler, P. P., 2003. On the surface currents of the Caribbean Sea.
Geophysical Research Letters, 30(6).
Charpentier, W., 2005. Coral reefs in Jamaica. USA Today.
http://traveltips.usatoday.com/coal-reefs-jamaica-1380.html.
Chen, P.-H.; Hsu, S.-C., and Lee, G.-W., 2004. Error modelling on registration of high-
resolution satellite images and vector data. 20th Congress of International Society
for Photogrammetry and Remote Sensing. Istanbul.

97
Church, J. A.; Clark, P.; Cazenave, A.; Gregory, J. M.; Jevrejeva, S.; Levermann, A.; et
al., 2013. Sea level change. In The Physical Science Basis Climate Change 2013
Cambridge, UK and New York, NY. USA: Cambridge University Press. pp.
1137-1216.
Correa, I. D.; Alcantara-Carrio, J., and Gonzalez R, D. A., 2005. Historical and recent
shore erosioin along the Colombian Caribbean coast. Journal of Coastal
Research, 52-57.
Coups, H.; Geilen, N.; Verheij, H.; Boeters, R., and Belde, G., 1996. Interactions between
waves, bank erosion and emergent vegetation: an experimental study in wave
tank. Aquatic Botany 53(3) 187-198.
Cubasch, U.; Wuebbles, U.; Chen, D.; Facchini, M.; Frame, D.; Mahowald, N.; et al.
2013. Introduction. In Climate change 2013: The physical science basis
Cambridge, United Kingdom and New York, NY, USA: Cambridge University
Press. pp. 119-158.
Dahbouth-Goebas, F.; Jayatissa, L.P.; Bosire, J.O.; Lo Sene, D., and Koedam, N., 2005.
How effective were mangroves as a defense against the recent tsunami? Current
Biology 15(12) 443-447.
Daniel, E., and Abkowitz, M., 2005. Predicting storm-induced beach erosion in
Caribbean small islands. Coastal Management, 33(1), 53-69.
Davidson-Arnott, R. G., 2005. Conceptual model of the effects of sea level rise on sandy
coasts. Journal of Coastal Research, 21(6), 1166-1172.
DigitalGlobe., 2006. QuickBird imagery products: Product guide. Longmont, Colorado
DigitalGlobe Inc.
Dolotov, Y. S., 1992. Possible types of coastal evolution associated with the expected rise
of the world's sea level caused by the "Greenhouse effect". Journal of Coastal
Research, 8(3), 719-726.
Donoghue, J. F., and White, N. M., 1995. Late Holocene sea-level change and delta
migration, Apalachicola river region, northwest Florida, U.S.A. Journal of
Coastal Research, 11(3), 651-663.
Dubois, R., 1975. Nearshore evidence in support of the Bruun rule on shore erosion. The
Journal of Geology 84(4) 485-491.
ECLAC Economic Commission for Latin America and the Caribbean., 2004. Assessment
of the socioeconomic and environmental impact of hurricane Ivan on Jamaica.

98
El-Asmar, H., and Hereher, M., 2010. Change detection of the coastal zone east of the
Nile Delta using remote sensing. Environmental Earth Science 1-9.
Firoozfer, A.; Neshaei, M. A., and Dykes, A. P., 2014. Beach profiles and sediments, a
case of Caspian Sea. International Journal of Marine Science, 4(43), 1-9.
FitzGerald, D.; Fenster, M.; Argow, B., and Buynevich, I., 2008. Coastal impacts due to
sea-level rise. Annual Review of Earth and Planetary Sciences, 601-647.
Fiwi Roots Jamaica., 2007. Black River Bay. Fiwi Roots: Jamaica.
http://www.jamaicablackriver.com/history.html.
Gable, F. J., 1997. Climate change impacts on Caribbean coastal areas and tourism.
Journal of Coastal Research, 24, 49-69.
Gedan, K.; Kirwan, M.; Wolanski, E.; Barbier, E., and Silliman, B., 2010. The present
and future role of coastal wetland vegetation in protecting shorelines: answering
recent challenges to the paradigm. Springer Science and Business.
Geomorphic Solutions., 2010. Bedrock shorelines erosion assessment.
Glynn, P., 1997. Bioerosion and coral-reef growth: a dynamic balance. In Life and death
of coral reefs, New York: Chapman and Hall. pp. 68-94.
Hamblin, W. K., and Christiansen, E. H., 2003. Earth's Dynamic Systems (tenth ed.).
Prentice Hall.
Hanson, H., and Lindh, G, 1993. Coastal erosion-an escalating environmental threat.
Ambio. 22(4), 188-195.
Hapke, C., and Reid, D., 2007. National assessment of shoreline change, part 4:
Historical coastal clif retreat along the California coast. Santa Cruz, California:
U.S. Geological Survey Open-file Report.
Hapke, C.; Reid, D., and Richmond, B., 2009. Rates and trends of coastal change in
California and the regional behavior of the beach and cliff system. Journal of
Coastal Research, 603-615.
Hennemann, G., and Matel, S., 1995. Jamaica: A refernce soil of the limestone region.
Kingston: Ministry of Agriculture.
Hesp, P. A., 2012. Surfzone-beach-dune interactions. Jubilee Conference Proceedings,
35-40.

99
Holl, R., 2003. Bioerosion: an essential, and often overlooked, aspect of reef ecology.
http://www.biology.iastate.edu/InternationalTrips/1Australia/Australia%20papers/
Bioerosion.htm.
Huggett, R. J., 2011. Fundamentals of Geomorphology (thrid ed.). New York: Routledge.
Hughes, M.; McDowell, P., and Marcus, A., 2006. Accuracy assessment of georectified
aerial photographs: Implications for measuring lateral channel movement in a
GIS. Geomorphology, 1-16.
Jamaica National Heritage Trust., 2011. Black River. Retrieved Oct 26, 2014, from
Jamaica National Heritage Trust: http://www.jnht.com/site_black_river.php.
James, N., 1983. Reefs. In: Scholle, P.A.; Bebout, D.G., and Moore, C.H., (eds.),
Carbonate Depositional Environments. Oklahoma: Tulsa, pp. 345-441.
Jin, J.; Wnag, Z.; Ran, S., and Ynu, C., 2010. Study on coastal resources evaluation
theories and methods. International Conference on Estuaries and Coasts, 138-
145.
Kohsiek, L. H.; Hulsbergen, C. H., and Terwindt, J. H., 1987. Beach erosion along the
west coast of Aruba, Netherlands Antilles. Journal of Coastal Research, 3(1), 37-
53.
Komar, P., 1976. Beach Processes and Sedimentation. Englewood Cliffs: Prentice-Hall,
Inc.
Leon, J., and Tavares Correa, C., 2004. Quantification of shoreline change in Salaverry,
Peru. Journal of Coastal Research, 39, 1013-1016.
Limber, W.; Patsch, K., and Griggs, G., 2008. Coastal sediment budgets and the littoral
cutoff diameter: a grain size threshold for quantifying active sediment inputs. 24,
122-133.
Linder, W., 2009. Digital Photogrammetry: A practical course. Berlin: Springer-Verlag.
Lugo, A., and Snedaker, S., 1974. The ecology of mangroves. Annual Review of
Ecology, Evolution, and Systematics. 5, 39-64.
Masselink, G., and Kroon, A., 2004. Morphodynamics of intertidal bars in wave-
dominated coastal settings-A review. Geomorphology. 73, 33-49.
McKenzie, A., 2012. Beach responses to hurricane impacts: a case study of Long Bay
Beach, Negril, Jamaica. Caribbean Journal of Earth Science. 43, 51-58.

100
Meterological Service., 2002. Climate. Meteorological service Jamaica
http://www.metservice.gov.jm/climate.asp?id=3.html.
Mickelson, D., and Colgan, P. M., 2003. The southern Laurentide ice sheet. Development
in Quaternary Science, 1-7.
Microdocs., 2012. 4 kinds of coral reef. Microdocs:
http://web.stanford.edu/group/microdocs/typesofreefs.html.
Mimura, N., and Nunn, P. D., 1998. Trends of beach erosion and shoreline protection in
rural Fiji. Journal of Coastal Research, 14(1), 37-46.
Ministry of Agriculture., 1989. Semi-detailed soil surbey of the Montpelier area,
Hanover, St. James, Westmoreland, Jamaica, Volume 1: Main Report. In Soil
Survey Report No. 4 Kingston, Jamaica: Ministry of Agriculture, Rural Physical
Planning Division, Jamaica Soil Survey Project. pp. 122.
Mitchell, S. F., 2004. Lithostratigraphy and palaeogeography of the White Limestone
Group. Cainozoic Research, 104(1), 5-29.
Mondon, E. A., and Warner, P. S., 2013. Evaluation of a proposed solution to beach
erosion in Negril. Journal of Earth Science, 43, 11-23.
Morton, R., 2003. An overview of coastal land loss: with emphasis on the southeastern
United States. United States Geological Survey.
http://pubs.usgs.gov/of/2003/of03-337/budget.html.
Morton, R. A., 2002. Factors controling storm impacts on coastal barriers and beaches: A
perliminary basis for near real-time forecasting. Journal of Coastal Research,
18(3), 486-501.
Moses, C., 2008. Field guide for geology and biology of Jamaican coral reefs.
SCUBAnauts International, 1-40.
Mousavi, M. E.; Irish, J. L.; Frey, A. E.; Olivera, F., and Edge, B. L., 2010. Global
warming and gurricanes: the potential impact of hurricane intesification and sea
level rise on coastal flooding. Springer Science Business Media.
Munoz-Perez, J.; Tejedor, L., and Medina, R., 1999. Equilibrium beach profile model for
reef-protected beaches. Journal of Coastal Research, 15(4), 950-957.
National Aeronautics and Space Administration (NASA), 2013. Hurricanes and tropical
storms. National Hurricane Center.
http://www.nasa.gov.mission_pages/hurricanes/main/index.html.

101
National Oceanic and Atmospheric Administration (NOAA)., 2015. National Hurricane
Center. National Weather Service. http://www.nhc.noaa.gov/.
National Oceanic and Atmospheric Administration., 2014. Coastal Protection. NOAA
Coral Reef Conservation Program.
http://coralreef.noaa.gov/aboutcorals/values/coastalprotection/#b.
Pearson Prentice Hall., 2004. Shoreline erosion. Pearson Prentice Hall:
/hazardcity/Files/modules/shoreline/erosion.html.
Perry, C.; Murphy, G.; Kench, P.; Edinger, E.; Smithers, S.; Steneck, R.; et al. 2014.
Changing dynamics of Caribbean reef carbonate budgets: Emergence of reef
bioeroders as critical controls on present and future reef growth potential.
Proceedings of the Royal Society B: Biological Sciences.
Peterson, T. C.; Stott, P., and Herring, S., 2012. Explaining extreme events of 2001 from
a climate perspective. Bulletion of American Meteorolical Society, 1041-1067.
Pilkey, O., and Wright, H., 1988. Seawalls versus beaches. Journal of Coastal Research,
4, 41-64.
Prothero, D., and Schwab, F., 2004. Sedimentary geology: An introduction to
sedimentary rocks and stratigraphy. New York: W. H. Freemand and Company.
Rath, A. B., 2014. Mangrove Importance. World Wildlife Fund Global
wwf.panda.org/about_our_earth/blue_planet/coasts/mangroves/mangrove_import
ance/.
ReefBase., 2015. ReefBase: A global information system for coral reefs.
http://www.reefbase.org
Richards, A., 2008. Development trends in Jamaica's coastal areas and the implications
for climate change. Planning Institute of Jamaica.
Robinson, E., and Hendry, M., 2012. Coastal change and evolution at Negril, Jamaica: A
geological perspective. Caribbean Journal of Earth Science, 43, 3-9.
Robinson, E., and Mitchell, S., 1999. Upper Cretaceous to Oligocene stratigraphy in
Jamaica. Fourth Annual Meeting of IGCP 393, pp. 1-49.
Robinson, E.; Khan, S.; Coutou, R., and Johnson, M., 2012. Shoreline changes and sea-
level rise at Long Bay, Negril, western Jamaica. Caribbean Journal of Earth
Science, 43, 35-49.
Robinson, E.; Rowe, D. C., and Khan, S. A., 2005. Will sea level rise drown Jamacia?
The Gleaner, 1-6.

102
Rogers, C., 1990. Responses of coral reefs and reef organims to sedimentation. Marine
Ecology Progress Series, 62, 185-202.
Sandals Foundation, 2010. Projects. http://www.sandalsfoundation.org/.
Satellite Imaging Corporation, 2004. GeoEye-1 satellite sensor.
http://www.satimagingcorp.com/satellite-sensors/geoeye-1/.
Schwartz, M.L., 1967., The Bruun theory of sea-level rise as a cause of shoreline erosion.
Journal of Geology. 75, 76-92.
Schmitz, D.; Blank, M.; Ammondt, S., and Patten, D., 2008. Using historic aerial
photography and paleohydrologic techniques to assess long-term ecological
response to two Montana dam removals. Journal of Environmental Management,
1-12.
Seneviratne, S. I.; Nicholls, N.; Easterling, D.; Goodness, C.; Kanae, S.; Kossin, J.; et al.
2012. Changes in climate extremes and their impacts on the natural physical
envionment. In Managing the Risks of Extreme Events and Disasters to Advance
Climate Change Adaption. Cambridge, UK and New York, NY, USA: Cambridge
University Press. pp. 109-230.
Sheppard, C.; Dixon, D. J.; Gourlay, M.; Sheppard, A., and Payet, R., 2005. Coral
mortality increases wave energy reaching shores protected by reef flats: Examples
from the Seychelles. Estuarine Coastal and Shelf Science, 64, 223-234.
Short, A. D., 1996. The role of wave height, period, slope, tide range and
embaymentisation in beach classifications: a review. Revista Chilena de Historia
Natural, 69, 589-604.
Short, A, and Wright, L., 1981. Beach systems of the Sydney region. Australian
Geographer. 15, 8-16.
Silberhorn, G., 1994. Technical report wetland flora.
http://ccrm.vims.edu/publications/wetlands_technical_reports/91-9-marsh-
hibiscus.pdf.
Small, C., and Nicholls, R., 2003. A global analysis of human settlement in coastal zones.
Journal of Coastal Research, 19(3), 584-599.
Sorensen, R.; Weisman, R., and Lennon, G., 1984. Control of erosion, inundation, and
salinity intrusion caused by sea level rise. In M. Barth, and J. Titus, Greenhouse
Effect and Sea Level Rise, New York, NY: Van Nostrand Reinhold. pp. 179-214.

103
Spiegel, J. E., 2013. Connecticut's trouble with seawalls.
http://ctmirror.org/2013/08/21/connecticuts-trouble-seawalls/.
St. Elizabeth Parish Development Committee., 2013. Black river.
http://www.stelizabethpdc.org/black-river.
Stewart, S., 2004. Tropical cyclone report: Hurricane Ivan. Miami: National Hurricane
Center.
Sverdrup, H. U.; Johnson, M. W., and Fleming, R. H., 1942. The water masses and
currents of the oceans. In The Oceans Their Physics, Chemistry, and General
Biology, New York: Prentice-Hall, Inc. pp. 642.
Tarbuck, E., and Lutgens, F., 2007. Earth: An introduction to physical geology. Prentice
Hall.
Thieler, R.; Smith, T.; Knisel, J., and Sampson, D., 2013. Massachusetts shoreline
change mapping and analysis project, 2013 update. USGS. 1-52.
Thampanya, U.; Vermaat, J.; Sinsakul, S., and Panapitukkul, N., 2006. Coastal erosoin
and mangrove progradation of southern Thailand. Estuarine, Coastal and Shelf
Science, 68, 75-85.
The Nature Conservancy., 2014. Coral reefs are critical for risk redution & adaptation.
http://www.nature.org/newsfeatures/pressreleases/coral-reefs-are-critical-for-risk-
reduction-adaptation-1.xml.
Thomas-Hope, E., and Jardine-Comrie, A., 2007. Valuation of environmental resources
for toursim in small island developing states-implications for planning in Jamaica.
International Development Planning Review, 29(1), 93-112.
Twu, S.-W., and Liao, W.-M., 1999. Effects of seawall slopes on scour depth. Journal of
Coastal Research, 15(4), 985-990.
U.S. Geological Survey., 2012. Box #2: Tropical Cyclones.
http://pubs.usgs.gov/of/2008/1206/html/figs/box2.html.
UNEP-WCMC., 2006. In the front line: shoreline protection and other ecosystem
services from mangroves and coral reefs. Cambridge, UK: Cambridge Printers.
University of South Florida., 2015. Beach Profiles.
http://fcit.usf.edu/florida/teacher/science/mod2/beach.profiles.html.
Valentine, K., 2014. Coral reefs protect shorelines by reducing wave energy by 97
percent, study finds. http://thinkprogress.org/climate/2014/05/16/3438478/coral-
reefs-protect-shorelines/.

104
Veira, M., 2014. Beyond the Negril beach spin. The Gleaner.
Wiggins-Grandison, M., and Atakan, K., 2004. Seismotectonics of Jamaica. Geophysical
Journal International, 160(2), 573-580.
Williams, S., 2013. Sea-level rise implications for coastal regions. Journal of Coastal
Research, 63,184-196.
Wong, P.; Losada, I.; Gattuso, J.; Hinkel, J.; Khattabi, A.; Mclnnes, K.; et al., 2014.
Coastal systems and low-lying areas. In Climate Change 2014: Impacts,
Adaptation, and Vulnerability. Part A: Global and Sectoral Aspects. Cambridge
United Kingdom and New York, NY, USA: Cambridge University Press. pp. 361-
409.
World Travel Guide, 2014. Jamaica weather, climate and geography. World Travel
Guide. http://www.worldtravelguide.net/jamaica/weather-climate-geography
Zhang, K.; Douglas, B. C., and Leatherman, S. P., 2004. Global warming and coastal
erosion. Climatic Change, 64, 41-58.

105
Data Source Data Type Data
Digital Globe IKONOS satellite imageQuickBird Multispectral
and Panchromatic Imagery
IKONOS satellite imageGeoEye Multispectral and
Panchromatic Imagery
GIS Data Layer Geology Formations
Landuse
Soils
World Resources Institute
(WRI)GIS Data Layer Coral Reef Locations
GeoCommunity GIS DEM Elevation DEM
ESRI Base Maps Various Global Base Maps
MONA GeoInformatics
(MGI)
X BaseMap Y BaseMap X April 03 Y April 03 Residual X Residual Y RMS RMSE
194256.6796 199594.0909 194262.7154 1995943.771 -0.0494941 -0.0534475 0.0728444
199334.2033 1994280.147 199337.6219 19942763.96 0.264151 0.28525 0.388772
20021.29116 1992697.925 200215.9767 1992692.64 -0.291733 -0.315036 0.429367
199401.0436 1989358.015 19905.48645 1989352.954 0.0770762 0.0832334 0.11344
X BaseMap Y BaseMap X Dec 07 Y Dec 07 Residual X Residual Y RMS RMSE
203383.834 1984144.268 203389.5596 1984133.772 0.105828 0.00 0.105828
191765.8776 1995994.398 191773.0966 1995990.546 0.0360891 0.00 0.0360891
200221.0567 1992701.144 200224.8413 1992696.491 0.558631 0.02125 0.559061
200263.2686 991578.1539 200266.3595 1991572.614 -0.700548 -0.0244948 0.701087
X BaseMap Y BaseMap X March 07 Y March 07 Residual X Residual Y RMS RMSE
202427.722 1987435.506 202425.6305 1987427.783 -0.46722 0.13516 0.485901
191371.0987 1995959.27 191386.997 1995952.166 -0.100097 0.0289885 0.10421
196726.0825 1995924.361 196731.5282 1995918.702 0.259058 -0.0750247 0.269703
203630.9994 1983062.295 203626.4284 1983052.67 0.307761 -0.0891303 0.320408
0.324946
pixels
0.451823
pixels
0.297353
pixels
APPENDICES
Appendix A: Database sources.
Appendix B: Georeferencing Coordinates and Corresponding RMS Error.

106
Appendix C: Black River Bay Map with Transects.

107

108

109

110

111
Appendix D: Photo Log.
Mangroves along Hunts Bay (transect 169).
Damaged infrastructure (transect 440).

112
Mangroves protection (transect 443).
Shoreline along
Parrottee Bay
(transect 461).

113
Dunes along Parrottee Point and Starve Gut Bay (transect 478).
Shoreline along
Parrottee Bay
(transect 464).

114
Dunes and coastal vegetation (transect 487).
Shoreline along Starve Gut Bay.

115
2003 to 2007 2007 to 2012 2003 to 2012
Erosion 50% 10% 46%
No Change 47% 66% 40%
Accretion 3% 25% 14%
2003 to 2007 2007 to 2012 2003 to 2012
Erosion 34% 13% 3%
No Change 46% 47% 35%
Accretion 20% 40% 35%
2003 to 2007 2007 to 2012 2003 to 2012
Erosion 69% 25% 15%
No Change 39% 42% 31%
Accretion 42% 33% 54%
Change in Vegetation line
Change in Waterline
Change in Beach Widths
Buildings along Black River Bay.
Appendix E: Percent of Shoreline Experiencing Change

116
Vegetation line
Zone Location Transect Numbers Length (m) 2003-2007 (m) 2007-2012 m 2003-2012 m2003-2007 Rates
(m/yr)
2007-2012 Rates
(m/yr)
Annual Rates
(m/yr)
1 Fonthill 1-87, 4350 -3.05 -0.77 -3.82 -0.72 -0.16 -0.42
2 Malcolm Bay 87-159 3600 -2.8 -0.56 -3.36 -0.66 -0.12 -0.37
3 Hunt Bay 159-192 1650 -0.43 0.15 -0.27 -0.10 0.03 -0.03
4 Hodgens Bay 192-232 2000 -2.32 0.37 -1.94 -0.55 0.08 -0.22
5 Black River Bay West 232-271 2000 -1.87 1.39 -0.48 -0.44 0.29 -0.05
6 Black River Bay East 271-359 440 -0.83 5.05 4.22 -0.20 1.06 0.47
7 Parrottee Pond 359-423 3200 -3.18 0.97 -2.21 -0.75 0.20 -0.25
8 Parrottee Bay 423-461 1900 -5.55 -0.46 -6.01 -1.31 -0.10 -0.67
9 Parrottee Point 461-515 2700 -12.23 2.07 -10.16 -2.88 0.44 -1.13
10 Starve Gut Bay 515-593 3900 -5.88 1.92 -3.96 -1.38 0.40 -0.44
-3.81 1.01 -2.80
-0.90 0.21
Waterline
Zone Location Transect Numbers Length (m) 2003-2007 (m) 2007-2012 (m) 2003-2012 (m)2003-2007 Rates
(m/yr)
2007-2012 Rates
(m/yr)
Annual Rates
(m/yr)
1 Fonthill 1-87, 4350 -1.4 2.62 1.22 -0.33 0.55 0.14
2 Malcolm Bay 87-159 3600 -1.29 1.36 0.08 -0.30 0.29 0.01
3 Hunt Bay 159-192 1650 -0.96 0.48 -0.48 -0.23 0.10 -0.05
5 Black River Bay West 232-271 2000 -0.59 2.07 1.48 -0.14 0.44 0.16
6 Black River Bay East 271-359 440 3.17 2.38 5.55 0.75 0.50 0.62
7 Parrottee Pond 359-423 3200 -2.19 -0.18 -2.37 -0.52 -0.04 -0.26
8 Parrottee Bay 423-461 1900 -4.2 -0.55 -4.75 -0.99 -0.12 -0.53
9 Parrottee Point 461-515 2700 -8.11 0.6 -7.51 -1.91 0.13 -0.83
10 Starve Gut Bay 515-593 3900 -0.49 1.76 1.26 -0.12 0.37 0.14
-1.75 1.14 -0.61
-0.41 0.24
Beach Width Change
Zone Location Transect Numbers Length (m) 2003-2007(m) 2007-2012 (m) 2003-2012 (m)2003-2007 Rates
(m/yr)
2007-2012 Rates
(m/yr)
Annual Rates
(m/yr)
1 Fonthill 1-87, 4350 2.33 4.02 6.35 0.55 0.85 -0.71
2 Malcolm Bay 87-159 3600 3.38 2.66 6.03 0.80 0.56 0.67
3 Hunt Bay 159-192 1650 0.08 0.3 0.37 0.02 0.06 0.04
4 Hodgens Bay 192-232 2000 0.39 0.49 0.88 0.09 0.10 0.1
5 Black River Bay West 232-271 2000 1.78 0.21 1.99 0.42 0.04 0.22
6 Black River Bay East 271-359 440 4.5 -2.28 2.22 1.06 -0.48 0.25
7 Parrottee Pond 359-423 3200 1.92 -1.08 0.84 0.45 -0.23 0.09
8 Parrottee Bay 423-461 1900 2.18 -0.98 1.2 0.51 -0.21 0.13
9 Parrottee Point 461-515 2700 4.12 -1.73 2.39 0.97 -0.36 0.27
10 Starve Gut Bay 515-593 3900 5.69 -0.66 5.04 1.34 -0.14 0.56
2.64 0.10 2.73
0.62 0.02
-0.31 m/yr
-0.068m/yr
0.30 m/yr
Average Change (m)
Annual rates (m/yr)
Annual Rate (m/yr)
Annual Rate (m/yr)
Average Change (m)
Average Change (m)
Appendix F: Changes and Rates by Zones.

117
Appendix G: Trends in Shoreline Change.

118

119

120

121

122
Appendix H: Hot and Cold Spots.
Observed shoreline change at hot spot 1 (transects 36 to 60).
Observed shoreline change at hot spot 2 (Transects 128 to149).
Change: -10 m Rate: -1.1 m/yr
Change: -12.7 m Rate:-1.4 m/yr

123
Observed shoreline change at hot spot 3 (transects 436 to 454).
Observed shoreline change at hot spot 4 (transects 466 to 474).
Change: -42 m Rate: -4.7 m/yr
Change: -15 m Rate: -1.7 m/yr

124
Observed shoreline change at cold spot 1 (transects 152 to 222).
Observed shoreline change at cold spot 2 (transects 319 to 338).
Change: +16 m Rate: +1.8 m/yr
Change: 0 m Rate: 0 m/yr

125
Appendix I: Predicted Shoreline Changes.
Predicted shoreline loss at hotspot 1 for the next 10 to 30 years.

126
Predicted shoreline loss at hotspot 4 (Parrottee Point) for the next 10 to 30 years.

127
Predicted shoreline accretion at cold spot 2 for the next 10 to 30 years.