![Lake-O-Ukers Ukulele Strum October 25, 2019punchdrunkband.com/songpdfs/LakeOOct25-2019.pdf · [G] La la la la la [B7] laaaa la la [Em] la la la la la la [G7] laaaaaa . La la la la](https://static.fdocuments.in/doc/165x107/5fd12b9fd69a5f331475ceba/lake-o-ukers-ukulele-strum-october-25-g-la-la-la-la-la-b7-laaaa-la-la-em.jpg)
Recent results from the standoff detection of … · existantes dépendent de méthodes...
30
Recent results from the standoff detection of radiological materials by passive FTIR radiometry 2004-2005 Summary Report for the Canadian Safeguards Support Program of the Canadian Nuclear Safety Commission E. Puckrin J.-M. Thériault DRDC Valcartier Defence R&D Canada – Valcartier Technical Note DRDC Valcartier TN 2005-080 March 2006
Transcript of Recent results from the standoff detection of … · existantes dépendent de méthodes...
Recent results from the standoff detection
of radiological materials by passive FTIR
radiometry2004-2005 Summary Report for the Canadian SafeguardsSupport Program of the Canadian Nuclear Safety Commission
E. PuckrinJ.-M. ThériaultDRDC Valcartier
Defence R&D Canada – ValcartierTechnical Note
DRDC Valcartier TN 2005-080March 2006


Recent results from the standoff detection of radiological materials by passive FTIR radiometry 2004-2005 Summary Report for the Canadian Safeguards Support Program of the Canadian Nuclear Safety Commission
E. PuckrinJ.-M. Thériault DRDC Valcartier
Defence R&D Canada – Valcartier Technical Note DRDC Valcartier TN 2005-080 March 2006

Author
Eldon Puckrin
Approved by
Jean-Marc Garneau
Section Head, Optronic Surveillance
Approved for release by
Jean-Marc Garneau
Section Head, Optronic Surveillance
© Her Majesty the Queen as represented by the Minister of National Defence, 2006
© Sa majesté la reine, représentée par le ministre de la Défense nationale, 2006

Abstract Over the past year we have continued our study of the passive standoff detection of radiological materials by Fourier-transform infrared (FTIR) radiometry. The earlier work had shown that a number of radiological materials have an infrared signature in the 8 – 14 μm thermal infrared region. As well, through a series of simulations using the MODTRAN4 atmospheric transmission model, it had been shown that these materials may potentially be detected passively at standoff distances of several kilometres. In this report we present results of our current work that focus on recent new measurements of spectral signatures, including the uranium oxides UO2 and UO3. Preliminary results from a measurement campaign held at Defence Research and Development Canada – Valcartier this year are also presented which address the passive detection of radiological materials in the field at standoff distances of 10 – 40 m. These results are analysed in view of determining the potential for measuring radiological products with a passive standoff FTIR technique.
Résumé Au cours de la dernière année nous avons poursuivi notre étude de télédétection passive de matériaux radiologiques par radiométrie infrarouge à transformation de Fourier (FTIR). Le travail précédent avait montré que plusieurs matériaux radiologiques ont une signature infrarouge dans la bande thermique 8 – 14 μm. De plus, une série de simulations utilisant le modèle de transmission atmosphérique MODTRAN4 a permis de montrer que ces matériaux pourraient être télédétectés passivement sur des distances de plusieurs kilomètres. Dans ce rapport nous présentons les résultats de nos travaux récents sur de nouvelles mesures de signatures spectrales, incluant les oxydes d'uranium UO2 et UO3. Les résultats préliminaires d'une campagne de mesures qui s’est déroulée cette année à Recherche et développement pour la défense Canada – Valcartier visant à tester, à l’extérieur, la télédétection passive de matériaux radiologiques sur des distances de 10 à 40 m sont aussi présentés. Ces résultats sont analysés en vue de déterminer le potentiel de la technique de télédétection passive FTIR pour la mesure des produits radiologiques.
DRDC Valcartier TN 2005-080 i

This page intentionally left blank.
ii DRDC Valcartier TN 2005-080

Executive summary Passive standoff Fourier-transform infrared (FTIR) radiometry is a well-known technique for the detection and identification of chemical agents. In addition to the potential threat that toxic chemical vapours may pose, there is also the possibility of a release of radiological material by accidental or terrorist activity. As a result it is important to have the necessary tools and techniques available for detecting and identifying radioactive products. At present, the main detection techniques depend on methods involving the measurement of a material’s decay products.
The objective of this note is to determine if the passive standoff FTIR radiometric technique can also be used to detect and identify radiological products in outdoor environments. To accomplish this goal it was first necessary to determine if radiological materials have a signature in the thermal infrared region of the spectrum where passive detection occurs. Through a series of diffuse reflectance measurements obtained in the laboratory it is shown that a number of radiological materials, including several oxides of uranium (UO2, UO3, U3O8), the oxides of cobalt (CoO and Co2O3), iridium oxide (IrO2), thorium oxide (ThO2), strontium oxide (SrO), iodine oxide (I2O5) lanthanum oxide (La2O3) and yellow cake, have detailed infrared signatures that may make these compounds susceptible to detection by passive radiometry.
The results of the laboratory reflectance measurements are followed by an investigation based on model simulations to determine the possibility of passively detecting and identifying radiological materials at the surface for a number of sensor altitudes. These simulations were performed using the MODTRAN4 radiative transfer model, which is able to characterize accurately the thermal radiance at any altitude that emanates from the atmosphere and from backgrounds having specific spectral reflectances. The simulated results indicate that there is potential for measuring radiological materials passively for several sensor altitudes. Finally, results from two passive radiometric measurements of SrO obtained in the field with the Compact Atmospheric Sounding Interferometer are presented for standoff distances of up to 40 m. These measurements support the conclusions determined from the simulation studies.
The development of a non-nuclear detection capability based on passive standoff FTIR radiometry may be a potentially useful addition to the arsenal of nuclear measurement techniques that already exist for the detection and identification of nuclear threats. Such a capability may also have an important application for the mining industry.
Puckrin, E. and Thériault, J.-M. 2006. Recent results from the standoff detection of radiological materials by passive FTIR radiometry, DRDC Valcartier TN 2005-080. Defence R&D Canada – Valcartier
DRDC Valcartier TN 2005-080 iii

Sommaire
La télédétection passive par interférométrie infrarouge à transformée de Fourier (FTIR) est une technique acceptée pour la détection et l'identification d’agents chimiques. En plus des menaces potentielles associées aux produits chimiques, il y a également la possibilité de dispersion de matériel radiologique provenant d`activités accidentelles ou terroristes. Par conséquent, il est important d'avoir à notre disposition les outils et techniques nécessaires pour détecter et identifier les produits radiologiques. Les principales techniques de détection existantes dépendent de méthodes s’appuyant sur la mesure de la décroissance de la radioactivité des matériaux.
L'objectif de ce rapport est de déterminer si la technique de télédétection passive FTIR peut être employée pour détecter et identifier les produits radiologiques dans les environnements extérieurs. À cette fin, il était nécessaire de déterminer si les matériaux radiologiques avaient une signature dans l’infrarouge thermique où la détection passive se produit. À l’aide d’une série de mesures de réflectivité diffuse obtenues en laboratoire, on montre qu'un certain nombre de matériaux radiologiques, c.-à-d. oxydes d'uranium (UO2, UO3, U3O8), oxydes de cobalt (CoO et Co2O3), l'oxyde d'iridium (IrO2), l'oxyde de thorium (ThO2), l'oxyde de strontium (SrO), l'oxyde de lanthane de l'oxyde d'iode (I2O5) (La2O3) et le ”yellow cake”, ont des signatures infrarouges détaillées qui peuvent rendre ces composés détectables par radiométrie passive.
Les résultats des mesures de réflectance diffuse en laboratoire sont suivis d’une étude de simulations avec des modèles pour déterminer la possibilité de télédétection passive et d'identification des matériaux radiologiques sur la surface terrestre pour un certain nombre d'altitudes. Ces simulations ont été effectuées en utilisant le modèle de transfert radiatif MODTRAN4, qui peut caractériser exactement le rayonnement thermique qui émane à n'importe quelle altitude de l'atmosphère et des milieux ayant des réflectivités spectrales déterminées. Les résultats simulés indiquent un certain potentiel à mesurer passivement les matériaux radiologiques pour des altitudes allant jusqu'à 100 kilomètres. Finalement, les résultats de deux mesures radiométriques passives de SrO obtenues à l’aide du spectromètre CATSI (Compact ATmospheric Sounding Interferometer) sont présentés pour des distances allant jusqu'à 40 m. Ces mesures appuient les conclusions de l’étude de simulation.
Le développement de techniques non nucléaires de détection basées sur la radiométrie passive FTIR peut être une addition potentiellement utile à l'arsenal des techniques de mesure qui existent déjà pour la détection et l'identification des menaces nucléaires. De telles possibilités peuvent également avoir une application importante sur l'industrie minière.
Puckrin, E. and Thériault, J.-M. 2006. Recent results from the standoff detection of radiological materials by passive FTIR radiometry, DRDC Valcartier TN 2005-080. Defence R&D Canada – Valcartier
iv DRDC Valcartier TN 2005-080
Table of contents
Abstract / Résumé ....................................................................................................................... i
Executive summary ................................................................................................................... iii
Sommaire................................................................................................................................... iv
Table of contents ........................................................................................................................ v
List of figures ............................................................................................................................ vi
1. Introduction ................................................................................................................... 1
2. Detection principles and phenomenology ..................................................................... 2
3. Results and discussion................................................................................................... 4 3.1 Laboratory measurements of diffuse reflectance.............................................. 4 3.2 Simulations of the standoff detection of radiological products ........................ 6 3.3 Preliminary standoff measurements of radiological products ........................ 10
4. Conclusions ................................................................................................................. 12
5. References ................................................................................................................... 13
Distribution List........................................................................................................................ 15
DRDC Valcartier TN 2005-080 v

List of figures
Figure 1: Diagram and parameters used to evaluate the radiance of a clean surface and a surface covered by a powdered contaminant. ..................................................................... 3
Figure 2: Photographs of the (A) Digilab FTS 3000 spectrometer and (B) the DRIFTS accessory installed inside the sample compartment of the FTS 3000 for measuring the reflectance of radiological materials. .................................................................................. 5
Figure 3: Schematic diagram of the optical arrangement used to measure reflectance spectra. 5
Figure 4: (A) Reflectance spectra measured by the DRIFTS technique for a number of radiological products over the 500 – 4000 cm-1 region. The measurements were obtained at a resolution of 4 cm-1. (B) An expanded view of the reflectances over the 700 – 1400 cm-1 (7 – 14 μm) thermal infrared region............................................................................ 6
Figure 5: Transmission spectra for three different optical depths of atmosphere, as simulated with the MODTRAN4 model.............................................................................................. 7
Figure 6: (A) Direct total nadir radiance simulated for two altitudes with a surface consisting of UO2. (B) Differential radiance simulation showing the nadir radiance for a concrete surface subtracted from the nadir radiance for a surface of UO2. The UO2 absorption features are clearly visible in the differential spectra. ......................................................... 8
Figure 7: (A) Direct total nadir radiance simulated for two altitudes with a surface consisting of UO3. (B) Differential radiance simulation showing the nadir radiance for a concrete surface subtracted from the nadir radiance for a surface of UO3. The UO3 absorption features are clearly visible in the differential spectra. ......................................................... 9
Figure 8: Simulated effect of sky temperature on the passive detection of UO3. The sky temperature was altered by changing the base altitude of an optically thick cloud from 5 km to 250 m. (A) Direct total nadir radiance simulated for a surface consisting of UO3 under varying cloud conditions. (B) Differential radiance simulated by subtracting the radiance of a surface of UO3 from the radiance of a blackbody at a surface temperature of 288.2 K. The UO3 absorption features diminish with increased sky temperature (or equivalently, with decreased temperature contrast between the surface and the sky). ..... 10
Figure 9: (A) Photograph showing the powdered SrO sample sprinkled on the stone-tar rooftop. (B) Differential radiance spectra measured at a standoff distance of 10 m for a rooftop contaminated with SrO powder. The simulated differential spectrum9 of SrO is also presented for comparison. (C) Differential radiance spectra measured at a standoff distance of 40 m. ............................................................................................................... 11
vi DRDC Valcartier TN 2005-080

1. Introduction Passive standoff detection by Fourier-transform infrared (FTIR) radiometry has become a relatively mature and reliable method for the identification and measurement of toxic chemical vapours emitted from stacks. 1-4 Recently, it has also been shown to be a potentially valuable tool for measuring biological warfare agents5,6 and surfaces contaminated with CW agents.7 Therefore, passive standoff detection by FTIR radiometric techniques plays one of the most important roles in detecting and identifying chemical and biological (CB) hazards on the battlefield and as a counter-terrorism measure. In addition to these hazards, there is the possibility of a release of nuclear material at a nuclear power plant, during the transportation of radioactive materials, or by terrorist activity, which could result in widespread radioactive contamination over populated regions.
At present, the main detection techniques for radiological compounds depend on the measurement of the particle emission emanating from the radioactively decaying material. This normally constitutes a measurement of the product’s gamma rays or other emission particles including neutrons, and alpha and beta particles. The traditional means of detection depends strongly on the strength of the emitting source. However, alpha and beta particle emissions are strongly attenuated by modest amounts of shielding, even by a sheet of paper in the case of alpha particles, which requires that the instrument be relatively close to the sources in order to detect their presence.
Previously, we have shown that some materials such as U3O8, ThO2, CsI, SrO, I2O5 and La2O3 have absorption features in the thermal infrared region, and that these materials may potentially be detected by passive FTIR radiometry.8,9 In this report, we extend this analysis to include other important materials and present some preliminary passive standoff measurements. This study concerns the measurements of diffuse reflectance from a number of radiological or related products, including the oxides of uranium (UO2, UO3), the oxides of cobalt (CoO and Co2O3) and iridium oxide (IrO2). Of these materials, only the uranium oxides were radioactive. However, it is expected that similar absorption spectra will be measured for the non-radioactive isotopes. The small differences in mass that exist among the isotopes will result only in a small shift in the spectral signature. A study based on simulations performed with the MODTRAN4 transmission code10 has also been undertaken in order to determine if these materials can be detected and identified for a number of different sensor altitudes.
The development of a passive detection capability based on FTIR radiometry may provide an effective measurement tool for detecting and identifying many NBC threats. There may also be an important application for this kind of technology in identifying uranium compounds for the mining industry.
DRDC Valcartier TN 2005-080 1

2. Detection principles and phenomenology A passive long-wave infrared standoff sensor functions by exploiting the temperature difference (ΔT) that exists between the target scene and the background scene. If the target is warmer than the background, then the spectrum of the target chemical will be measured as an emission feature in the spectrum recorded by the sensor. Conversely, if the target is colder than the background, then the target chemical spectrum will be measured as an absorption feature. When a target consisting of a solid powder is present on a surface, ΔT is zero since the background (surface) and the powder are in contact. However, if the radiation from an external hot or cold source is reflected from the surface, then it is possible to observe the spectrum of the powder. In outdoor environments, the radiation from the cold sky provides a high surface-to-sky temperature difference that yields favourable detection possibilities. The radiative transfer associated with the detection of powdered targets is outlined below.
The radiative transfer intervening at a surface can be understood from a simple physical argument. A diagram is presented in Fig. 1 that defines the parameters used to evaluate the radiance emanating from a clean surface and one contaminated with a powder; both are exposed to an outdoor environment. For a clean surface having a reflectance Ro, the spectral radiance measured at the sensor contains two components, i.e. the emitted radiance from the surface, B(1- Ro), and the cold sky radiance reflected by the surface, Ldown Ro. The parameter, Ldown, represents the downwelling radiance from the sky and B is the Planck radiance evaluated at the temperature (T) of the surface that is given by
⎟⎟⎟
⎠
⎞
⎜⎜⎜
⎝
⎛
−
×=
⎟⎠⎞
⎜⎝⎛
−
1
10191.1439.1
312
TeB ν
ν, (1)
where ν is the wavenumber in cm-1, and B is in W/cm2 sr cm-1. Adding these two radiance components, B(1- Ro) and Ldown Ro, yields an expression for the radiance of the uncontaminated surface that is given by
( )downoclean LBRBL −−= . (2)
Similarly, for a contaminated substrate consisting of a powder with a reflectance Rcont, as shown in Fig. 1, the spectral radiance measured by the sensor is given by,
( )downcontcont LBRBL −−= . (3)
A quantity of interest to study the perturbation effects of a contaminant on a surface is the differential spectral radiance (ΔL), which is the radiance difference (Lcont -Lclean) obtained by subtracting Eq. (2) from Eq. (3),
( )downcontocleancont LBRRLLL −−=Δ≡− )( . (4)
2 DRDC Valcartier TN 2005-080

Inspection of Eq. (4) reveals some simple facts concerning the sensitivity for detecting surface contaminants by passive spectral radiometry. First of all, the radiance difference is proportional to the reflectance contrast (Ro – Rcont), indicating that a highly reflecting surface results in an increased sensitivity for detection. Secondly, the radiance difference is proportional to the radiative contrast between the Planck surface radiance and the downwelling sky radiance, (B – Ldown). Since the downwelling radiance increases with cloud cover, which in turn results in a decrease in the radiative contrast, the best detection possibilities are obtained for clear sky conditions where Ldown is a minimum.
B
B
RoRcont εcont
Ldown
Surface withPowder
Clean Surface
SensorSky
Figure 1: Diagram and parameters used to evaluate the radiance of a clean surface and a
surface covered by a powdered contaminant.
DRDC Valcartier TN 2005-080 3

3. Results and discussion
3.1 Laboratory measurements of diffuse reflectance
Diffuse reflectance infrared Fourier-transform spectroscopy (DRIFTS) is a simple method for acquiring reflectance spectra from powdered samples.11 It was used in this work to measure the reflectance from powdered samples of UO2, UO3, U3O8, CoO, Co2O3, and IrO2. The uranium samples were supplied by Cameco Corporation, and all of the other products were purchased from Sigma-Aldrich with purities exceeding 99 % in all cases. The spectra were recorded with a Digilab Fourier-transform spectrometer (FTS 3000) at a resolution of 4 cm-1 using a Peltier-cooled DTGS detector and a Ge-coated KBr beamsplitter. Several spectra were first measured at a resolution of 1 cm-1; however, no additional spectral information was evident at the higher setting. Photographs of the Digilab FTS 3000 and the DRIFTS accessory installed within the sample compartment of the system are shown in Figs. 2A and 2B, respectively.
The DRIFTS accessory (Spectra-tech, Inc.) had a biconical optical arrangement, as illustrated in the schematic diagram in Fig. 3. Infrared radiation from a ceramic source was directed from the interferometer towards the parabolic mirror, M3, and focused onto the sample cup that was filled with powder. The reflected diffuse radiation from the powdered sample was collected by another parabolic mirror, M5, and redirected towards the DTGS detector of the FTS system. The spot size illuminated by the infrared beam at the sample surface was less than 2-mm in diameter. A small piece of 600-grit silicon carbide paper with adhesive backing was coated with a 0.25-μm layer of pure gold by vapour deposition, which constituted the reference sample. Its absolute reflectance has been measured to be close to unity throughout the thermal infrared region.11
The procedure for performing the reflectance measurements was as follows. The gold reference sample was first placed in the DRIFTS receptacle. The system was purged for 15 min to reduce the amount of residual water vapour and carbon dioxide that remained in the sample compartment of the spectrometer, and then a spectrum of the intensity of the radiation reflected from the gold surface was measured. The gold sample was then removed, and the receptacle was filled with one of the powdered samples. After another 15 min purge, a spectrum of the radiation reflected from the powder was measured. The gold sample was replaced for a second time and a measurement was obtained to insure that the DRIFTS assembly gave reproducible results. The reflectance spectrum of the powder was determined from the ratio of the reflected intensities from the powder and the gold.
Examples of the reflectance spectra measured by the DRIFTS technique for UO2, UO3, U3O8, CoO, Co2O3 and IrO2 are presented in Fig. 4. The materials exhibit a rich structure throughout the 500 – 4000 cm-1 (2.5 – 20 μm) region, and in particular within the thermal infrared region of 700 – 1400 cm-1 (7 – 14 μm). In general, the features are much broader than those associated with gases due to the thermal vibrations in the lattice, which has the effect of smearing out the band shape.12
4 DRDC Valcartier TN 2005-080

(A)
(B)
Au reference Powder sample cup
Figure 2: Photographs of the (A) Digilab FTS 3000 spectrometer and (B) the DRIFTS accessory installed inside the sample compartment of the FTS 3000 for measuring the
reflectance of radiological materials.
Figure 3: Schematic diagram of the optical arrangement used to measure reflectance
spectra.
DRDC Valcartier TN 2005-080 5

Wavenumber (cm-1)1000 2000 3000 4000
Ref
lect
ance
0.00
0.05
0.10
0.15
0.20
0.25
Wavenumber (cm-1)800 1000 1200 1400
0.00
0.05
0.10
0.15
0.20
IrO2
U3O8
Co2O3 CoO
UO2
UO3
(A) (B)
Figure 4: (A) Reflectance spectra measured by the DRIFTS technique for a number of radiological products over the 500 – 4000 cm-1 region. The measurements were obtained at a resolution of 4 cm-1. (B) An expanded view of the reflectances over the 700 – 1400 cm-1 (7 –
14 μm) thermal infrared region.
3.2 Simulations of the standoff detection of radiological products
In order to be identified by a passive standoff detection technique, it is necessary that the energy reflected and emitted by the materials at the surface be transmitted through the atmosphere to the sensor located above at some altitude. Fortunately, the atmosphere is relatively transparent in the 700 – 1300 cm-1 (8 – 14 μm) region, as shown in Fig. 5 by the transmission spectra of the 1976 U.S. standard atmosphere13 simulated with the MODTRAN4 model. For a path of 1 m, there is an insignificant effect of the atmosphere on the radiation emitted or reflected by the surface. This leads to the possibility of having a hand-held passive standoff device that may be capable of mapping dispersal patterns of nuclear products on the ground. For longer paths of 0.1 – 1 km, the atmosphere becomes significantly more opaque, particularly in the spectral range below 700 cm-1 and above 1300 cm-1. However, it is apparent that the atmosphere is sufficiently transmissive in the 750 – 1250 cm-1 region, and this may make it possible to have an airborne passive sensor that is capable of detecting and identifying radiological materials at the surface.
To summarize, the two main criteria for determining if a passive standoff FTS system has the potential for successfully measuring radiological materials have been achieved; the materials themselves have infrared signatures in the thermal infrared region, and the atmosphere is sufficiently transparent to permit their detection.
6 DRDC Valcartier TN 2005-080

Wavenumber (cm-1)500 600 700 800 900 1000 1100 1200 1300 1400 1500
Tran
smis
sion
0.0
0.2
0.4
0.6
0.8
1.0
1.2 1 m transmission 100 m transmision 1 km transmission
Useful Range of Detection
Figure 5: Transmission spectra for three different optical depths of atmosphere, as simulated
with the MODTRAN4 model.
The MODTRAN4 transmission model was used to simulate the nadir radiance at altitudes of 1 m and 1 km above the earth’s surface for several radiological materials. The first scenario at 1 m represents the conditions for a hand-held sensor looking down, and the second scenario at 1 km represents the situation for a down-looking sensor on an airborne platform. The 1976 U.S. standard atmosphere was used in the model, along with the reflectance spectra for the various materials that were measured in the laboratory. It is assumed that the field of view is completely filled with the radiological material.
The simulated nadir radiance at altitudes of 1 m and 1 km for a surface reflectance based on the laboratory measurement of UO2 is shown in Fig. 6. The direct radiances are represented in Fig. 6A along with the Planck blackbody radiation for a surface at 288.2 K, which represents the non-reflecting surface. For each of the two altitudes, there is a small but discernible discrepancy in the 700 – 1300 cm-1 region of the spectrum between the simulated nadir radiance and the blackbody emission that cannot be explained by atmospheric effects. This difference is attributed primarily to the surface reflectance of UO2. The absorption features that are present in the radiance spectrum of Fig. 6A at less than 700 cm-1 are associated with carbon dioxide and water vapour, and water vapour is primarily responsible for the absorption features at greater than 1300 cm-1. These features are only observable in the spectra simulated for sensor altitudes greater than several metres. Figure 6B represents the differential radiance simulated with the MODTRAN4 model for the two sensor altitudes of 1 m and 1 km. In this figure the differential radiance represents the difference in radiance between two scenes consisting of UO2 and concrete. The direct radiance simulated for a surface covered with UO2 was subtracted from the direct radiance emanating from the
DRDC Valcartier TN 2005-080 7
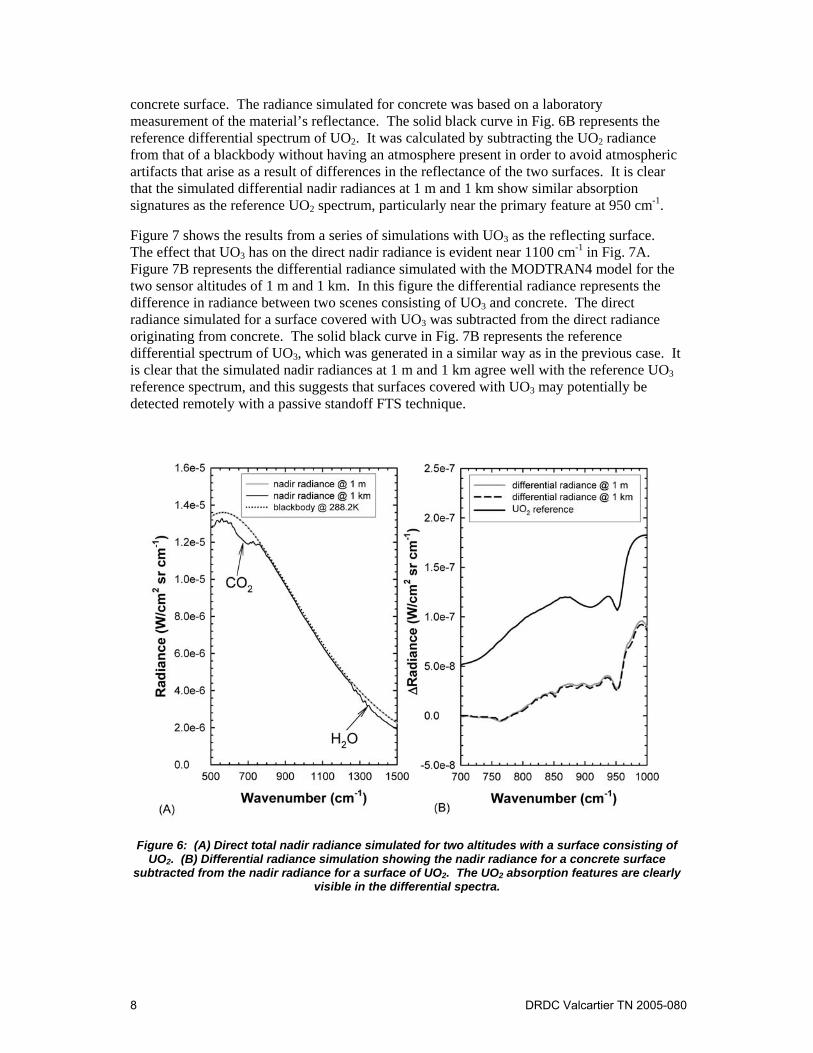
concrete surface. The radiance simulated for concrete was based on a laboratory measurement of the material’s reflectance. The solid black curve in Fig. 6B represents the reference differential spectrum of UO2. It was calculated by subtracting the UO2 radiance from that of a blackbody without having an atmosphere present in order to avoid atmospheric artifacts that arise as a result of differences in the reflectance of the two surfaces. It is clear that the simulated differential nadir radiances at 1 m and 1 km show similar absorption signatures as the reference UO2 spectrum, particularly near the primary feature at 950 cm-1.
Figure 7 shows the results from a series of simulations with UO3 as the reflecting surface. The effect that UO3 has on the direct nadir radiance is evident near 1100 cm-1 in Fig. 7A. Figure 7B represents the differential radiance simulated with the MODTRAN4 model for the two sensor altitudes of 1 m and 1 km. In this figure the differential radiance represents the difference in radiance between two scenes consisting of UO3 and concrete. The direct radiance simulated for a surface covered with UO3 was subtracted from the direct radiance originating from concrete. The solid black curve in Fig. 7B represents the reference differential spectrum of UO3, which was generated in a similar way as in the previous case. It is clear that the simulated nadir radiances at 1 m and 1 km agree well with the reference UO3 reference spectrum, and this suggests that surfaces covered with UO3 may potentially be detected remotely with a passive standoff FTS technique.
Figure 6: (A) Direct total nadir radiance simulated for two altitudes with a surface consisting of
UO2. (B) Differential radiance simulation showing the nadir radiance for a concrete surface subtracted from the nadir radiance for a surface of UO2. The UO2 absorption features are clearly
visible in the differential spectra.
8 DRDC Valcartier TN 2005-080

Figure 7: (A) Direct total nadir radiance simulated for two altitudes with a surface consisting of UO3. (B) Differential radiance simulation showing the nadir radiance for a concrete surface
subtracted from the nadir radiance for a surface of UO3. The UO3 absorption features are clearly visible in the differential spectra.
As shown by the second set of brackets in Eq. (4), the intensity of the differential radiance depends on the temperature contrast between the sky and the target on the ground. In order to further examine the effect of sky temperature on the radiance, simulations of the radiance for UO3 were performed for a number of atmospheric scenarios; clear sky, cloud base at 5 km, cloud base at 1 km and cloud base at 250 m. The optically thick cloud characterizes a blackbody radiating at the temperature of the atmosphere at which it is located; i.e., clouds located at lower altitudes in the atmosphere are warmer, thereby reducing the temperature contrast with the surface. The simulations of the direct and differential radiance are summarized in Figs. 8A and 8B, respectively. For the case of a cloudless sky where the temperature contrast between the sky and ground is about 80 K in the 700 – 1300 cm-1 region, the differential radiance has a maximum value of about 7×10⁻⁷ W/(cm2 sr cm-1). For an optically thick cloud at an altitude of 5 km the temperature contrast is reduced to 33 K and the differential radiance decreases by more than a factor of two. In the extreme situation where the cloud is near the ground at an altitude of 250 m, the contrast in temperature is only about
DRDC Valcartier TN 2005-080 9

2K and the maximum value of the differential radiance is about 3×10⁻⁸ W/(cm2 sr cm-1). Under these conditions some passive sensors may not have sufficient sensitivity to detect the UO3 at the surface.
Figure 8: Simulated effect of sky temperature on the passive detection of UO3. The sky temperature was altered by changing the base altitude of an optically thick cloud from 5 km
to 250 m. (A) Direct total nadir radiance simulated for a surface consisting of UO3 under varying cloud conditions. (B) Differential radiance simulated by subtracting the radiance of a surface of UO3 from the radiance of a blackbody at a surface temperature of 288.2 K. The UO3 absorption features diminish with increased sky temperature (or equivalently, with decreased
temperature contrast between the surface and the sky).
3.3 Preliminary standoff measurements of radiological products In order to further demonstrate the possibility of detecting radiological products passively, a field measurement was performed on 14 October 2003 involving a 5 g powdered sample of SrO sprinkled on a stone-tar rooftop at DRDC Valcartier, as shown in Fig. 9A. The Compact ATmospheric Sounding Interferometer (CATSI)14 was set up at a distance of 10 m from the target, and the differential radiance spectrum was measured at a resolution of 8 cm-1 under partly cloudy skies and at a temperature of 20°C. The spectrum, shown in Fig. 9B, consists of
10 DRDC Valcartier TN 2005-080

the measured difference between the radiance from the SrO powder on the stone-tar rooftop and from the clean portion of the rooftop adjacent to the powder. Each spectrum consisted of 40 scans, which required a time of 10 s for the measurement. The spectrum is consistent with the differential radiance spectrum simulated for SrO in a previous paper.9 The arrows denote similarities in the SrO features of the measured and reference spectra. The differential radiance spectrum measured in the absence of the SrO powder is also shown to demonstrate the stability of the measurement baseline. A second measurement was performed June 2004 for a longer standoff distance of 40 m. The resulting differential radiance is presented in Fig. 9C, and there are obvious similarities with the simulated SrO differential radiance.
Wavenumber (cm-1)700 750 800 850 900 950 1000
Diff
eren
tial R
adia
nce
(W/c
m2 s
r cm
-1)
-4.0e-8
-2.0e-8
0.0
2.0e-8
4.0e-8
Measured differential radiancewithout SrO Simulated SrOAveraged differential radiancewith SrO @ 10 m
Wavenumber (cm-1)
700 750 800 850 900 950 1000
Diff
eren
tial R
adia
nce
(W/c
m2 s
r cm
-1)
-4.0e-8
-2.0e-8
0.0
2.0e-8
4.0e-8
Measured differential radiancewithout SrO Simulated SrOAveraged differential radiancewith SrO @ 40 m
(B) (C)
Figure 9: (A) Photograph showing the powdered SrO sample sprinkled on the stone-tar rooftop. (B) Differential radiance spectra measured at a standoff distance of 10 m for a rooftop
contaminated with SrO powder. The simulated differential spectrum9 of SrO is also presented for comparison. (C) Differential radiance spectra measured at a standoff distance of 40 m.
DRDC Valcartier TN 2005-080 11

4. Conclusions Over the past year DRDC Valcartier has continued to investigate the feasibility of using passive standoff FTIR radiometry for the detection of radiological materials. Preliminary work has shown that a large number of radiological materials have an infrared signature in the 8 – 14 μm thermal infrared region, including several oxides of uranium and cobalt. As well, through a series of simulations using the MODTRAN4 atmospheric transmission model, it has been shown that these materials may potentially be detected at standoff distances of several kilometres. Preliminary results from a field trial at DRDC Valcartier this year indicate that the passive detection of radiological materials is possible for standoff distances of 10 – 40 m. These results suggest that the passive standoff FTIR technique may play an important role in the detection of nuclear products.
12 DRDC Valcartier TN 2005-080

5. References
1. J.-M. Thériault, E. Puckrin, F. Bouffard and B. Déry, Passive remote monitoring of chemical
vapours by differential FTIR radiometry: results at a range of 1.5 km, Appl. Opt., 43, 1425-1434 (2004).
2. C.T. Chaffin, T.L. Marshall, N.C. Chaffin, Passive FT-IR remote sensing of smokestack emissions,
Field Analytical Chemistry and Technology, 3, 111-115 (1999). 3. D.F. Flanigan, Hazardous cloud imaging: a new way of using passive infrared, Appl. Opt. 36,
7027-7036 (1997). 4. G. Laufer and A. Ben-David, Optimized differential absorption radiometer for remote sensing of
chemical effluents, Appl. Opt. 41, 2263-2273 (2002). 5. J.-M. Thériault and E. Puckrin, Passive Standoff Detection of BG Aerosol by FTIR Radiometry,
Appl. Opt., 42, 6696-6705 (2003). 6. A. Ben-David, Remote detection of biological aerosols at a distance of 3 km with a passive Fourier
transform infrared (FTIR) sensor, Opt. Express, 11, 418-429 (2003). 7. J.-M. Thériault, E. Puckrin, J. Hancock, P. Lecavalier, Carmela Jackson Lepage and J.O. Jensen,
Passive standoff detection of chemical warfare agents on surfaces, Appl. Opt., 43, 5870-5885 (2004).
8. E. Puckrin and J.-M. Thériault, Passive standoff detection of radiological products by Fourier-
transform infrared radiometry, Opt. Lett., 29, 1375-1377 (2004). 9. E. Puckrin, J.-M. Thériault and D. Dubé, Passive Standoff Detection of Radiological Products in
the Thermal Infrared Region, Proceedings of the SPIE Conference on Chemical and Biological Standoff Detection, Providence, Vol. 5268, 210-219 (Oct. 2003).
10. G.P. Anderson, A. Berk, L.S. Bernstein, J.H. Chetwynd, P.K. Acharya, H. Dothe, M.W. Matthew,
S.M. Adler-Golden, R.J. Ratkowski, G.W. Felde, J.A. Gardner, M.L. Hoke, S.C. Richtsmeier, B. Pukall, J. Mello, and L.S. Jeong, MODTRAN4: Radiative transfer modeling for remote sensing and atmospheric correction, Proc., EUROPTO Remote Sensing Congress, Florence, Italy (1999).
11. D.B. Nash, Mid-infrared reflectance spectra (2.3 – 22 μm) of sulfur, gold, KBr, MgO, and halon,
Appl. Opt., 25, 2427-2433 (1986). 12. B. Hapke, Theory of reflectance and emittance spectroscopy, p. 42, Cambridge University Press,
Cambridge (1993). 13. G.P. Anderson, S.A. Clough, F.X. Kneizys, J.H. Chetwynd and E.P. Shettle, AFGL atmospheric
constituent profiles (0-120 km), AFGL-TR-86-0110 (Air Force Geophysics Laboratory, Hanscom AFB, MA, 1986).
14. J.-M. Thériault, Modeling the responsivity and self-emission of a double-beam Fourier-transform
infrared interferometer, Appl. Opt., 38, 505-515 (1999).
DRDC Valcartier TN 2005-080 13

This page intentionally left blank.
14 DRDC Valcartier TN 2005-080

Distribution list
INTERNAL
DRDC Valcartier TN 2005-080
1 - Director General 1 - Deputy Director General 3 - Document Library 1 - J.-M. Thériault (author) 1 - E. Puckrin (author)
DRDC Valcartier TN 2005-080 15

EXTERNAL DISTRIBUTION
DRDC Valcartier TN 2005-080
1 - DRDKIM (PDF file)
16 DRDC Valcartier TN 2005-080
dcd03e rev.(10-1999)
UNCLASSIFIED SECURITY CLASSIFICATION OF FORM
(Highest Classification of Title, Abstract, Keywords)
DOCUMENT CONTROL DATA
1. ORIGINATOR (name and address) Defence R&D Canada Valcartier 2459 Pie-XI Blvd N Val-Belair, QC G3J1X5
2. SECURITY CLASSIFICATION (Including special warning terms if applicable) unclassified
3. TITLE (Its classification should be indicated by the appropriate abbreviation (S, C, R or U) Recent results from the standoff detection of radiological materials by passive FTIR radiometry 2004-2005 Summary Report for the Canadian Safeguards Support Program of the Canadian Nuclear Safety Commission (U)
4. AUTHORS (Last name, first name, middle initial. If military, show rank, e.g. Doe, Maj. John E.) Puckrin, Eldon; Theriault, Jean-Marc
5. DATE OF PUBLICATION (month and year) March 2006
6a. NO. OF PAGES 15
6b .NO. OF REFERENCES 14
7. DESCRIPTIVE NOTES (the category of the document, e.g. technical report, technical note or memorandum. Give the inclusive dates when a specific reporting period is covered.)
technical note
8. SPONSORING ACTIVITY (name and address)
9a. PROJECT OR GRANT NO. (Please specify whether project or grant) 0470-1804-71223N
9b. CONTRACT NO.
10a. ORIGINATOR’S DOCUMENT NUMBER TN 2005-080
10b. OTHER DOCUMENT NOS
N/A
11. DOCUMENT AVAILABILITY (any limitations on further dissemination of the document, other than those imposed by security classification)
Unlimited distribution Restricted to contractors in approved countries (specify) Restricted to Canadian contractors (with need-to-know) Restricted to Government (with need-to-know) Restricted to Defense departments Others
12. DOCUMENT ANNOUNCEMENT (any limitation to the bibliographic announcement of this document. This will normally correspond to the Document Availability (11). However, where further distribution (beyond the audience specified in 11) is possible, a wider announcement audience may be selected.)
UNCLASSIFIED
SECURITY CLASSIFICATION OF FORM (Highest Classification of Title, Abstract, Keywords)
dcd03e rev.(10-1999)
UNCLASSIFIED SECURITY CLASSIFICATION OF FORM
(Highest Classification of Title, Abstract, Keywords)
13. ABSTRACT (a brief and factual summary of the document. It may also appear elsewhere in the body of the document itself. It is highly desirable that the abstract of classified documents be unclassified. Each paragraph of the abstract shall begin with an indication of the security classification of the information in the paragraph (unless the document itself is unclassified) represented as (S), (C), (R), or (U). It is not necessary to include here abstracts in both official languages unless the text is bilingual).
Over the past year we have continued our study of the passive standoff detection of radiological materials by Fourier-transform infrared (FTIR) radiometry. The earlier work had shown that a number of radiological materials have an infrared signature in the 8 – 14 microns thermal infrared region. As well, through a series of simulations using the MODTRAN4 atmospheric transmission model, it had been shown that these materials may potentially be detected passively at standoff distances of several kilometres. In this report we present results of our current work that focus on recent new measurements of spectral signatures, including the uranium oxides UO2 and UO3. Preliminary results from a measurement campaign held at Defence Research and Development Canada – Valcartier this year are also presented which address the passive detection of radiological materials in the field at standoff distances of 10 – 40 m. These results are analysed in view of determining the potential for measuring radiological products with a passive standoff FTIR technique.
14. KEYWORDS, DESCRIPTORS or IDENTIFIERS (technically meaningful terms or short phrases that characterize a document and could be helpful in cataloguing the document. They should be selected so that no security classification is required. Identifiers, such as equipment model designation, trade name, military project code name, geographic location may also be included. If possible keywords should be selected from a published thesaurus, e.g. Thesaurus of Engineering and Scientific Terms (TEST) and that thesaurus-identified. If it is not possible to select indexing terms which are Unclassified, the classification of each should be indicated as with the title.)
Passive standoff detection, radiological, dirty bomb, radiological dispersion device, FTIR radiometry
UNCLASSIFIED
SECURITY CLASSIFICATION OF FORM (Highest Classification of Title, Abstract, Keywords)

Canada’s leader in defenceand national security R&D
Chef de file au Canada en R & Dpour la défense et la sécurité nationale
WWW.drdc-rddc.gc.ca
Defence R&D Canada R & D pour la défense Canada

![Christmas Songbook€¦ · A Spaceman Came Travelling – Chris De Burgh (1975) Intro: [Am]La la la [Em] La la la [F] La [C]La la la [G] La la la [F] La [F!][G!] [Am]La la la [Em]](https://static.fdocuments.in/doc/165x107/61296d24f21e2b096536cbbb/christmas-songbook-a-spaceman-came-travelling-a-chris-de-burgh-1975-intro-amla.jpg)


![LEAVIN’ ON A JET PLANE · [F] La la la la la [A7] laaaa la la [Dm] la la la la la la [F7] laaaaaa La la la la [Bb] laaa la la la la [C7] laaaa la la la [F] laaaa [F7] So [Bb] listen](https://static.fdocuments.in/doc/165x107/5fd12ba0d69a5f331475cebd/leavina-on-a-jet-f-la-la-la-la-la-a7-laaaa-la-la-dm-la-la-la-la-la-la-f7.jpg)