Asia Tax Forum May 9-10, 2012 – Raffles, Singapore Country developments South East Asia Panel .
date post
18-Dec-2015Category
view
215download
0
Recent Economic Developments in
Singapore
Outline for this Presentation
Structure of the Singapore Economy
Business Cycles in Singapore
Dynamics of the 2001 Recession
Characteristics of the Initial Upturn
Support Provided by Policy
Structure of the Singapore Economy
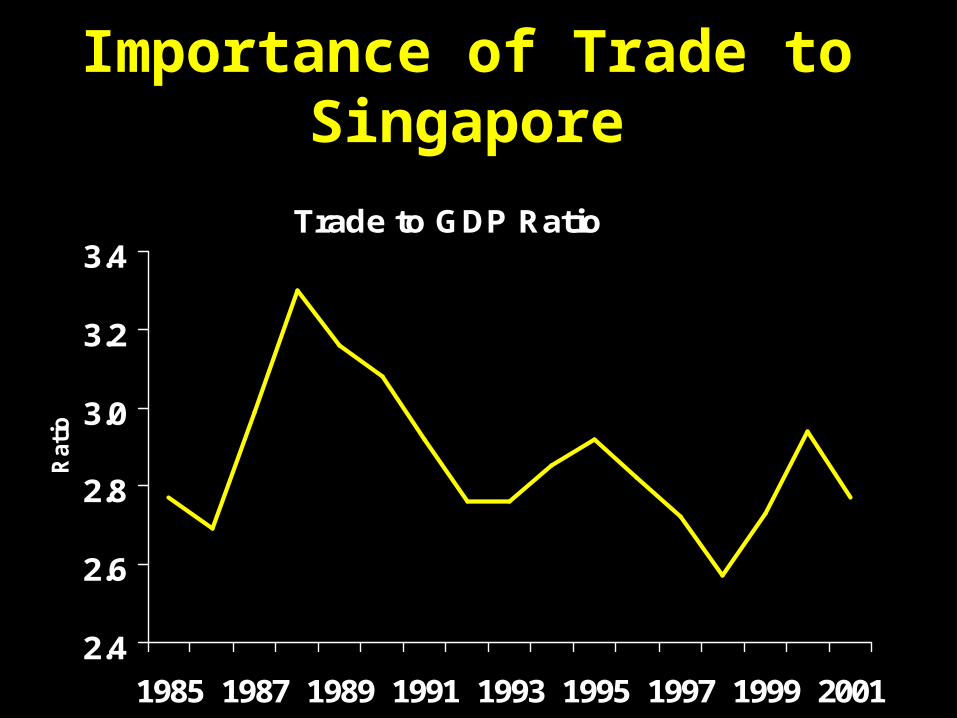
Importance of Trade to Singapore
Trade to GDP Ratio
2.4
2.6
2.8
3.0
3.2
3.4
1985 1987 1989 1991 1993 1995 1997 1999 2001
Rati
o
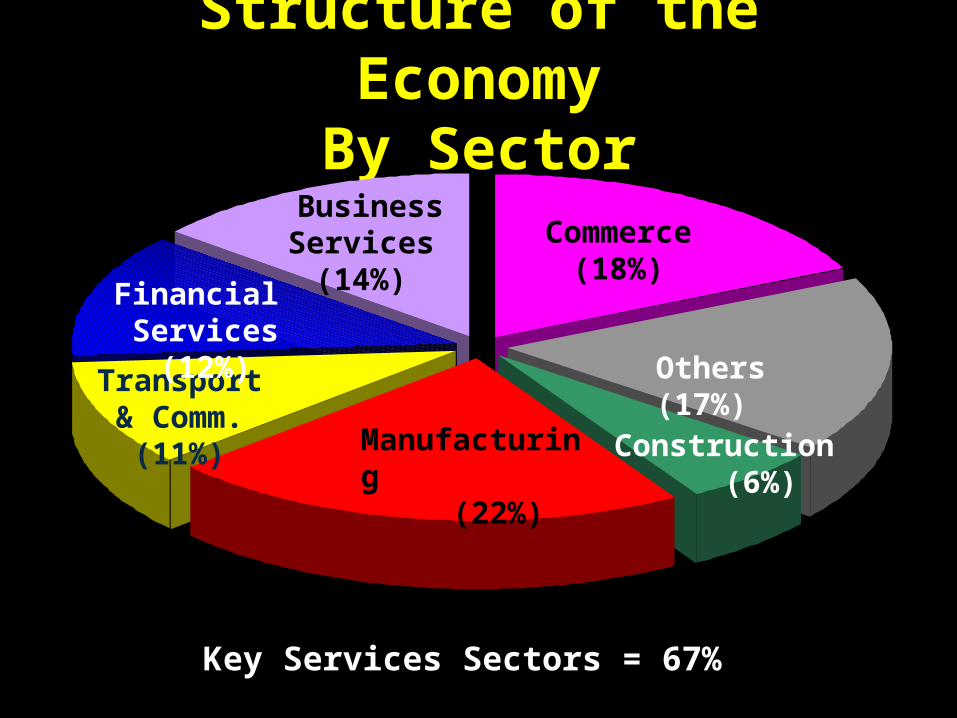
Structure of the EconomyBy Sector
Manufacturing (22%)
Construction (6%)
Commerce (18%)
Transport & Comm. (11%)
Business Services (14%)
Others (17%)
Key Services Sectors = 67%
Financial Services (12%)
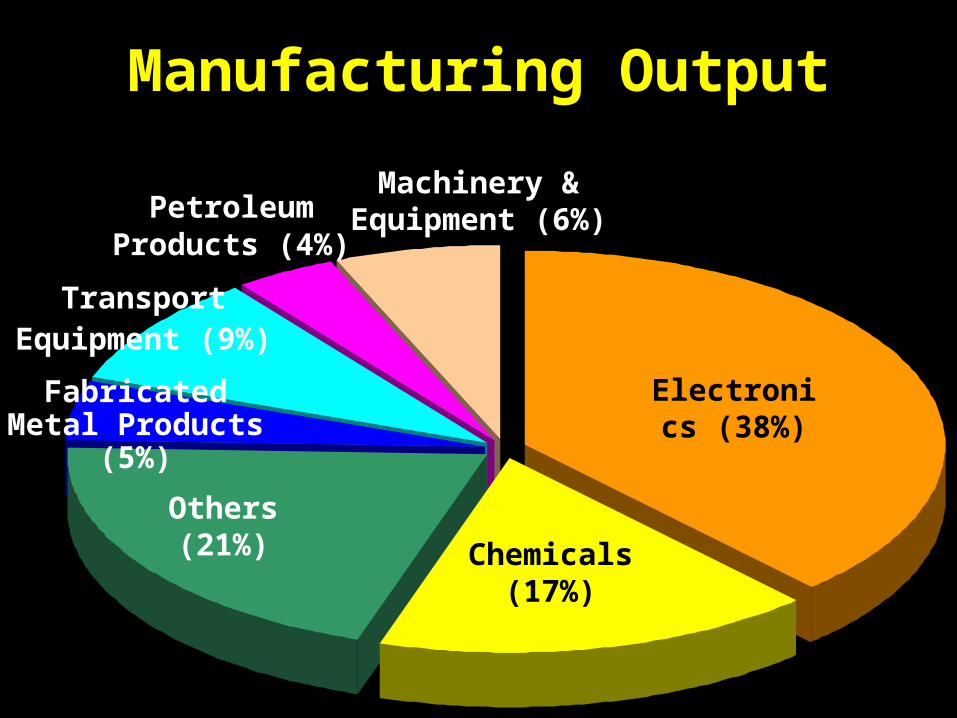
Manufacturing Output
Chemicals (17%)
PetroleumProducts (4%)
Others (21%)
Electronics (38%)
Machinery & Equipment (6%)
TransportEquipment (9%)
Fabricated Metal Products (5%)
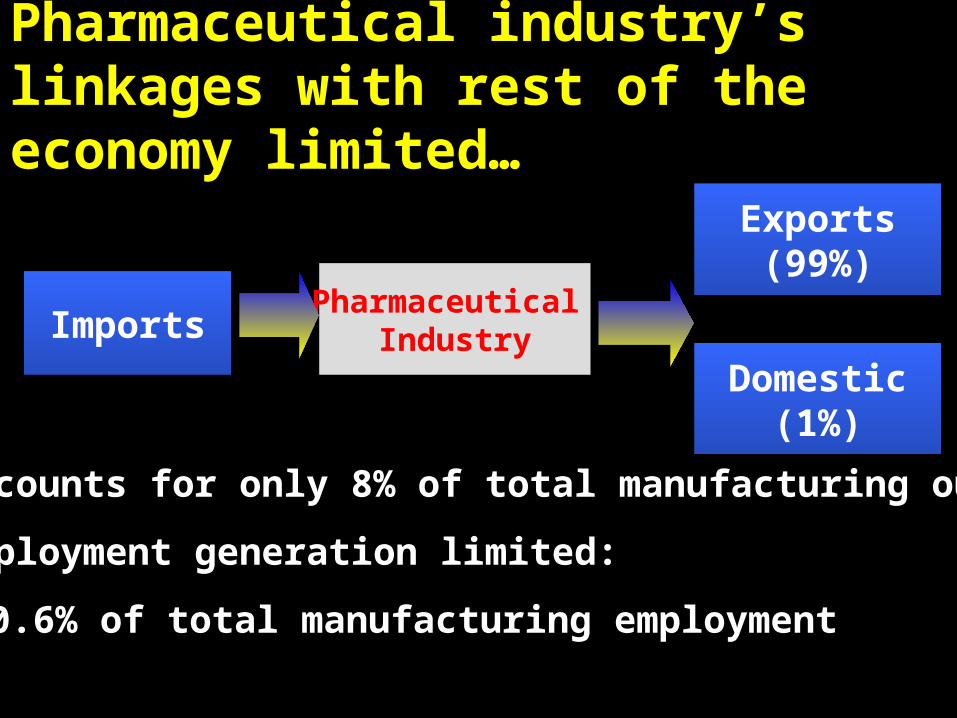
Pharmaceutical industry’s linkages with rest of the economy limited…
Pharmaceutical Industry
Accounts for only 8% of total manufacturing output
Employment generation limited:
0.6% of total manufacturing employment
Imports
Exports(99%)
Domestic(1%)
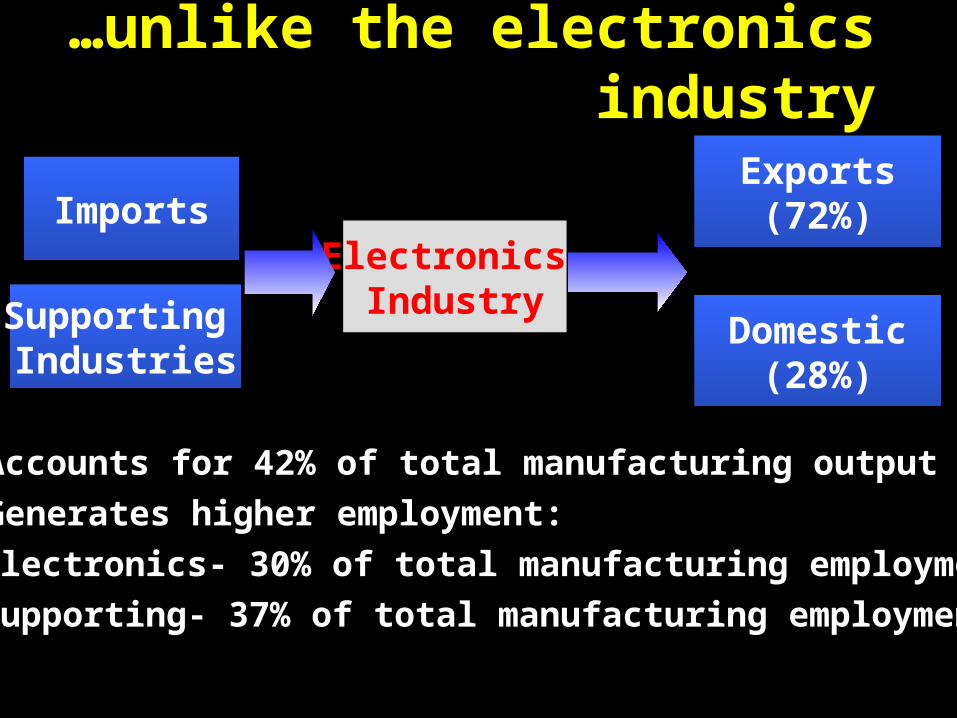
…unlike the electronics industry
Electronics Industry
Accounts for 42% of total manufacturing output Generates higher employment:
Electronics- 30% of total manufacturing employment
Supporting- 37% of total manufacturing employment
ImportsExports(72%)
Supporting Industries
Domestic(28%)
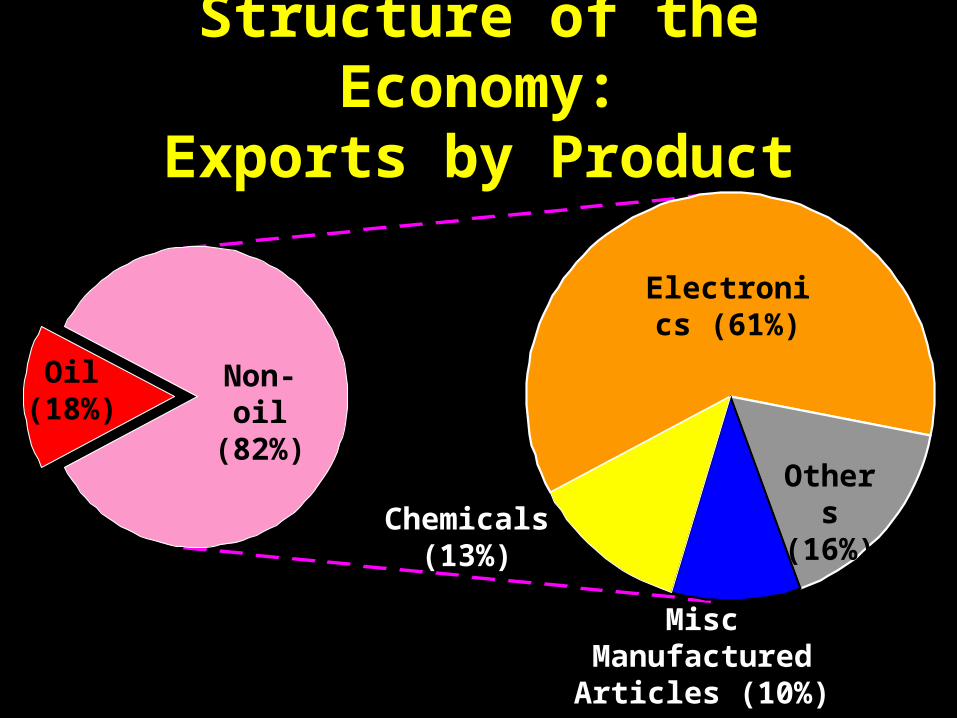
Structure of the Economy:
Exports by Product
Non-oil (82%)
Oil (18%)
Electronics (61%)
Chemicals (13%)
Others (16%)
Misc Manufactured Articles (10%)
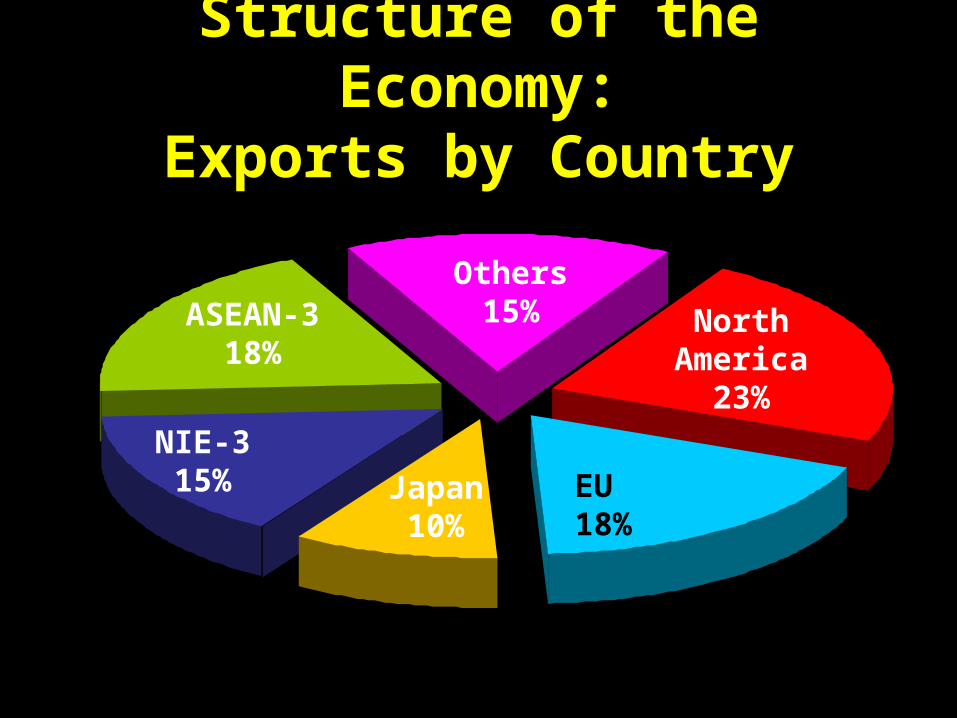
Others 15% North
America 23%
EU 18%
Japan 10%
NIE-3 15%
ASEAN-3 18%
Structure of the Economy:
Exports by Country

Summary I
Ultra Open Economy
Manufacturing & Services as Twin Pillars
Dominance of Electronics in
Manufacturing / Exports
Chemicals Rising But Less Linkages &
Multiplier’s Effects
Business Cycles in Singapore
-15
-10
-5
0
5
10
15
20
1980 1984 1988 1992 1996 2000
YO
Y %
Gro
wth
-60
-40
-20
0
20
40
60
80
YO
Y %
Gro
wth
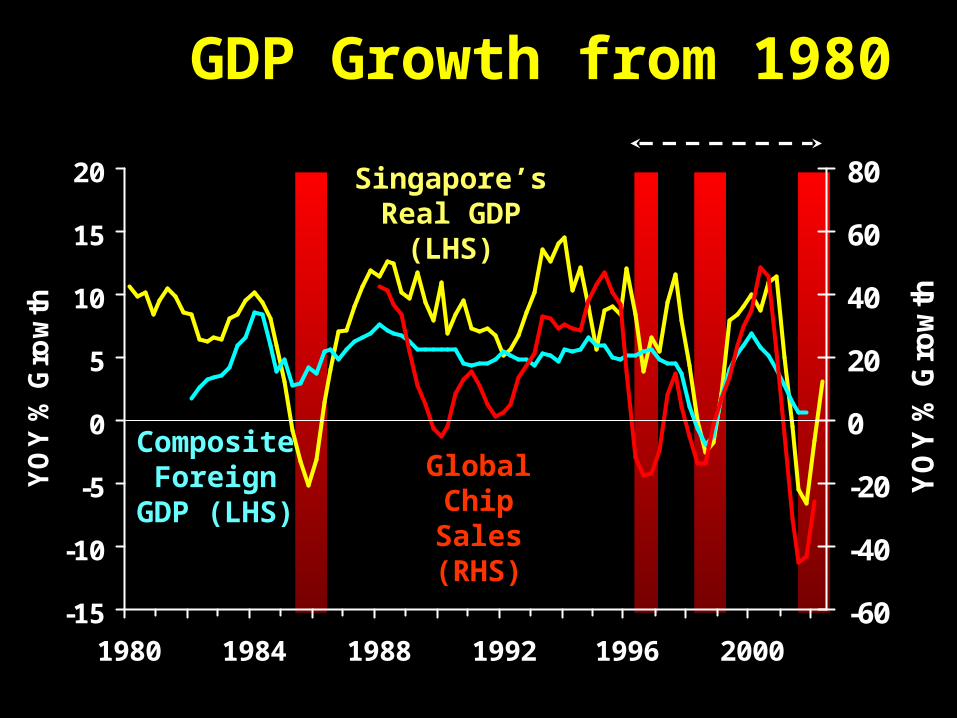
Singapore’sReal GDP
(LHS)
GDP Growth from 1980
Composite Foreign
GDP (LHS)
Global Chip Sales
(RHS)
Dynamics of the 2001 Recession
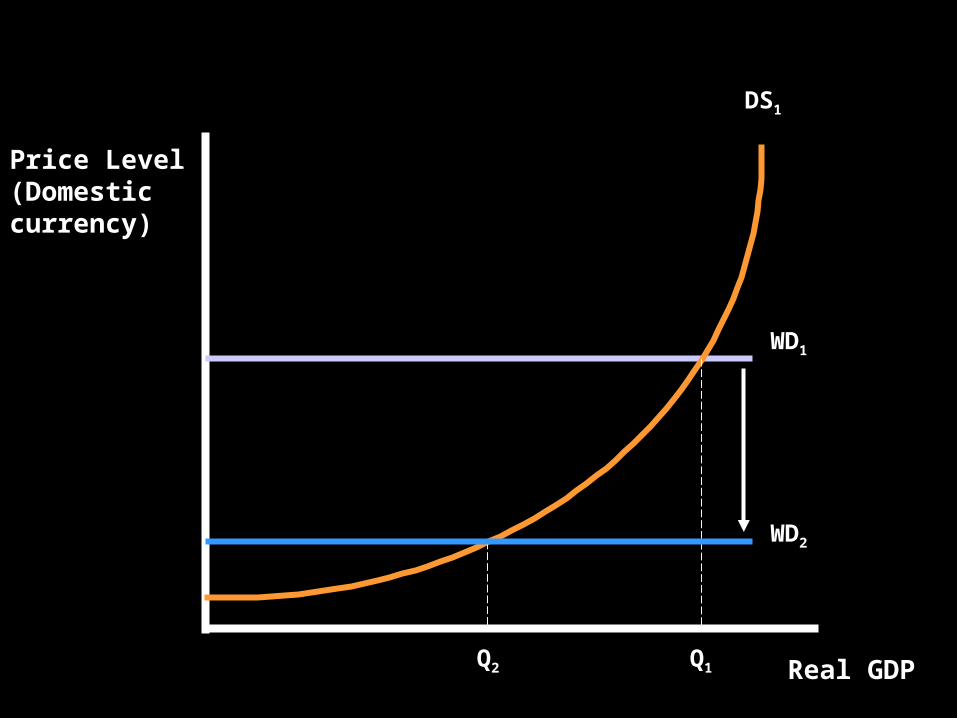
World Demand-Domestic Supply CurveDS1
WD1
WD2
Price Level (Domestic currency)
Real GDPQ1Q2
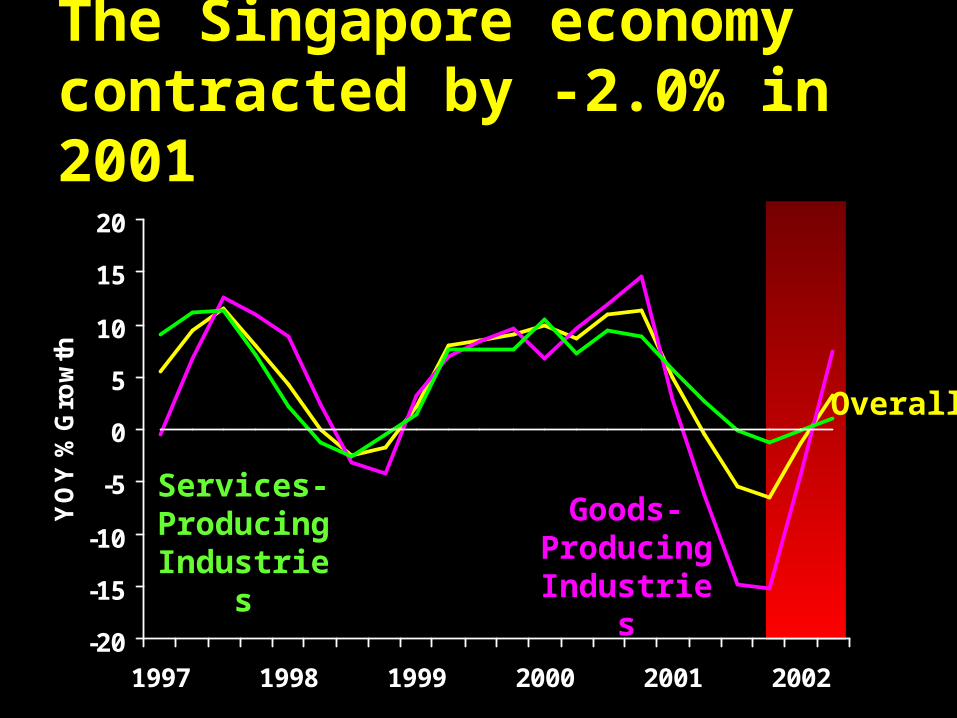
The Singapore economy contracted by -2.0% in 2001
-20
-15
-10
-5
0
5
10
15
20
1997 1998 1999 2000 2001 2002
YO
Y %
Gro
wth
Overall
Goods-Producing Industries
Services-Producing Industries
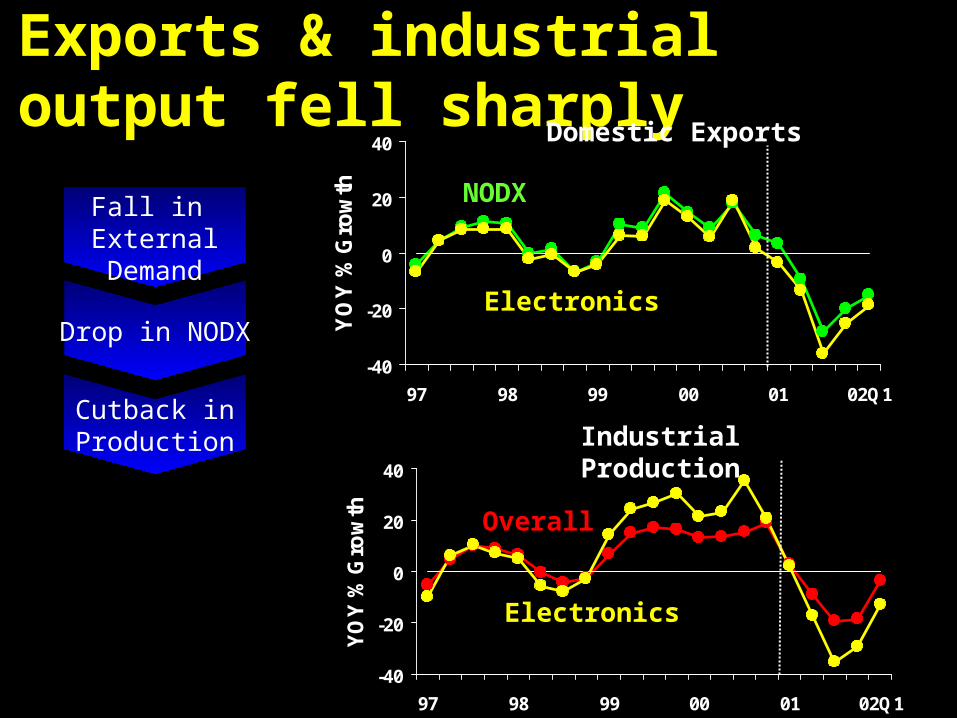
Exports & industrial output fell sharply
-40
-20
0
20
40
97 98 99 00 01 02Q1
YO
Y %
Gro
wth
Fall in ExternalDemand
Drop in NODX
NODX
Electronics
Domestic Exports
-40
-20
0
20
40
97 98 99 00 01 02Q1
YO
Y %
Gro
wth
Cutback inProduction
Overall
Electronics
Industrial Production
-40
-20
0
20
40
60
97 98 99 00 01 02
YO
Y %
Gro
wth
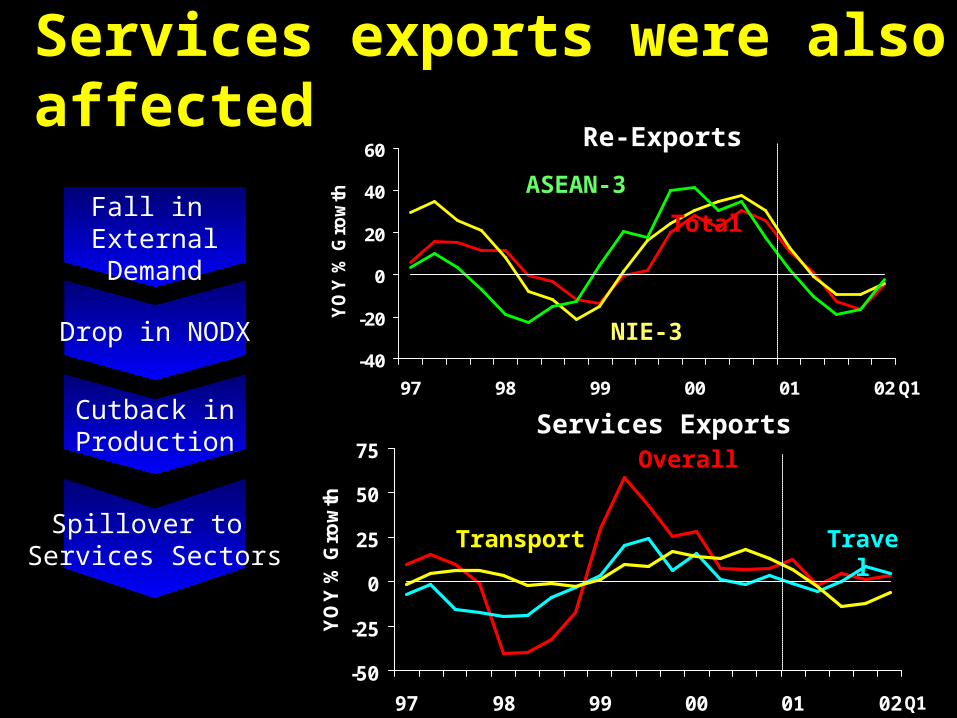
Spillover to Services Sectors
Services exports were also affected
Total
ASEAN-3
NIE-3
Re-Exports
-50
-25
0
25
50
75
97 98 99 00 01 02
YO
Y %
Gro
wth
TravelTransport
Overall
Services Exports
Q1Cutback inProduction
Fall in ExternalDemand
Drop in NODX
Q1
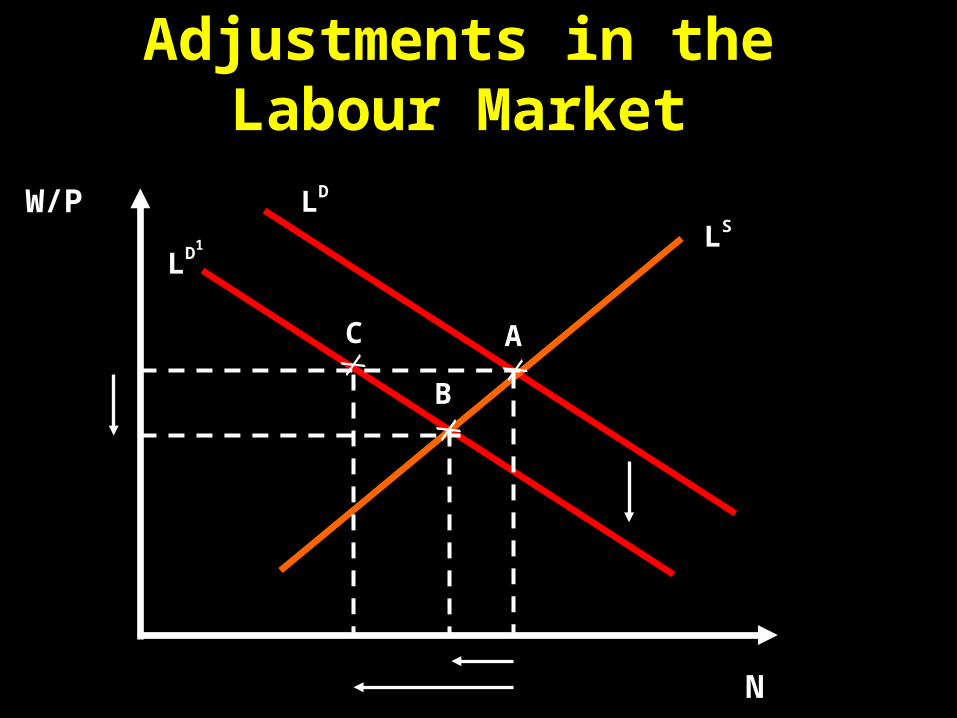
Adjustments in theLabour Market
N
W/PLS
X
A
LD
C
X
B
X
LD1
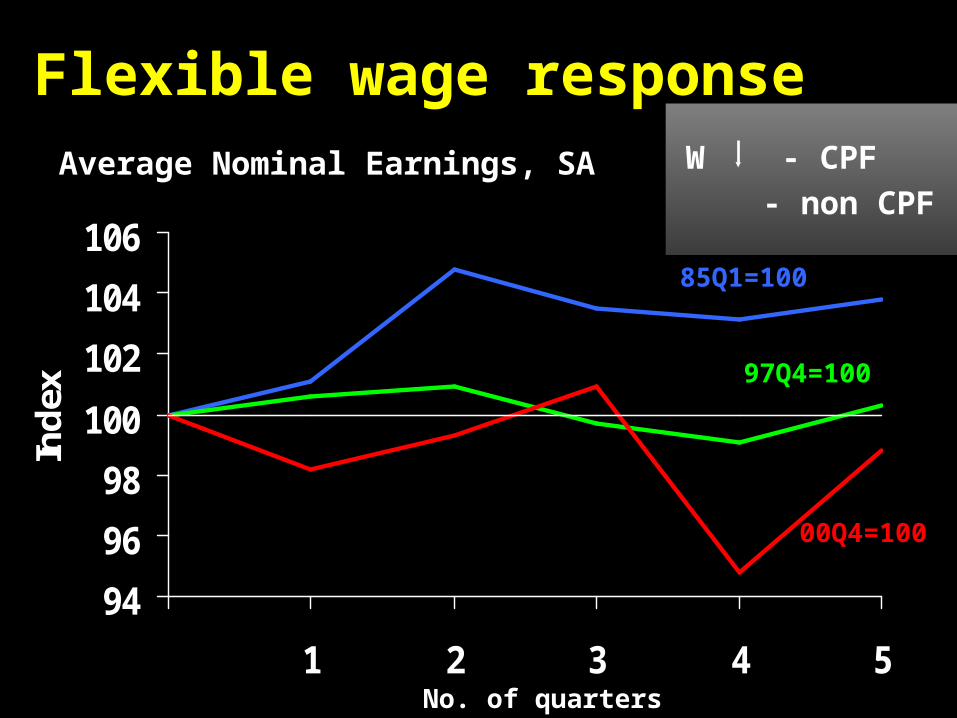
Flexible wage responseAverage Nominal Earnings, SA
94
96
98
100
102
104
106
1 2 3 4 5
Ind
ex
No. of quarters
85Q1=100
97Q4=100
00Q4=100
W - CPF- non CPF

-10
-8
-6
-4
-3-2-10
2
3
4
-40 -20 0Exports CPI
Real GDP
Unemployment Rate
2001
19981985
GDP Downturn in
Summary of Key Indicators : Peak-to-Trough Adjustments
Comparisons Across Downturns
-7.7 (3Q)-3.1 (3Q)-5.3 (3Q)
-0.9 (3Q)-1.6 (4Q)-2.0 (4Q)
2.1 (4Q)2.7 (5Q)3.6 (7Q)
-28.4 (4Q) -7.7 (4Q)-12.9 (2Q)
Summary IIMore volatile environment – 3 shocks in 5 years
Cause shifts in AD curve
Dynamics of Recession :
Exports Output Services Labour Market
Prices
2001: Deepest Recession
2001 : Wages adjusted quickly

Characteristics of the Initial Upturn
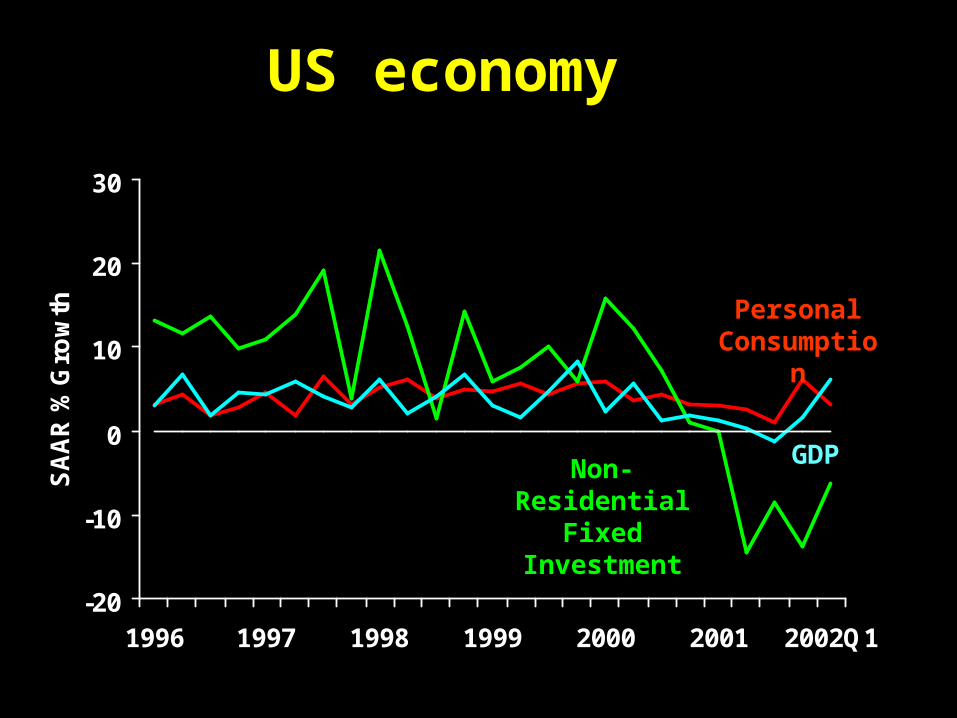
US economy
-20
-10
0
10
20
30
1996 1997 1998 1999 2000 2001 2002Q1
SA
AR
% G
row
th
Non-Residential Fixed
Investment
GDP
Personal Consumption
-15
-10
-5
0
5
10
15
20
1997 1998 1999 2000 2001 2002
Pe
r C
en
t
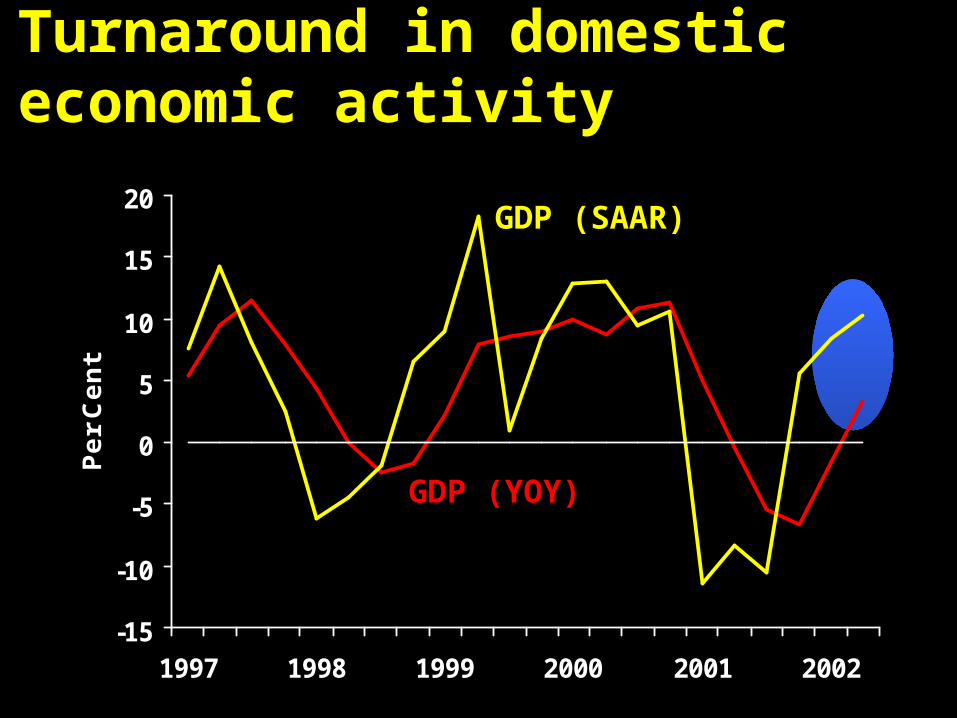
GDP (YOY)
GDP (SAAR)
Turnaround in domestic economic activity
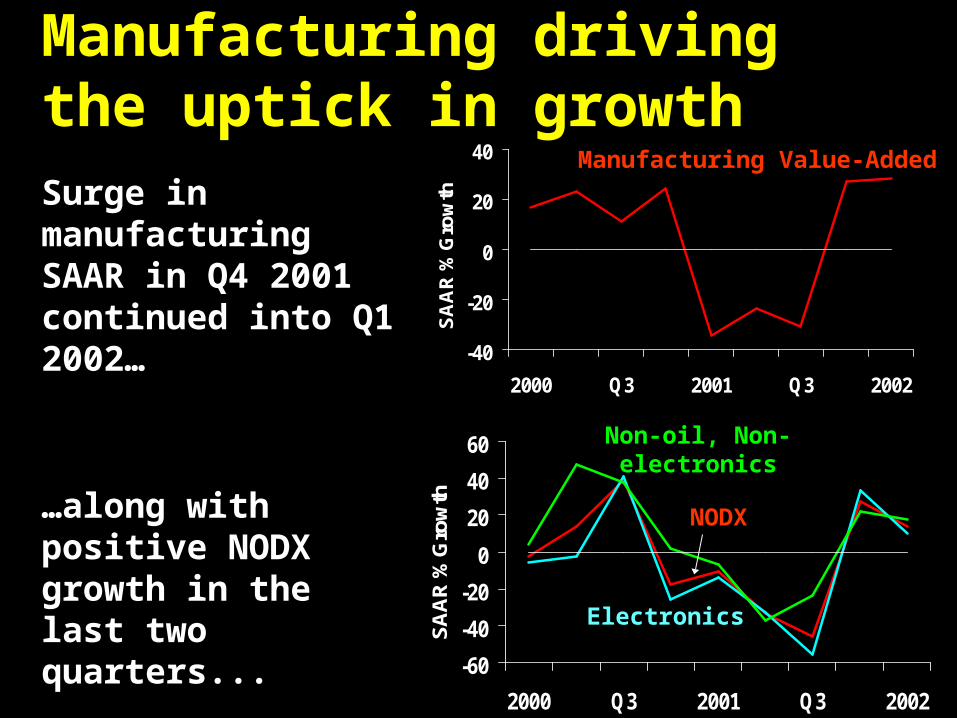
Manufacturing driving the uptick in growthSurge in manufacturing SAAR in Q4 2001 continued into Q1 2002…
…along with positive NODX growth in the last two quarters...
-40
-20
0
20
40
2000 Q3 2001 Q3 2002
SA
AR
% G
row
th
Manufacturing Value-Added
-60
-40
-20
0
20
40
60
2000 Q3 2001 Q3 2002
SA
AR
% G
row
thNon-oil, Non-electronics
NODX
Electronics
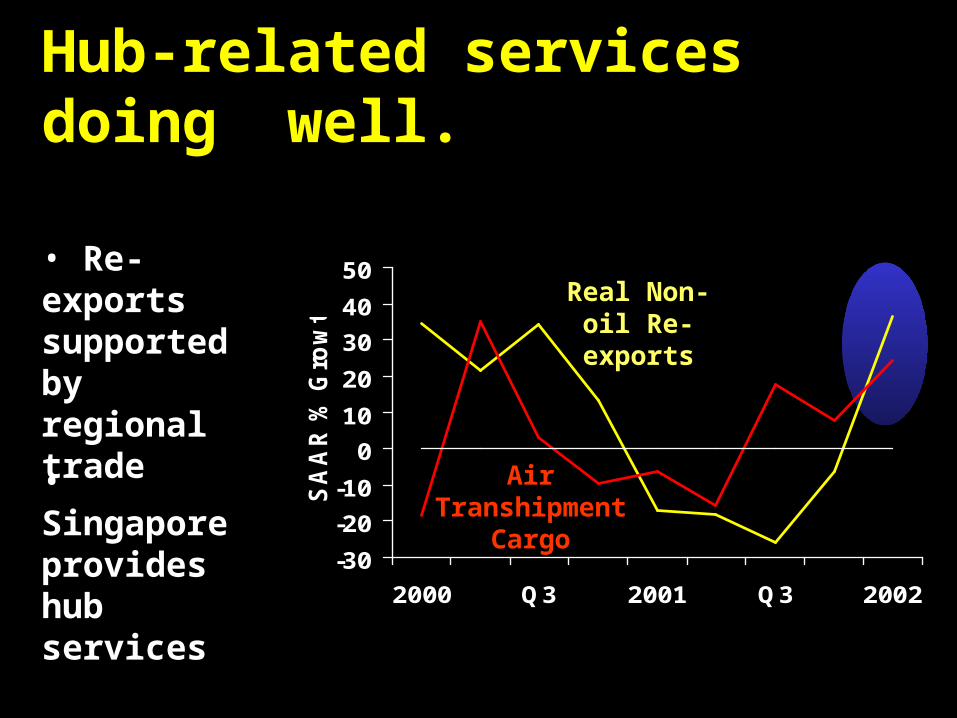
Hub-related services doing well.
-30
-20
-10
0
10
20
30
40
50
2000 Q3 2001 Q3 2002
SA
AR
% G
row
th
Air Transhipment
Cargo
Real Non-oil Re-exports
• Re-exports supported by regional trade
• Singapore provides hub services
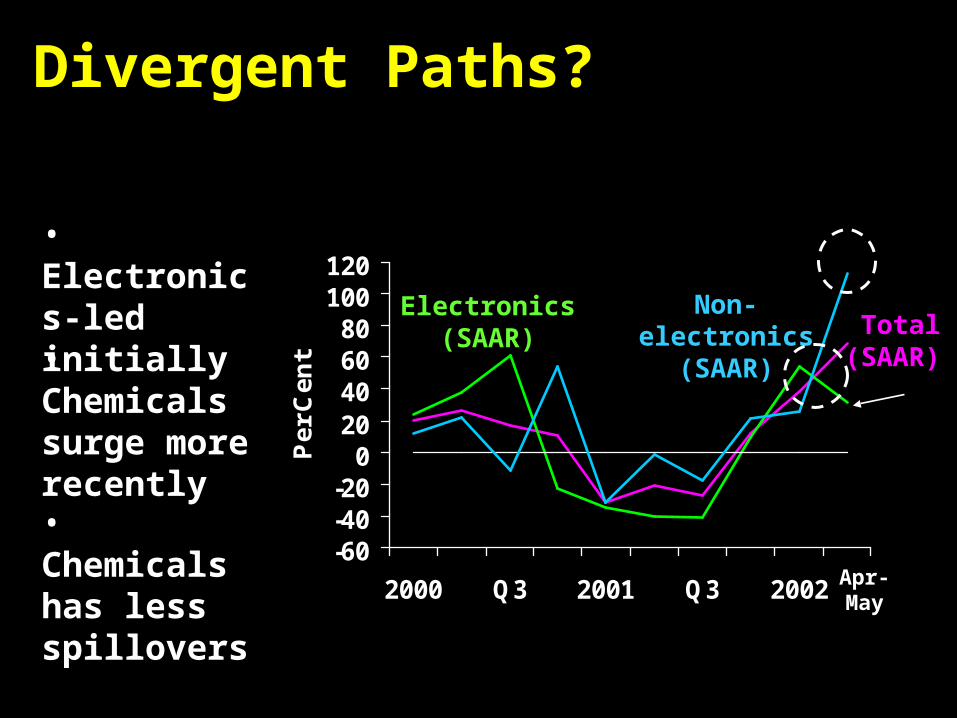
Divergent Paths?
-60-40-20
020406080
100120
2000 Q3 2001 Q3 2002
Pe
r C
en
tTotal
(SAAR)
Electronics(SAAR)
Non-electronics(SAAR)
Apr-May
• Electronics-led initially
• Chemicals has less spillovers
• Chemicals surge more recently
Support Provided by Policy
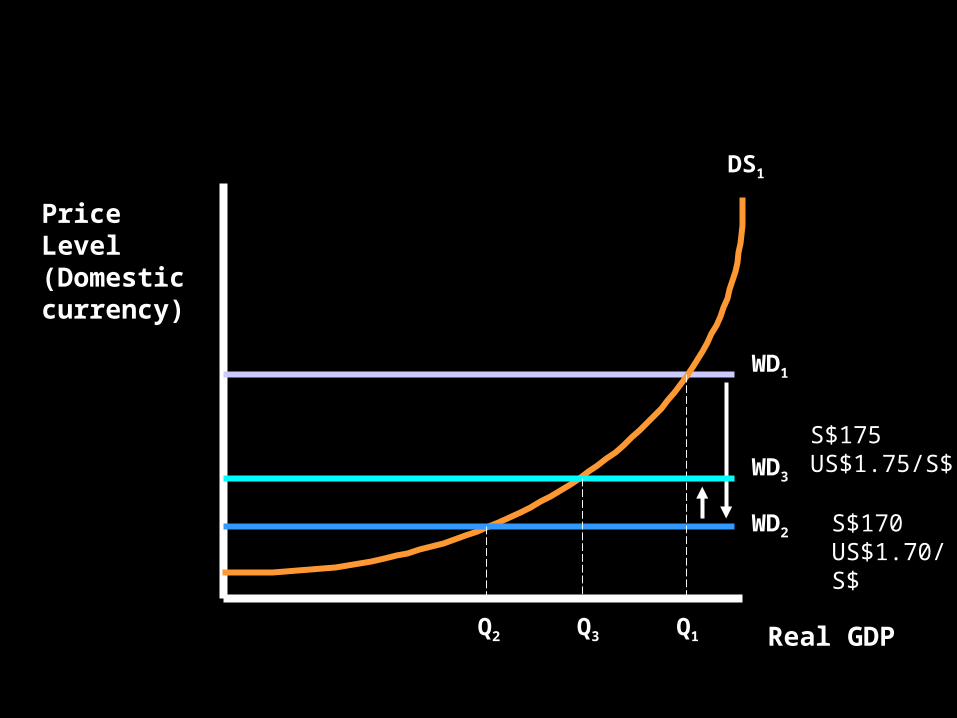
World Demand-Domestic Supply Curve
Price Level (Domestic currency)
Real GDP
DS1
WD1
WD2
Q1Q2
WD3
Q3
S$175US$1.75/S$
S$170US$1.70/S$
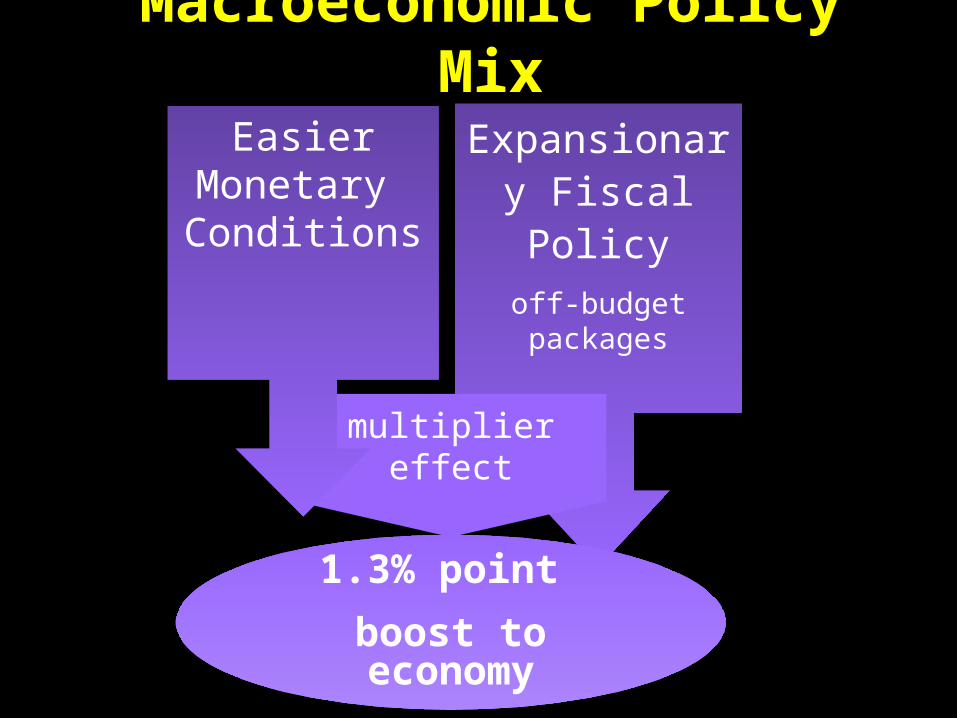
Macroeconomic Policy Mix
Expansionary Fiscal Policy
off-budget packages
multiplier effect
1.3% point
boost to economy
Easier Monetary Conditions
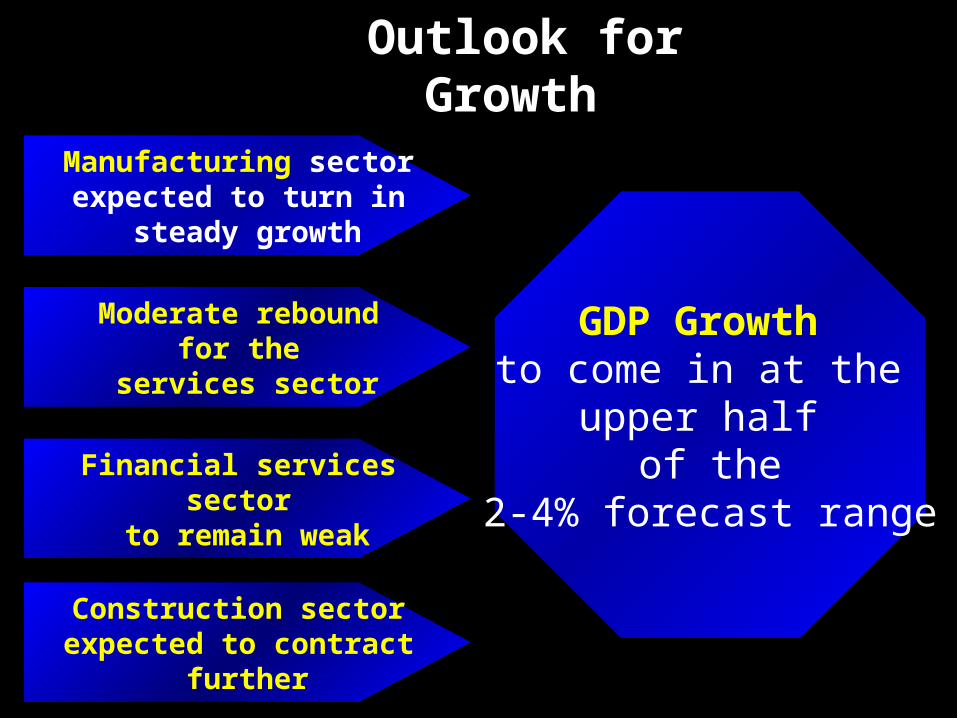
Outlook for Growth
Manufacturing sector expected to turn in
steady growth
Financial services sector
to remain weak
Moderate rebound for the
services sector
Construction sector expected to contract
further
GDP Growth to come in at the
upper half of the
2-4% forecast range
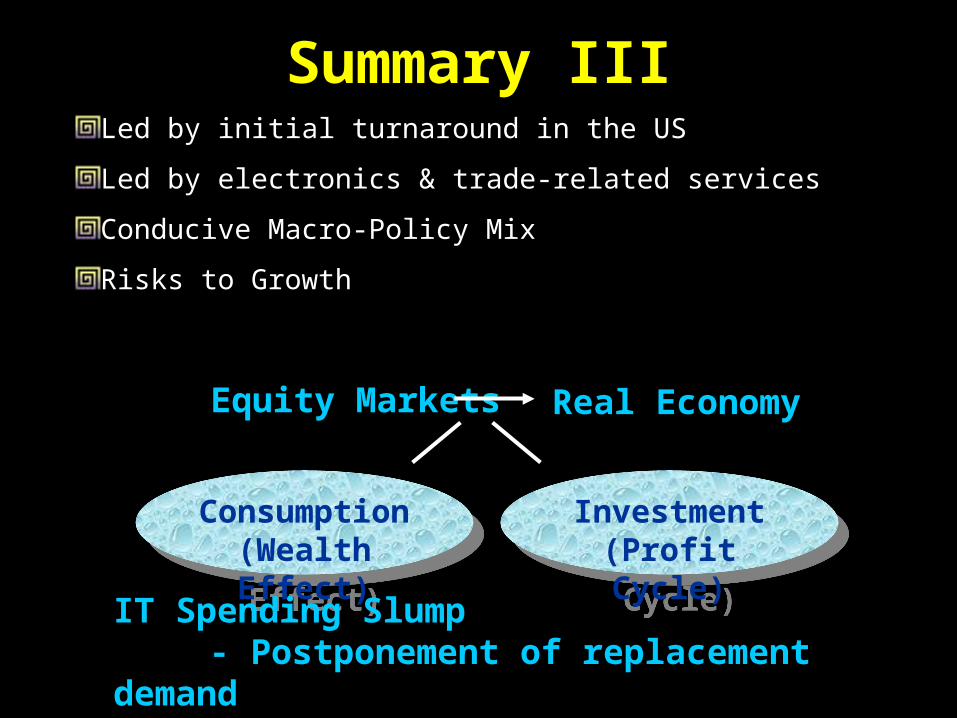
Consumption(Wealth Effect)
Consumption(Wealth Effect)
Equity Markets Real Economy
Investment(Profit Cycle)
Investment(Profit Cycle)
IT Spending Slump- Postponement of replacement demand
Summary IIILed by initial turnaround in the US
Led by electronics & trade-related services
Conducive Macro-Policy Mix
Risks to Growth
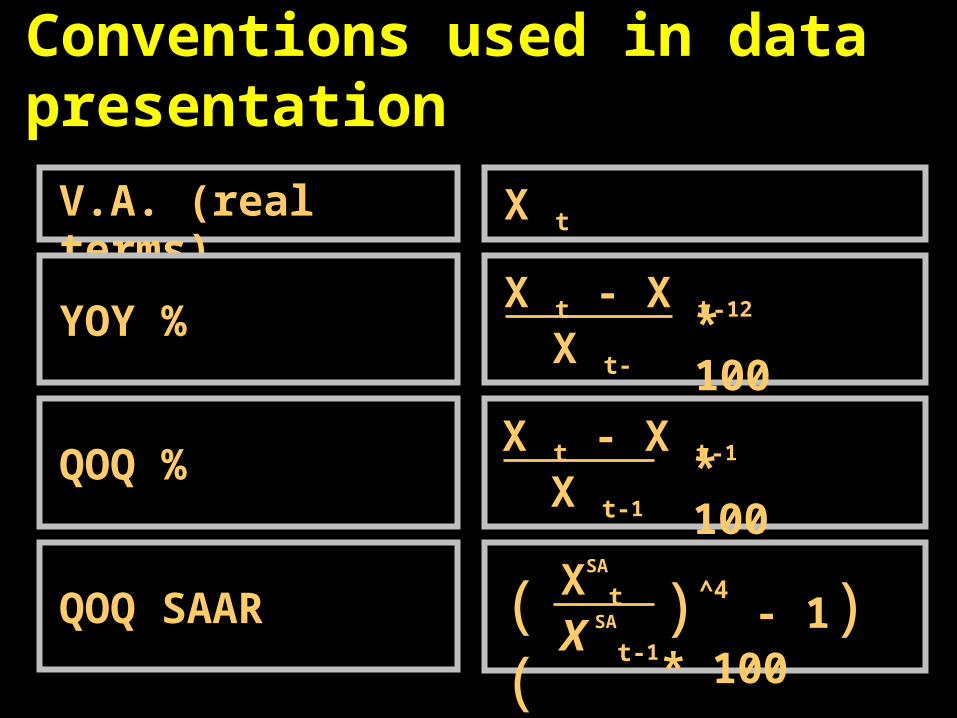
Conventions used in data presentation
V.A. (real terms) X t
YOY %X t - X t-12
X t-12
* 100
QOQ %X t - X t-1
X t-1* 100
QOQ SAARXSA
t
X SA
t-1)^4
- 1) * 100((
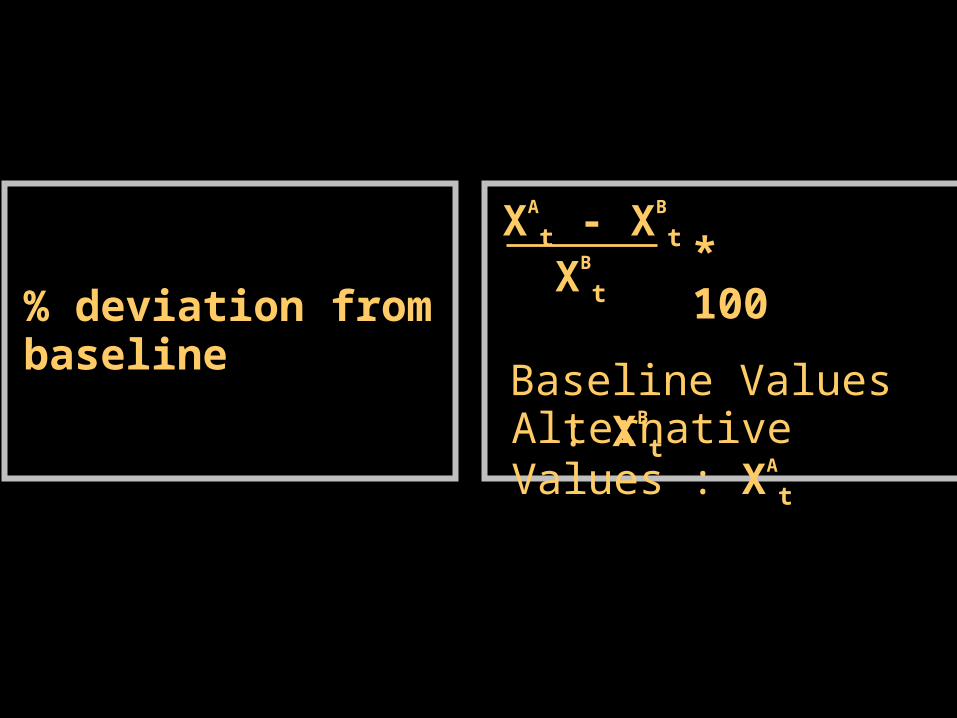
% deviation from baseline
XA
t - XB
t
XB
t
* 100
Baseline Values : XB
t
Alternative Values : XA
t