I.U.G.R. Intrauterine Growth Retardation (Restriction) Presented by: DR. NABEEL S. BONDAGJI.
NBER WORKING PAPER SERIES
REASSESSING THE WIC EFFECT:EVIDENCE FROM THE PREGNANCY NUTRITION SURVEILLANCE SYSTEM
Theodore JoyceAndrew D. Racine
Cristina Yunzal-Butler
Working Paper 13441http://www.nber.org/papers/w13441
NATIONAL BUREAU OF ECONOMIC RESEARCH1050 Massachusetts Avenue
Cambridge, MA 02138September 2007
The research was supported by grants from the Institute for Research on Poverty and United StatesDepartment of Agriculture (IRP-USDA) Small Grants program to Baruch College and from the USDAFood and Nutrition Research Program to the National Bureau of Economic Research (# 59-5000-6-0102).We thank participants at the Small Grant Conference at the University of Wisconsin and the SmallGrant conference at USDA Economic Research Service in Washington D.C. We thank Karen Daleniusfrom the Centers for Disease Control and Prevention (CDC) for help with the PNSS file and specialthanks to WIC Program administrators in various state offices. These include Najmul Chowdhury(North Carolina), Patrice Wolfla (Indiana), Nancy Hoffman (Missouri), Penny Roth (Illinois) and LisaArmstrong (Virginia). We would also like to acknowledge input from John Karl Scholz at the Universityof Wisconsin and Jay Hirschman at the USDA Food and Nutrition Bureau and three anonymous referees.All opinions are those of the authors and do not represent those of the various state WIC programs,the CDC, the USDA, or the National Bureau of Economic Research.
© 2007 by Theodore Joyce, Andrew D. Racine, and Cristina Yunzal-Butler. All rights reserved. Shortsections of text, not to exceed two paragraphs, may be quoted without explicit permission providedthat full credit, including © notice, is given to the source.
Reassessing the WIC Effect: Evidence from the Pregnancy Nutrition Surveillance SystemTheodore Joyce, Andrew D. Racine, and Cristina Yunzal-ButlerNBER Working Paper No. 13441September 2007JEL No. I12,I38
ABSTRACT
Recent analyses differ on how effective the Special Supplemental Nutrition Program for Women, Infantsand Children (WIC) is at improving infant health. We use data from nine states that participate inthe Pregnancy Nutrition Surveillance System to address limitations in previous work. With informationon the mother's timing of WIC enrollment, we test whether greater exposure to WIC is associatedwith less smoking, improved weight gain during pregnancy, better birth outcomes, and greater likelihoodof breastfeeding. Our results suggest that much of the often-reported association between WIC andlower rates of preterm birth is likely spurious, the result of gestational age bias. We find modest effectsof WIC on fetal growth, inconsistent associations between WIC and smoking, limited associationswith gestational weight gain, and some relationship with breast feeding. A WIC effect exists, but onfewer margins and with less impact than has been claimed by policy analysts and advocates.
Theodore JoyceBaruch College and NBER365 Fifth Avenue, 5th FloorNew York, NY [email protected]
Andrew D. RacineAlbert Einstein College of Medicine Children's HosDivision of General Pediatrics1621 Eastchester RoadBronx, NY 10461and [email protected]
Cristina Yunzal-ButlerGraduate Center, City University of New York365 Fifth Avenue, 5th FloorNew York, New York [email protected]

Introduction
The conclusion among policy analysts has been that “WIC works.” The 1992 General
Accounting Office report concluded that every $1.00 spent on WIC saves the government $3.50
in averted newborn costs (General Accounting Office, 1992). A more recent review of WIC’s
31-year history reached similar conclusions,1 and a new study based on data from 19 states found
that participation in WIC was associated with a 29 percent reduction in low birth weight and
more than a 50 percent reduction in very low birth weight [Bitler and Currie (BC), 2005a].
However, Besharov and Germanis (2001) and more recently Joyce, Gibson and Colman
[(JGC), 2005] have challenged the prevailing wisdom. Besharov and Germanis (2001) reviewed
the literature and concluded that evidence linking WIC to improved birth outcomes was dated
and based on weak designs that were vulnerable to contamination by selection bias. Joyce,
Gibson and Colman (2005) analyzed over 800,000 births to women on Medicaid in New York
City between 1988 and 2001. They found little association between WIC and fetal growth.
They did find that WIC was strongly associated with preterm birth, but concluded that the
association was likely spurious, since there is little support in the clinical literature for such an
association.
Bitler and Currie (2005b) challenged such skepticism, arguing that WIC provides more
than nutritional supplementation and that the bundle of services associated with WIC creates
health-enhancing synergies:
It is entirely possible that the main benefit of WIC is not the provision of food per se, but the fact that the “carrot” of food packages induces women to initiate prenatal care earlier, follow it more faithfully and receive more continuous care than they otherwise would. It is also possible that women who want to get WIC are less likely to smoke or use illegal
1 “What is cause for celebration is WIC’s extraordinary record of accomplishments for the nutrition and health of the nation’s children, and that record has grown as the program has grown.” Food Research and Action Center 2005, p. 1. http://www.frac.org/WIC/2004_Report/Summary_Report.pdf.
1
drugs in part because they get into care earlier, receive better advice, and are more closely monitored than other similar women. These are important issues that deserve investigation (Bitler and Currie, 2005b).
Ludwig and Miller (2005) reviewed the studies by JGC (2005) and BC (2005a) in an effort to
reconcile the conflicting conclusions. Ludwig and Miller (2005) noted that the lack of clinical
evidence linking nutritional supplementation and preterm birth did not rule out the possibility
that addressing the constellation of risk factors targeted by WIC might be protective of preterm
birth. They also stressed that neither JGC nor BC could determine the timing of WIC enrollment
but could only compare women who participated in WIC during pregnancy to those who did not.
A dichotomous indicator of WIC, argued Ludwig and Miller, will tend to overestimate the
protective effect of participation, since women whose pregnancies last longer for reasons
unrelated to WIC will have more opportunity to enroll. However, adjustment for the length of
gestation tends to “over-fit” the data and underestimates the effect of WIC, if participation
prolongs gestation.
In this paper, we address several of the issues raised by Bitler and Currie (2005b) and
Ludwig and Miller (2005). With data from the Pregnancy Nutrition Surveillance System (PNSS),
we provide new evidence that the association between WIC participation and preterm birth is
likely spurious. A major advantage of the PNSS is that we know the woman’s exact date of WIC
enrollment in both the prenatal and postpartum periods. We show that the rates of low birth
weight and preterm birth fall the longer women delay prenatal enrollment in WIC. Moreover,
women who enroll into WIC after delivery experience much higher rates of preterm birth than
women who enroll during pregnancy. The relatively low rate of adverse birth outcomes among
third trimester WIC enrollees suggests a form of fetal selection in which healthier pregnancies
endure for reasons unrelated to WIC. The elevated rate of adverse birth outcomes among
2
postpartum enrollees may be driven, in part, by women who would have enrolled in WIC
prenatally had they not delivered prematurely. The interpretation that WIC is not protective
against premature delivery is consistent with the clinical literature, where trial after trial has
failed to produce a reliable intervention to prevent preterm birth (Institute of Medicine, 2007).
In the second half of the paper, we analyze the association between WIC and fetal growth.
We argue that nutritional supplementation, health education and timely referrals are more likely
to be protective against intrauterine growth retardation (IUGR) than against preterm birth. In
addition, we also analyze changes in maternal smoking, breastfeeding and weight gain during
pregnancy in the belief that we should be able to support any association between WIC and
IUGR with changes in maternal behavior and health.
In the end, we find that prenatal participation in WIC is positively associated with fetal
growth, though the association is difficult to support with substantive changes in maternal
behavior and health. We conclude that, at least with respect to birth outcomes, WIC works, but
on fewer margins and with less impact than has been claimed by policy analysts and advocates.
We also argue that linking the success or failure of WIC to its impact on birth outcomes may be
myopic. Greater emphasis on affecting life-long habits such as smoking, or behaviors with
known benefits to mother and child such as breastfeeding, iron supplementation, and childhood
immunizations, may be sufficient to justify additional funding.
Background and Issues
The notion that “WIC works” is based primarily on WIC’s protective association against
preterm birth. The association between WIC and measures of fetal growth is less robust. Bitler
and Currie (2005a), for example, found that prenatal WIC participation was associated with a 29
3
percent decrease in the odds of a preterm birth (< 37 weeks) and a 53 percent decline in the odds
of a very preterm birth (< 32 weeks), but only a 13 percent decline in intrauterine growth
retardation. This pattern is common in the literature. Researchers find large and robust
associations between WIC and birth outcomes unadjusted for gestational age, but more modest
and even non-existent associations with measures of fetal growth.2 Most researchers have
interpreted this pattern as evidence that WIC is strongly protective against preterm birth. Yet
there is little in the clinical literature to suggest that nutritional supplementation exerts such an
effect. The recently released report on preterm birth by the Institute of Medicine summarizes the
literature as follows: “Randomized studies in both developed and developing countries have
noted an absence of benefit from dietary supplementation in preventing preterm birth (Berkowitz
and Papiernik, 1993). Furthermore, protein supplementation specifically has not been found to
reduce the risk of preterm birth and possibly increases the risk (Berkowitz and Papiernik, 1993;
Rush et al., 1980) as does multivitamin supplementation (Villar et al., 1998).” (Institute of
Medicine 2007, p. 94)
The association between WIC and fetal growth, although less consistent than the
association between WIC and preterm birth in the empirical literature, is more plausible. In one
recent study, researchers use data from linked administrative and birth certificate files in New
York State in 1995 (Lazariu-Bauer et al., 2004) and find that early WIC enrollment is strongly
associated with increased fetal growth. The study has a number of strengths. First, the exact
dates of WIC enrollment are available. This allows testing of whether fetal growth is directly
related to the amount of time a woman participates in WIC. Second, the authors use propensity
score matching to minimize observable differences between early and late WIC enrollees. They
2 See Devaney, Bilheimer and Schore 1992; Gordon and Nelson 1995; Kotelchuck, Schwartz, Anderka and Finison, 1984; Stockbauer, 1987; Buescher and Horton, 2000; Joyce, Gibson and Colman, 2005).
4

find that early enrollment in WIC is associated with an increase of 70 grams in birth weight
among full-term deliveries. Gains among blacks and Hispanics are twice as large as those of
whites. Yet despite its methodological sophistication, the study lacks evidence of a plausible
mechanism. There is no attempt to associate WIC participation with decreased smoking,
improved nutritional intake, greater maternal weight gain or other maternal behaviors consistent
with fetal growth.
Those who argue that WIC is protective against preterm birth contend that WIC is more
than nutritional supplementation. It is, they maintain, the combination of nutritional
supplementation, behavior counseling, and timely referrals that explains WIC’s protective effect.
However, a recent trial of comprehensive prenatal care failed to show a positive association with
improved birth outcomes (Klerman et al., 2001). Components of the augmented care included
specific interventions targeted at smoking cessation, weight gain, and vitamin/mineral
supplementation, as well as appointment reminders, free transportation, no waiting time for visits,
child care, evening office hours, and individualized care with the same practitioner. The focus
on access was clearly effective as women in the treatment group averaged almost two more
prenatal visits than women in routine care. The study is important because the augmented care
was directed at the “constellation of risk factors” that Ludwig and Miller (2005) argue may be
lacking from more narrowly targeted clinical trials for preterm birth. Indeed, the effort to
enhance access in addition to the augmented prenatal care services went well beyond what could
be expected from a typical WIC program.
The WIC program is now over 34 years old. Approximately 35 percent of all pregnant
and postpartum women participated in 1998 (Bitler, Currie and Scholz, 2003). The program’s
often-cited association with improved birth outcomes is predicated on a protective effect against
5
preterm birth, but is unsupported by evidence from the clinical literature. The few studies that
report a substantive association between WIC participation and enhanced fetal growth do not
provide corroborating evidence on intermediate outcomes such as reduced smoking and
improved maternal weight gain. In this study, we update and extend the literature with the
largest population-based study of WIC participants ever assembled. Because of the size, recency,
and detail of the data, we are able to analyze an array of birth outcomes and behaviors by the
timing of WIC enrollment in order to provide a broader assessment of WIC’s effectiveness.
Empirical Implementation
Data
Our data are from the Pregnancy Nutritional Surveillance System (PNSS). The PNSS is
“…..a program-based surveillance system that monitors the nutritional status of low-income
infants, children and women in federally funded maternal and child health programs”
(http://www.cdc.gov/pednss/). The PNSS collects information from all WIC program
participants at the points of prenatal and postpartum enrollment. At the prenatal interview, WIC
intake workers collect demographic information along with indicators of maternal health and
behavior. At the postpartum visit, information on infant health and postpartum behaviors is
added. The PNSS combines the advantage of administrative data and its detailed information on
the timing of WIC enrollment with that of survey data and its information on health outcomes
and behaviors. PNSS data on maternal health and behaviors are richer than those available from
birth certificates, which have been the primary source of outcomes in previous prenatal WIC
evaluations using secondary data (Schramm, 1985, 1986; Stockbauer, 1986, 1987; Devaney,
6
Bilheimer and Schore, 1992; Buescher and Horton, 2000; Ahluwalia, et al. 1998; Lazariu-Bauer,
et al. 2004).
The Centers for Disease Control and Prevention (CDC) organize the PNSS data from the
twenty-two states and three Indian tribal governments into a central file. We obtained
permission to access the PNSS file from the relevant institutional review board or from the
supervising WIC agency in each of the 10 states with the largest WIC caseloads in 2004. These
include Florida, Georgia, Illinois, Indiana, Michigan, Missouri, New Jersey, North Carolina,
Ohio and Virginia. Illinois data were discarded because information on the timing of WIC
enrollment was incomplete. Thus, we have PNSS data from nine states over multiple years in
all states except Virginia, for which we only have data from 2004 (see Table 1). The nine-state
file has 3,311,976 women who enrolled in WIC during pregnancy or postpartum. We included
all women who enrolled in WIC during pregnancy and who re-certified for WIC postpartum.
Without a postpartum interview, we lacked information on the birth outcome, breastfeeding, and
postpartum smoking. Re-certification also suggests that women were enrolled continuously
during pregnancy.3 The comparison group was women who enrolled in WIC after delivery and
thus were unexposed to WIC during pregnancy.
We excluded all women who enrolled in WIC during pregnancy but did not return to re-
certify after delivery (n=441,945 or 13.3%). This raises two potential issues. First, if these
woman had better (worse) birth outcomes, on average, than women who re-certified for WIC
postpartum, then our estimates of WIC’s effectiveness will be biased downwards (upwards).
Second, by excluding these women, our estimates become less comparable to those from studies
3 A better measure of continuous participation would be the dollar amount of redeemed food vouchers. Relatively few studies have had such data, but he the results from these tend to be consistent with estimates based on month of enrollment (see Kotelchuck et al., 1984).
7
that compare all prenatal WIC enrollees to eligible non-participants. Fortunately, the PNSS data
from North Carolina have also been linked to birth certificates. This linkage provides
information on birth outcomes and prenatal smoking for the prenatal WIC enrollees from that
state who did not re-certify postpartum. We refer to these women as lost to follow-up. Thus, we
compare estimates from models for North Carolina with and without woman who were lost to
follow-up. This provides some insight into the potential bias from excluding women who do not
re-certify postpartum from the larger sample. Three other studies have also used North Carolina
data to analyze WIC (Devaney, Bilheimer and Schore, 1992; Buescher et al., 1993; Buescher and
Horton, 2000). In each study, researchers linked WIC administrative data to Medicaid claims for
newborn deliveries and then to birth certificates. The comparison group in each was women
whose births were paid for by Medicaid, but who were not enrolled in WIC during pregnancy.
By contrast, our comparison group is women who did not participate in WIC during pregnancy,
but who enrolled in WIC postpartum. There is likely to be substantial overlap in our comparison
group and the one frequently used in the literature. We try to replicate the results from those two
studies by limiting our sample to women in WIC who were also covered by Medicaid at the time
of enrollment.
Econometric Model
The canonical test of WIC is as follows:
e WICααH (1) 10 +++= Xβ
Let H be a birth outcome such as birth weight and let WIC be a dichotomous indicator of
whether the woman enrolled in WIC during pregnancy. The omitted category usually includes
eligible non-participants such as women on Medicaid (Devaney, Bilheimer and Schore, 1992;
8
Bitler and Currie, 2005a). Let X be a matrix of other relevant variables, including demographic
and socio-economic characteristics of the mother, and let e be the error term. The vast majority
of research has found that α 1>0 for favorable outcomes such as birth weight and gestational age
and α 1<0 for adverse outcomes such as low birth weight and preterm birth (Fox, Hamilton and
Lin, 2004).
With data on the timing of WIC enrollment, the specification in equation (1) can be
expanded as follows:
e WIC_3αWIC_2αWIC_1ααH (2) 3210 +++++= Xβ
The WIC indicators designate the trimester of pregnancy in which a woman enrolled in WIC.
The omitted category is again eligible non-participants (Devaney, Bilheimer and Schore, 1992;
Gordon and Nelson, 1995; Lazariu-Bauer et al., 2004). In the PNSS, the omitted category is
postpartum enrollees. If greater exposure to WIC improves infant health, then we would expect
α1>α2> α3>0, or the reverse if H is an adverse outcome. Thus, we follow previous evaluations of
WIC and use Equation (2) to test for a dose-response effect.4 We also present estimates of
Equation (1) to link our results with past work.
Our test for a dose-response effect has two caveats. First, if nutritional supplementation
can be expected to produce improvements in fetal weight gain only if administered at the time of
greatest fetal growth, then third trimester enrollment might well turn out to be equally efficacious
compared to first trimester enrollment when little fetal growth is occurring. Second, although
we know the timing of WIC enrollment, we have no information about the continuity or intensity
of treatment.5 However, if WIC is more than nutritional supplementation—if women who enroll
4 See Devaney, Bilheimer and Schore (1992) Gordon and Nelson (1995), Ahluwalia et al. (1998) and Lazariu-Bauer et al. (2004) for tests of a dose-response between the timing of WIC enrollment and birth outcomes. 5 Earlier studies of prenatal WIC used redeemed vouchers per month to proxy intensity (Kennedy and Kotelchuck 1984; Schramm 1985; Stockbauer 1986) Thus, those who had 7-9 months of redeemed vouchers during pregnancy
9
early smoke and drink less, eat more nutritiously and receive timely referrals for additional
care—then early and continuous participation in WIC should be protective against adverse birth
outcomes. Thus, we would expect to find changes in maternal behavior and possibly increases in
weight gain during pregnancy.
Outcomes
Most studies have emphasized the association between WIC and the probability of a low
birth weight birth. However, low birth weight can be broadly divided between preterm births—
those that occur before the 37th week of gestation—and those that are small for gestational age
(SGA). The latter is an indication of fetal growth retardation. The causes of preterm birth are
largely unknown and few interventions, if any, appear effective (Institute of Medicine, 2007). A
stronger case can be made for an association between intrauterine growth retardation (IUGR) and
prenatal supplementation, since the latter is more closely linked to nutritional intake, smoking
and maternal weight gain (Kramer, 1987; Institute of Medicine, 1990).
We divide our analyses of birth outcomes along these two dimensions. We use birth
weight (in grams) and dichotomous indicators of low birth weight (<2500 grams), very low birth
weight (<1500 grams) and preterm birth (< 37 weeks gestation). These four outcomes allow for
comparisons with previous research and are mostly determined by gestational age.
We also analyze three measures of fetal growth. The first is birth weight adjusted for
gestational age.6 The second measure is a dichotomous indicator of infants below the 10th
percentile in weight for gestation, within gender, based on all singleton births to US residents in
1995 (Alexander et al., 1998). These births are referred to as small for gestational age (SGA).
had to have enrolled in the first trimester. However, a woman could have enrolled in first trimester but only redeemed three months of vouchers. Thus, early enrollment is a necessary condition for more prolonged treatment, but it is not a guarantee. 6 In other words, we include gestational age as a right-hand side determinant in a birth weight regression.
10
Our final measure of fetal growth is an indicator of infants that are term, low birth weight (> 37
weeks gestation and < 2500 grams).
We study three indicators of maternal behavior. The first is a dichotomous variable of
whether women who smoked three months before pregnancy indicate that they are not smoking
at the time of the postpartum interview. The second is whether a woman ever breastfed. Lastly,
we analyze maternal weight gain during pregnancy (in pounds), adjusted for pre-pregnancy BMI
and length of gestation.
Sources of bias
Although the statistical estimation of Equations (1) and (2) is straightforward, identification
of treatment effects associated with WIC is quite challenging. In econometric terms, the
coefficient on WIC, α1, estimates the average effect of treatment on the treated under two
assumptions: first, that the decision to participate in WIC, conditional on X, is uncorrelated with
the outcome in the absence of participation (H0); and second, that the expected gains to
participation are constant across individuals (Heckman, 1997; Wooldridge, 2002). These are
strong assumptions, and yet we know of no study that has been able to instrument credibly for
WIC participation.
One fallback strategy has been to include a rich set of controls to lessen selection bias
from omitted variables (Gordon and Nelson, 1995; Bitler and Currie, 2005a). For instance,
favorable selection occurs if early WIC enrollment is just one manifestation of healthy behavior.
These same women may be less likely to smoke, drink, use illicit drugs, and may be less likely to
experience vaginal infections. If we only partially control for these factors, then we will
overestimate the treatment effect of WIC. Adverse selection may also contaminate estimates.
11

In this case, women with a history of reproductive health problems may seek out WIC and
prenatal care early in order to lessen the likelihood of an adverse birth outcome. Such pre-
pregnancy conditions are poorly measured in population-based data files, which results in down-
biased estimates of treatment effects.
Selection bias is only one challenge to identifying credible WIC effects. Others have
recognized the importance of gestational age bias (Devaney, Bilheimer and Schore, 1992;
Gordon and Nelson, 1995; Lazariu-Bauer et al., 2004). Women whose pregnancies last longer
have more opportunity to enroll in WIC. In other words, even if fetal and/or reproductive health
is randomly distributed among WIC participants, less healthy fetuses/women are more prone to
premature delivery. As a result, women who would have enrolled in the third trimester but
deliver prematurely may register for the program during the postpartum period instead. This can
generate a mechanical correlation between postpartum enrollment -- or a lack of prenatal
exposure to WIC -- and adverse birth outcomes.7
Approaches to selection bias
As with previous studies, we lack a convincing instrument for WIC participation. We
therefore focus on creating a comparison group that is as similar as possible to women exposed
to WIC prenatally. For instance, we will use women who enrolled in WIC postpartum to identify
the prenatal effects of WIC on maternal behavior and birth outcomes. One advantage of this
comparison group is that everyone is eligible for WIC and everyone participates. Stigma or
other barriers to participation in publicly funded nutrition programs are thus unlikely to be
factors in our analysis.
7 Jeffrey Harris (1982) referred to this as fetal selection.
12
Second, we have very large samples that enable us to stratify the analysis along key
dimensions. We will estimate separate models for non-Hispanic whites, non-Hispanic blacks,
and Hispanics. This considerably enhances the specification. The standard regression in the
literature pools all races and ethnicities and includes dichotomous indicators for each. Our
specification is equivalent to a fully interacted model by race and ethnicity. The difference is
important because treatment effects can vary substantially by race and ethnicity (Lazariu-Bauer
et al., 2004; Joyce, Gibson and Colman, 2005). We also analyze important subgroups whose
pre-pregnancy characteristics may put them at elevated risk for anemia, low weight gain and
intrauterine growth retardation. Examples include women whose pre-pregnancy body mass
index (BMI) is less than 19.8, women who smoked three months before pregnancy, and women
with multiple gestations (Rush, Stein and Susser, 1980; Institute of Medicine, 1996). Twinning
is a useful risk factor because, unlike smoking, it is exogenously assigned conditional on age (see
Joyce, Gibson and Colman, 2005).
Third, we estimate Equation (2) but further limit the sample to first births and early
initiators of prenatal care.8 As we show below, there is substantial variation in the timing of
WIC enrollment by trimester of prenatal care. The objective of the stratification by first births
and early care is to lessen potential heterogeneity among WIC enrollees. Few of the women in
this sub-sample will have enrolled in WIC in a prior pregnancy; this should lessen adverse
selection from women whose difficulties in a previous pregnancy motivated them to enroll in
WIC early. Fourth, we will use propensity score methods (PSM). Following Imbens (2004), we
8 Registration for prenatal care almost invariably precedes enrollment in WIC. In our data, 86 percent of women with no previous live births registered for prenatal care in the month prior to enrollment in WIC, 13 percent registered in the same month they enrolled in WIC and in only 1.3 percent of cases did WIC enrollment precede early prenatal care. These data are significant because Ludwig and Miller (2005) argue that WIC can affect birth outcomes by encouraging early enrollment in prenatal care. Thus, stratification by early prenatal care risks “over-controlling.” However, our data suggest this is highly unlikely given that registration for prenatal care precedes enrollment in WIC.
13
weight regressions by the propensity score associated with prenatal versus postpartum
enrollment in WIC.9 Weighting improves the balance of observed characteristics between
“treated” and “untreated” women. However, given that selection bias is likely driven by
unobservables, we view PSM as primarily a diagnostic and robustness check. Finally, we will
use specification and falsification checks as a means of flagging potential contamination from
omitted variable bias.10
Results
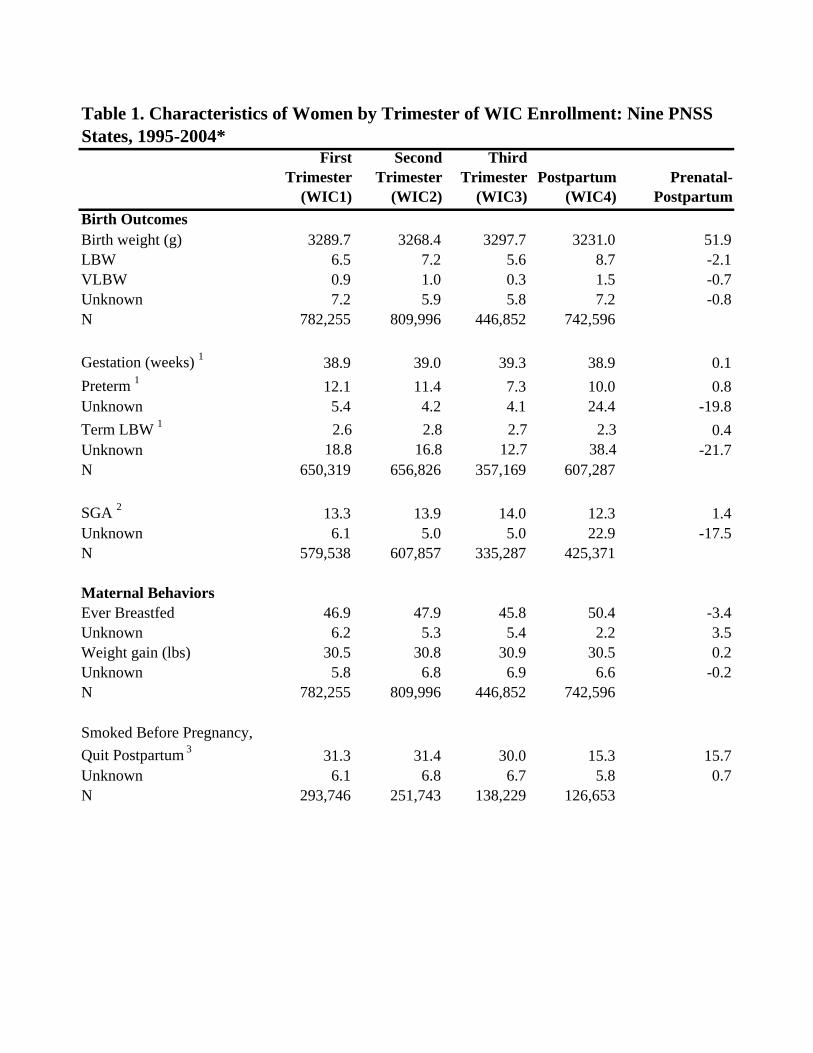
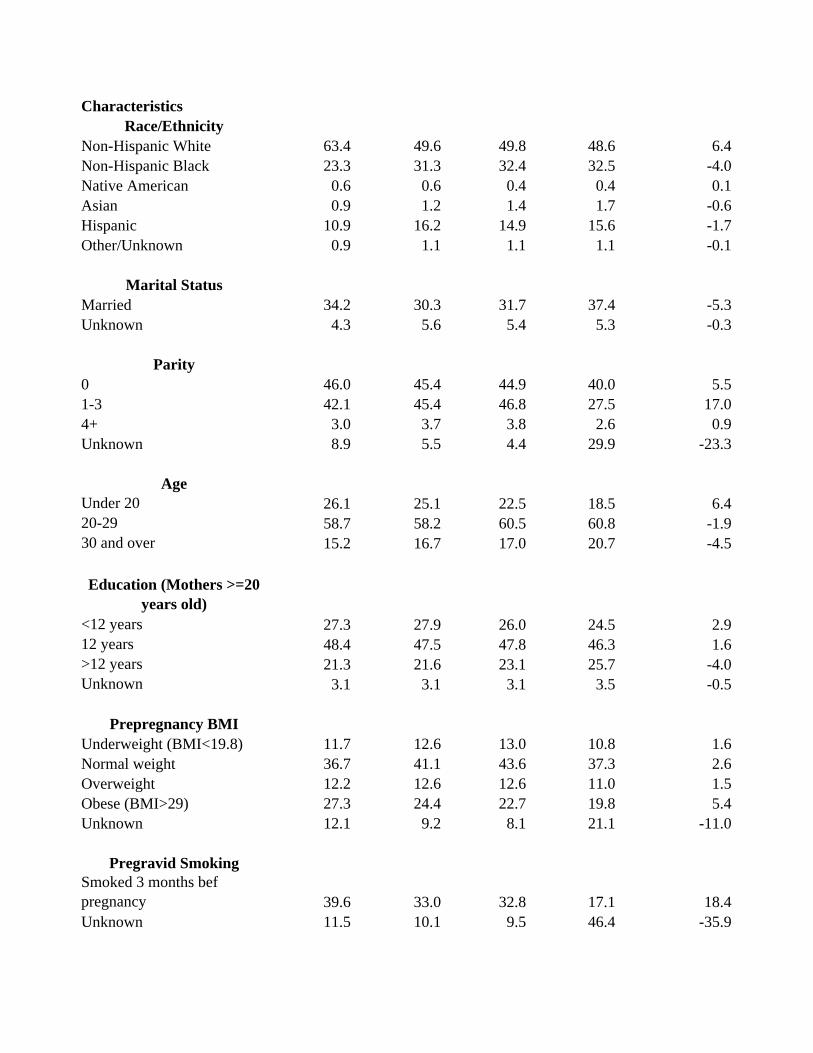
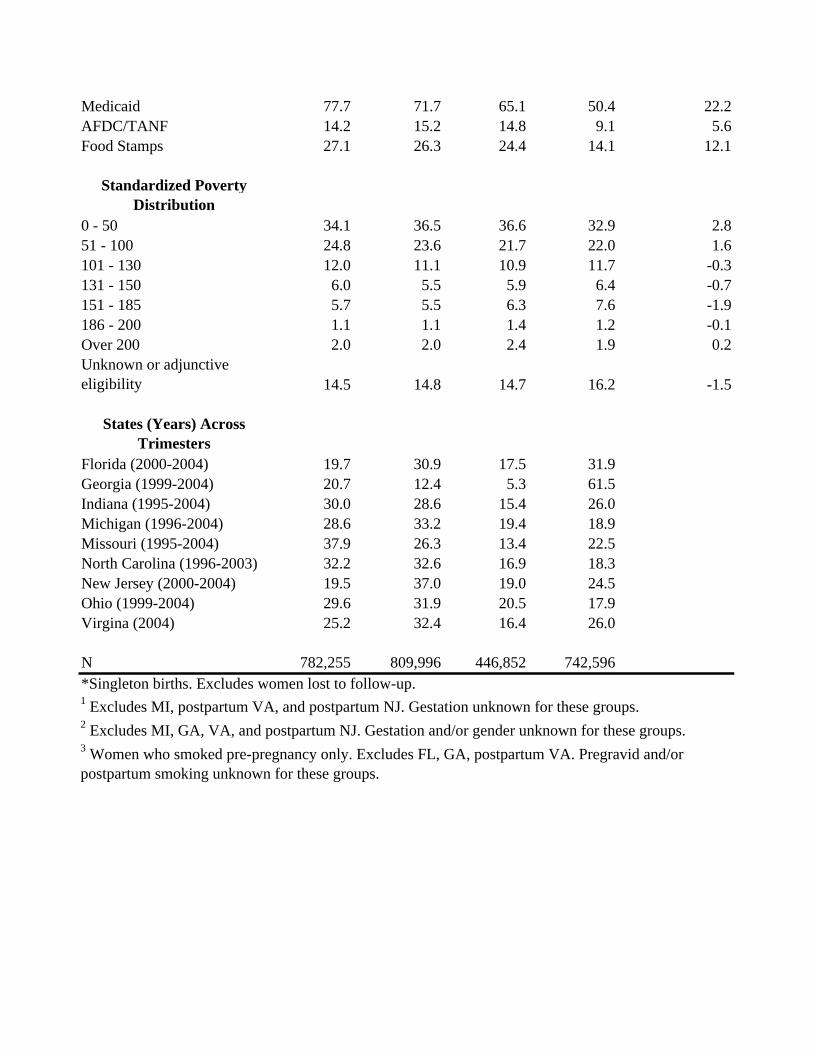
Characteristics of women by the timing of WIC enrollment for our nine-state sample are
shown in Table 1. The last column displays the differences between women who enroll during
pregnancy and women who do not enroll until postpartum. Given the number of observations,
almost all differences are statistically significant. In general, compared with postpartum
enrollees, women who enroll in WIC during pregnancy are more likely to be white non-
Hispanics, unmarried, teens, high school dropouts, on Medicaid and receiving food stamps
Differences by trimester of pregnancy among women who enrolled in WIC during pregnancy are
more muted. Table 1 also points out some limitations of the data. Smoking three months prior
to pregnancy is poorly reported among postpartum enrollees: in nearly half these cases, pregravid
9 Let PSi be the propensity score associated with the probability that a woman enrolls in WIC during pregnancy as compared with postpartum. The weight for all postpartum enrollees is [PSi/(1-PSi)] while the weight for prenatal enrollees is simply 1 (see Hirano and Imbens (2001) for an application). 10 For instance, Bitler and Currie (2005b) have argued that WIC may increase the likelihood that a woman stops or limits her smoking. If true, then WIC enrollment must precede changes in smoking. We can explicitly test this with the PNSS. At enrollment, women are asked if they smoke, and if so, whether they have reduced their smoking or quit altogether. One of the possible responses is, “Stopped smoking before my first prenatal care visit.” The clinical literature indicates that most pregnant smokers who quit do so when they realize that they are pregnant and are often referred to as “spontaneous quitters” (Quinn, Mullen and Ershoff, 1991; Sexton and Hebel, 1984; Secker-Walker et al., 1995; Windsor et al., 1993). We regress our measure of spontaneous quitting on the timing of WIC enrollment. Any association between the timing of WIC enrollment and spontaneous quitting is likely spurious, since quitting precedes enrollment. Similarly, if gestational age bias is present, then the likelihood of preterm birth should fall the longer a woman delays enrollment in WIC. This presumes, of course, that early enrollment in WIC is not protective against preterm birth. If WIC is protective, then our test is biased towards the null as the treatment effect of WIC works to offset the gains from fetal selection.
14

smoking is unknown. In addition, the percentage of postpartum enrollees in Georgia (62.2%) is
clearly greater than in other states.11 In analyzing smoking, we therefore limit the sample to
prenatal enrollees and include state and year fixed effects in all regressions. Finally, there are
substantially more missing observations for gestational age among postpartum enrollees than
there are among prenatal enrollees. This is a potential source of bias that we discuss in the
presentation of the results.
Appendix Table 1 indicates that the age and poverty distributions of the women in eight
of our states in 2000 are very similar to those reported by the USDA Food and Nutrition Service
(2000). However, we have proportionally more non-Hispanic blacks and fewer Hispanics. In
addition, women in our sample tend to enroll later in pregnancy. State-specific comparisons,
where available, are also reassuring in terms of mean weight gain, parity and birth weight (see
Appendix Table 2).
Replication of early work
In Table 2, we show adjusted differences in birth outcomes by the timing of WIC
enrollment. The even-numbered columns show estimates for all women on WIC. The odd-
numbered columns show estimates from the sub-sample of women who also were enrolled in
Medicaid at either the prenatal or postpartum interview. The latter is our attempt to replicate the
samples used by Devaney, Bilheimer and Schore (1992), Buescher and Horton (2000), Bitler
and Currie (2005a), and Joyce, Gibson and Colman (2005). The first row shows the estimates of
α1 from Equation (1), while the next three rows show estimates of α1, α2, and α3 from Equation
(2). We also display differences by trimester of enrollment. We use ordinary least squares for
11 We have spoken with officials in Georgia who are aware of the high number of enrollees but who feel it reflects the situation in the state.
15
continuous dependent variables and maximum likelihood probit for dichotomous outcomes.
The estimates in general are remarkably similar to those reported in the literature.
Prenatal participation in WIC is associated with an adjusted mean difference of 63 grams in birth
weight based on the sub-sample of women on Medicaid and WIC. This is the same estimate
obtained by Bitler and Currie (2005, Table 2). The results in Table 2 also indicate that prenatal
WIC participation is associated with decreases in the rates of low birth weight (2.7 percentage
points), very low birth weight (0.9 percentage point) and preterm birth (2.8 percentage points),
These represent declines of between 30 and 72 percent evaluated at the means of the respective
birth outcomes, or relative risks of between 0.70 and 0.27. Estimates from the sample of all
women on WIC regardless of Medicaid status are slightly smaller in absolute magnitude (even-
numbered columns). Given the similarity of the estimates between the two samples, we include
all women on WIC in succeeding tables but adjust for participation in Medicaid, TANF and the
Food Stamp Program.
Differences by trimester of WIC enrollment suggest a more complex story. Women who
enroll in the third trimester of pregnancy have higher mean birth weights and lower rates of low
birth weight, very low birth weight, and preterm birth compared with both postpartum and first-
trimester enrollees. Consider preterm birth. Women who delay enrollment into WIC until the
third trimester have rates of preterm birth that are 6.1 percentage points lower than postpartum
enrollees and 4.8 percentage points less than first-trimester enrollees.
Fetal selection and gestational age bias
As noted previously, the clinical literature has found no consistent reproducible
intervention that can prevent preterm birth (Institute of Medicine, 2007). It would therefore
16
seem implausible for WIC to be responsible for the very large differences in preterm birth
observed between prenatal and postpartum enrollees. In addition, we find the very large
differences in preterm birth between first and third-trimester WIC enrollees to be
counterintuitive. Early enrollment in WIC should be associated with more nutritional
supplementation, more health education and more timely referrals. An alternative hypothesis,
therefore, is that a large portion of the association between WIC and improved birth outcomes is
an artifact of fetal selection or what others have termed gestational age bias (Devaney, Bilheimer
and Schore, 1992; Gordon and Nelson, 1995). Women who carry into the third trimester have
healthier fetuses for reasons largely unrelated to WIC. They also have the opportunity to enroll
in WIC late in pregnancy, while their unenrolled counterparts who deliver prematurely do not.
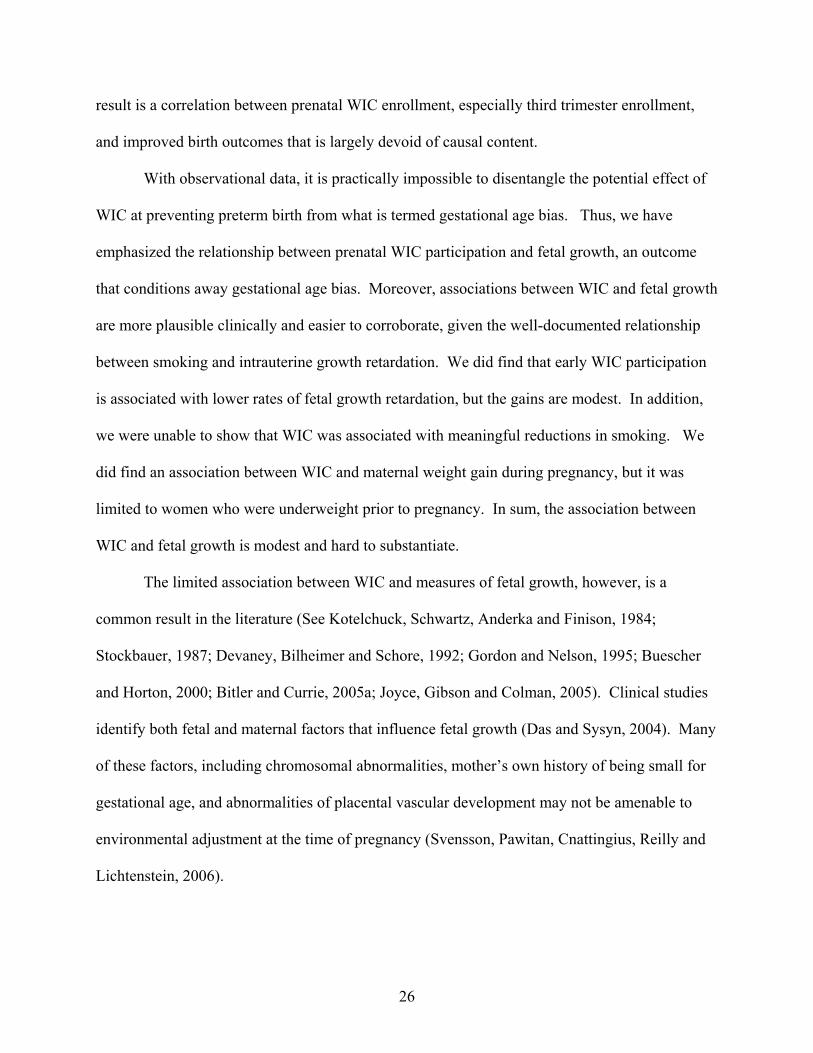
To illustrate, Figure 1 shows the rates of low birth weight and preterm birth by the week of
pregnancy in which women enrolled in WIC. The unadjusted rate of low birth weight among
women who enrolled in WIC in the 11th week of pregnancy is approximately 7 percent. The rate
climbs modestly to just under 8 percent by the 23rd week, after which it starts to decline. A
similar pattern is observed for preterm birth.12
As points of comparison, we have also included the mean rates of low birth weight and
preterm birth for all postpartum enrollees. The regression results in Tables 2 and 3 now become
clear. Women who enrolled in WIC at 33 weeks experienced, as a group, rates of premature
delivery of 8.6 percent, considerably below the 11.9 percent associated with women who
enrolled at 23 weeks. WIC participation cannot have been responsible for the prolongation of
their gestations to 33 weeks, since these women had not enrolled and so were unexposed to WIC
until then. Rather, these women’s gestations lasted long enough for them to still be in a
“prenatal state” at the time of their enrollment. Some women who would have enrolled in WIC 12 By definition the rate of preterm birth is zero by the 37th week of pregnancy.
17

at 33 weeks from the time of conception, but who had already delivered, are likely part of the
postpartum cohort. This is a possible explanation for why rates of low birth weight and preterm
birth are 10.8 and 14.0 percent, respectively, among postpartum enrollees. These are well in
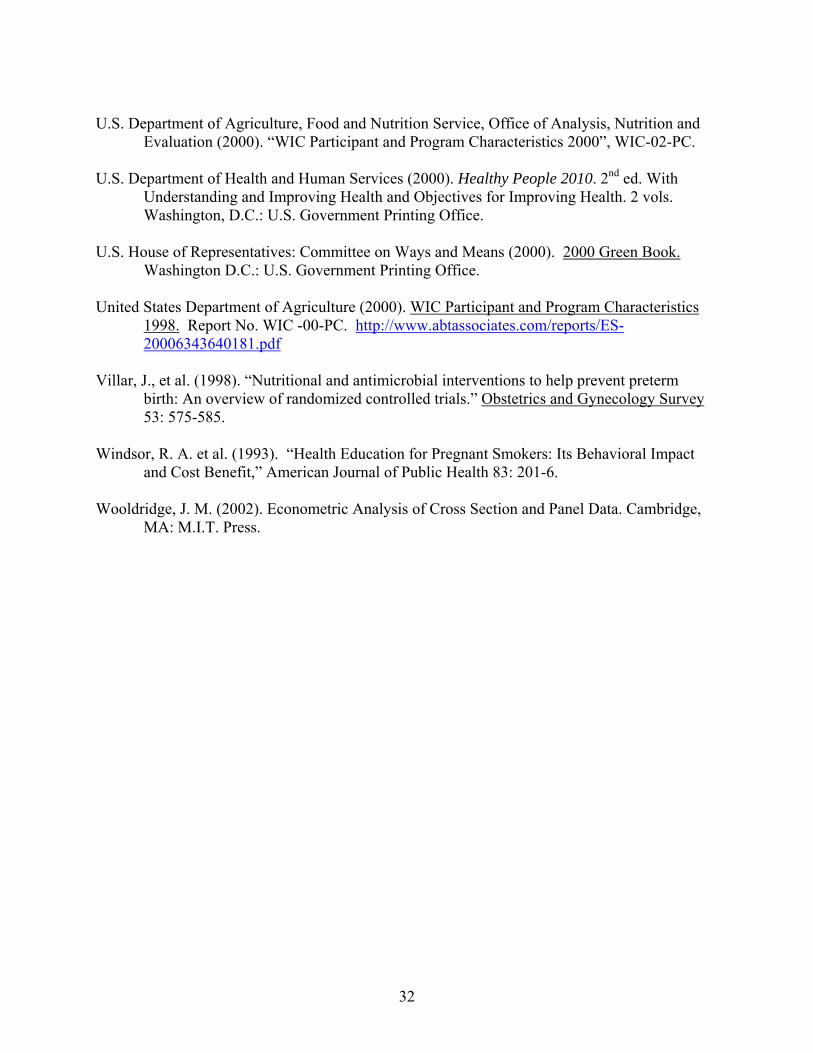
excess of the rates for prenatal enrollees at almost every week of enrollment. The pattern is even
more dramatic for very low birth weight and is consistent across race and ethnicity (Figure 2).
Very low birth weight is a well-measured proxy of extreme prematurity. Our conclusion is that
gestational age bias is impossible to eliminate in the analysis of outcomes that are directly
determined by the length of gestation. We turn, therefore, to the analysis of fetal growth and
outcomes that condition on gestational age.13
WIC and fetal growth
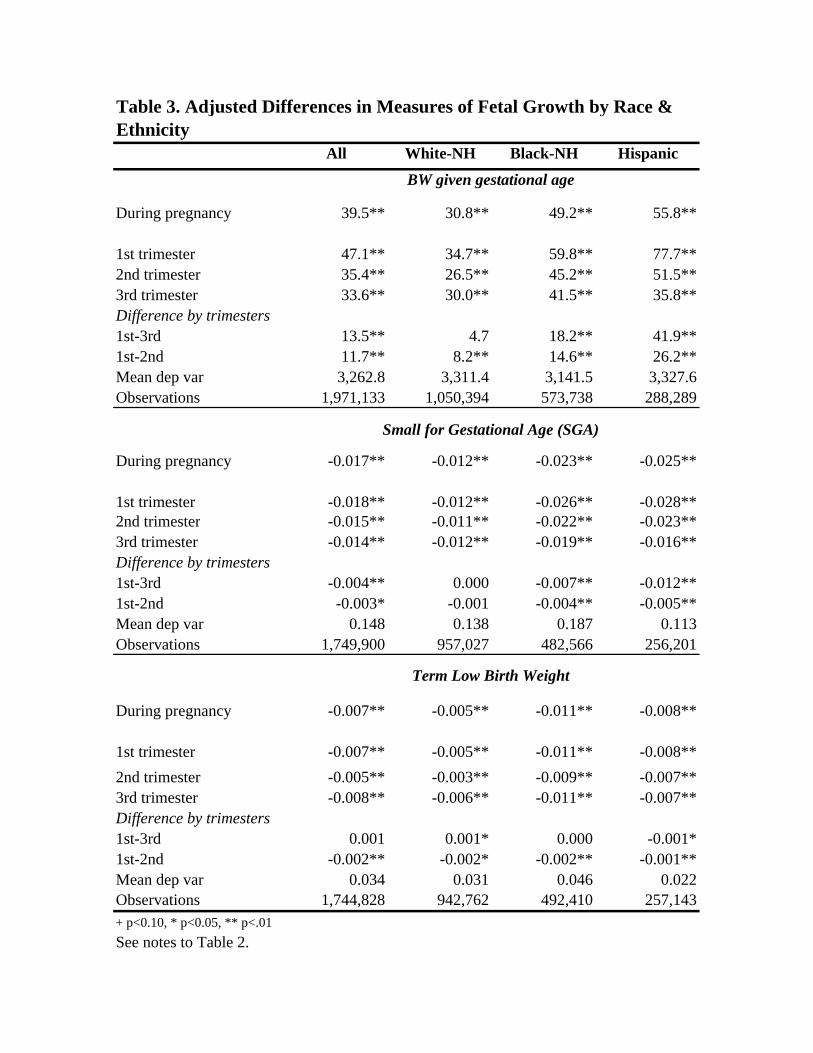
In Table 3 we show regression results for three measures of fetal growth: birth weight
adjusted for gestation, SGA, and term low birth weight. We show estimates for all women and
then by race and ethnicity. As in the previous tables, the first row in each panel shows adjusted
mean differences between prenatal and postpartum enrollees. The next three rows break down
the prenatal enrollees by trimester of enrollment. Differences between prenatal and postpartum
enrollees are substantive, consistent across race and ethnicity, and precisely estimated.
Specifically, mean birth weight, conditional on gestational age, is 40 grams greater among
13 One concern raised above is the disproportionate number of missing observations for gestational age among postpartum relative to prenatal WIC enrollees. However, we are confident that the missing are not a major factor in our estimates. First, the rate of low birth weight among postpartum enrollees with missing gestational age is 8.4 percent versus 9.0 percent among those with known gestational age. Second, birth weight is well-measured and 98 percent of all very low birth weight births are born preterm. Thus, our story is the same for VLBW as it is for preterm birth. Finally, the PNSS data for North Carolina are linked to birth certificates and less than 0.2 percent of cases are missing for either outcome. As we show below, the results for North Carolina (Table 6) also tell the same story as do the estimates from the larger sample in Tables 2 and 3.
18
prenatal as compared to postpartum enrollees; rates of SGA and term low birth weight are 1.7
and 0.7 percentage points less, respectively.
Differences by trimester of WIC enrollment are more modest, but unlike results for birth
outcomes unadjusted for gestation, earlier exposure to WIC is generally associated with better
outcomes. Thus, mean birth weight is 14 grams greater among women who enroll in the first
trimester relative to the third; similarly, the rates of SGA are modestly lower among first as
opposed to third-trimester enrollees.
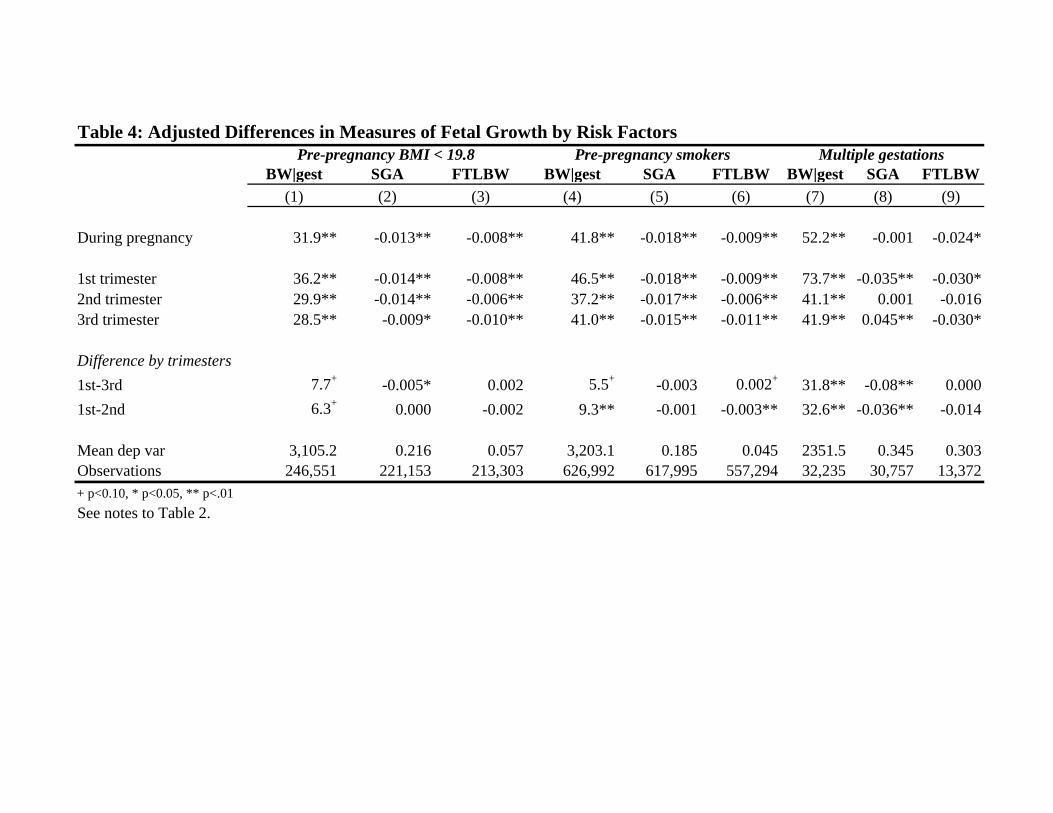
If WIC works, then we would expect women with potentially greater need for nutritional
supplementation and health education to benefit more from early and persistent participation in
WIC than women who receive less exposure during pregnancy or none at all. The next set of
results is for three subgroups of women at risk for fetal growth retardation (Table 4). These
include women who are underweight prior to pregnancy (BMI < 19.8), women who smoked
three months before pregnancy, and women who carry multiple gestations.14 The estimates are
similar to those in Table 3. There are substantial differences in outcomes between women who
enroll in WIC during pregnancy compared with women who enroll postpartum, but more
moderate gains between first and third-trimester enrollees. Adjusted mean birth weight is 7.7
grams greater among infants of underweight women who enroll in WIC in the first compared
with the third trimester.
Figure 3 offers another perspective on the rather modest association between the timing
of WIC enrollment and fetal growth. We show the rate of SGA and term low birth weight by the
week of prenatal enrollment in WIC. The difference between Figures 2 and 3 is stark. First,
14 See Joyce, Gibson and Colman (2005) for a discussion of why multiple gestations may be a particularly apt test of WIC’s effectiveness.
19
there is no apparent advantage to women who enrolled in the 33rd week of pregnancy relative to
women who enrolled in the 11th week.
The larger point from Figure 3 is that once you condition away fetal selection, the gains
to WIC appear modest. We based this assessment on two recent studies which use twin
deliveries in the US and Norway to analyze the effect of differences in birth weight—a direct
measure of fetal growth since twins are born simultaneously—on short and long-term outcomes.
Both studies find within-twin differences in fetal growth have relatively small effects on infant
mortality (Almond, Chay and Lee 2005; Black, Devereux and Salvanes, 2007). In Norway,
however, researchers are able to follow the twins into their 20s given the country’s detailed
registries (Black, Devereux and Salvanes, 2007). They find that a 280-gram increase in birth
weight is associated with a one percentage point increase in high school graduation, a one
percent increase in wages, and a 1.5 percent increase in the birth weight of the first-born child of
the twins. Our estimates of WIC’s effect on fetal growth are roughly one-tenth as large, which
suggests that the longer-term effects of WIC on schooling, labor market outcomes, and the birth
weight of offspring are likely to be small. It is possible that WIC has important effects on child
nutrition and immunization rates, but whatever these impacts, data from Norway suggest that it
takes very large gains in fetal growth to affect long-term outcomes that would be part of a
complete cost-benefit analysis.
Maternal health and behavior
The most consistent finding to this point has been the protective effect of prenatal
compared to postpartum WIC enrollment on birth outcomes. We believe that fetal selection
explains much of the association, but even when we adjust for gestational age, we report gains to
20

prenatal enrollment in WIC. We next test the association between prenatal WIC participation
and maternal health and behavior. If WIC improves fetal growth, then we are likely to find
associations between WIC and weight gain during pregnancy, smoking and breastfeeding. In
Table 5, we show adjusted differences in these three outcomes for all women and then stratify by
race and ethnicity. As in previous tables, we display differences between prenatal and
postpartum enrollees and then show differences by trimester of WIC enrollment.
Consider the results for breastfeeding among all women (column 1). Prenatal enrollees
are 2.6 percentage points more likely to have ever breastfed than postpartum enrollees. The
mean for all women is 50 percent. We also find meaningful differences by trimester of care.
Women who enroll in WIC in the first trimester are 3.9 percentage points more likely to have
ever breastfed than women who enrolled in WIC in the third trimester. We next display
differences in ever breastfed within race and ethnicity because the prevalence of breastfeeding
varies greatly among our three groups. For each racial and ethnic group, we find statistically
significant differences between prenatal and postpartum enrollees, as well as meaningful
differences by trimester of care.
The second set of estimates in Table 5 shows differences in smoking quit rates (columns
5-8). A woman is coded as having quit if she smoked three months before pregnancy but reports
not smoking when she recertifies for WIC postpartum.15 Note that we only include women who
enrolled in WIC during pregnancy. The omitted category is therefore third trimester enrollees.
As with breastfeeding, we show differences in quit rates for all women, and then separately by
15 We cannot evaluate whether WIC is associated with quitting during pregnancy because smoking is ascertained at the time of enrollment. Women who enroll in the first trimester have less opportunity to quit relative to women who enroll in the third trimester, which creates a potentially spurious relationship between delayed enrollment and higher quit rates. We use the absence of smoking at the postpartum interview, given that a woman smoked prior to pregnancy, as an alternative indicator of whether the smoking cessation message received earlier in pregnancy is associated with less maternal smoking.
21
race and ethnicity because the prevalence of pre-pregnancy smoking varies dramatically. For
instance, 53 percent of white non-Hispanic women who enrolled in WIC during pregnancy
smoked three months prior to conception compared with only 13 percent of Hispanics. The
association between early WIC enrollment and quitting is statistically significant but clinically
inconsequential.16 Quit rates are about one percentage point greater among early enrollees
relative to later enrollees, a relative change of less than 3 percent. Quit rates among whites are
even smaller, but those among blacks are greater.
The last set of estimates reflects differences in weight gain during pregnancy by the
timing of WIC enrollment (columns 9-12). We show results from two specifications—with and
without controls for gestational age—and two samples, all women and the sub-sample of
underweight women (pregravid BMI < 19.8). Among all women, late WIC enrollees gain more
weight, while first-trimester women gain less weight than postpartum women. After adjustment
for length of gestation, however, all groups of prenatal women have lower weight gains than
postpartum counterparts. Weight gain for underweight women is more robust. Prenatal
enrollees and those who enroll in the first trimester gain one pound more than postpartum
enrollees. When we adjust for gestation, the gains associated with first relative to third trimester
enrollment are a pound (1.02). Taken together, there is some evidence that early enrollment in
WIC is associated with changes in maternal behavior and health. The changes, like those
observed in fetal growth, are modest, and impossible to distinguish whether they result from
exposure to WIC or from favorable selection.
16 In the seminal trial of smoking cessation and birth weight, researchers found that quit rates of pregnant women in the treatment were 23 percentage points greater than women in the control group (Sexton and Hebel 1984). This decline was associated with a 92 gram increase in mean birth weight. The small differences in quit rates that we found would not be expected to affect birth outcomes in a meaningful manner. It should also be noted, however, that we are comparing first and second trimester WIC enrollees to those who enrolled in the third trimester and not to women who were unexposed to WIC during pregnancy.
22

We re-estimated the regressions of fetal growth and maternal behaviors using propensity
score weights and the results were largely unchanged. We limited our sample to only first births
and to only women who began prenatal care in the first trimesters. Differences in fetal growth
between prenatal and postpartum enrollees were more modest, but qualitatively the same (results
available upon request). We also found no association between spontaneous quitting of
smoking and early enrollment in WIC, a falsification test designed to flag potential selection bias
(see footnote 9).
Analysis of North Carolina
Another potential source of bias is that 13.3 percent of our sample was lost to follow up.
These are women who enrolled in WIC prenatally, but never re-enrolled postpartum. As noted
previously, the PNSS data from North Carolina have been linked to birth certificates, which
enable us to assess the likely impact of excluding these women. In Table 6 we re-estimate the
models from Tables 3 and 4. For each outcome we show estimates with and without women
lost to follow-up. We further limit the sample to women on Medicaid at the time of enrollment in
order to make our results more comparable to previous analyses of WIC with North Carolina
data.
The first point to note is that the estimated increase in mean birth weight and the decrease
in the rates of low birth weight and preterm birth among WIC participants in North Carolina are
greater in absolute value than the estimates obtained in all nine states. However, the pattern of
the results is very similar to those from the larger sample. The association between WIC and
adverse birth outcomes is primarily driven by the association between WIC and preterm birth.
23
Once we condition on gestational age, the association between WIC and fetal growth becomes
more modest.
The second point about Table 6 is that estimates based on samples that include women
lost to follow-up are almost identical to the estimates based on samples that exclude these
women. Women lost to follow-up have worse birth outcomes (unadjusted) than women who
participate in WIC before and after pregnancy.17 If the results from North Carolina generalize to
the larger sample, then the exclusion of women lost to follow up is unlikely to change the
estimates in Tables 2 and 3 appreciably. The third point is that our estimates are close to those of
Devaney, Bilheimer and Schore (1992), Buescher et al. (1993) and Buescher and Horton (2000).
In each study, authors analyzed linkages of WIC administrative and Medicaid claims data in
1987, 1988 and 1997, respectively. Devaney, Bilheimer and Schore report that prenatal WIC
participation was associated with a 117-gram increase in mean birth weight and a decline of 5.1
and 5.4 percentage points in low birth weight and preterm birth, respectively.18 Moreover, the
estimated effects of WIC on these outcomes in North Carolina as reported by Devaney,
Bilheimer and Schore (1992) were almost double those for Florida, Minnesota and Texas, three
other states in their analysis. The similarity of our estimates for North Carolina based on the
PNSS to those from studies that used linkages of WIC administrative data with Medicaid claims
files suggests that our reference group--postpartum WIC enrollees--is likely comparable to the
reference group used in those studies: women on Medicaid who did not participate in WIC
during pregnancy. 17 The rates of low birth weight and very low birth weight are 12.3 and 4.6 percent, respectively, among those lost to follow up versus 7.9 and 1.3 percent among women who enrolled prenatally and re-certified postpartum and 11.6 percent and 2.7 percent among those who enrolled postpartum. 18 If we estimate the models in Table 6 using only the individual-level data as did Devaney, Bilheimer and Shore (1992), then our estimate for North Carolina are even closer to theirs. Similarly, Buescher and Horton (2000) reported an adjusted odds ratio of 1.36 and 1.90 for low and very low birth weight, respectively, based on 1997 data. We estimated a similar specification based on our PNSS data for 1997 and obtained an adjusted OR of 1.41 and 1.93 for low birth weight and very low birth weight, respectively.
24
Finally, we show the association between WIC participation and smoking during
pregnancy (Table 6, last column). The smoking indicator is based on birth certificates, which
tend to underreport smoking prevalence. However, the smoking screen on birth certificates is
available for all women and unlike the prenatal smoking indicator in PNSS does not depend on
when the women enrolled in WIC. The estimates indicate that the adjusted mean prevalence of
smoking during pregnancy among women who enroll in WIC prenatally is greater than those
who enroll postpartum, but differs by less than a percentage point.
Conclusions
The causes of preterm birth have baffled clinicians for several decades as few
interventions have proven to be protective. Despite pessimism among clinicians, social
scientists have reported strong associations between participation in WIC and lower rates of
preterm birth. A recent conjecture for the discrepancy between clinical and social research is
that WIC represents a multifaceted approach to preterm birth that clinical trials neglect in their
focus on a single factor (Bitler and Currie, 2005b; Ludwig and Miller, 2005).
This study uses data on the timing of WIC enrollment to correct limitations in previous
observational studies. We are able to replicate the strong protective association between
prenatal WIC participation and preterm birth frequently reported by social scientists (GAO, 1992;
Bitler and Currie, 2005a). We conclude that the association is largely an artifact. We show that
the rates of low and very low birth weight decline dramatically for women who enroll in WIC
later in pregnancy relative to women who enroll in the first trimester. At the same time, preterm
delivery postpones enrollment for some women from the prenatal to the postpartum period. The
25
result is a correlation between prenatal WIC enrollment, especially third trimester enrollment,
and improved birth outcomes that is largely devoid of causal content.
With observational data, it is practically impossible to disentangle the potential effect of
WIC at preventing preterm birth from what is termed gestational age bias. Thus, we have
emphasized the relationship between prenatal WIC participation and fetal growth, an outcome
that conditions away gestational age bias. Moreover, associations between WIC and fetal growth
are more plausible clinically and easier to corroborate, given the well-documented relationship
between smoking and intrauterine growth retardation. We did find that early WIC participation
is associated with lower rates of fetal growth retardation, but the gains are modest. In addition,
we were unable to show that WIC was associated with meaningful reductions in smoking. We
did find an association between WIC and maternal weight gain during pregnancy, but it was
limited to women who were underweight prior to pregnancy. In sum, the association between
WIC and fetal growth is modest and hard to substantiate.
The limited association between WIC and measures of fetal growth, however, is a
common result in the literature (See Kotelchuck, Schwartz, Anderka and Finison, 1984;
Stockbauer, 1987; Devaney, Bilheimer and Schore, 1992; Gordon and Nelson, 1995; Buescher
and Horton, 2000; Bitler and Currie, 2005a; Joyce, Gibson and Colman, 2005). Clinical studies
identify both fetal and maternal factors that influence fetal growth (Das and Sysyn, 2004). Many
of these factors, including chromosomal abnormalities, mother’s own history of being small for
gestational age, and abnormalities of placental vascular development may not be amenable to
environmental adjustment at the time of pregnancy (Svensson, Pawitan, Cnattingius, Reilly and
Lichtenstein, 2006).
26

In the end, we conclude that WIC may work to improve birth outcomes, but on fewer
margins and with less impact than has been claimed by policy analysts and advocates. These
findings do not constitute an argument for the elimination of WIC; instead, they indicate the need
for greater emphasis and resources to be devoted to aspects of the WIC program that target either
life-long habits such as smoking, or behaviors with known benefits to mother and child such as
breastfeeding, iron supplementation for infants, and childhood immunizations.
27

Acknowledgements
The research was supported by grants from the Institute for Research on Poverty and
United States Department of Agriculture (IRP-USDA) Small Grants program to Baruch College
and from the USDA Food and Nutrition Research Program to the National Bureau of Economic
Research (# 59-5000-6-0102). We thank participants at the Small Grant Conference at the
University of Wisconsin and the Small Grant conference at USDA Economic Research Service
in Washington D.C. We thank Karen Dalenius from the Centers for Disease Control and
Prevention (CDC) for help with the PNSS file and special thanks to WIC Program administrators
in various state offices. These include Najmul Chowdhury (North Carolina), Patrice Wolfla
(Indiana), Nancy Hoffman (Missouri), Penny Roth (Illinois) and Lisa Armstrong (Virginia). We
would also like to acknowledge input from John Karl Scholz at the University of Wisconsin and
Jay Hirschman at the USDA Food and Nutrition Bureau and three anonymous referees. All
opinions are those of the authors and do not represent those of the various state WIC programs,
the CDC or the USDA.
28

References
Ahluwalia, I. B., Hogan, V. K., Grummer-Strawn, L., Colville, W. R. and A. Peterson (1998). “The Effect of WIC Participation on Small-for-Gestational-Age Births: Michigan, 1992.” American Journal of Public Health 88(9): 1374-1377.
Almond, Doug, Chay, Kenneth and David Lee (2005). “The Costs of Low Birth Weight.”
Quarterly Journal of Economics CXX(3):1031-1083. Alexander, G. et al. (1998). “What are the Fetal Growth Patterns of Singleton, Twins and
Triplets in the United States?” Clinical Obstetrics and Gynecology 41 (1): 115-125. Berkowitz, G.S. and E. Papiernik (1993). “Epidemiology of preterm birth.” Epidemiologic
Review 15(2): 414-443. Besharov, D. J. and P. Germanis (2001). Rethinking WIC: An Evaluation of the Women, Infants,
and Children Program. Washington, DC: American Enterprise Institute. Bitler, Marianne, Currie, Janet and John Karl Scholz (2003). “ WIC Eligibility and
Participation.” The Journal of Human Resources 38(Supplement): 1139-1179. Bitler, Marianne and Janet Currie (2005a). “Does WIC Work? The Effects of WIC on
Pregnancy and Birth Outcomes.” Journal of Policy Analysis and Management 24(1):73-91.
Bitler, Marianne and Janet Currie (2005b). “The Changing Association between Prenatal
Participation in WIC and Birth Outcomes in New York City: What Does It Mean?” Journal of Policy Analysis and Management 24(4):688-690.
Black, Sandra, Devereux, Paul, and Kjell Salvanes (2007). “From the Cradle to the Labor Market? The Effect of Birth Weight on Adult Outcomes.” Quarterly Journal of Economics CXXII (1): 409-439. Buescher, Paul A. and Stephanie J. Horton (2000). “Prenatal WIC Participation in Relation to
Low Birth Weight and Medicaid Infant Costs in North Carolina—a 1997 Update.” Center for Health Information and Statistics, North Carolina Department of Health and Human Services.
Buescher, Paul A., et al. (1993). “Prenatal WIC participation can reduce low birth weight and
newborn medical costs: A cost-benefit analysis of WIC participation in North Carolina.” Journal of the American Dietetic Association 93(2): 163-166.
Das, U.G. and G.D. Sysyn (2004). “Abnormal fetal growth: intrauterine growth retardation,
small for gestational age, large for gestational age.” Pediatric Clinics of North America 51: 639-654.
29

Devaney, B., Bilheimer, L. and J. Schore (1992). “Medicaid Costs and Birth Outcomes: The Effects of Prenatal WIC Participation and the Use of Prenatal Care.” Journal of Policy Analysis and Management 11(4): 573-592.
Fox, M.K, Hamilton, W. and B. Lin (eds.) (2004). Effects of Food Assistance and Nutrtion
Programs on Nutrition and Health Volume 3, Literature Review. Food and Rural Economics Division, Economic Research Service, U.S. Department of Agriculture, Food Assistance and Nutrition Research Report No. 19-3. Available at:
http://www.ers.usda.gov/publications/fanrr19%2D3/. General Accounting Office (1992). “Early Intervention: Federal Investments Like WIC Can
Produce Savings” (GAO/HRD-92-18). Washington DC: United States General Accounting Office.
Gordon, Anne and Lyle Nelson (1995). “Characteristics and Outcomes of WIC Participants and
Non-participants: Analysis of the 1988 National Maternal and Infant Health Survey.” Princeton: Mathematica Policy Institute.
Harris, Jeffrey (1982). “Prenatal Medical Care and Infant Mortality.” In V. Fuchs (ed.),
Economic Aspects of Health Chicago: University of Chicago Press. Heckman, J. (1997). “Instrumental Variables.” Journal of Human Resources. 32(3):441-462. Hirano, Keisuke and Guido Imbens (2001). “Estimation of Causal Effects using Propensity Score Weighting: An Application to Data on Right Heart Catheterization.” Health Services & Outcomes Research Methodology 2:259-278. Imbens, Guido (2004). “Nonparametric Estimation of Average Treatment Effects Under
Exogeneity: A Review.” Review of Economics and Statistics. 86(1):4-29. Institute of Medicine (1990). Nutrition During Pregnancy. Washington, D.C: National Academy
Press. Institute of Medicine (1996). WIC Nutrition Risk Criteria: A Scientific Assessment. Washington,
D.C: National Academy Press. Institute of Medicine (2007). Preterm Birth: Causes, Consequences and Prevention. Washington,
D.C: National Academy Press. Joyce, T., Gibson, D. and S. Colman (2005). “The Changing Association between Prenatal
Participation in WIC and Birth Outcomes in New York City.” Journal of Policy Analysis and Management 24(4):661-685.
Kennedy, E.T. and M. Kotelchuck (1984). “The effect of WIC supplemental feeding on birth
weight: a case-control analysis.” American Journal of Clinical Nutrition 40:579-585.
30

Klerman, L. et al. (2001). “A Randomized Trial of Augmented Prenatal Care for Multiple-Risk, Medicaid-Eligible African American Women.” American Journal of Public Health 91(1):105-111.
Kotelchuck, M. et al. (1984). “WIC Participation and Pregnancy Outcomes: Massachusetts
Statewide Evaluation Project.” American Journal of Public Health 74(10):1086-1092. Kramer, M. (1987). “Intrauterine Growth and Gestational Duration Determinants.” Pediatrics
80(4): 502-511. Lazariu-Bauer, V., Stratton, H., Pruzek, R., and M.L. Woelfel (2004). “A Comparative Analysis of Effects of Early Versus Late Prenatal WIC Participation on Birth Weight: NYS, 1995.” Maternal and Child Health Journal 8(2): 77-86. Ludwig, J. and M. Miller (2005). “ Interpreting the WIC Debate.” Journal of Policy Analysis
and Management 24(4):691-701. Quinn, V., Mullen, P. and D. Ershoff (1991). “Women Who Stop Smoking Spontaneously Prior to Prenatal Care and Predictors of Relapse Before Delivery.” Addictive Behavior 16:29- 40. Rush, David, Stein, Zena and Mervyn Susser (1980). Diet in Pregnancy: A Randomized
Controlled Trial of Nutritional Supplements. New York: Alan R. Liss, Inc. Schramm, W. F. (1985). “WIC Prenatal Participation and Its Relationship to Newborn
Medicaid Costs in Missouri: A Cost/Benefit Analysis.” American Journal of Public Health 75(8): 851-857.
Schramm, W. F. (1986). “Prenatal Participation in WIC Related to Medicaid Costs for Missouri
Newborns: 1982 Update.” Public Health Reports 101(6): 607-615. Secker-Walker, R. H. et al. (1995). “Smoking Relapse Prevention Counseling During Prenatal
and Early Postnatal Care,” American Journal of Preventive Medicine 11: 86-93. Sexton, M. and R. H. Hebel (1984). “A Clinical Trial of Change in Maternal Smoking and Its
Effect on Birth Weight,” Journal of the American Medical Association 251(7): 911-915. Stockbauer, J. (1986). “Evaluation of the Missouri WIC Program: Prenatal Components.”
Journal of the American Dietetic Association 86: 61-67. Stockbauer, J. W. (1987). “WIC Prenatal Participation and Its Relation to Pregnancy Outcomes
in Missouri: A Second Look.” American Journal of Public Health 77(7): 813-818. Svensson, A.C., Pawitan, Y., Cnattingius, S., Reilly, M. and P. Lichtenstein (2006). “Familial
aggregation of small-for-gestational-age births: The importance of fetal genetic effects.” American Journal of Obstetrics and Gynecology 194: 475-9.
31
U.S. Department of Agriculture, Food and Nutrition Service, Office of Analysis, Nutrition and
Evaluation (2000). “WIC Participant and Program Characteristics 2000”, WIC-02-PC. U.S. Department of Health and Human Services (2000). Healthy People 2010. 2nd ed. With
Understanding and Improving Health and Objectives for Improving Health. 2 vols. Washington, D.C.: U.S. Government Printing Office.
U.S. House of Representatives: Committee on Ways and Means (2000). 2000 Green Book.
Washington D.C.: U.S. Government Printing Office. United States Department of Agriculture (2000). WIC Participant and Program Characteristics
1998. Report No. WIC -00-PC. http://www.abtassociates.com/reports/ES-20006343640181.pdf
Villar, J., et al. (1998). “Nutritional and antimicrobial interventions to help prevent preterm birth: An overview of randomized controlled trials.” Obstetrics and Gynecology Survey 53: 575-585.
Windsor, R. A. et al. (1993). “Health Education for Pregnant Smokers: Its Behavioral Impact
and Cost Benefit,” American Journal of Public Health 83: 201-6. Wooldridge, J. M. (2002). Econometric Analysis of Cross Section and Panel Data. Cambridge,
MA: M.I.T. Press.
32
Figure 1: Proportion of LBW and Preterm Births by Timing of WIC Enrollment
0
0.02
0.04
0.06
0.08
0.1
0.12
0.14
0.16
0.18
5 7 9 11 13 15 17 19 21 23 25 27 29 31 33 35 37 39
Week of Pregnancy at WIC Enrollment
Prop
ortio
n L
BW
/Pre
term
Preterm LBW
mean pretermpostpartum enrollees
mean LBW postpartumenrollees
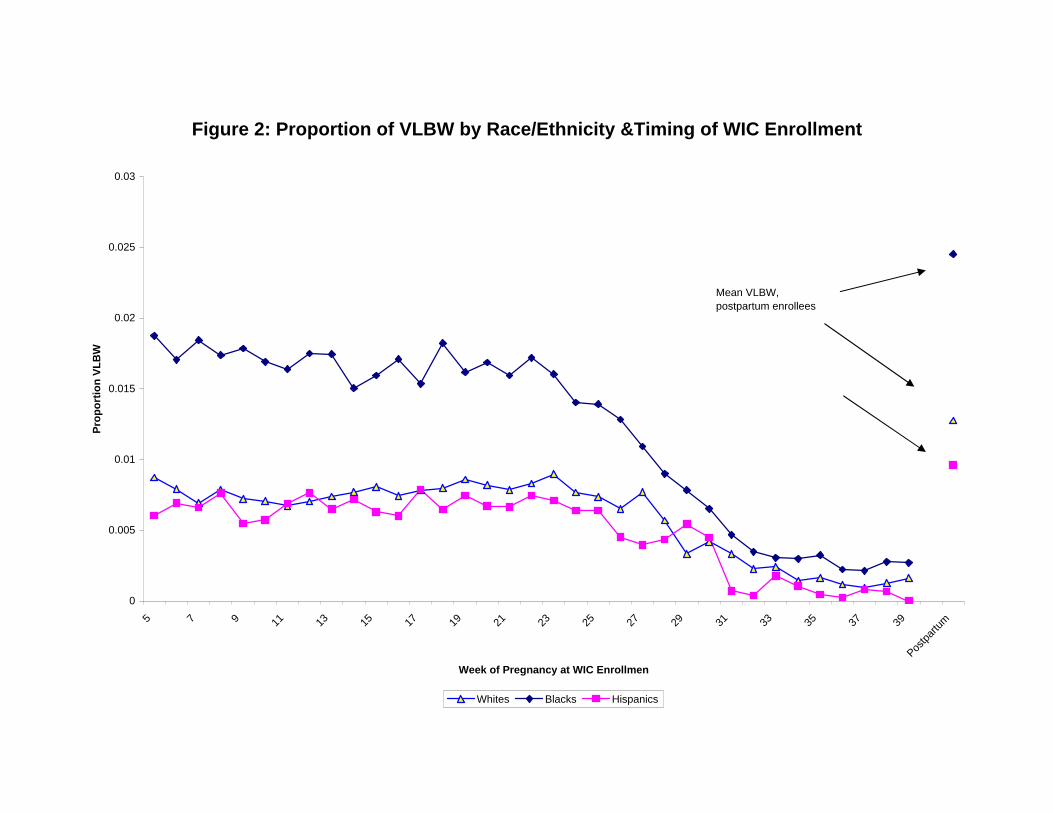
Figure 2: Proportion of VLBW by Race/Ethnicity &Timing of WIC Enrollment
0
0.005
0.01
0.015
0.02
0.025
0.03
5 7 9 11 13 15 17 19 21 23 25 27 29 31 33 35 37 39Pos
tpartu
m
Week of Pregnancy at WIC Enrollmen
Prop
ortio
n VL
BW
Whites Blacks Hispanics
Mean VLBW, postpartum enrollees
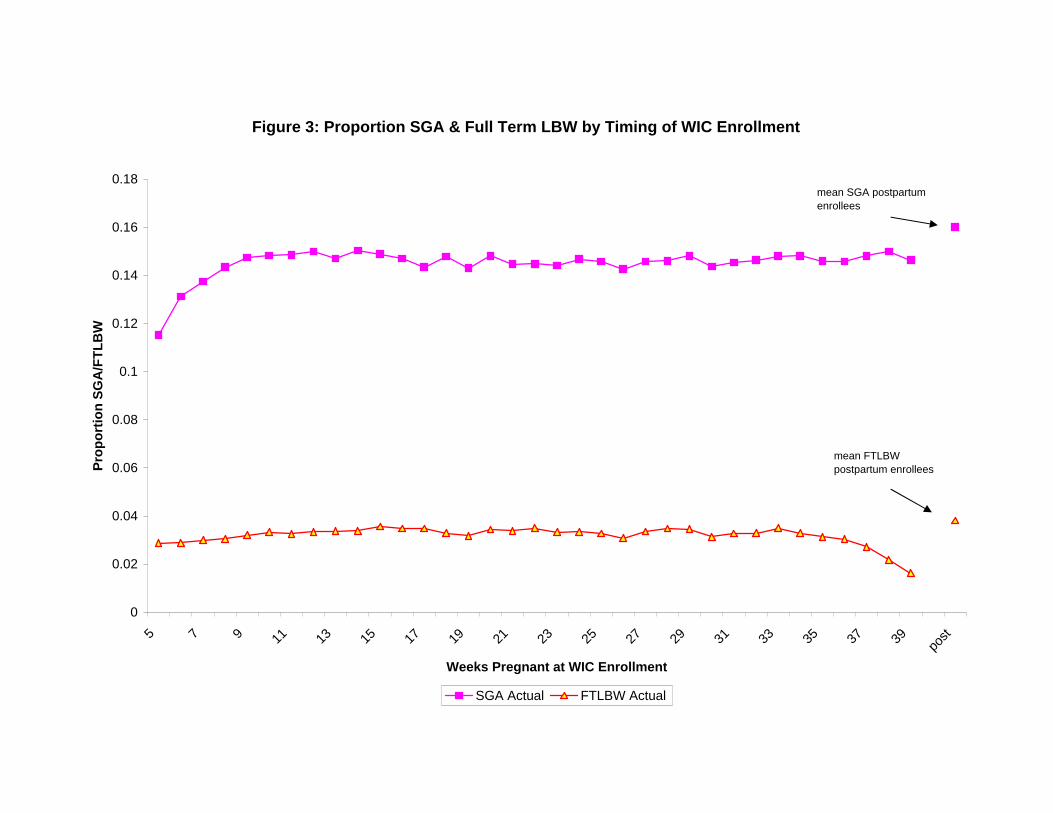
Figure 3: Proportion SGA & Full Term LBW by Timing of WIC Enrollment
0
0.02
0.04
0.06
0.08
0.1
0.12
0.14
0.16
0.18
5 7 9 11 13 15 17 19 21 23 25 27 29 31 33 35 37 39 post
Weeks Pregnant at WIC Enrollment
Prop
ortio
n SG
A/F
TLB
W
SGA Actual FTLBW Actual
mean SGA postpartumenrollees
mean FTLBW postpartum enrollees
First Trimester
(WIC1)
Second Trimester
(WIC2)
Third Trimester
(WIC3)Postpartum
(WIC4)Prenatal-
PostpartumBirth OutcomesBirth weight (g) 3289.7 3268.4 3297.7 3231.0 51.9LBW 6.5 7.2 5.6 8.7 -2.1VLBW 0.9 1.0 0.3 1.5 -0.7Unknown 7.2 5.9 5.8 7.2 -0.8N 782,255 809,996 446,852 742,596
Gestation (weeks) 1 38.9 39.0 39.3 38.9 0.1Preterm 1 12.1 11.4 7.3 10.0 0.8Unknown 5.4 4.2 4.1 24.4 -19.8Term LBW 1 2.6 2.8 2.7 2.3 0.4Unknown 18.8 16.8 12.7 38.4 -21.7N 650,319 656,826 357,169 607,287
SGA 2 13.3 13.9 14.0 12.3 1.4Unknown 6.1 5.0 5.0 22.9 -17.5N 579,538 607,857 335,287 425,371
Maternal BehaviorsEver Breastfed 46.9 47.9 45.8 50.4 -3.4Unknown 6.2 5.3 5.4 2.2 3.5Weight gain (lbs) 30.5 30.8 30.9 30.5 0.2Unknown 5.8 6.8 6.9 6.6 -0.2N 782,255 809,996 446,852 742,596
Smoked Before Pregnancy, Quit Postpartum 3 31.3 31.4 30.0 15.3 15.7Unknown 6.1 6.8 6.7 5.8 0.7N 293,746 251,743 138,229 126,653
Table 1. Characteristics of Women by Trimester of WIC Enrollment: Nine PNSS States, 1995-2004*
CharacteristicsRace/Ethnicity
Non-Hispanic White 63.4 49.6 49.8 48.6 6.4Non-Hispanic Black 23.3 31.3 32.4 32.5 -4.0Native American 0.6 0.6 0.4 0.4 0.1Asian 0.9 1.2 1.4 1.7 -0.6Hispanic 10.9 16.2 14.9 15.6 -1.7Other/Unknown 0.9 1.1 1.1 1.1 -0.1
Marital StatusMarried 34.2 30.3 31.7 37.4 -5.3Unknown 4.3 5.6 5.4 5.3 -0.3
Parity0 46.0 45.4 44.9 40.0 5.51-3 42.1 45.4 46.8 27.5 17.04+ 3.0 3.7 3.8 2.6 0.9Unknown 8.9 5.5 4.4 29.9 -23.3
AgeUnder 20 26.1 25.1 22.5 18.5 6.420-29 58.7 58.2 60.5 60.8 -1.930 and over 15.2 16.7 17.0 20.7 -4.5
Education (Mothers >=20 years old)
<12 years 27.3 27.9 26.0 24.5 2.912 years 48.4 47.5 47.8 46.3 1.6>12 years 21.3 21.6 23.1 25.7 -4.0Unknown 3.1 3.1 3.1 3.5 -0.5
Prepregnancy BMIUnderweight (BMI<19.8) 11.7 12.6 13.0 10.8 1.6Normal weight 36.7 41.1 43.6 37.3 2.6Overweight 12.2 12.6 12.6 11.0 1.5Obese (BMI>29) 27.3 24.4 22.7 19.8 5.4Unknown 12.1 9.2 8.1 21.1 -11.0
Pregravid SmokingSmoked 3 months bef pregnancy 39.6 33.0 32.8 17.1 18.4Unknown 11.5 10.1 9.5 46.4 -35.9
Medicaid 77.7 71.7 65.1 50.4 22.2AFDC/TANF 14.2 15.2 14.8 9.1 5.6Food Stamps 27.1 26.3 24.4 14.1 12.1
Standardized Poverty Distribution
0 - 50 34.1 36.5 36.6 32.9 2.851 - 100 24.8 23.6 21.7 22.0 1.6101 - 130 12.0 11.1 10.9 11.7 -0.3131 - 150 6.0 5.5 5.9 6.4 -0.7151 - 185 5.7 5.5 6.3 7.6 -1.9186 - 200 1.1 1.1 1.4 1.2 -0.1Over 200 2.0 2.0 2.4 1.9 0.2Unknown or adjunctive eligibility 14.5 14.8 14.7 16.2 -1.5
States (Years) Across Trimesters
Florida (2000-2004) 19.7 30.9 17.5 31.9Georgia (1999-2004) 20.7 12.4 5.3 61.5Indiana (1995-2004) 30.0 28.6 15.4 26.0Michigan (1996-2004) 28.6 33.2 19.4 18.9Missouri (1995-2004) 37.9 26.3 13.4 22.5North Carolina (1996-2003) 32.2 32.6 16.9 18.3New Jersey (2000-2004) 19.5 37.0 19.0 24.5Ohio (1999-2004) 29.6 31.9 20.5 17.9Virgina (2004) 25.2 32.4 16.4 26.0
N 782,255 809,996 446,852 742,596*Singleton births. Excludes women lost to follow-up. 1 Excludes MI, postpartum VA, and postpartum NJ. Gestation unknown for these groups. 2 Excludes MI, GA, VA, and postpartum NJ. Gestation and/or gender unknown for these groups.3 Women who smoked pre-pregnancy only. Excludes FL, GA, postpartum VA. Pregravid and/or postpartum smoking unknown for these groups.

(1) (2) (3) (4) (5) (6) (7) (8)Enrolled in WIC…During pregnancy 63.3** 59.4** -0.027** -0.026** -0.009** -0.008** -0.027** -0.025**
1st trimester 60.2** 55.5** -0.023** -0.021** -0.005** -0.005** -0.013** -0.009**2nd trimester 55.6** 51.3** -0.019** -0.018** -0.005** -0.004** -0.021** -0.018**3rd trimester 85.4** 79.9** -0.034** -0.032** -0.009** -0.009** -0.060** -0.056**
Difference by trimesters1st-3rd -25.2** -24.4** 0.011** 0.011** 0.004** 0.004** 0.047** 0.047**1st-2nd 4.7 4.3 -0.004* -0.003** 0.000 0.000 0.008** 0.009**
Medicaid only Yes No Yes No Yes No Yes NoMean dep var 3,250.4 3,268.9 0.080 0.077 0.011 0.011 0.118 0.115Observations 1,712,216 2,571,723 1,712,216 2,571,723 1,712,216 2,571,723 1,374,239 2,025,047
R-squared 0.05 0.05
+ p<0.10, * p<0.05, ** p<.01Estimates show the difference in birth outcomes based on the timing of WIC enrollment. Estimates for birth weight (BW) are from ordinary least squares. Estimates for low birth weight (LBW), very low birth weight (VLBW) and preterm birth are marginal effects obtained by maximum likelihood probits. Standard errors (not shown) are adjusted for grouping at the state-year level (G=60) with Stata's cluster procedure. Estimates in the top row of each panel compare outcomes among women who enrolled in WIC during pregnancy to women who enolled in WIC postpartum. Estimates in the next three rows compare outcomes among women who enrolled in WIC in either the first, second or third trimester of pregnancy relative to women who enrolled in WIC postpartum; differences between trimesters follow. Estimates are adjusted for age, marital status, mother's schooling, parity, pre-pregnancy BMI, income categories, participation in Medicaid, AFDC and the Food Stamp Program. All models include state and year fixed effects. The samples in odd-numbered columns include all women in WIC whereas the even numbered columns include only women who were also on Medicaid. Data are from 9 states and various years. See Table 1.
Table 2. Adjusted Differences in Birth Outcomes by the Timing of WIC Enrollment
BW LBW VLBW Preterm
All White-NH Black-NH Hispanic
During pregnancy 39.5** 30.8** 49.2** 55.8**
1st trimester 47.1** 34.7** 59.8** 77.7**2nd trimester 35.4** 26.5** 45.2** 51.5**3rd trimester 33.6** 30.0** 41.5** 35.8**Difference by trimesters1st-3rd 13.5** 4.7 18.2** 41.9**1st-2nd 11.7** 8.2** 14.6** 26.2**Mean dep var 3,262.8 3,311.4 3,141.5 3,327.6Observations 1,971,133 1,050,394 573,738 288,289
During pregnancy -0.017** -0.012** -0.023** -0.025**
1st trimester -0.018** -0.012** -0.026** -0.028**2nd trimester -0.015** -0.011** -0.022** -0.023**3rd trimester -0.014** -0.012** -0.019** -0.016**Difference by trimesters1st-3rd -0.004** 0.000 -0.007** -0.012**1st-2nd -0.003* -0.001 -0.004** -0.005**Mean dep var 0.148 0.138 0.187 0.113Observations 1,749,900 957,027 482,566 256,201
During pregnancy -0.007** -0.005** -0.011** -0.008**
1st trimester -0.007** -0.005** -0.011** -0.008**2nd trimester -0.005** -0.003** -0.009** -0.007**3rd trimester -0.008** -0.006** -0.011** -0.007**Difference by trimesters1st-3rd 0.001 0.001* 0.000 -0.001*1st-2nd -0.002** -0.002* -0.002** -0.001**Mean dep var 0.034 0.031 0.046 0.022Observations 1,744,828 942,762 492,410 257,143+ p<0.10, * p<0.05, ** p<.01
Table 3. Adjusted Differences in Measures of Fetal Growth by Race & Ethnicity
See notes to Table 2.
BW given gestational age
Small for Gestational Age (SGA)
Term Low Birth Weight
BW|gest SGA FTLBW BW|gest SGA FTLBW BW|gest SGA FTLBW(1) (2) (3) (4) (5) (6) (7) (8) (9)
During pregnancy 31.9** -0.013** -0.008** 41.8** -0.018** -0.009** 52.2** -0.001 -0.024*
1st trimester 36.2** -0.014** -0.008** 46.5** -0.018** -0.009** 73.7** -0.035** -0.030*2nd trimester 29.9** -0.014** -0.006** 37.2** -0.017** -0.006** 41.1** 0.001 -0.0163rd trimester 28.5** -0.009* -0.010** 41.0** -0.015** -0.011** 41.9** 0.045** -0.030*
Difference by trimesters1st-3rd 7.7+ -0.005* 0.002 5.5+ -0.003 0.002+ 31.8** -0.08** 0.0001st-2nd 6.3+ 0.000 -0.002 9.3** -0.001 -0.003** 32.6** -0.036** -0.014
Mean dep var 3,105.2 0.216 0.057 3,203.1 0.185 0.045 2351.5 0.345 0.303Observations 246,551 221,153 213,303 626,992 617,995 557,294 32,235 30,757 13,372+ p<0.10, * p<0.05, ** p<.01
Multiple gestationsTable 4: Adjusted Differences in Measures of Fetal Growth by Risk Factors
See notes to Table 2.
Pre-pregnancy BMI < 19.8 Pre-pregnancy smokers
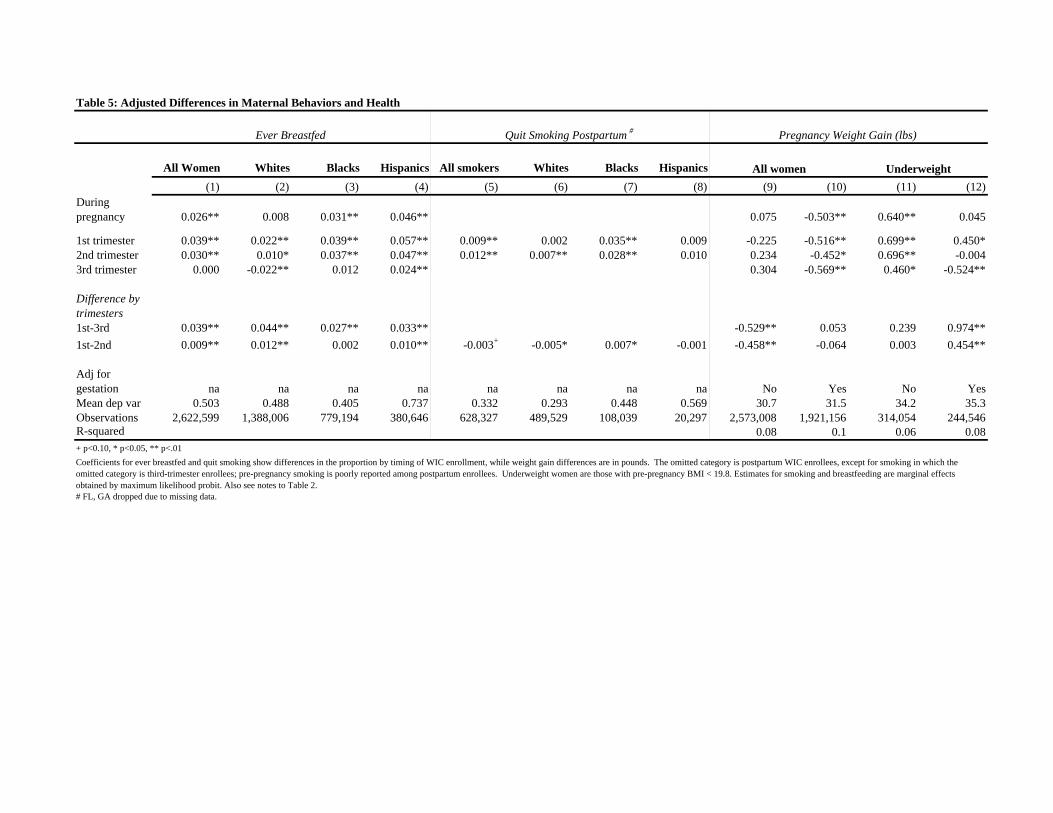
All Women Whites Blacks Hispanics All smokers Whites Blacks Hispanics(1) (2) (3) (4) (5) (6) (7) (8) (9) (10) (11) (12)
During pregnancy 0.026** 0.008 0.031** 0.046** 0.075 -0.503** 0.640** 0.045
1st trimester 0.039** 0.022** 0.039** 0.057** 0.009** 0.002 0.035** 0.009 -0.225 -0.516** 0.699** 0.450*2nd trimester 0.030** 0.010* 0.037** 0.047** 0.012** 0.007** 0.028** 0.010 0.234 -0.452* 0.696** -0.0043rd trimester 0.000 -0.022** 0.012 0.024** 0.304 -0.569** 0.460* -0.524**
Difference by trimesters1st-3rd 0.039** 0.044** 0.027** 0.033** -0.529** 0.053 0.239 0.974**1st-2nd 0.009** 0.012** 0.002 0.010** -0.003+ -0.005* 0.007* -0.001 -0.458** -0.064 0.003 0.454**
Adj for gestation na na na na na na na na No Yes No YesMean dep var 0.503 0.488 0.405 0.737 0.332 0.293 0.448 0.569 30.7 31.5 34.2 35.3Observations 2,622,599 1,388,006 779,194 380,646 628,327 489,529 108,039 20,297 2,573,008 1,921,156 314,054 244,546R-squared 0.08 0.1 0.06 0.08+ p<0.10, * p<0.05, ** p<.01
# FL, GA dropped due to missing data.
Ever Breastfed
Coefficients for ever breastfed and quit smoking show differences in the proportion by timing of WIC enrollment, while weight gain differences are in pounds. The omitted category is postpartum WIC enrollees, except for smoking in which the omitted category is third-trimester enrollees; pre-pregnancy smoking is poorly reported among postpartum enrollees. Underweight women are those with pre-pregnancy BMI < 19.8. Estimates for smoking and breastfeeding are marginal effects obtained by maximum likelihood probit. Also see notes to Table 2.
Table 5: Adjusted Differences in Maternal Behaviors and Health
Quit Smoking Postpartum # Pregnancy Weight Gain (lbs)
All women Underweight
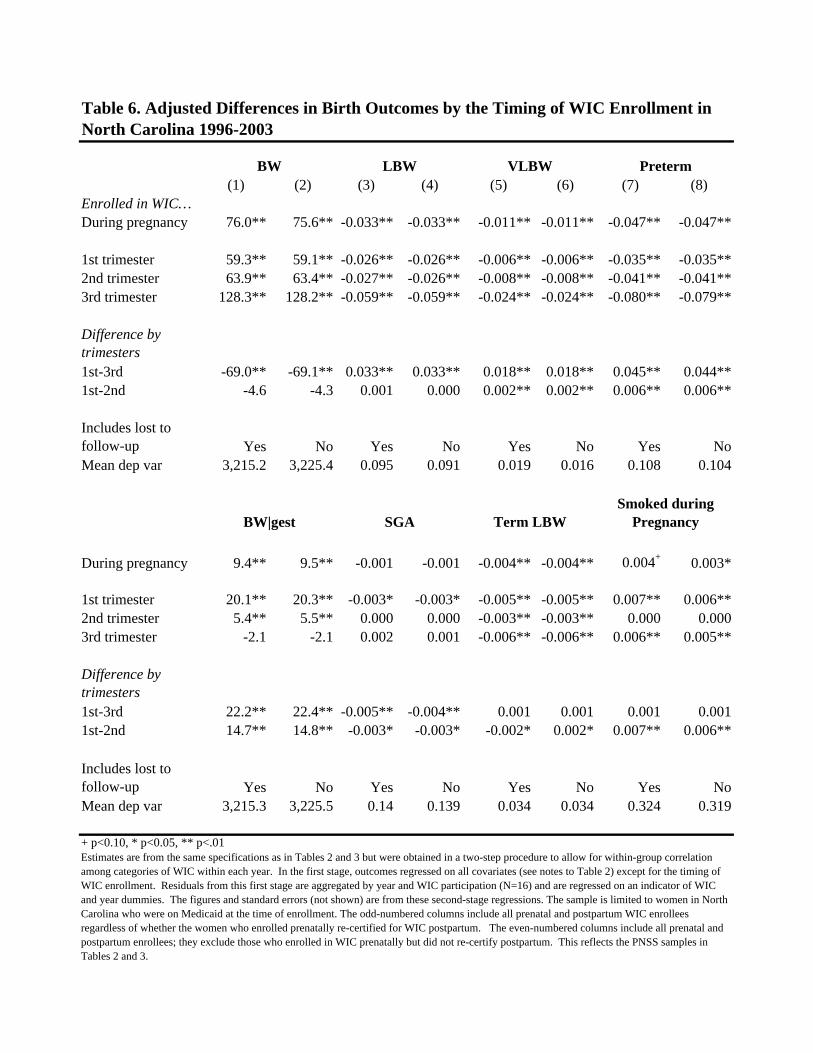
(1) (2) (3) (4) (5) (6) (7) (8)Enrolled in WIC…During pregnancy 76.0** 75.6** -0.033** -0.033** -0.011** -0.011** -0.047** -0.047**
1st trimester 59.3** 59.1** -0.026** -0.026** -0.006** -0.006** -0.035** -0.035**2nd trimester 63.9** 63.4** -0.027** -0.026** -0.008** -0.008** -0.041** -0.041**3rd trimester 128.3** 128.2** -0.059** -0.059** -0.024** -0.024** -0.080** -0.079**
Difference by trimesters 1st-3rd -69.0** -69.1** 0.033** 0.033** 0.018** 0.018** 0.045** 0.044**1st-2nd -4.6 -4.3 0.001 0.000 0.002** 0.002** 0.006** 0.006**
Includes lost to follow-up Yes No Yes No Yes No Yes NoMean dep var 3,215.2 3,225.4 0.095 0.091 0.019 0.016 0.108 0.104
During pregnancy 9.4** 9.5** -0.001 -0.001 -0.004** -0.004** 0.004+ 0.003*
1st trimester 20.1** 20.3** -0.003* -0.003* -0.005** -0.005** 0.007** 0.006**2nd trimester 5.4** 5.5** 0.000 0.000 -0.003** -0.003** 0.000 0.0003rd trimester -2.1 -2.1 0.002 0.001 -0.006** -0.006** 0.006** 0.005**
Difference by trimesters1st-3rd 22.2** 22.4** -0.005** -0.004** 0.001 0.001 0.001 0.0011st-2nd 14.7** 14.8** -0.003* -0.003* -0.002* 0.002* 0.007** 0.006**
Includes lost to follow-up Yes No Yes No Yes No Yes NoMean dep var 3,215.3 3,225.5 0.14 0.139 0.034 0.034 0.324 0.319
+ p<0.10, * p<0.05, ** p<.01Estimates are from the same specifications as in Tables 2 and 3 but were obtained in a two-step procedure to allow for within-group correlation among categories of WIC within each year. In the first stage, outcomes regressed on all covariates (see notes to Table 2) except for the timing of WIC enrollment. Residuals from this first stage are aggregated by year and WIC participation (N=16) and are regressed on an indicator of WIC and year dummies. The figures and standard errors (not shown) are from these second-stage regressions. The sample is limited to women in North Carolina who were on Medicaid at the time of enrollment. The odd-numbered columns include all prenatal and postpartum WIC enrollees regardless of whether the women who enrolled prenatally re-certified for WIC postpartum. The even-numbered columns include all prenatal and postpartum enrollees; they exclude those who enrolled in WIC prenatally but did not re-certify postpartum. This reflects the PNSS samples in Tables 2 and 3.
Table 6. Adjusted Differences in Birth Outcomes by the Timing of WIC Enrollment in North Carolina 1996-2003
BW LBW VLBW Preterm
BW|gest SGA Term LBWSmoked during
Pregnancy
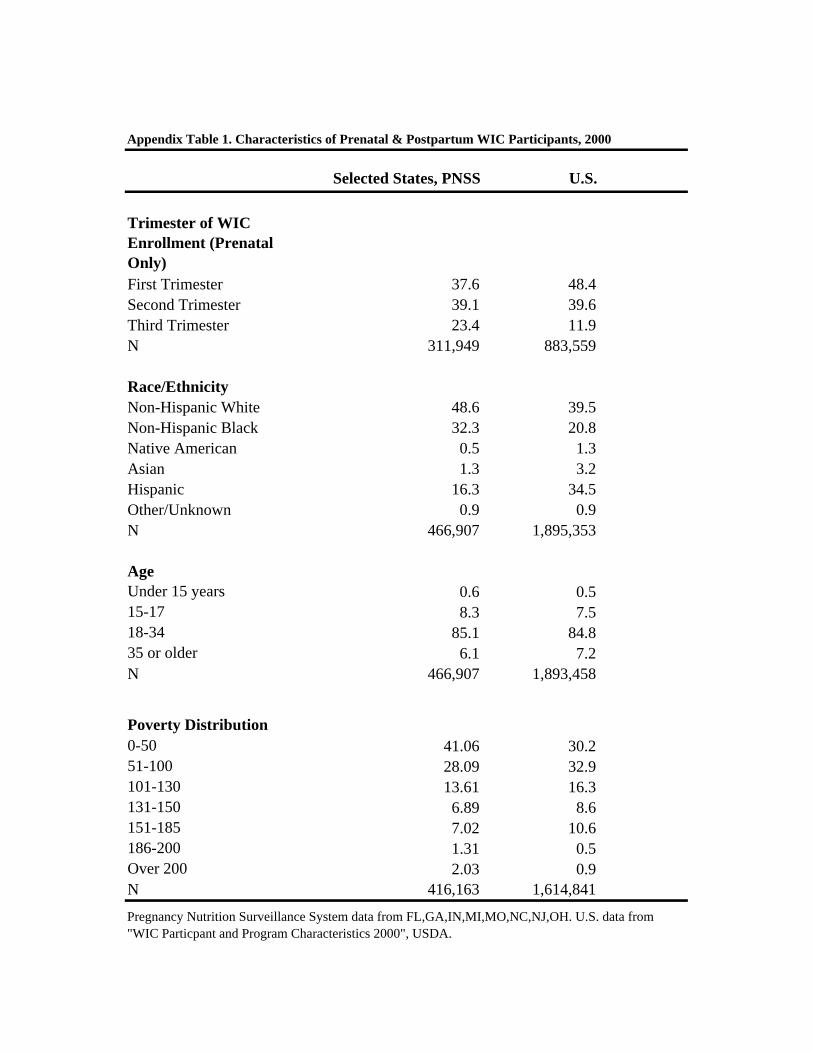
Selected States, PNSS U.S.
Trimester of WIC Enrollment (Prenatal Only)First Trimester 37.6 48.4Second Trimester 39.1 39.6Third Trimester 23.4 11.9N 311,949 883,559
Race/EthnicityNon-Hispanic White 48.6 39.5Non-Hispanic Black 32.3 20.8Native American 0.5 1.3Asian 1.3 3.2Hispanic 16.3 34.5Other/Unknown 0.9 0.9N 466,907 1,895,353
AgeUnder 15 years 0.6 0.515-17 8.3 7.518-34 85.1 84.835 or older 6.1 7.2N 466,907 1,893,458
Poverty Distribution0-50 41.06 30.251-100 28.09 32.9101-130 13.61 16.3131-150 6.89 8.6151-185 7.02 10.6186-200 1.31 0.5Over 200 2.03 0.9N 416,163 1,614,841
Appendix Table 1. Characteristics of Prenatal & Postpartum WIC Participants, 2000
Pregnancy Nutrition Surveillance System data from FL,GA,IN,MI,MO,NC,NJ,OH. U.S. data from "WIC Particpant and Program Characteristics 2000", USDA.
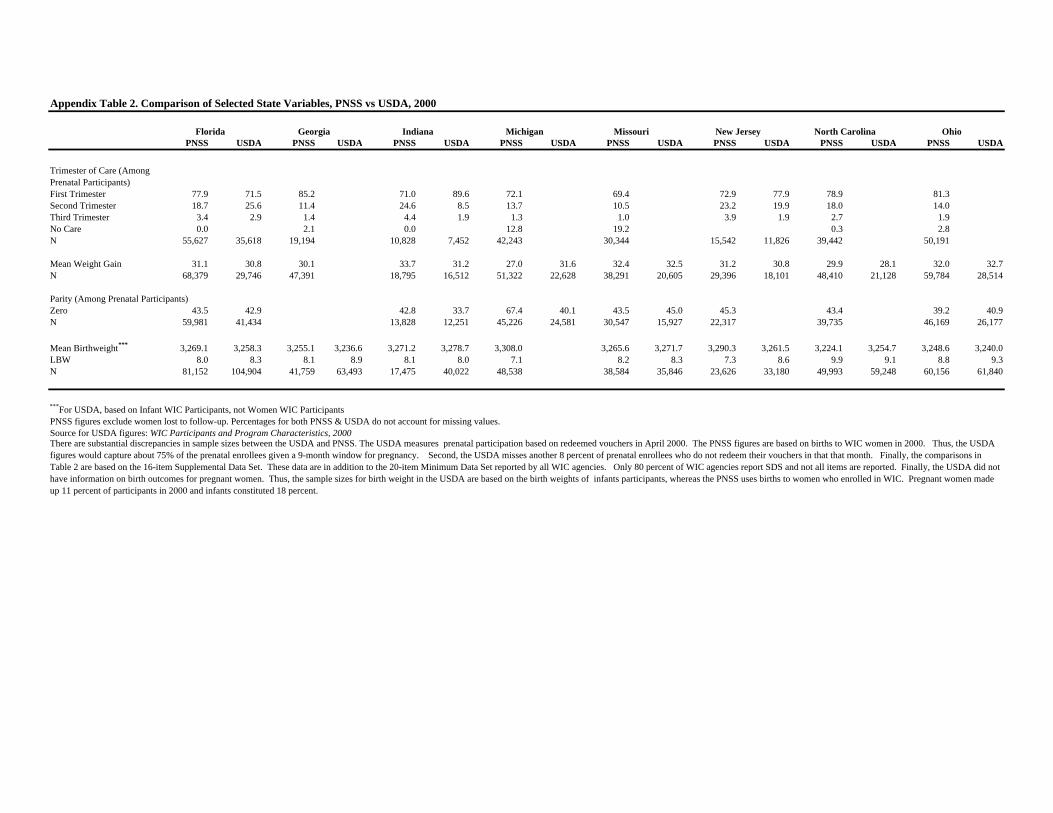
PNSS USDA PNSS USDA PNSS USDA PNSS USDA PNSS USDA PNSS USDA PNSS USDA PNSS USDA
Trimester of Care (Among Prenatal Participants)First Trimester 77.9 71.5 85.2 71.0 89.6 72.1 69.4 72.9 77.9 78.9 81.3Second Trimester 18.7 25.6 11.4 24.6 8.5 13.7 10.5 23.2 19.9 18.0 14.0Third Trimester 3.4 2.9 1.4 4.4 1.9 1.3 1.0 3.9 1.9 2.7 1.9No Care 0.0 2.1 0.0 12.8 19.2 0.3 2.8N 55,627 35,618 19,194 10,828 7,452 42,243 30,344 15,542 11,826 39,442 50,191
Mean Weight Gain 31.1 30.8 30.1 33.7 31.2 27.0 31.6 32.4 32.5 31.2 30.8 29.9 28.1 32.0 32.7N 68,379 29,746 47,391 18,795 16,512 51,322 22,628 38,291 20,605 29,396 18,101 48,410 21,128 59,784 28,514
Parity (Among Prenatal Participants)Zero 43.5 42.9 42.8 33.7 67.4 40.1 43.5 45.0 45.3 43.4 39.2 40.9N 59,981 41,434 13,828 12,251 45,226 24,581 30,547 15,927 22,317 39,735 46,169 26,177
Mean Birthweight*** 3,269.1 3,258.3 3,255.1 3,236.6 3,271.2 3,278.7 3,308.0 3,265.6 3,271.7 3,290.3 3,261.5 3,224.1 3,254.7 3,248.6 3,240.0LBW 8.0 8.3 8.1 8.9 8.1 8.0 7.1 8.2 8.3 7.3 8.6 9.9 9.1 8.8 9.3N 81,152 104,904 41,759 63,493 17,475 40,022 48,538 38,584 35,846 23,626 33,180 49,993 59,248 60,156 61,840
***For USDA, based on Infant WIC Participants, not Women WIC ParticipantsPNSS figures exclude women lost to follow-up. Percentages for both PNSS & USDA do not account for missing values.Source for USDA figures: WIC Participants and Program Characteristics, 2000There are substantial discrepancies in sample sizes between the USDA and PNSS. The USDA measures prenatal participation based on redeemed vouchers in April 2000. The PNSS figures are based on births to WIC women in 2000. Thus, the USDA figures would capture about 75% of the prenatal enrollees given a 9-month window for pregnancy. Second, the USDA misses another 8 percent of prenatal enrollees who do not redeem their vouchers in that that month. Finally, the comparisons in Table 2 are based on the 16-item Supplemental Data Set. These data are in addition to the 20-item Minimum Data Set reported by all WIC agencies. Only 80 percent of WIC agencies report SDS and not all items are reported. Finally, the USDA did not have information on birth outcomes for pregnant women. Thus, the sample sizes for birth weight in the USDA are based on the birth weights of infants participants, whereas the PNSS uses births to women who enrolled in WIC. Pregnant women made up 11 percent of participants in 2000 and infants constituted 18 percent.
Appendix Table 2. Comparison of Selected State Variables, PNSS vs USDA, 2000
New Jersey OhioFlorida Georgia Indiana Michigan Missouri North Carolina