Reasoning Requiremen ts for Diagnosis of Heart...
24
-
Upload
nguyenlien -
Category
Documents
-
view
221 -
download
0
Transcript of Reasoning Requiremen ts for Diagnosis of Heart...
Reasoning Requirements for Diagnosis of Heart Disease
William J. Long, PhD
MIT Lab for Computer Science
545 Technology Square, Room 420A, Cambridge, MA 02139, USA
[email protected] FAX: 617-258-8682 Phone: 617-253-3508
Hamish Fraser, MRCP, MSC, and Shapur Naimi, MD
New England Medical Center and Tufts University School of Medicine, Boston, MA, USA
Abstract
Over the past dozen years, we have developed the diagnostic capabilities of the Heart Disease
Program (HDP). The program has progressed from a logic based model, to a Bayesian proba-
bility network (BPN), to a pseudo-Bayesian network with temporal and severity reasoning. The
explanations have evolved from graphic causal diagrams to summarized causal outlines of the
important diseases and mechanisms. The reasoning and explanation mechanisms evolved as we
have identi�ed signi�cant classes of diagnostic situations. Improvements have been made in the
input data, in reasoning strategies, and in the explanations. The driving force has been the
need to provide clinical distinctions for planning investigation and management strategies.
While the causal probabilistic nature of much of cardiovascular disease �ts well into a
Bayesian probabilistic framework, closer examination reveals a number of aspects that require
other kinds of reasoning. The wide range of times over which disease mechanisms progress
requires temporal reasoning that does not �t well in a BPN. The distinct patterns of manifesta-
tions, (often labeled as syndromes), associated with di�erent severities of disease runs counter
to the independence of e�ects assumed in a BPN. Similarly, some diseases have multiple distinct
types, which may have separate etiologies, with di�erent patterns of manifestations. The con-
straints and homeostatic mechanisms of hemodynamics can also produce e�ects poorly modeled
by a �xed causal network.
Beyond the generation of appropriate diagnostic hypotheses, there are challenges in gathering
data and presenting the results to the physician. For example, making appropriate assumptions
about negatives from the case data, summarizing hypotheses to emphasize important diseases
and mechanisms, and providing justi�cation and explanation for the physician.
This paper discusses these problems in providing appropriate diagnoses in the heart disease
1

2domain, illustrated with clinical examples. It identi�es the requirements for an e�ective system,
and discusses the speci�c solutions developed for the Heart Disease Program.
Keywords: Bayesian probability networks, temporal reasoning, causality, physiologic causality,
constraint reasoning, diagnosis, heart disease
1 Introduction
The context of this discussion is the development of the Heart Disease Program (HDP)[1, 2, 3].
The HDP is a diagnostic reasoning tool for patients with symptoms suggestive of hemodynamic
dysfunction or diseases that could cause hemodynamic dysfunction. (The program also has a
component for reasoning about the expected e�ects of therapy by simulation[4], but this paper will
focus on the diagnostic reasoning.) The program allows direct case input from the physician using
a series of forms, then generates a di�erential diagnosis consisting of a small set of hypotheses, each
of which is an explanation for the �ndings entered.
The HDP is a diagnostic program that uses knowledge of the underlying mechanism to reason
about diseases | a process often termed \deep reasoning'. In contrast, most of the medical diagnosis
programs now working their way into practice, eg, QMR[5, 6] and DXplain[7], only use diseases
and �ndings with measures of association between them. Because they have no model of how
the �ndings interact, their di�erentials often contain clearly inappropriate diseases. In addition,
these di�erentials are lists of diseases without any indication of how they might account for the
patient data. A few programs use physiologic knowledge for diagnosis, e.g., the ABEL[8] program
for acid-base and electrolyte disorders operated at several levels of abstraction with varying detail
to capture the physiologic interactions. A number of challenging medical domains are similar to
the acid-base problem, with intermediate concepts and clinically relevant physiologic knowledge
needed to e�ectively generate and constrain diagnostic analysis. Two programs in cardiology that
use physiologic reasoning are the EINTHOVEN arrhythmia analysis system[9] and the DIAVAL
program for echocardiography interpretation, reported in this journal[10].
Cardiovascular disorders provide a challenging domain for diagnosis. Over such dimensions as
importance, time course, severity, and ease of observation, the diseases display a wide range of
characteristics. In addition, the patients often present with more than one interacting pathophysi-
ologic mechanism. The disorders range from acute to chronic. Often the chronic disorders are not
correctable, becoming the context in which other disorders manifest themselves. Hence, the patho-
3physiologic state may be simple in the patient �rst exhibiting cardiovascular disease to complex
when the disease has progressed and been complicated by additional diseases. The manifestations
may be mild and non-speci�c, such as fatigue or shortness of breath, or they may be the critical
signs of shock. Fortunately, the physiology is fairly well understood at the clinical level. That is, we
can make reasoned arguments about how the diseases will manifest themselves and how multiple
mechanisms will interact with one another. The e�ort to develop the HDP has given us a wide
range of experience in modeling and reasoning about diagnosis in a complex, model rich domain.
Other domains where clear pathophysiologic models are developing, such as respiratory disease,
neurology, or endocrinology should also bene�t from this approach.
The HDP is intended to be a clinical diagnostic tool for the practicing physician| an intellectual
sounding board for understanding �ndings in the challenging patient. As such, it takes the same
kind of information about the patient that one would see in the physician's note, including history,
symptoms, physical exam, and laboratory data. Indeed, the discharge summary or clinic letters
are often directly transcribable into the input forms. There is no required data, but the program
will use whatever is available. It then uses a modi�ed Bayesian probability network modeling the
causal pathophysiology of the cardiovascular system to reason about possible explanations for the
data. Because the probability network does not conform exactly to the requirements for a BPN, a
heuristic algorithm is used to generate diagnostic hypotheses. Each hypothesis provides a complete
explanation for the data, within the bounds of the physiologic model. The probabilities of these
hypotheses are computed and those above a threshold are ordered as a di�erential diagnosis. The
hypotheses of the di�erential are then summarized and presented to the user.
Our initial design of the HDP relied on constraints and logical relationships among diseases,
physiological states, and �ndings. These were used to rule out causes and focus the diagnostic
e�ort. It was hoped that such coarse grained diagnosis would be su�cient to direct reasoning
about patient management. However, it soon became apparent that uncertainty plays such a large
part in the diagnosis and management of cardiovascular disease that the program had to deal with
causal probabilities directly.
2 Bayesian probability networks
For diagnosis in domains with causal knowledge, the current dominant methodology is Bayesian
probability networks (BPN). Examples include MUNIN[11], for electromyographic interpretation,
to recent programs on breast cancer diagnosis[12]. A BPN program that has achieved some com-

4mercial success is Intellipath, for pathology diagnosis[13, 14]. Several years of research on BPNs
has provided sound mathematical underpinnings and e�cient algorithms for answering the most
common diagnostic questions. The primary advantage of a BPN is the direct representation and
reasoning with uncertainties among the domain parameters. In addition, the network structure is a
reasonable representation of domain causality. Sometimes however, the dual goals of representing
the probability distributions and the understood causality con ict.
The relationships among the concepts in the domain are represented as an acyclic directed graph
of probabilistic links. The probability of a node in the graph is a function of the states of the nodes
on incoming links to that node. The fundamental assumption of a BPN is that the probability of
an e�ect is only dependent on the state of the immediate causes. This independence assumption
is the source of power of the paradigm, making the computation of such things as the most likely
state of the network tractable even in fairly large networks.
A node can have a small number of states and the probability of the each state can be determined
by any function of the inputs that produces a valid probability distribution over the states. Most
commonly, the nodes are binary and the probability is computed using the \noisy-OR" assumption.
That is, if a node C has two causes A and B with p(CjA) = a and p(CjB) = b then p(CjA&B) =
1 � (1 � a)(1 � b) = a + b � ab. This generalizes to any number of inputs. This assumption is
essentially that the inputs make independent contributions to the node. It greatly reduces the
number of probabilities that must be determined.
The requirement for an acyclic network is a result of the mathematical formalism. Without
that, the probability calculations become inconsistent. For example, consider the simple example
in �gure 1. The probabilities in the right column are computed locally, just using the truth of the
incoming node and the \noisy-OR" assumption. Unfortunately, the sum of the probabilities of the
possible states is 1.0625, rather than one.
One source of computational complexity in a BPN is undirected loops. That is, places where the
network splits and rejoins (eg, the right diagram in �gure 2). Algorithms for BPNs are necessarily
exponential as a result of such occurrences [15]. However, the best algorithms are e�cient enough
to handle networks with a dozen or more such loops. A second source of complexity is nodes with
more than two values. Each such occurrence multiplies the amount of computation required.
The challenge in developing a BPN for diagnosis is to represent the knowledge of the domain
in a network and keep it computationally tractable.

5
� ��A � ��B- - ��
0.5 0.5
0.5
0.5
A B prob =
F F 0:5� 0:5 = 0.25
F T 0:5� 0:25 = 0.125
T F 0:5� 0:25 = 0.125
T T 0:75 � 0:75 = 0.5625
total = 1.0625
Figure 1: Probabilities in a Cycle
� ��A
�
JJJ
p1 p2
� ��B �
��C
)
� ��A
�
JJJ
p0
1p
0
2
� ��B �
��C-
p3
Figure 2: Representing Probability Distributions
3 Requirements for diagnostic reasoning
3.1 Modeling a probability distribution
The �rst challenge is to represent the domain knowledge in a probabilistic formalism. One clash
between the BPN formalism and practicality is the distribution of the e�ects of a node. When
developing an expert system for medical diagnosis, data on the frequency of �ndings and combina-
tions of �ndings with a disease state, are commonly available since that is the natural organization
of medicine. In contrast, while the combining function for the causes of a node can be arbitrary,
the BPN assumes that the probability of an e�ect is independent of the existence of other e�ects
from that node, unless there is an explicit link between the e�ects. If there are n possible e�ects
of a node, there are 2n possible combinations of those e�ects, for which the only constraint is that
their probabilities have to sum to one. For example in �gure 2, if A causes B and C, there are only
two probabilities to represent the three independent combinations of e�ects (eg, B&C, :B&C, and
B&:C, since :B&:C must be one minus the others). Thus, the only way to capture distributions
that do not meet the independence criteria is to represent a dependence between B and C, as shown
on the right. This adds a loop to the network and the added computational complexity. If it is
assumed that the two causes combine as the \noisy-OR" function then this representation is only
60.01?
� ��A
�
JJJ
0.1 0.1
� ��B �
��C
0.004?��� A+
�
JJJ
0.8 0.8
� ��B �
��C
)
0.014?
� ��A
�
JJJ
0.3 0.16
� ��B �
��C
0.56
-
p(B) = :01� :1 + :004� :8 = .0042
= :014� BA ) BA = .3
p(C&:B) = :01� :1� :9 + :004� :8� :2 = .00154
= :014� (1� BA)� CA ) CA = .157
p(C&B) = :01� :1� :1 + :004� :8� :8 = .00266
= :014� BA(CA + CB � CA � CB) ) CB = .565
Figure 3: Representing Probability Distributions
su�cient if the distribution is such that p(B&C)p(:B&:C) > p(:B&C)p(B&:C).
With more than two e�ects, it may be necessary to add all possible acyclic links between e�ects
to capture the probability distribution. Besides the additional computational burden imposed by
such a network, the additional links do not have the same meaning for the user as the intended
causal links. In most instances it is better to compromise and keep the model simple at the
cost of some deviation from observed probabilities. If the probability data is derived from the
literature, only a few probabilities of combinations of �ndings may be available. A large database
of cases may provide accurate probabilities, however the data should be a representative sample of
the patient population. Even when the probabilities of combinations of �ndings can be determined
within narrow variance, if they di�er from the probabilities implied by independence, the diagnostic
implications need to weighed against the additional computational burden.
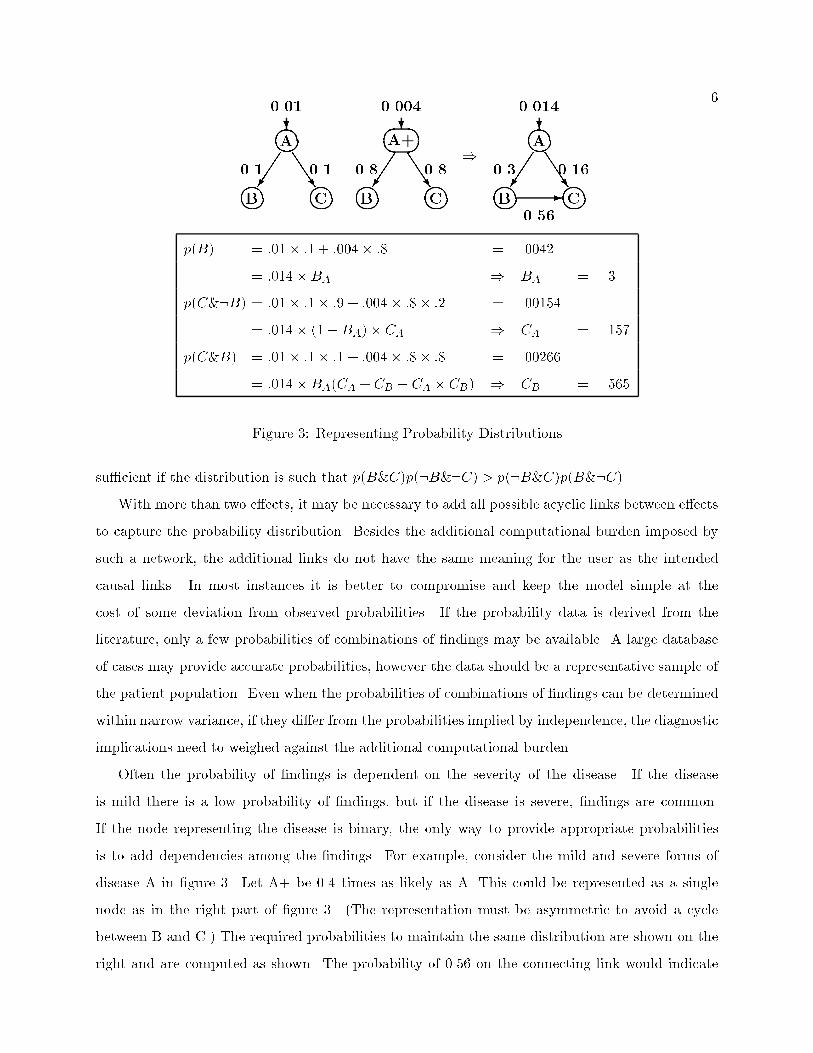
Often the probability of �ndings is dependent on the severity of the disease. If the disease
is mild there is a low probability of �ndings, but if the disease is severe, �ndings are common.
If the node representing the disease is binary, the only way to provide appropriate probabilities
is to add dependencies among the �ndings. For example, consider the mild and severe forms of
disease A in �gure 3. Let A+ be 0.4 times as likely as A. This could be represented as a single
node as in the right part of �gure 3. (The representation must be asymmetric to avoid a cycle
between B and C.) The required probabilities to maintain the same distribution are shown on the
right and are computed as shown. The probability of 0.56 on the connecting link would indicate

7a stronger association between the �ndings than with the cause, even though this is an artifact of
the severity manifestation. The more natural representation is to give the disease node multiple
values representing the possible severities of the disease. Then the structure maintains the intended
causality and conveys information that may be useful in managing the patient.
The distribution requirement for the \noisy-OR" function in this context translates into the
requirement that all of the probabilities have to increase or stay the same as the severity increases.
This is normally true, but there are a number of nodes in the HDP in which a few �nding proba-
bilities decrease. For example, in aortic stenosis there is almost always a murmur. However, when
the lesion is severe enough to lower cardiac output, the murmur often becomes inaudible and the
diagnosis may be missed. This is important because the AS is a correctable condition which left
untreated will in time be fatal. This is the kind of situation in which HDP is most needed.
In implementing HDP, we found that the most natural divisions of severities are the points at
which new manifestations are possible, that is, where the manifestations are qualitatively di�erent.
For example, the node for aortic stenosis has four severities. Mild AS only causes murmurs and
appears on the more sensitive tests (eg, echocardiography or catheterization). The second severity
causes left ventricular (LV) hypertrophy. The third severity causes limitations to cardiac output
(decreased exercise response), high �lling pressure, or angina. The most severe form causes a
weakened ventricle and all of the sequelae of dilated cardiomyopathy.
This is a very di�erent de�nition of severity from that traditionally used, which focuses on
measured valve areas, but it serves a di�erent purpose. That is, to provide a division of the
model that simpli�es the data and the reasoning. The division by manifestation enables identifying
the severity from clinical �ndings without requiring more extensive testing. This makes it easier
to classify cases for knowledge acquisition and also allows pruning of the problem space during
diagnostic reasoning. Thus, the HDP makes an initial pass through the input data and eliminating
many more severe states of diseases by the absence of the discriminating manifestations. This
signi�cantly speeds the reasoning. The qualitative severities are consistent with the observation that
the structure of the network is more important to accurate diagnosis than the actual probabilities,
although the probabilities do make a di�erence[16].
3.2 Modeling disease types
The heart disease domain has several diseases with more than one distinct type. For example, a
primary aortic regurgitation (AR) can have di�erent etiologies. To keep the model simple HDP

8includes �ve valvular disease etiologies covering the most distinct patterns, each with some unique
�ndings. For example, degenerative AR may have calci�cation or other evidence of the degenerative
process. Rheumatic AR may have a history of rheumatic fever. The most important aspect of the
di�erent etiologies of valvular disease is that they provide appropriate probabilities for multiple
valvular lesions, since multiple lesions are common and the combinations of lesions are characteristic
of the di�erent etiologies.
Besides the di�erent types representing the etiology of primary valvular disease, AR itself has
di�erent types, depending on whether the problem is at the root (dilatation of the aortic root) or
valve (lea et damage), characterized by distinct �ndings. Some AR is caused by acute processes
and this is further distinguished. Acute AR is always secondary, either to a failed valve replacement,
endocarditis, or aortic dissection. Thus, if the AR was absent a month ago and is present now, the
diagnosis immediately focuses on endocarditis or aortic dissection.
The disease type provides a template to represent diagnostically important qualitative distinc-
tions as well. This provides one mechanism for representing disease patterns. Since physicians tend
to describe diagnosis and to learn in terms of disease patterns, it is useful to capture expertise
in the model presented in similar patterns. The diagnosis explanation can then follow a similar
process to present the results. Patterns do not �t well with the BPN methodology, since all of the
knowledge in the network is local to each node. The HDP makes use of the type information as
properties on the links in the model with probabilities dependent on them. In this way, the patterns
may be embedded in the model, coordinating probabilities as well as the pattern recognition in a
completed hypothesis.
3.3 Modeling temporal relations
The main source of problems with the BPN methodology is the need for reasoning about time in
the domain. There are a number of ways in which problems arise. First, if time is required to
produce an e�ect, the cause must have existed long enough. For example, an acute MI often causes
pulmonary congestion and pulmonary congestion occasionally causes pleural e�usion, however, it
takes days or weeks to produce the pleural e�usion. Therefore, an acute MI could not explain a
pleural e�usion discovered on the same day. The second problem is the wide range of time scales
over which the changes in heart disease take place. Thus, the �ndings provided by auscultation (the
heart sounds) re ect the immediate. The �ndings of pulmonary congestion take a few hours; pedal
edema takes days; ventricular hypertrophy, months; and usually valvular stenosis takes years. The
9third problem is the need for multiple instances of some nodes to explain the �ndings. An example
is aortic regurgitation (AR) leading to a valve replacement and the replacement failing and causing
an acute type of aortic regurgitation. The earlier AR would be responsible for the evidence of LV
hypertrophy still on the electrocardiogram and the acute AR would be responsible for the murmur
and a number of other �ndings. (Our approach to temporal reasoning is discussed in detail in [3].)
The problem of e�ects requiring time means that physiologic states such as pulmonary conges-
tion cannot be represented by a single node in a traditional BPN because the truth of the state
is insu�cient information to determine the probability of e�ects. That is, pulmonary congestion
caused by an acute MI has di�erent e�ects from pulmonary congestion caused by dilated cardiomy-
opathy. In some form, it is necessary to know whether the state has been true long enough to
produce the e�ect. This breaks the fundamental assumption of the BPN that the truth of a node
only depends on the state of the immediate causes.
In several domains, the problem of temporal reasoning has been handled by replicating the causal
network for a number of time slices and using the BPN to reason about the transitions as well as
the causality[17]. This approach means that the size of the network is multiplied by the number of
time slices. With a large network of diseases, states, and �ndings, the computational costs rapidly
get out of hand. An improvement in this approach is to only replicate the model for those time
periods that matter[18]. By extending this approach, one could imagine replicating those parts of
the model having di�erent time scales with time slices of appropriate sizes. Even assuming that
such an approach would work, the number of di�erent time scales that matter in the cardiovascular
domain would imply many replications of most parts of the model, making the approach just not
feasible. The approach in the HDP is to carry the temporal information as properties on the
instantiation of the network used in reasoning. The deduced time intervals propagate through the
network constraining all e�ects below the node. Thus, the time constraints on the MI apply not
only to the pulmonary congestion it causes but also to the e�ects of the pulmonary congestion.
Since this temporal constraint is quite di�erent from the probability constraints imposed by the
BPN, it is a powerful tool in directing the hypothesis generation.
The problem of multiple instances of a node only happens in a few situations in the heart disease
domain, but they led to a signi�cant number of incorrect diagnoses before temporal reasoning was
added to the program[20]. Most of the cardiovascular diseases either cause permanent dysfunction,
so once they are present, they remain (eg, dilated cardiomyopathy), or have a speci�c time course
and afterward are irrelevant to future diagnoses. Diseases that are chronic but completely cor-

10
��� VHD��� AR-1��� AVR
��
� :AR-2
��� AR-3
��� LVH
��
� murmur
- - -
? ? ?
AR: -
AVR: -
LVH: -
Murmur: -
Time: -
Figure 4: Representing Recurrence of a Disease
rectable are also irrelevant after they have been corrected. The problem for reasoning arises when
there are diseases whose �ndings remain after the disease has ended and the disease may recur with
new �ndings. The prime examples are valvular disease, but diseases like endocarditis also exhibit
the same challenge for reasoning. Myocardial infarction also recurs with both acute and chronic
�ndings, but the disease pro�les in the acute, subacute, and chronic phases are so di�erent that in
the HDP they are modeled as three di�erent diseases.
A situation like the recurrence of AR is handled in the HDP by generating two instances of the
AR node in the hypothesis as shown in �gure 4. The valvular heart disease (VHD) over many years
causes the initial AR (AR-1), which causes LV hypertrophy (LVH). The aortic valve replacement
(AVR) corrects the AR with a probability of 1.0 at the time it was done. Thus, AR-1 ends at that
time and there is an instance of AR being false that begins at that time. Meanwhile, the LVH
continues for an inde�nite period of time. With some time delay, the AVR causes acute AR (AR-3),
which ends the period of AR being false and causes the murmur. The explicit representation of
these relationships in the network allows the HDP to make appropriate attribution of the �ndings
and ensure the temporal consistency of the hypotheses it generates.
3.4 Causality in feedback systems
Modeling causal relations with a BPN, one assumes that each cause{e�ect relationship is directly
and e�ectively represented by a probability. Many of the parameters of the cardiovascular system
are part of a large feedback system that is continuously seeking a stable state. Perturbations to the
system cause changes in the stable state that are re ected as changes in one or more parameters.
11
��� CO��� BP��� SS
��� VR
- -
�J
JJ]
+1 {9
+1+1changes:
Cardiac output (CO) = {10
Blood pressure (BP) = {1
Sympathetic state (SS) = +9
Vascular resistance (VR) = +9
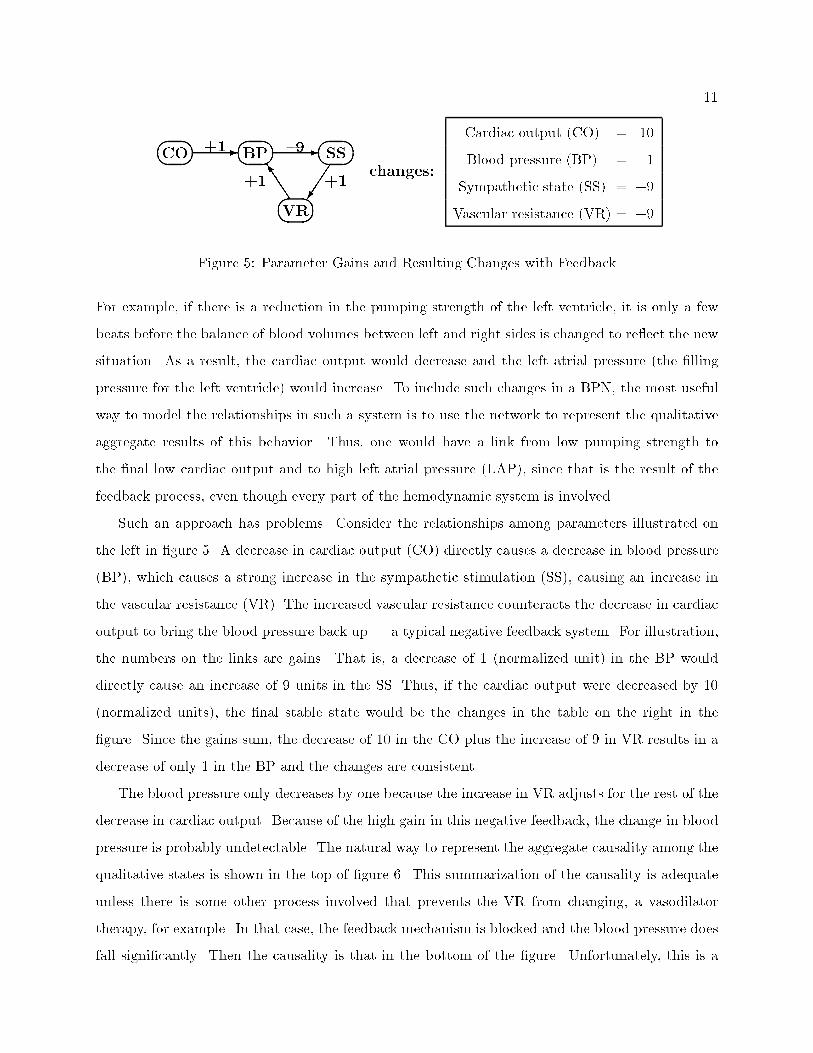
Figure 5: Parameter Gains and Resulting Changes with Feedback
For example, if there is a reduction in the pumping strength of the left ventricle, it is only a few
beats before the balance of blood volumes between left and right sides is changed to re ect the new
situation. As a result, the cardiac output would decrease and the left atrial pressure (the �lling
pressure for the left ventricle) would increase. To include such changes in a BPN, the most useful
way to model the relationships in such a system is to use the network to represent the qualitative
aggregate results of this behavior. Thus, one would have a link from low pumping strength to
the �nal low cardiac output and to high left atrial pressure (LAP), since that is the result of the
feedback process, even though every part of the hemodynamic system is involved.
Such an approach has problems. Consider the relationships among parameters illustrated on
the left in �gure 5. A decrease in cardiac output (CO) directly causes a decrease in blood pressure
(BP), which causes a strong increase in the sympathetic stimulation (SS), causing an increase in
the vascular resistance (VR). The increased vascular resistance counteracts the decrease in cardiac
output to bring the blood pressure back up | a typical negative feedback system. For illustration,
the numbers on the links are gains. That is, a decrease of 1 (normalized unit) in the BP would
directly cause an increase of 9 units in the SS. Thus, if the cardiac output were decreased by 10
(normalized units), the �nal stable state would be the changes in the table on the right in the
�gure. Since the gains sum, the decrease of 10 in the CO plus the increase of 9 in VR results in a
decrease of only 1 in the BP and the changes are consistent.
The blood pressure only decreases by one because the increase in VR adjusts for the rest of the
decrease in cardiac output. Because of the high gain in this negative feedback, the change in blood
pressure is probably undetectable. The natural way to represent the aggregate causality among the
qualitative states is shown in the top of �gure 6. This summarization of the causality is adequate
unless there is some other process involved that prevents the VR from changing, a vasodilator
therapy, for example. In that case, the feedback mechanism is blocked and the blood pressure does
fall signi�cantly. Then the causality is that in the bottom of the �gure. Unfortunately, this is a

12
with feedback:��
� low CO -��
� high SS -��
� high VR
feedback blocked:��
� low CO -��
� low BP -��
� high SS
Figure 6: Representing Results of Feedback as Causality
change in the structure of the network and not just an addition to it.
In general, this is a situation for which a �xed acyclic network does not adequately represent
all of the possible causal relationships. That is, it is possible to show feedback circuits that would
require several di�erent networks in di�erent situations to cover the possible dynamics. In a prac-
tical network, however, it is usually possible to determine an architecture that accounts for the
situations that arise in practice. There are also ways of working around the problems. In the
example, one might model two severities of low BP, the lesser one undetectable and include the
low BP in the causal chain. This approach is taken in the HDP to account for the e�ect of low
CO over a period of days on blood volume and manifestations such as pedal edema, since when the
pedal edema is observed, there may not be any measurable decrease in the CO. Still, determining
an architecture that accounts for the many distinct abnormalities of physiology in the determinants
and interactions of the CO on the left and right sides of the heart has been a signi�cant challenge
in the development of the HDP.
A practical goal for the BPN representing a feedback circuit is that the architecture is consistent
with the causal intuitions of physicians. Even though all of the nodes change together, we usually
think of them as a single chain of causality. This chain must support the possible pathophysiologic
variants. The usual heuristic is that the causality is represented in the direction of the blood ow.
There are exceptions, such as the usual view that low CO causes high LAP.
In situations like a BPN representing a feedback circuit, the meaning and determination of the
probabilities is a problem. If the feedback circuit is an accurate model of physical reality, then all
the changes actually take place | there is no uncertainty. Therefore, the probability represents
the frequency that a change within a qualitative range (e.g., low CO) produces a change that
falls within the qualitative range of the e�ect parameter. This probability depends on the joint
distributions of all of the parameters involved in the feedback. For example, the probability that

13low CO causes high LAP depends not only on the distribution of COs considered low, but also on
the distribution of the other parameters in the feedback circuit when the CO is low. Thus, having
an equation that relates the parameters is insu�cient information to determine the probabilities.
Still, the equations do provide additional information that may aid the diagnostic reasoning. In
the HDP, such quantitative constraints are used whenever there is enough information in the input
to force the value of an additional parameter. For example, the CO, BP, and right atrial pressure
would be used to infer the vascular resistance, which would then be used as evidence for causes of
the corresponding qualitative state of the vascular resistance. In a domain as physiologically rich
as heart disease, these constraints frequently provide additional leverage for the diagnosis.
3.5 Forward cycles in the network
The �nal issue of representation is the existence of cycles in the domain. That is, situations where
the natural causal representation leads to forward cycles like that shown in �gure 1. This was the
�rst problem that drove the HDP to a pseudo-BPN. There are three kinds of situations that lead
to cycles in the network. The �rst is events whose consequences increase the probability of those
events recurring in the future. For example, a pulmonary embolism can increase the resistance
through the lungs, which may decrease cardiac output. Low cardiac output is one of the primary
causes of a pulmonary embolism. Thus, the patient is at greater risk of pulmonary embolism in
the future (not to mention the other predisposing factors for pulmonary embolism). The pattern
that emerges in the individual is an increased probability of the disease once the patient has a
past incidence of the event. It is particularly important to reason appropriately about pulmonary
embolism because it is a common, often underdiagnosed, treatable cause of hospitalization.
The second kind of cycle is the true positive feedback. Cardiogenic shock is an example. Once
the patient starts experiencing a drop in cardiac output such that oxygen delivery is compromised,
the function of the ventricle is reduced, causing a further decrease in the cardiac output. Thus,
the patient is in a downward spiral which requires immediate aggressive intervention to stop. The
third kind of cycle is one with more than one starting point but the e�ects do not further aggravate
the causes (at least noticeably). A typical example is hypertension and renal insu�ciency. Either
can cause the other.
In the HDP the approach we have taken is to represent the cycles in the model, but not to allow
cycles in the hypotheses the program generates. This alleviates problems such as trying to separate
the causality between hypertension and renal insu�ciency. The program picks the causality that is

14consistent with the available evidence and maximizes the probability of the hypothesis. The problem
of recurrences of pulmonary embolism require multiple instances of the pulmonary embolism node,
with sequential time intervals. This is handled by instantiating the node as needed (in the same
way that AR corrected then recurring is handled). The positive feedback cycles are handled by
representing the current state of the cycle. That is, the initial cause for the poor ventricular
function is the only cause in the hypothesis. The poor ventricular function accounts for the low
cardiac output and low oxygen delivery. For the positive feedback cycles in the heart disease domain,
this is adequate because these are situations too acute for the HDP to be of much practical bene�t.
What is being sacri�ced is the ability to have an explicit representation of the dynamic behavior.
That is, to represent the fact that the cardiac output or blood pressure is dropping as evidence of the
positive feedback cycle. It is still possible to analyze the hypothesis and identify the potential for
positive feedback by identifying those places in the hypothesis with a causal link in the knowledge
base that would create a cycle. This is an important ability because it means that the program
can alert the physician to the dangerous possibility of rapid disease progression in situations that
might lead to ash pulmonary edema, cardiogenic shock, or other catastrophic events.
4 Requirements for input
The goal for the HDP in gathering the case data is to enable the user to unambiguously specify
anything that would make a di�erence in the diagnosis.
The input is more complex than for most expert systems primarily because the HDP needs to do
temporal reasoning. The temporal information may be simple, such as the time of a test or event |
a single time point. However symptoms, such as chest pain, dyspnea, or fatigue have time intervals
during which they have occurred, as well as properties such as length of individual occurrences,
frequency, changes, and associations with other symptoms or events. The most challenging �ndings
are murmurs. There can be multiple murmurs, each with a primary and secondary locations,
loudness, frequency, and occasionally changes with particular maneuvers. Every property of a
�nding may provide an important clue in a particular situation but none is always important or
even available. So many possible features means a �xed input menu list would be overwhelming.
Another problem is the large number of tests that are occasionally available and pertinent. Costly
tests such as an echocardiogram or catheterization have many possible �ndings that can clarify
the diagnosis. Even an old test may provide important evidence for ruling in or out chronic
pathophysiologic states. Thus, it is necessary to guide the input process and only ask for details

15as needed. This is a challenge for a Web interface because HTML forms are �xed. Java applets
improve the situation, but not without e�ort.
The large number of possible inputs is not as problematic for the physician as it might seem,
since only a fraction of the data will be available for a patient. Furthermore, users only enter the
information they think might be relevant. As a result, physicians rarely enter negative �ndings.
However, the negatives are very important to focus the diagnostic search. Thus, the program needs
a good model for inferring negatives from the positive �ndings. The basic strategy is to assume
complete information within what reasonably could have been observed in any category in which
the user has speci�ed something. For example, if the user gives information about auscultation (eg,
a loud S1), it is assumed that other auscultation information was negative (ie, no murmurs).
There are many situations where this assumption of complete information is unreasonable. In
particular, one �nding might cover or obscure another. To handle such situations, HDP has rules
for deciding which �ndings are unknown rather than false. For example, if the patient has postural
syncope, syncope at rest is false, but if there is syncope at rest, postural syncope and syncope on
exertion are considered unknown. In addition, the program assumes that a few important �ndings,
such as chest pain, would be mentioned if they were present.
This mechanism for reasoning about unspeci�ed �ndings usually provides a reasonable set of
negative �ndings for the program. The most common failing is when the user tries to probe
the HDP with \what if" questions or if recorded data includes partial information about a test
result. For example, if the user enters a number of �ndings consistent with mitral stenosis and
includes a normal ejection fraction on echocardiogram, the program is likely not to hypothesize
mitral stenosis because the expectation that the mitral stenosis would have been present on the
echocardiogram is so high that it overwhelms most positive physical examination evidence. Our
human ability to make deductions from partial information is so natural that we often do not
realize we are doing it. This problem is part of a larger issue of how to handle data in con ict.
If the con ict is de�nite, the HDP identi�es the con ict as an error, makes an assumption about
what to believe (generally believing an abnormal �nding over a normal one) and continues with
the analysis. If the con ict is only partial (eg, the common explanations for a �nding are ruled out
by other evidence), the program continues with the analysis. This occasionally leads to obscure
hypotheses, such as diagnosing coronary spasm instead of coronary artery disease to account for
unstable angina because in entering catheterization results the user did not enter �ndings about
the coronary arteries, which the HDP then assumed were clear. (We now allow di�erent kinds of
16catheterization to be entered.) Another strategy might be to use any instance in which the common
explanations of �ndings have been ruled out as an indication that the absence of those common
explanations needs to be indicated to the user and explained.
While developing the HDP we have considered a number of mechanisms for entering uncertain
data. One could include a measure of belief with any data item that was uncertain. However,
physicians are not used to doing that explicitly and there are few studies of the consistency or
meaning of such information. Thus, we assume the physician will follow the old advice to be
sure of your data and state what you are sure of. On the other hand, it may be appropriate to
provide information on the circumstances of some �ndings. For example, auscultation in a noisy
environment, such as the emergency room, might mean that many of the items not reported are
unknown rather than false. This is information that is clearly used by physicians but is di�cult to
quantify. One instance in which we have a category for poor data is the echocardiogram. Because
poor quality results may convey some useful data and not be repeated, we allow the user to indicate
that it is a suboptimal study.
Another aspect of the data that is di�cult to quantify is the e�ect of expertise on the accuracy
and thoroughness of the data. From our discussions with physicians it is clear that most general
internists would not recognize an M-shaped jugular pulse, while most cardiologists would. Simi-
larly, on auscultation the ability to discriminate between an S3 and an opening snap varies with
experience. This is an important distinction because an S3 almost rules out mitral stenosis while
an opening snap is a fairly speci�c �nding for mitral stenosis.
When physicians consider data, they also factor in the source. Positive physical �ndings by a
cardiologist may overrule a poor quality echocardiogram or a good echocardiogram may overrule
auscultation �ndings reported by an intern. Since the HDP does not have access to the additional
information necessary to make these determinations, it is all the more important for the program
to explain the basis for the conclusions it draws.
5 Requirements for explanation
Given the patient data and ability to reason, the program needs to provide the user with a diagnostic
analysis of the case useful in managing the patient. The analysis should be supported in ways that
convince the physician of its correctness.
The �rst question is, what should be in the diagnosis? An appropriate diagnosis includes not
only the most likely hypothesis, but also a di�erential of other hypotheses with signi�cant likelihood.

17Since there are few certainties in medicine, the patient may not have the \most likely" disease.
Furthermore, the diagnosis is just the �rst step in managing the patient. Indeed, an important
function of the diagnosis is to guide further investigation in the re�nement of the diagnosis. Thus,
the physician needs to know what possible diagnoses, especially treatable ones, should be considered.
Since the purpose is to alert the physician to important possible diseases, the di�erential need only
include those alternate hypotheses that di�er from the best hypothesis in clinically signi�cant ways.
The HDP accomplishes this by only including hypotheses that di�er in a disease state of diagnostic
signi�cance. It is possible to imagine situations in which �ner grain alternatives would be useful,
such as possible complicating mechanisms that might have therapeutic implications.
The second task is to present the di�erential to the user. There are a number of possible
strategies one might pursue. The approach for BPNs suggested by Suermondt[21] and more recently
modi�ed by Haddawy et.al.[22], assumes that there is a single disease node that is the focus of
the diagnosis. Their approach is to identify the �ndings that have the greatest in uence on the
probability of that node, either by sensitivity analysis in the fully speci�ed network or by comparing
the contribution of each �nding in the absence of other �ndings. The causal pathways from the
node to the most in uential �ndings are then used as the explanation of the diagnosis. This
approach is inappropriate for the HDP because the hypothesis is not just one node, rather it is
an instantiation of a subset of the network representing a complete explanation of the �ndings.
Determining a complete explanation is important in cardiology as well as other domains in which
there are chronic diseases because the primary disease may not be the clinically important part of
the hypothesis. Often the primary disease is already known and uncorrectable and the important
question is what new treatable complications are causing the patient to be decompensated.
Thus, the approach taken by the HDP is to consider the di�erential as a set of possible complete
and consistent explanations. As mentioned in the earlier section we have added a number of
properties to the nodes, so in fact, the internal representation of the hypothesis contains considerable
detail. Each of the instances of nodes in a hypothesis includes the temporal intervals, severity, and
disease type properties. In many cases there are multiple instances representing the progression
of the disease over time. For example, there might have been echocardiographic evidence of mild
AS two years ago and �ndings indicative of more severe AS now. This would be represented by
an instance of mild AS covering the time two years ago and extending into the past and sometime
prior to now. The second instance of more severe AS would follow the mild AS and extend into
the future. In this way, the program is able to maintain the temporal consistency and consistency
18of �ndings of the disease at di�erent severities.
Given the amount of detail in hypotheses, we have chosen to explain the di�erential in two steps.
First, to explain the best hypothesis and then to give an outline of the rest of the hypotheses. In
this way the user is given the program's best estimate of how the �ndings �t together and an
overview of the possibilities that should be considered or ruled out. Another possible strategy
would be to abstract from the set of hypotheses in the di�erential one or more general hypotheses
that are noncommittal in areas where the hypotheses give alternative causes. For example, if
all of the di�erential hypotheses have dilated cardiomyopathy but they explain it variously as of
hypertensive, ischemic, or idiopathic (primary) origin, the general hypothesis would just refer to it
as dilated cardiomyopathy of unknown origin.
Since the best hypothesis is a large causal network supported by positive and negative �ndings,
the challenge is to explain it succinctly. In a typical hypothesis a causal chain from disease to
�nding may include as many as ten intermediate nodes representing the mechanisms leading to the
�nding. While a detailed explanation is useful for understanding the basis of the conclusions, the
complexity and prevalence of concepts relating mechanism tends to obscure the more important
messages of the hypothesis.
5.1 Summarization
To handle the problem of explaining a hypothesis, we have developed a technique for summarization
that eliminates the nodes relating mechanism, combines nodes into recognized syndromes, and
eliminates much of the detail of time and type.
The nodes representing mechanism are eliminated by merging them into the most closely asso-
ciated important node and using only the links needed to establish the structure of the diagnosis.
Mechanisms are recognized by labels supplied in the knowledge base. For example, low blood vol-
ume is labeled as the mechanism through which dehydration causes its e�ects. If a hypothesis had
the causal link from dehydration to low blood volume, the summary would only have dehydration
with causal links to any e�ects of either dehydration or low blood volume. Sometimes the e�ect
node needs to replace the mechanism node. For example, acute myocardial ischemia is labeled as
the mechanism for its e�ects: acute MI and unstable angina. If the hypothesis has acute MI, sum-
marization eliminates the acute myocardial ischemia and only the acute MI node remains. Other
e�ects of acute myocardial ischemia are attributed to the cause of the ischemia (eg, coronary artery
disease), since they are not e�ects of the MI.

19�
�
�
VHD
�
JJJ�
�
�
AS
�
�
�
LBBB
)
�
�
�
AS
?�
�
�
LBBB
&
�
�
�
VHD
�
JJJ�
�
�
MR�
�
�
Mitral Calc
)
�
�
�
Mitral Calc
?�
�
�
MR
Figure 7: Summarization by Incorporating Mechanism
Unfortunately, when a number of nodes are collapsed into one, the appropriate action varies
with the circumstances. Eliminating the valvular heart disease (VHD) node as the mechanism for
valvular disease in cases from our previous evaluation[2] illustrates the range of possibilities for
handling e�ects. VHD is a covering node that is instantiated as the appropriate type of primary
valvular disease (rheumatic, degenerative, etc.) when there is adequate evidence.
In one case where the VHD included left bundle branch block (LBBB) and aortic stenosis (AS),
the summary absorbed the mechanism, VHD, into the AS, and left LBBB as a separate entity. In
another case, the VHD was manifest as both mitral annular calci�cation and mitral regurgitation
(MR) with the summary separating them. The more appropriate summarizations are in �gure 7.
The di�erence in these two situations is that the LBBB does not in uence the AS and to a large
extent the AS causes the LBBB. Thus, the AS can substitute for the VHD in causing the LBBB. In
the second situation, the mitral calci�cation is seen as at least worsening the MR and can substitute
for the degenerative process that is the VHD. Thus, this additional causal information needs to be
in the knowledge base to make the appropriate summarization decision.
In a third case, the VHD was manifest as both MR and mitral stenosis (MS). The summarization
left these as separate entities, but the reviewers preferred maintaining the VHD, which in this case
was of rheumatic origin. The summary lost the important information that the MR and MS
had a common source. The valvular heart disease could be replaced by more speci�c labels of
rheumatic heart disease or mitral valve disease to provide the connection, but the node is needed.
In contrast, in one case there is a causal link from renal insu�ciency to hypertension. This causal
explanation was the highest probability explanation generated by the program. However, there was
no speci�c support for this relationship among the �ndings. Since hypertension can also cause renal
insu�ciency and the high prior probability both are primary, the reviewers would have preferred
having no causal connection between them, indicating no commitment. That was also true in a
case in which the patient had anemia. While a few of the causes of anemia are in the model, most

20are outside the domain of the program and unless there is speci�c evidence for a causal relation, the
summary should not indicate a possible cause. Since the program concentrates on cardiovascular
disease, the diseases that are peripheral have only partial lists of causes in the model and the
program should be noncommittal about causes.
If there are multiple possible causes for the node, physicians want them included in the summary.
For example, ventricular ectopy should be attributed to all of the possible causes in the hypothesis,
such as coronary artery disease, hypokalemia, hypoxemia, and cardiac dilatation, rather than just
the one or two of these with highest probability. This is useful for creating a management plan for
the patient.
Thus, the appropriate summarization preserves the sense of causality, which may require ad-
ditional information and reasoning. The summarization also needs to keep the causal connections
between diseases supported by evidence and discard those only supported by a higher probability.
If there are multiple possible causes within the hypothesis, all should be included in the summary.
In addition to removing the mechanisms from the hypotheses, the summarization process in-
cludes the recognition of syndromes. The syndromes are combinations of nodes considered as an
entity by physicians. For example, congestive failure is the combination of left and right heart fail-
ure. In turn, left heart failure consists of high left atrial pressure and pulmonary congestion caused
by low cardiac output. Situations that do not match this de�nition, such as forward failure in
which the e�ects of the low cardiac output are fatigue, peripheral cyanosis, etc., are summarized by
the low cardiac output with its e�ects. Syndromes in the HDP include cor pulmonale, cardiogenic
shock, and coronary heart disease.
Another important kind of information to include in the summary is pertinent negatives. There
are a couple of kinds of pertinent negatives. First, there are the �ndings that decrease the likelihood
of the generated hypothesis. For example, the hypothesis may include MS on the basis of a number
of �ndings. However, if the auscultation did not �nd an opening snap, it is worth noting the fact
because an opening snap is present in the majority of MS cases. Such negative information gives
the physician a more balanced impression of the hypothesis. Some of the negative �ndings may
have been overlooked by the physician. In other cases, the presence of signi�cant negative �ndings
may point to underlying con icts in the data. In either case the information helps the physician
assess the validity of the hypothesis.
Secondly, situations where a common cause for a �nding or group of �ndings is ruled out indicate
another kind of pertinent negative. (This is the partial data con ict problem mentioned earlier.)
21To determine these pertinent negatives, it is necessary to �rst determine the common causes of each
abnormal �nding in the absence of other �ndings. Of those causes that have strong support from
individual �ndings and do not appear in the di�erential, determine the negative �ndings that rule
out or signi�cantly decrease their probability. This strategy ignores the possibility that a ruled-out
cause may be supported by a pattern of �ndings and not any single �nding, but we have not seen
any such examples. It is valuable to point out to the physician such pertinent negatives both to
assess the hypotheses and to assess his/her own data.
6 Discussion
It is clear that the challenge of diagnostic reasoning in heart disease, as well as many other knowl-
edge rich domains, is multifaceted. While BPNs are a good �rst pass at capturing the pertinent
relationships, they only scratch the surface. To improve the diagnostic capabilities of a program,
more of these relationships will have to be used. The HDP has extended the BPN paradigm to
incorporate knowledge about temporal characteristics, severities, the patterns of distinct disease
types, implications of data entered by the physician, constraints on data relationships, and physician
requirements for an appropriate diagnosis.
While not all domains will bene�t from all of these additional kinds of knowledge, there are sev-
eral in which physicians may reason about the underlying physiology in a similar manner, including
respiratory disease, neurology, endocrinology, and acid-base and electrolyte disorders. Some do-
mains will require additional kinds of reasoning. Indeed, the requirements of the acid-base domain
for quantitative analysis go well beyond that of cardiology. As physiological research produces fruit
there will be more domains that require multifaceted reasoning to achieve the necessary leverage
to solve the diagnostic problems.
From the perspective of the HDP, there are a number of directions for research in improving
the methodology. The development of a knowledge base for a domain as complex as cardiovascular
disease is a lengthy and di�cult process, prone to error. A number of techniques have been
developed recently for generating BPNs from data. A major constraint when the reasoning includes
causality and temporal relations is to preserve the causal structure in the model. More recent work
is heading in that direction[23]. At present, the most reliable approach is simply to start with a
causal structure and use the data to re�ne the probabilities.
One of the challenges is making sure that the model captures what is known about patterns
of disease. Physicians often remember diseases in terms of their typical manifestations, so this

22information is relatively easy to elicit from experts or medical texts. Since no current patient data
base is large enough to accurately re ect all such patterns, it is necessary to provide additional
guidance to make the network incorporate this knowledge. We have used the idea of types of a
disease enforced with properties on nodes that adjust the probabilities. This partially addresses
the problem, although in a way that is counter to the basic assumptions of a BPN. There are
undoubtedly other approaches that would combine the basic insights of frames (a natural way of
capturing patterns) and a BPN.
The di�erence between a physician's reasoning and a probabilistic approach to diagnosis also
comes out in the explanation. Physicians tend to think in terms of evidence rather than prob-
abilities. Therefore, they tend to be satis�ed with causes that can be \ruled in" or \triggered"
by �ndings and less satis�ed with causes based on probabilities. Thus, giving a speci�c cause
for dilated cardiomyopathy just on the basis of the prevalence of ischemic or hypertensive disease
is considered inappropriate, but is �ne if the patient has some history of angina or high blood
pressure. However, there are speci�c situations in which one should include unsupported causes.
These are the treatable diseases that might otherwise go unnoticed, such as pulmonary embolism
or endocarditis. Probabilistic approaches have much to o�er in such situations, because these are
the problems may be overlooked by the physician's approach, particularly with inadequate data.
The HDP is currently undergoing an evaluation that will give us a better understanding of
the strengths and limitations of the knowledge base and the mechanisms we have developed for
reasoning. To conduct this evaluation, we have developed a Web based interface that will allow
physicians with a Web browser[26] and Internet access the ability to run the program[24, 25].
Acknowledgments This research was supported by National Institutes of Health Grant No.
R01 HL33041 from the National Heart, Lung, and Blood Institute.
References
[1] W. Long, Medical Diagnosis Using a Probabilistic Causal Network, Appl. Arti�cial Intelligence
3 (1989) 367-383.
[2] W. J. Long, S. Naimi, and M. G. Criscitiello, Evaluation of a New Method for Cardiovascular
Reasoning, J. Am. Med. Informatics Assoc. 1 (1994) 127-141.
[3] W. Long, Temporal Reasoning for Diagnosis in a Causal Probabilistic Knowledge Base, Arti�cial
Intelligence in Med. 8 (1996) 193-215.

23[4] W. J. Long, S. Naimi, M. G. Criscitiello, and R. Jayes, Using a Physiological Model for Predic-
tion of Therapy E�ects in Heart Disease, Computers in Cardiology Conf., (1986) 15-20.
[5] R.A. Miller, H.E. Pople, and J.D. Myers, INTERNIST-I, An Experimental Computer-Based
Diagnostic Consultant for General Internal Medicine, N. Engl. J. Med. 307 (1982) 468-476.
[6] M.B. First and R.A. Miller, QUICK (QUick Index to Caduceus Knowledge): Using the Internist-
1/Caduceus Knowledge Base as an Electronic Textbook of Medicine, Comput. Biomed. Res. 18
(1985) 137-165.
[7] G.O. Barnett, J.J. Cimino, J.A. Hupp, and E.P. Ho�er, DXplain: An Evolving Diagnostic
Decision-Support System. J. Am. Med. Assoc. 285 (1987) 67-74.
[8] R.S. Patil, Causal representation of patient illness for electrolyte and acid-base diagnosis.
MIT/LCS/TR{267. October 1981.
[9] L.E. Widman and D.A. Tong, Model-based Computerized Rhythm Analysis of the ECG: Valida-
tion of the einthoven System with Three Classes of Clinical Arrhythmias. Am. J. Cardiology.
78 (1996) 927-931.
[10] F. J. D��ez, J. Mira, E. Iturralde, and S. Zubillaga DIAVAL, Bayesian expert system for echocar-
diography, Arti�cial Intelligence in Med., this issue.
[11] S. Andreassen, M. Woldbye, B. Falck, and S.K. Andersen , MUNIN | A Causal Probabilis-
tic Network for Interpretation of Electromyographic Findings. Intl. Joint Conf. on Arti�cial
Intelligence (1987) 366-372.
[12] C. Kahn, L.M. Roberts, K. Wang, D. Jenks, and P. Haddawy, Preliminary Investigation of a
Bayesian Network for Mammographic Diagnosis of Breast Cancer, Am. Med. Informatics Assoc.
Conf. (1995) 208-212.
[13] D.E. Heckerman, An Empirical Comparison of Three Inference Methods, Conf. on Uncertainty
in Arti�cial Intelligence, (1988) 158-169.
[14] B.N. Nathwani, D.E. Heckerman, E.J. Horvitz, and T.L. Lincoln, Integrated expert systems
and videodisc in surgical pathology: an overview, Hum. Pathol. 21 (1990) 11-27.
[15] G.F. Cooper, The Computational Complexity of Probabilistic Inference Using Bayesian Belief
Networks, Arti�cial Intelligence 42 (1990) 393-405.
[16] M. Pradhan, G. Provan, and M. Henrion, Experimental Analysis of Large Belief Networks for
Medical Diagnosis, Am. Med. Informatics Assoc. Conf. (1995) 775-779.

24[17] O.K. Hejlesen, S. Andreassen, and S.K. Andersen, Implementation of a Learning Procedure for
Multiple Observations in a Diabetes Advisory System Based on Causal Probabilistic Networks,
in: S. Andreassen et al., eds., Arti�cial Intelligence in Med., (IOS Press, 1993) 63-74.
[18] C.F. Aliferis, and G.F. Cooper, A New Formalism for Temporal Modeling in Medical Decision-
Support Systems. Am. Med. Informatics Assoc. Conf. (1995) 213-217.
[19] M.G. Kahn, Modeling Time in Medical Decision-support Programs, Med. Decision Making 11
(1991) 249-264.
[20] W.J. Long, S. Naimi and M.G. Criscitiello, Development of a Knowledge Base for Diagnostic
Reasoning in Cardiology, Comput. Biomed. Res. 25 (1992) 292-311.
[21] H.J. Suermondt and G.F. Cooper, An Evaluation of Explanations of Probabilistic Inference.
Comput. Biomed. Res. 26 (1993) 242-254.
[22] P. Haddawy, J. Jacobson, C.E. Kahn, Generating Explanations and Tutorial Problems from
Bayesian Networks, Am. Med. Informatics Assoc. Conf. (1994) 770-774.
[23] D. Heckerman, A Bayesian Approach to Learning Causal Networks. Uncertainty in Arti�cial
Intelligence Conf. (1995) 285-295.
[24] H.S.F. Fraser, W.J. Long, S. Naimi, Testing a Heart Disease Program in a Practical Clinical
Setting. Arti�cial Intelligence in Med., AAAI-96 Spring Symposium, (1996) 55-58.
[25] W.J. Long, H. Fraser, S. Naimi, A Web Interface for the Heart Disease Program. Am. Med.
Informatics Assoc. Conf. (1996) 762-766.
[26] Heart Disease Program, http://medg.lcs.mit.edu/projects/hdp/