Realisation Inline-CVT test rig at the UCDavis HEV … · Realisation Inline-CVT test rig at the...
47
Realisation Inline-CVT test rig at the UCDavis HEV Center, USA G.J.C.M. Arts DCT 2005-121 Traineeship report Coach(es): dr. P.A. Veenhuizen Supervisor: prof. dr. ir. M. Steinbuch Technische Universiteit Eindhoven Department Mechanical Engineering Dynamics and Control Technology Group Eindhoven, September, 2005
Transcript of Realisation Inline-CVT test rig at the UCDavis HEV … · Realisation Inline-CVT test rig at the...
Realisation Inline-CVT test rig at the UCDavis HEV Center, USA
G.J.C.M. Arts
DCT 2005-121
Traineeship report Coach(es): dr. P.A. Veenhuizen Supervisor: prof. dr. ir. M. Steinbuch Technische Universiteit Eindhoven Department Mechanical Engineering Dynamics and Control Technology Group Eindhoven, September, 2005

Preface As a part of the Master degree in Mechanical Engineering at the Eindhoven University of Technology in The Netherlands an internship has been done at the Hybrid Electric Vehicle Center at the University of California in Davis, USA. Researchers at the Hybrid Electric Vehicle Center convert stock automobiles into a fuel efficient hybrid electric vehicle while enhancing the level of comfort and drivability that consumers demand. This report describes the realization of a test rig made to analyze the so called Inline-CVT transmission. This Inline-CVT transmission, only one has ever been build, is a brand new concept among the family of Continuously Variable Transmissions and has never been tested before. The Inline-CVT has several advantages (like application into hybrid vehicles) compared to other CVT transmissions. These advantages will be explained.
2

Table of Contents Chapter 1, Introduction to the Inline-CVT 5
Chapter 2, Test rig setup 7
AC150 electric motor and controller 7
Telma absorber 9
Chapter 3, Measuring on the Inline-CVT 10
Linear displacement sensor 11
Hal-effect sensors 12
Torque transducer, ingoing axle 15
Torque transducer, outgoing axle 17
Pressure sensors 19
Temperature sensor 20
Oil level gauge 21
Chapter 4, Hydraulic system 22
Chapter 5,SuperFlow system 25
ProConsole 25
ProSensor Box 26
WinDyn 27
Relay Box 28
Superflow wiring 29
Chapter 6, Using the test rig 31
Chapter 7, SuperFlow settings 33
PID tuning 33
Strain gauge calibration 34
WinDyn channel settings 35
SuperFlow/WinDyn configuration files 36
3

Chapter 8, Inline-CVT improvements 37
Heat 37
Noise 38
Pressure 38
Scratches 39
Symmetric hydraulics 39
Chapter 9, Machining at the Student Machine Shop 40
Conclusions 42
Recommendations 43
Literature 44
Appendix 1, Sellers contact information 45
4
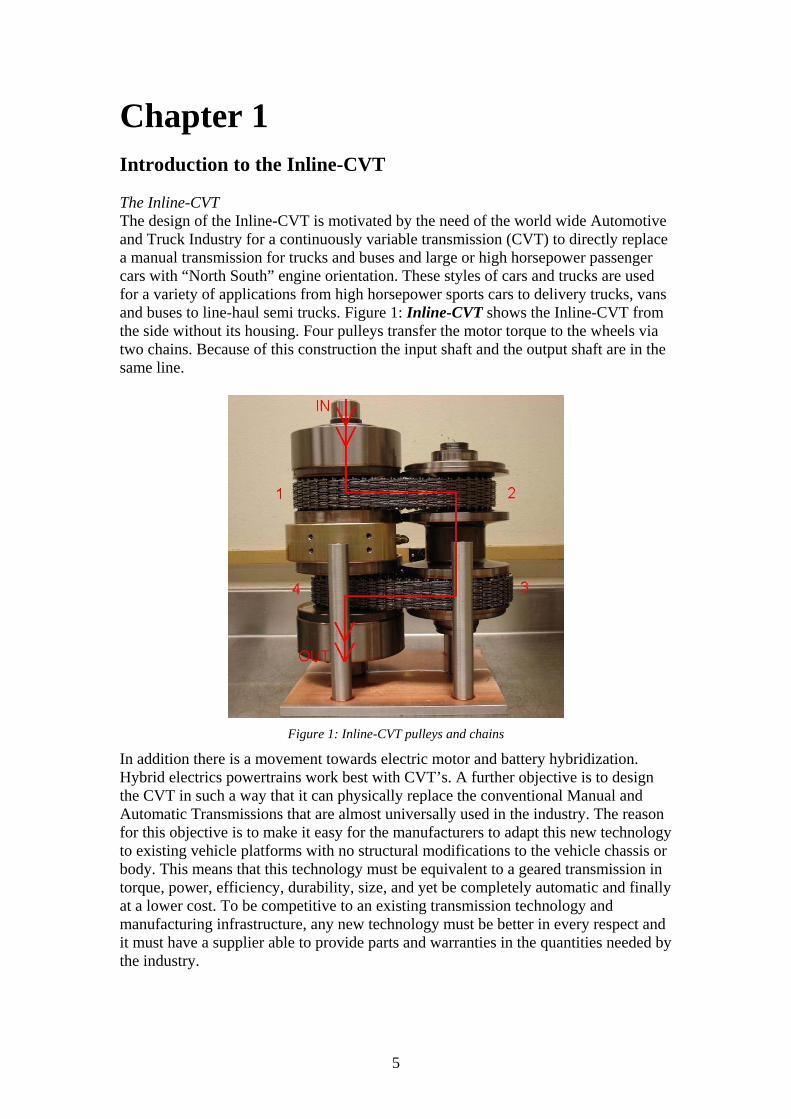
Chapter 1 Introduction to the Inline-CVT The Inline-CVT The design of the Inline-CVT is motivated by the need of the world wide Automotive and Truck Industry for a continuously variable transmission (CVT) to directly replace a manual transmission for trucks and buses and large or high horsepower passenger cars with “North South” engine orientation. These styles of cars and trucks are used for a variety of applications from high horsepower sports cars to delivery trucks, vans and buses to line-haul semi trucks. Figure 1: Inline-CVT shows the Inline-CVT from the side without its housing. Four pulleys transfer the motor torque to the wheels via two chains. Because of this construction the input shaft and the output shaft are in the same line.
Figure 1: Inline-CVT pulleys and chains
In addition there is a movement towards electric motor and battery hybridization. Hybrid electrics powertrains work best with CVT’s. A further objective is to design the CVT in such a way that it can physically replace the conventional Manual and Automatic Transmissions that are almost universally used in the industry. The reason for this objective is to make it easy for the manufacturers to adapt this new technology to existing vehicle platforms with no structural modifications to the vehicle chassis or body. This means that this technology must be equivalent to a geared transmission in torque, power, efficiency, durability, size, and yet be completely automatic and finally at a lower cost. To be competitive to an existing transmission technology and manufacturing infrastructure, any new technology must be better in every respect and it must have a supplier able to provide parts and warranties in the quantities needed by the industry.
5
The configuration of an inline CVT can now be used for a wide variety of vehicles constructed with inline engine and transmission configurations as with most trucks and buses in the world. Since the inline CVT is approximately the same size as a manual transmission, it can directly replace a manual transmission with the addition of a torque converter and a forward/reverse planetary gear set in front of the CVT. Or, it can convert a conventional transmission vehicle to a hybrid electric simply by adding an electric traction motor in front of the CVT, between the engine and CVT. In this way one eliminates the need for an engine starting device, a clutch, a torque converter, or a reverse gear. This flexibility in the use of this CVT provides vehicle manufacturers the possibility of providing all possible customer choices with this one element. What are its advantages? One of the advantages of the system is that a wide overall ratio span can be achieved with a very small movement of the clamping pistons and a small movement of the chain. The motion is approximately inversely proportional to the square root of the ratio, and it can be accomplished with much smaller diameter pulleys in comparison to single chain CVT’s. The reason for this is that the ratio of the first chain and pulley set is multiplied by the ratio of the second chain and pulley set thus the maximum ratio span is the product of the ratio spans of the two pulley sets. This means a small change in dimensions can make the square of the ratio change of a single pulley set CVT system. Thus the concept can be much more compact than a single pulley and chain system for the same span of ratios. Why need a test rig? The main reason to build a test rig is to prove the working principles of the Inline-CVT. The Inline-CVT is a complete new concept within the family of Continuously Variable Transmissions and has never been tested before. More complicated tests can be done when the working principles are proven. For example efficiency is an important issue; to compete with other transmissions the overall efficiency should be above 95%. An interesting efficiency can be measured at an output torque of 40Nm at a speed 1500 rpm. In a test setup it is also possible to break in the transmissions chains, since all transmissions are small machine shops with lost of friction while they are newly built. This last thing will be done in the first place, in this way it is also possible to get to know more about eventual children’s diseases which often appear to happen in all kinds of prototypes. To realize this test rig an electric motor and an absorber are attached to respectively the input and output shafts. In this way it will be possible to apply a load on the input shaft and to transfer this load to the output shaft. During this load transfer the transmission can be shifted and ratio, speed and torque related measurements can be done.
6
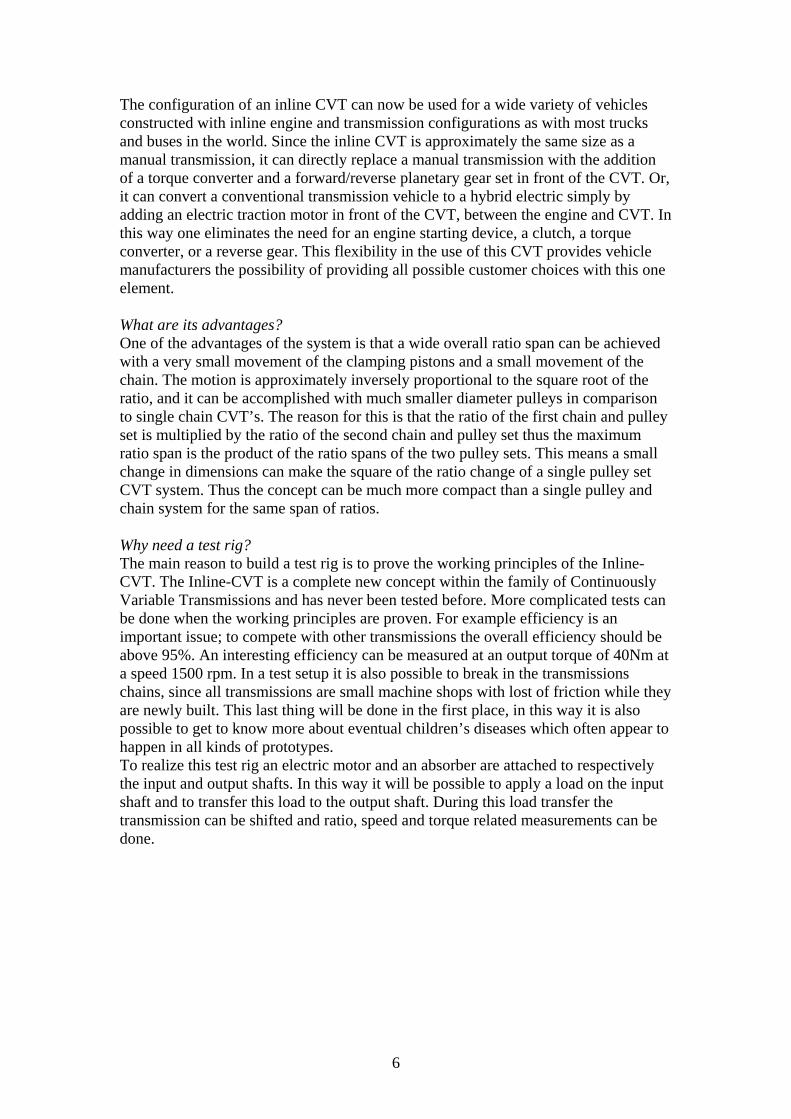
Chapter 2 Test rig setup
Figure 2: Inline-CVT test rig setup
AC150 electric motor and controller In order to analyse the Inline-CVT a test rig is designed. This test rig basically consists of 3 main parts. Starting at the left in Figure 2: Inline-CVT test rig setup with the AC150 electric motor: The AC150 motor is custom designed for automotive applications to maximize power/weight ratio and efficiency over a broad range of speed and power. It is a three-phase induction motor, with a four pole winding. The air cooled design provides for simplified design and maintenance as well as weight savings and cost reduction. The motor houses a winding temperature sensor and an encoder that provides speed and direction information to the PEU, a control box which will be explained later. A variable speed blower is driven from this PEU. The AC150 power cable has been magnetically isolated with grounded steel piping in order to prevent noise in the sensor signals coming from the Inline-CVT. This construction is shown in Figure 4: AC150 cable shielding. The maximum power of the AC150 is 150 kW and the maximum torque output will be 220 Nm over a range from 0 to 5000 rpm, shown in Figure 3: AC150 torque and power specifications.
7

Figure 3: AC150 torque and power specifications
Figure 4: AC150 cable shielding
To control the AC150 the Power Electronics Unit (PEU) Generation 1 made by AC Propulsion (see appendix 1) is used. This PEU is developed to operate in an electric vehicle in combination with the AC150. The PEU is a fully automatic device; it features ‘glass smooth’ torque under all load and speed conditions, regenerative breaking and even traction control. The integrated charger is able to charge the used batteries from 200W to 20kW from any power source between 100 and 250 VAC, 50 or 60 Hz. The battery used for the test rig consists of 28 serially connected 12 VDC automotive batteries. This custom made battery pack features a soft start system in order to prevent a peak load in the attached electric circuits.
8

When using this device in a test rig setup the following safety instructions need to be taken in account. - The AC150 speed may never exceed 12000 RPM - The PEU begins power limiting as battery voltage drops below 270 VDC and
goes to zero power at 240 VDC - Don’t turn off the system when either the motor or PEU fan are blowing. - From neutral state, transitions to forward or reverse are only allowed when the
given accelerator set point is below 2000 RPM. Transition to neutral is allowed under all conditions.
- The system starts power limiting when the PEU temperature is above 66 C (150 F) or motor temperature is above 185 C (365 F).
For more information about the AC150 and the PEU Gen 1 please see the Interface document provided by AC Propulsion, Inc. Telma Absorber The second part from the left in Figure 2: Inline-CVT test rig setup is the Inline-CVT followed by the Telma absorber. This retarder uses “eddy current” sensing technology. Individual coils are wrapped around the input and output shaft, which when induced with a current, applied a load to the shafts. The specifications are shown in Table 1: Telma absorber specifications.
Manufacturer Telma
Model CC100
Power Dissipation 75 kW
Maximum Speed 5000 rpm
Inertia 0.59 kg⋅m2
Table 1: Telma absorber specifications
Accurate torque and power measurements during steady state and dynamic testing require an estimation of unmeasured dynamometer losses and total dynamometer inertia. Unmeasured losses result from shaft mount bearing drag, driveshaft misalignment losses (universal joints), electric clutch brush drag, rotational aerodynamic drag and rotor fan drag. Information about absorber losses can be found in chapter 2.
9
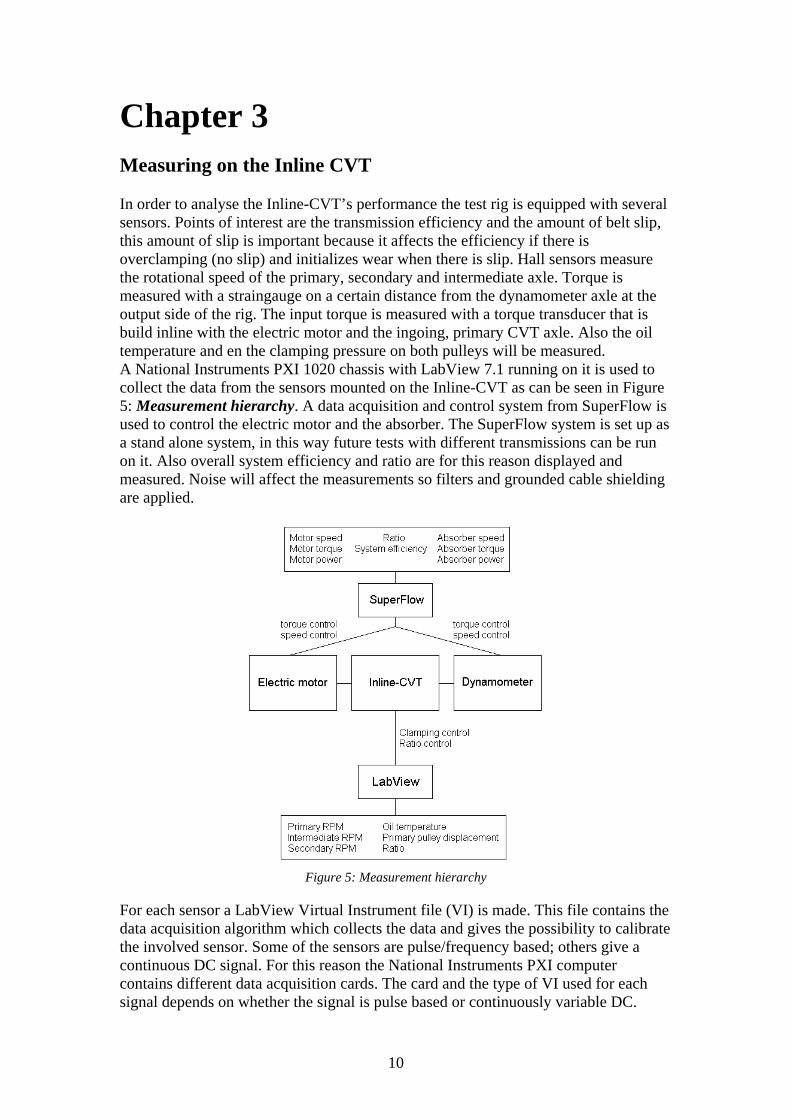
Chapter 3 Measuring on the Inline CVT In order to analyse the Inline-CVT’s performance the test rig is equipped with several sensors. Points of interest are the transmission efficiency and the amount of belt slip, this amount of slip is important because it affects the efficiency if there is overclamping (no slip) and initializes wear when there is slip. Hall sensors measure the rotational speed of the primary, secondary and intermediate axle. Torque is measured with a straingauge on a certain distance from the dynamometer axle at the output side of the rig. The input torque is measured with a torque transducer that is build inline with the electric motor and the ingoing, primary CVT axle. Also the oil temperature and en the clamping pressure on both pulleys will be measured. A National Instruments PXI 1020 chassis with LabView 7.1 running on it is used to collect the data from the sensors mounted on the Inline-CVT as can be seen in Figure 5: Measurement hierarchy. A data acquisition and control system from SuperFlow is used to control the electric motor and the absorber. The SuperFlow system is set up as a stand alone system, in this way future tests with different transmissions can be run on it. Also overall system efficiency and ratio are for this reason displayed and measured. Noise will affect the measurements so filters and grounded cable shielding are applied.
Figure 5: Measurement hierarchy
For each sensor a LabView Virtual Instrument file (VI) is made. This file contains the data acquisition algorithm which collects the data and gives the possibility to calibrate the involved sensor. Some of the sensors are pulse/frequency based; others give a continuous DC signal. For this reason the National Instruments PXI computer contains different data acquisition cards. The card and the type of VI used for each signal depends on whether the signal is pulse based or continuously variable DC.
10
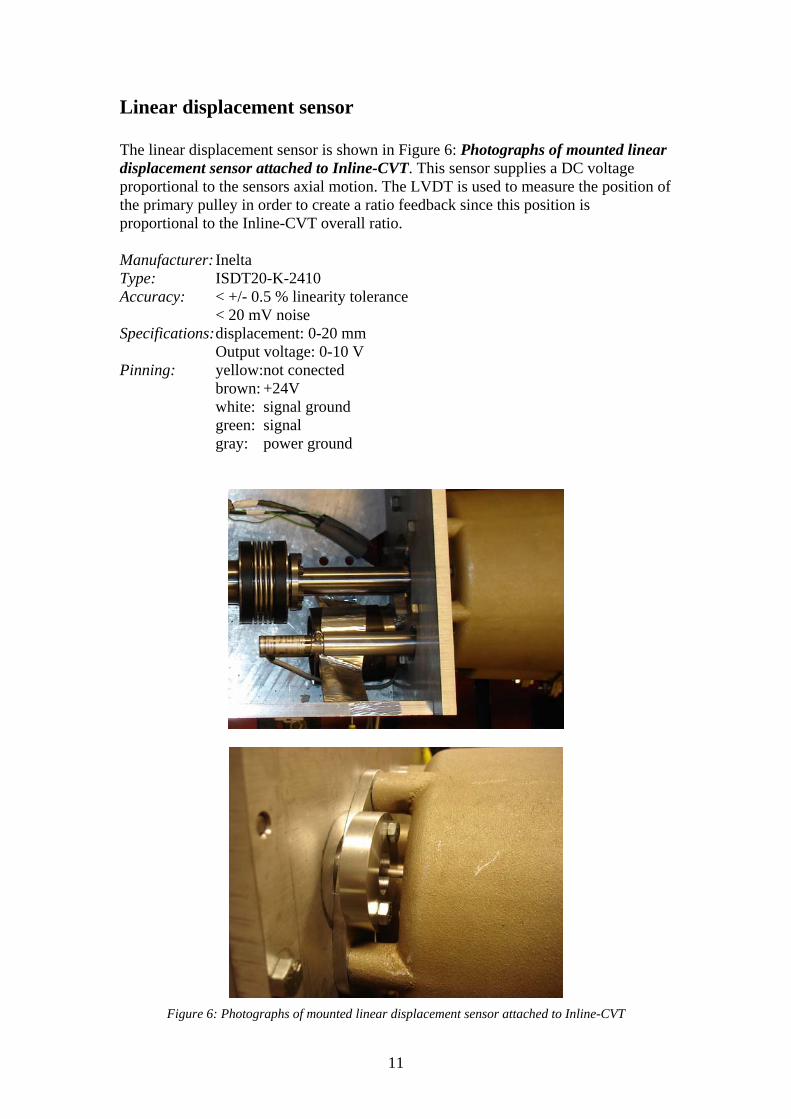
Linear displacement sensor The linear displacement sensor is shown in Figure 6: Photographs of mounted linear displacement sensor attached to Inline-CVT. This sensor supplies a DC voltage proportional to the sensors axial motion. The LVDT is used to measure the position of the primary pulley in order to create a ratio feedback since this position is proportional to the Inline-CVT overall ratio. Manufacturer: Inelta Type: ISDT20-K-2410 Accuracy: < +/- 0.5 % linearity tolerance < 20 mV noise Specifications: displacement: 0-20 mm Output voltage: 0-10 V Pinning: yellow:not conected brown: +24V white: signal ground green: signal gray: power ground
Figure 6: Photographs of mounted linear displacement sensor attached to Inline-CVT
11
Hall-effect sensors Hall sensors are counting passing ferrous obstacles; the number of obstacles per period of time is proportional to the rotational speed. This method is used to measure the rotational speed of the primary, secondary and intermediate shat of the Inline-CVT in order to calculate its slip and ratio. The used sensors are very small and have screw thread over the full length so they are easily mountable and adjustable in a threaded hole in the Inline CVT case. A nut on the end secures the position of the Hall sensor. See Figure 7: Photograph of used Hall-effect sensor. For sellers contact information see appendix 1. Using a flange with several gaps is the best way to measure RPM with Hall-effect sensors. Because of the less space that is available at the pulley ends, one suggested to simply count the passing balls of the CVT’s main bearings. If doing this one need take the bearing’s ratio in account; in other words the pulley speed is not 1:1 proportional to the ball carrier speed. Doing some research about tribology learns that slip is necessary for lubrication. Lubrication is present when two surfaces (the ball and the bearing surface) with in-between an oil layer have a relative speed (slip). This layer provides an oil pressure that keeps the two surfaces apart. This amount of slip gives an inaccurate measurement and is for this reason not suitable for CVT-belt slip calculation. Still, the best solution is to mount a segmented disc under the pulley secure nuts. There is space for a thin disc underneath those pulleys, this is calculated from available Inline-CVT drawings. There is no chance of interference with the passing parts of the bearings since the Hall sensor only measures passing obstacles within a maximum airgap of 0.160”. The final design of the segmented discs has 40 teeth with a width of 3 mm and a length of 5 mm. An outer diameter and a center hole of 50 mm makes the discs compatible with both the primary and secondary CVT pulley as well as the intermediate pulley. Multiplying the signal frequency by 1.5 gives the desired RPM value for the specific pulleys. A drawing of this disc can be found in Figure 8: Segmented disc. Ten of those discs (Figure 9: Photographs of segmented discs) were custom made from hardened steel at a company specialized in laser cutting. For contact information see appendix 1. Noise might affect the clarity of the square oscillating signal. For this reason the existing cables were interchanged by shielded cables which were connected to the common ground in the LabView computer. Alternative methods for RPM measurement like optical sensoring were considered but might not work because of refraction effects caused by the ATF oil that is spinning around in the CVT housing.
12

Manufacturer: Spectec (www.spectecsensors.com) Type: 0165A Lead wire Accuracy: rise/fall time: 0.10 micro sec. Specifications: Open face: =< 0.160”
Operating freq: 0 – 25 kHz Dimensions: diameter ¼”- 40, length 50 mm Input voltage: 3.5V @ 2 mA; 12 V @ 5 mA; 28 V @ 8 mA
Pinning: white: signal red: + power black: - power
Figure 7: Photograph of used Hall-effect sensor
Figure 8: Segmented disc
13

Figure 9: Photographs of segmented discs
14
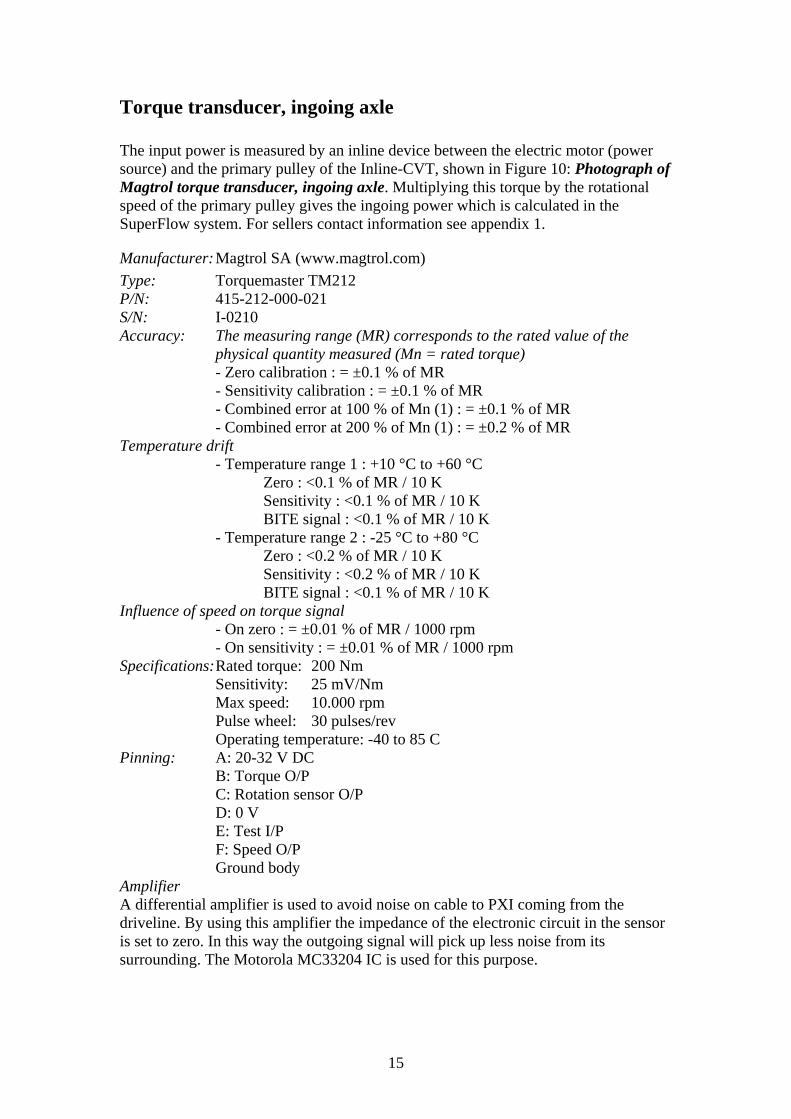
Torque transducer, ingoing axle The input power is measured by an inline device between the electric motor (power source) and the primary pulley of the Inline-CVT, shown in Figure 10: Photograph of Magtrol torque transducer, ingoing axle. Multiplying this torque by the rotational speed of the primary pulley gives the ingoing power which is calculated in the SuperFlow system. For sellers contact information see appendix 1.
Manufacturer: Magtrol SA (www.magtrol.com) Type: Torquemaster TM212 P/N: 415-212-000-021 S/N: I-0210 Accuracy: The measuring range (MR) corresponds to the rated value of the
physical quantity measured (Mn = rated torque) - Zero calibration : = ±0.1 % of MR - Sensitivity calibration : = ±0.1 % of MR - Combined error at 100 % of Mn (1) : = ±0.1 % of MR - Combined error at 200 % of Mn (1) : = ±0.2 % of MR
Temperature drift - Temperature range 1 : +10 °C to +60 °C
Zero : <0.1 % of MR / 10 K Sensitivity : <0.1 % of MR / 10 K BITE signal : <0.1 % of MR / 10 K
- Temperature range 2 : -25 °C to +80 °C Zero : <0.2 % of MR / 10 K Sensitivity : <0.2 % of MR / 10 K BITE signal : <0.1 % of MR / 10 K
Influence of speed on torque signal - On zero : = ±0.01 % of MR / 1000 rpm - On sensitivity : = ±0.01 % of MR / 1000 rpm
Specifications: Rated torque: 200 Nm Sensitivity: 25 mV/Nm Max speed: 10.000 rpm Pulse wheel: 30 pulses/rev Operating temperature: -40 to 85 C Pinning: A: 20-32 V DC B: Torque O/P C: Rotation sensor O/P D: 0 V E: Test I/P F: Speed O/P Ground body Amplifier A differential amplifier is used to avoid noise on cable to PXI coming from the driveline. By using this amplifier the impedance of the electronic circuit in the sensor is set to zero. In this way the outgoing signal will pick up less noise from its surrounding. The Motorola MC33204 IC is used for this purpose.
15
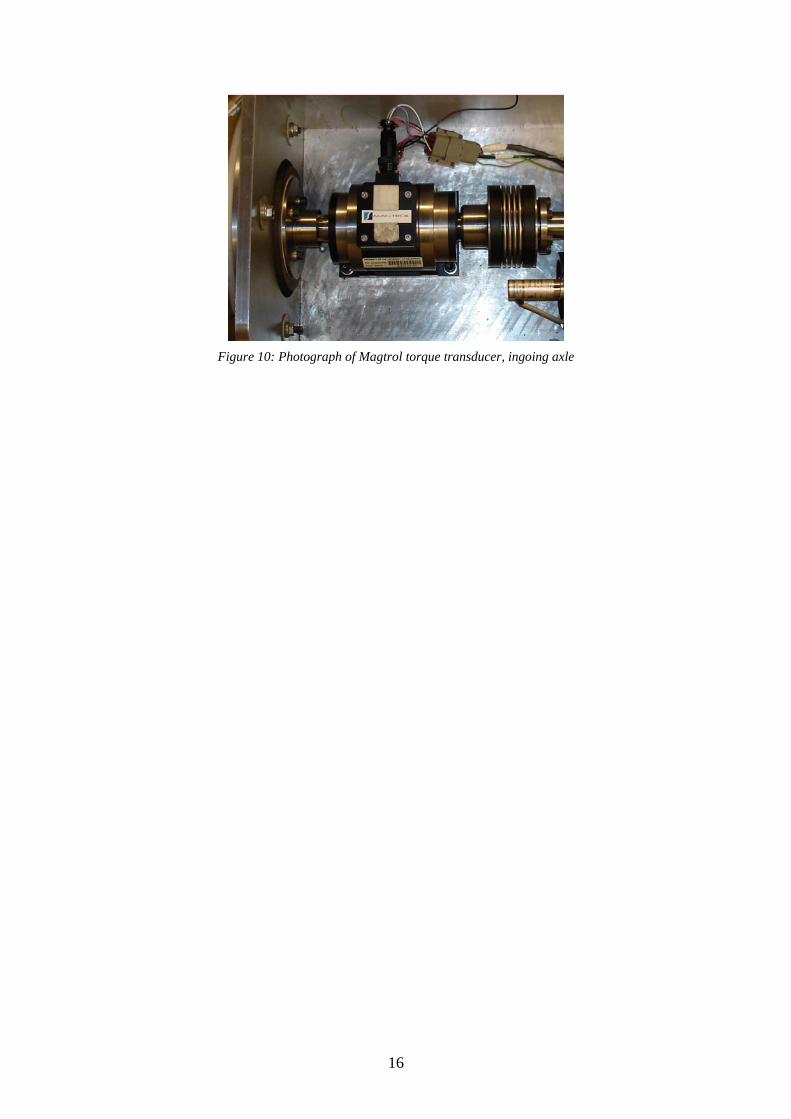
Figure 10: Photograph of Magtrol torque transducer, ingoing axle
16
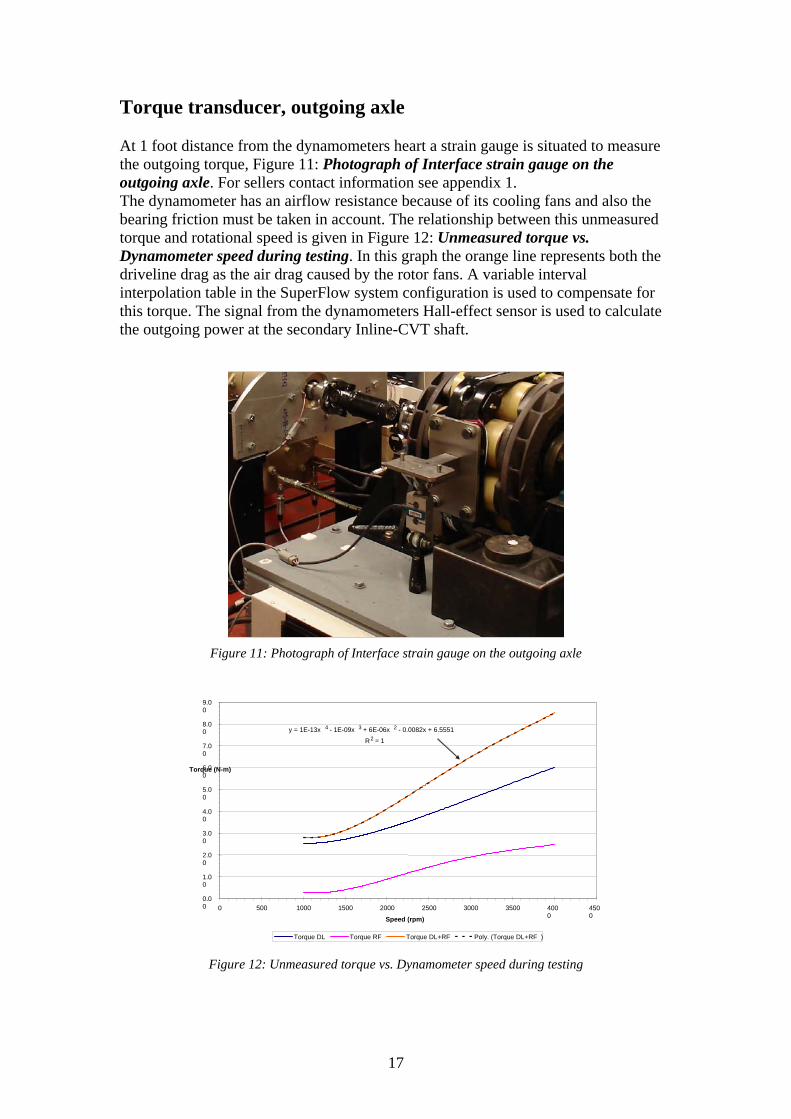
Torque transducer, outgoing axle At 1 foot distance from the dynamometers heart a strain gauge is situated to measure the outgoing torque, Figure 11: Photograph of Interface strain gauge on the outgoing axle. For sellers contact information see appendix 1. The dynamometer has an airflow resistance because of its cooling fans and also the bearing friction must be taken in account. The relationship between this unmeasured torque and rotational speed is given in Figure 12: Unmeasured torque vs. Dynamometer speed during testing. In this graph the orange line represents both the driveline drag as the air drag caused by the rotor fans. A variable interval interpolation table in the SuperFlow system configuration is used to compensate for this torque. The signal from the dynamometers Hall-effect sensor is used to calculate the outgoing power at the secondary Inline-CVT shaft.
Figure 11: Photograph of Interface strain gauge on the outgoing axle
y = 1E-13x 4 - 1E-09x 3 + 6E-06x 2 - 0.0082x + 6.5551
R2 = 1
0.00 1.00 2.00 3.00 4.00 5.00 6.0 Torque (N-m
500 pm
)
1000 1500 2000 2500
)3000 3500
Speed (r
L+RF Poly. (Torque DL+RF )L Torque RF Torque DTorque D
0
7.00 8.00 9.00
0
4500 400
0
Figure 12: Unmeasured torque vs. Dynamometer speed during testing
17

Strain gauge Manufacturer: Interface, Scottsdale Arizona (www.interfaceforce.com) Type: Force Transducer SSM-AJ-750 Accuracy: 0.02% nonrepeatability
0.0008%/°F (.0015%/°C) temp effect on output 0.025% creep More info on datasheet
S/N: E26204 Specifications: Capacity: 750 lbf-ft (1017 Nm, (*1.35582) Amplifier Manufacturer: Sensotec (www.sensotec.com) Type: Inline Amplifier P/N: 060-6827-04 S/N: 665718 Specifcations: Power: 18 - 28V DC Output: -10 - 10V DC Pinning: Signal input: white (signal)/green Power: red/black Signal output: white (signal)/green
18

Pressure sensors To use the pressure in the Inline-CVT’s clamping chambers for feedback purposes pressure sensors are installed close to the Inline-CVT’s oil lines, see Figure 13: Photograph of pressure sensors mounted on the Inline-CVT. Since the Inline-CVT is designed to operate at pressures up to 100 bar (1500 psi) the installed sensors can measure up to 172 bar (2500 psi). For sellers contact information see appendix 1. Manufacturer: MSI Type: MSP-400-2.5K-P-4-N-1 Accuracy: Zero thermal error: < +/-2% of FS Span thermal error: < +/-2% of FS Performance at 25 C: < 1% of FS Specifications: Max pressure: 172 bar (2500 psi) Operating temperature: -20 to 85 C (–4 to 185 F) Compensated temperature range: 0 to 55 C (30 to 130 F)
Figure 13: Photograph of pressure sensors mounted on the Inline-CVT
19
Temperature sensor
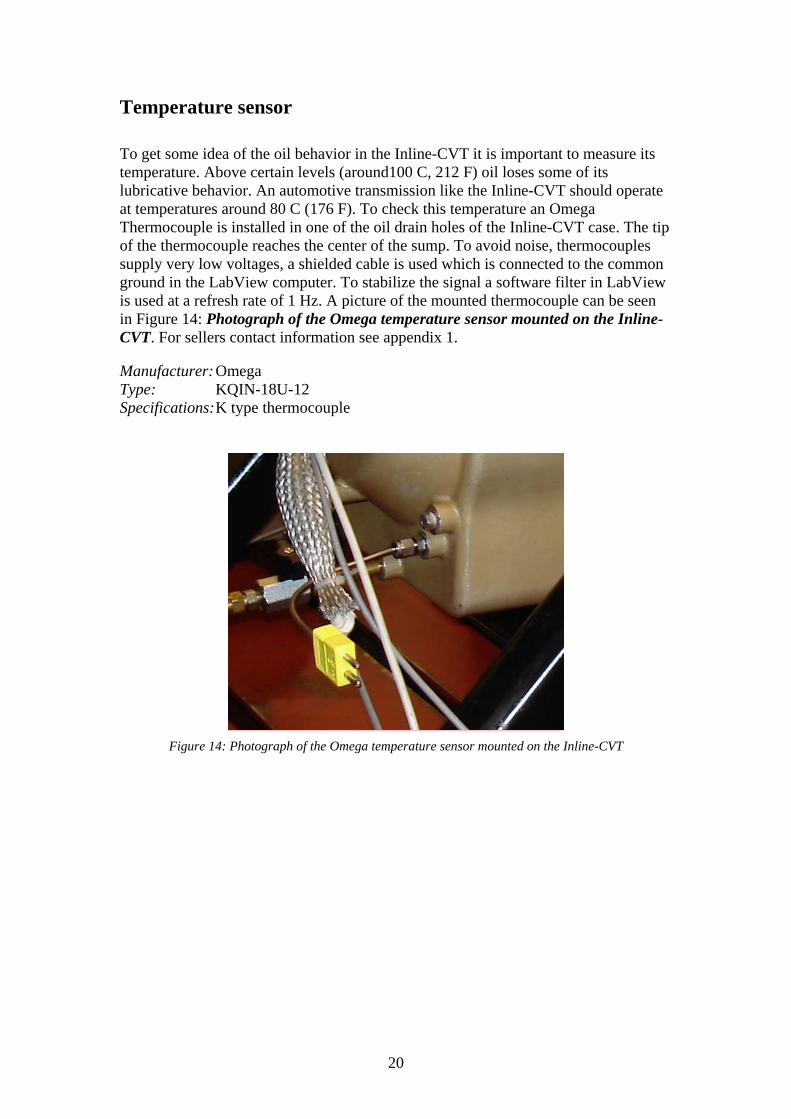
To get some idea of the oil behavior in the Inline-CVT it is important to measure its temperature. Above certain levels (around100 C, 212 F) oil loses some of its lubricative behavior. An automotive transmission like the Inline-CVT should operate at temperatures around 80 C (176 F). To check this temperature an Omega Thermocouple is installed in one of the oil drain holes of the Inline-CVT case. The tip of the thermocouple reaches the center of the sump. To avoid noise, thermocouples supply very low voltages, a shielded cable is used which is connected to the common ground in the LabView computer. To stabilize the signal a software filter in LabView is used at a refresh rate of 1 Hz. A picture of the mounted thermocouple can be seen in Figure 14: Photograph of the Omega temperature sensor mounted on the Inline-CVT. For sellers contact information see appendix 1. Manufacturer: Omega Type: KQIN-18U-12 Specifications: K type thermocouple
Figure 14: Photograph of the Omega temperature sensor mounted on the Inline-CVT
20
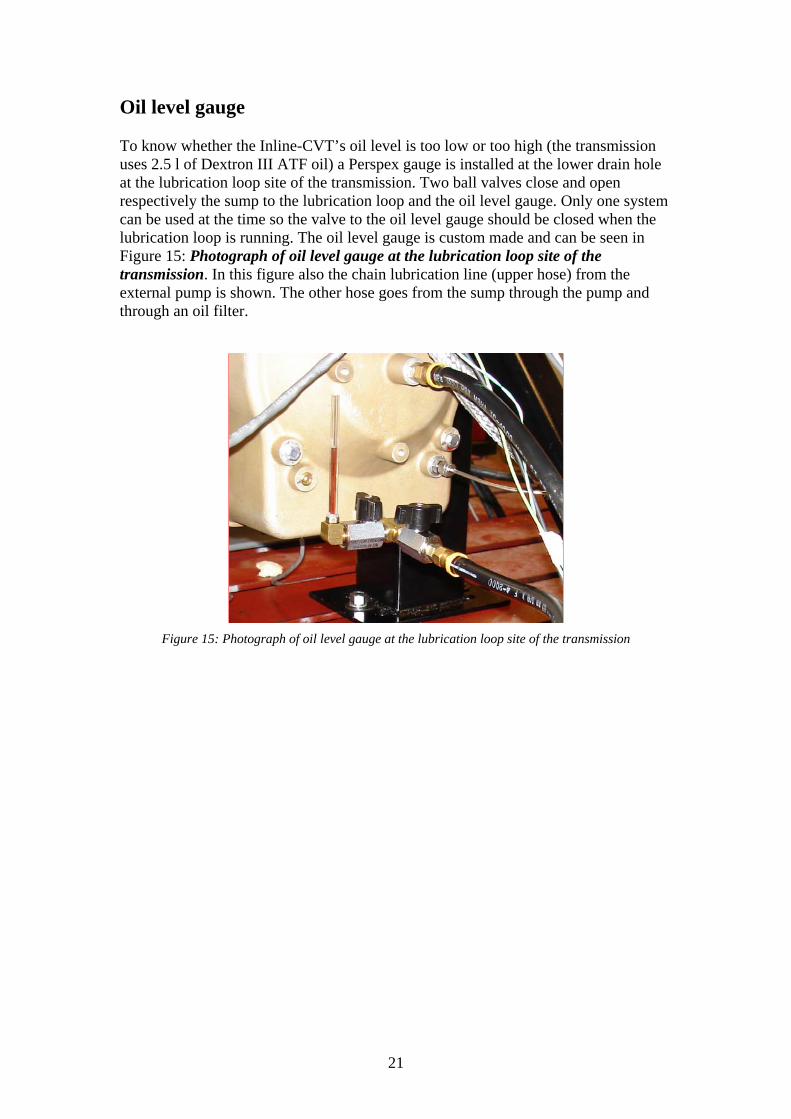
Oil level gauge To know whether the Inline-CVT’s oil level is too low or too high (the transmission uses 2.5 l of Dextron III ATF oil) a Perspex gauge is installed at the lower drain hole at the lubrication loop site of the transmission. Two ball valves close and open respectively the sump to the lubrication loop and the oil level gauge. Only one system can be used at the time so the valve to the oil level gauge should be closed when the lubrication loop is running. The oil level gauge is custom made and can be seen in Figure 15: Photograph of oil level gauge at the lubrication loop site of the transmission. In this figure also the chain lubrication line (upper hose) from the external pump is shown. The other hose goes from the sump through the pump and through an oil filter.
Figure 15: Photograph of oil level gauge at the lubrication loop site of the transmission
21
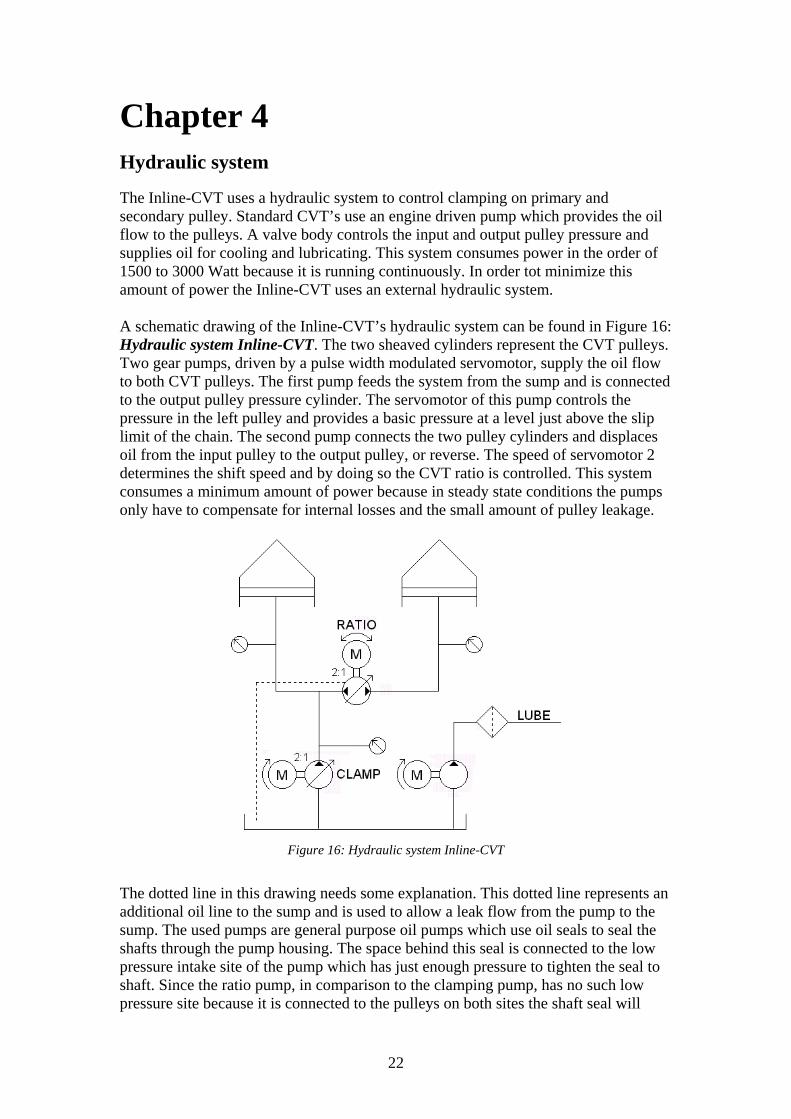
Chapter 4 Hydraulic system The Inline-CVT uses a hydraulic system to control clamping on primary and secondary pulley. Standard CVT’s use an engine driven pump which provides the oil flow to the pulleys. A valve body controls the input and output pulley pressure and supplies oil for cooling and lubricating. This system consumes power in the order of 1500 to 3000 Watt because it is running continuously. In order tot minimize this amount of power the Inline-CVT uses an external hydraulic system. A schematic drawing of the Inline-CVT’s hydraulic system can be found in Figure 16: Hydraulic system Inline-CVT. The two sheaved cylinders represent the CVT pulleys. Two gear pumps, driven by a pulse width modulated servomotor, supply the oil flow to both CVT pulleys. The first pump feeds the system from the sump and is connected to the output pulley pressure cylinder. The servomotor of this pump controls the pressure in the left pulley and provides a basic pressure at a level just above the slip limit of the chain. The second pump connects the two pulley cylinders and displaces oil from the input pulley to the output pulley, or reverse. The speed of servomotor 2 determines the shift speed and by doing so the CVT ratio is controlled. This system consumes a minimum amount of power because in steady state conditions the pumps only have to compensate for internal losses and the small amount of pulley leakage.
Figure 16: Hydraulic system Inline-CVT
The dotted line in this drawing needs some explanation. This dotted line represents an additional oil line to the sump and is used to allow a leak flow from the pump to the sump. The used pumps are general purpose oil pumps which use oil seals to seal the shafts through the pump housing. The space behind this seal is connected to the low pressure intake site of the pump which has just enough pressure to tighten the seal to shaft. Since the ratio pump, in comparison to the clamping pump, has no such low pressure site because it is connected to the pulleys on both sites the shaft seal will
22
undergo a high pressure which blows this seal out. To minimize the amount of oil flowing through this leak line a shrink fit bushing is made to close the pumps internal oil lines, shown left in Figure 17: Adapted ratio pump. The remaining leak is caused by the flow along the shaft and will be guided to the sump. The adapted pump is shown on the right in Figure 17: Adapted ratio pump.
Figure 17: Adapted ratio pump
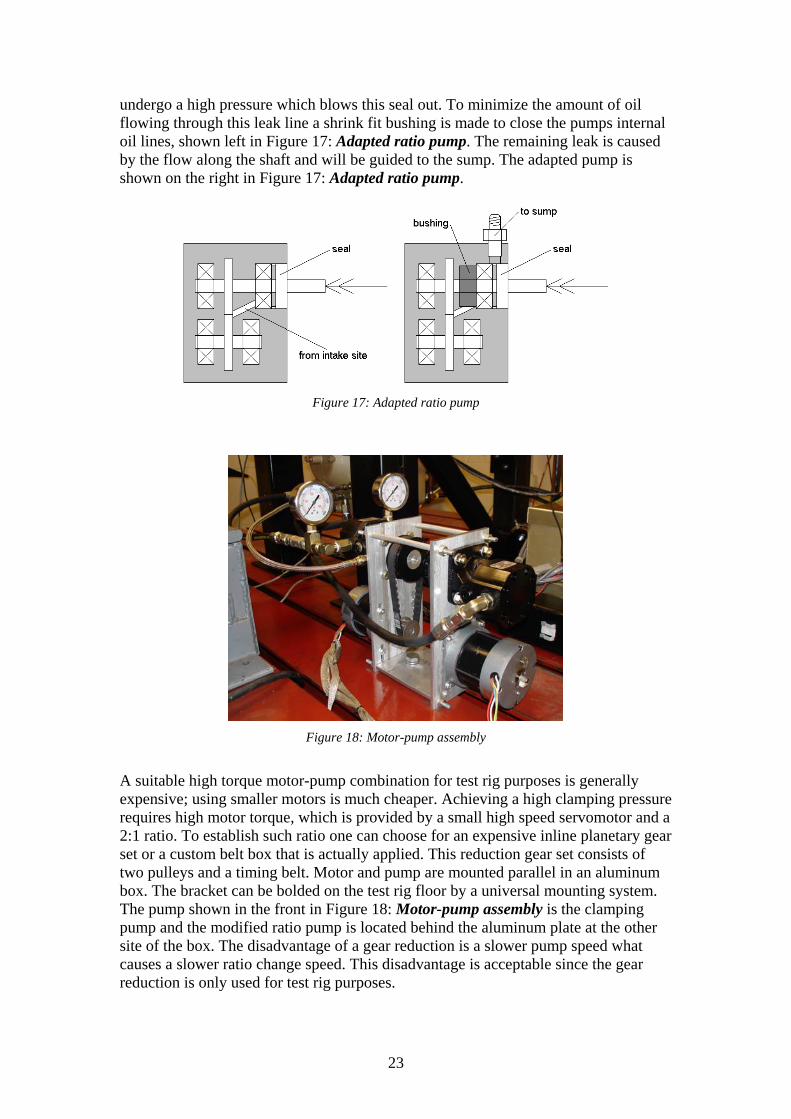
Figure 18: Motor-pump assembly
A suitable high torque motor-pump combination for test rig purposes is generally expensive; using smaller motors is much cheaper. Achieving a high clamping pressure requires high motor torque, which is provided by a small high speed servomotor and a 2:1 ratio. To establish such ratio one can choose for an expensive inline planetary gear set or a custom belt box that is actually applied. This reduction gear set consists of two pulleys and a timing belt. Motor and pump are mounted parallel in an aluminum box. The bracket can be bolded on the test rig floor by a universal mounting system. The pump shown in the front in Figure 18: Motor-pump assembly is the clamping pump and the modified ratio pump is located behind the aluminum plate at the other site of the box. The disadvantage of a gear reduction is a slower pump speed what causes a slower ratio change speed. This disadvantage is acceptable since the gear reduction is only used for test rig purposes.
23

Hydraulic pumps Two types of pumps were used to feed the hydraulic system. In the first place Fenner Stone hydraulic pumps were used in the test setup (for sellers contact information see appendix 1). These pumps have the smallest available displacement in order to gain high pressures, are suitable to operate bi-directional and are cheap. The following specifications belong to those pumps: Displacement 1 mm3/rev (0.06 CUI/rev) Maximum continuous pressure 172 bar (2500 psi) Maximum speed 3450 RPM Flow 3.86 liter/min (1.0 GPM) @ 3600 RPM Intake port 3/8” NPT Outlet port 1/4” NPT Dimensions 95x108x76mm (3-3/4” x 4-1/4”x3”) Weight 2.2 kg (5 lb) Price $129,-
Table 2: Fenner Stone pump specifications
After applying the earlier mentioned modifications the pumps started to leak. Steel caps which cover the bearings of the ratio pumps secondary shaft popped out above 30 bar (500 psi). After MIG welding those caps to the pump housing, still some oil flowed through the weld. For this reason both pumps are replaced by Haldex gearpumps (G1204C3A300N00), with the following specifications: Displacement 1.1 mm3/rev (0.065 CUI/rev) Maximum continuous pressure 207 bar (3000 psi) Maximum speed 4000 RPM Flow 3.86 liter/min (1.0 GPM) @ 3600 RPM Intake port SAE Outlet port SAE Dimensions 71x80x83mm (2.81”x3.16”x3.28”) Weight 2.2 kg (5 lb) Price $265,-
Table 3: Haldex-Barnes pump specifications
The modifications shown in Figure 17: Adapted ratio pump are applied to the Haldex ratio pump. This construction appeared to perform without any leaks.
24
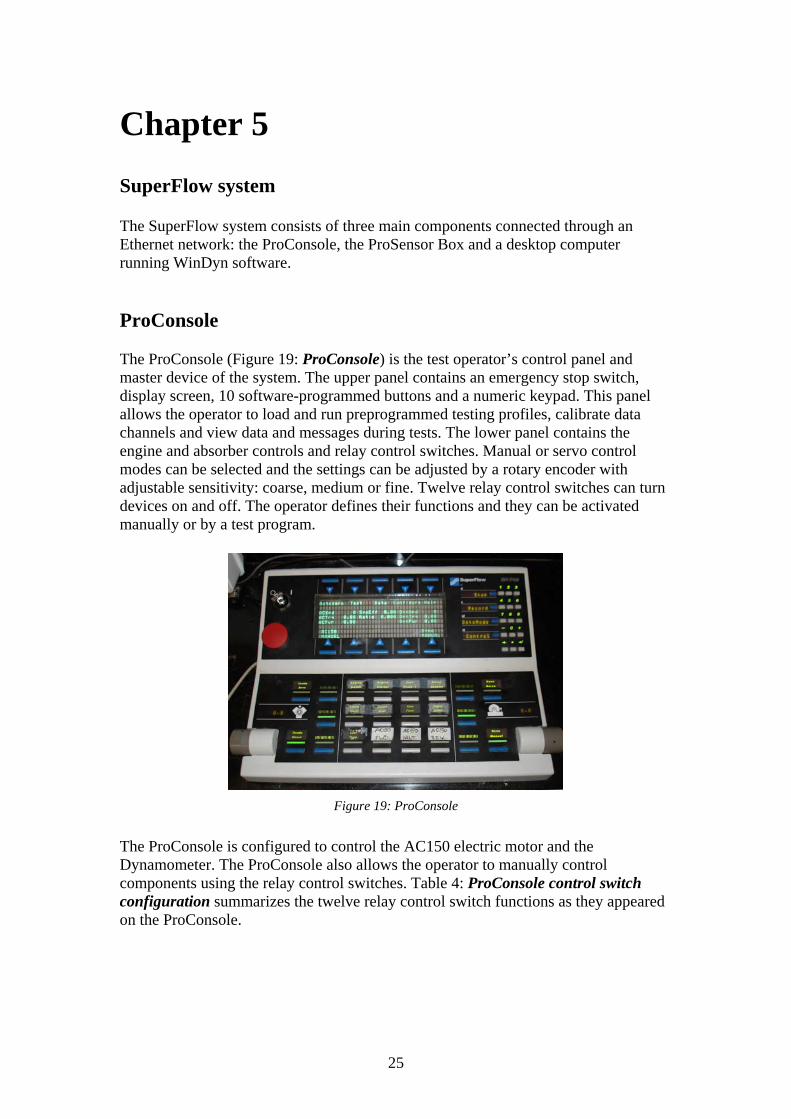
Chapter 5 SuperFlow system The SuperFlow system consists of three main components connected through an Ethernet network: the ProConsole, the ProSensor Box and a desktop computer running WinDyn software. ProConsole The ProConsole (Figure 19: ProConsole) is the test operator’s control panel and master device of the system. The upper panel contains an emergency stop switch, display screen, 10 software-programmed buttons and a numeric keypad. This panel allows the operator to load and run preprogrammed testing profiles, calibrate data channels and view data and messages during tests. The lower panel contains the engine and absorber controls and relay control switches. Manual or servo control modes can be selected and the settings can be adjusted by a rotary encoder with adjustable sensitivity: coarse, medium or fine. Twelve relay control switches can turn devices on and off. The operator defines their functions and they can be activated manually or by a test program.
Figure 19: ProConsole
The ProConsole is configured to control the AC150 electric motor and the Dynamometer. The ProConsole also allows the operator to manually control components using the relay control switches. Table 4: ProConsole control switch configuration summarizes the twelve relay control switch functions as they appeared on the ProConsole.
25

Not used Not used Not used System Reset
EM Clutch Helper motor Absorber Power Not used
Not used AC150 forward AC150 neutral AC150 reverse Table 4: ProConsole control switch configuration
ProSensor Box The ProSensor Box (Figure 20: ProSensor Box) records and temporarily stores all data measured during a test. It has 10 configurable analog inputs, 16 Type K thermocouple inputs, 10 pressure inputs and 6 frequency inputs capable of sampling at rates up to 1 kHz. It also records ambient air temperature, barometric pressure and humidity. Eight LCD displays mounted on the front panel show the real-time test data. The ProSensor Box calculates and executes the control algorithms when the engine and absorber are operated in servo mode.
Figure 20: ProSensor Box
The ProSensor Box is considered the master recording device for all test data. This insures accurate interpretation of results since a common time stamp exists for all data channels. All data signals capable of being recorded by the ProSensor Box are routed to it using appropriate shielding to minimize signal corruption. The ProSensor Box is positioned behind the PEU box in order to minimize the length of signal wires. Table 6: SuperFlow channel settings in chapter 7 lists all of the ProSensor Box data recording channels and identifies the items measured during testing.
26
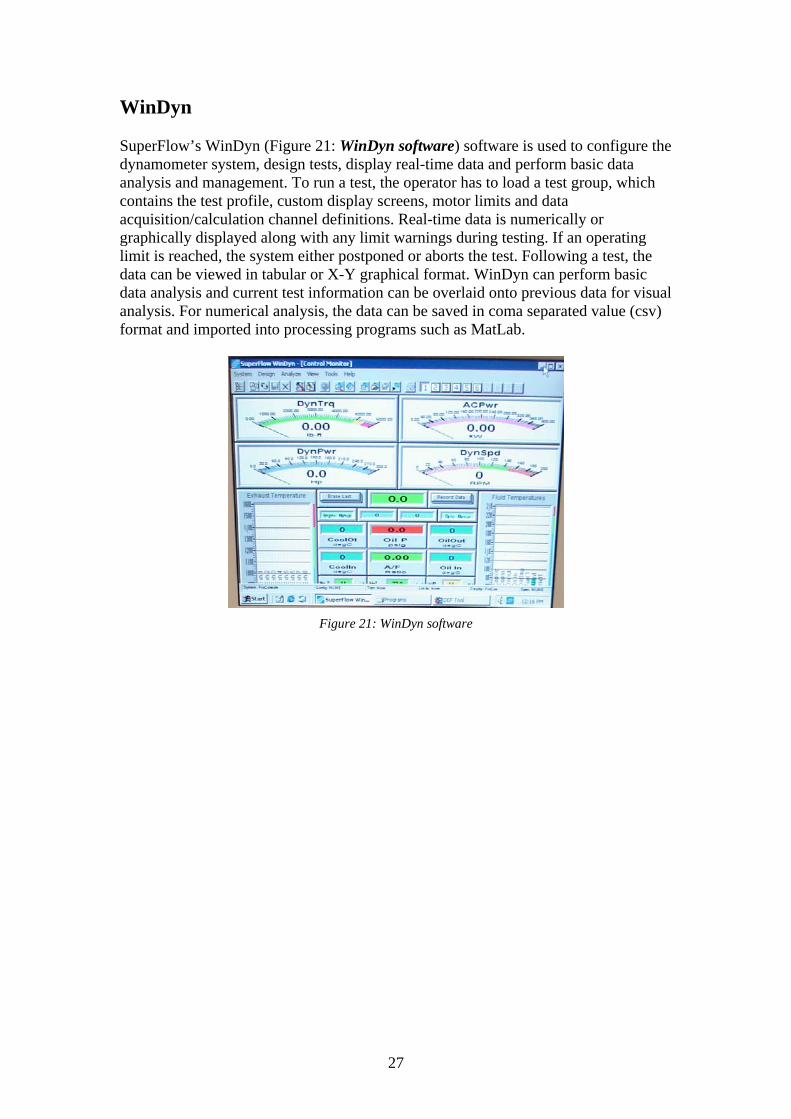
WinDyn SuperFlow’s WinDyn (Figure 21: WinDyn software) software is used to configure the dynamometer system, design tests, display real-time data and perform basic data analysis and management. To run a test, the operator has to load a test group, which contains the test profile, custom display screens, motor limits and data acquisition/calculation channel definitions. Real-time data is numerically or graphically displayed along with any limit warnings during testing. If an operating limit is reached, the system either postponed or aborts the test. Following a test, the data can be viewed in tabular or X-Y graphical format. WinDyn can perform basic data analysis and current test information can be overlaid onto previous data for visual analysis. For numerical analysis, the data can be saved in coma separated value (csv) format and imported into processing programs such as MatLab.
Figure 21: WinDyn software
27
Relay Box
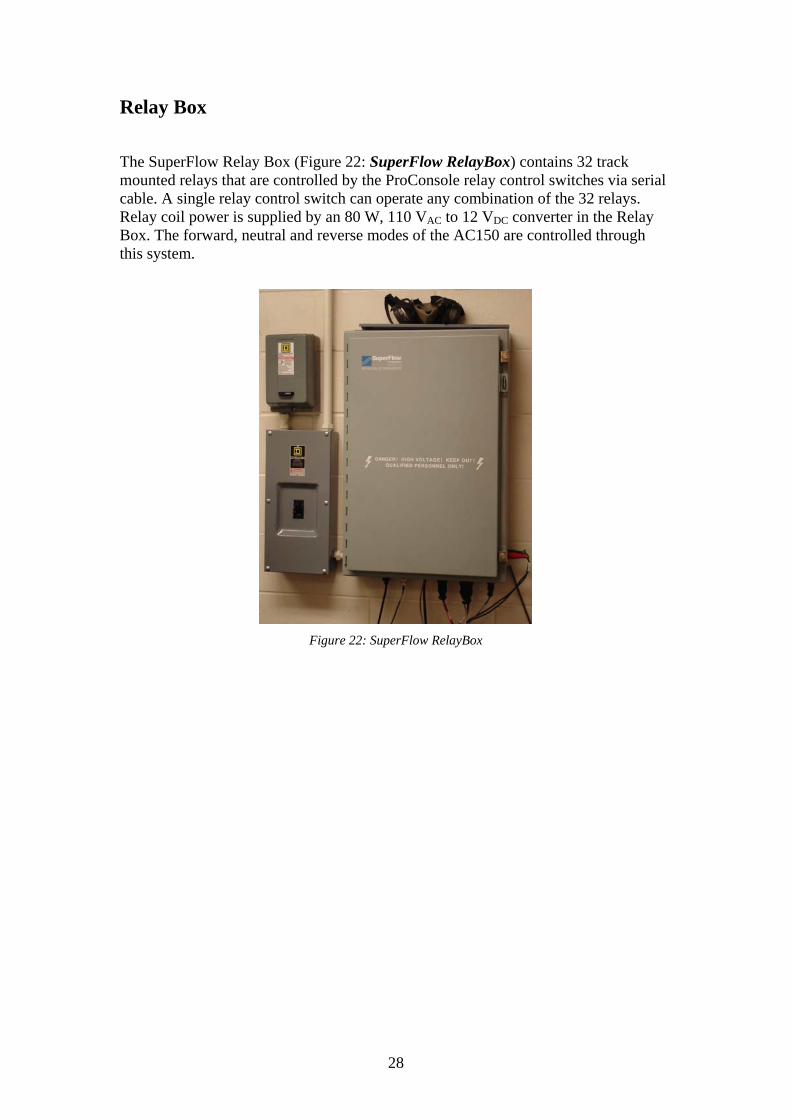
The SuperFlow Relay Box (Figure 22: SuperFlow RelayBox) contains 32 track mounted relays that are controlled by the ProConsole relay control switches via serial cable. A single relay control switch can operate any combination of the 32 relays. Relay coil power is supplied by an 80 W, 110 VAC to 12 VDC converter in the Relay Box. The forward, neutral and reverse modes of the AC150 are controlled through this system.
Figure 22: SuperFlow RelayBox
28
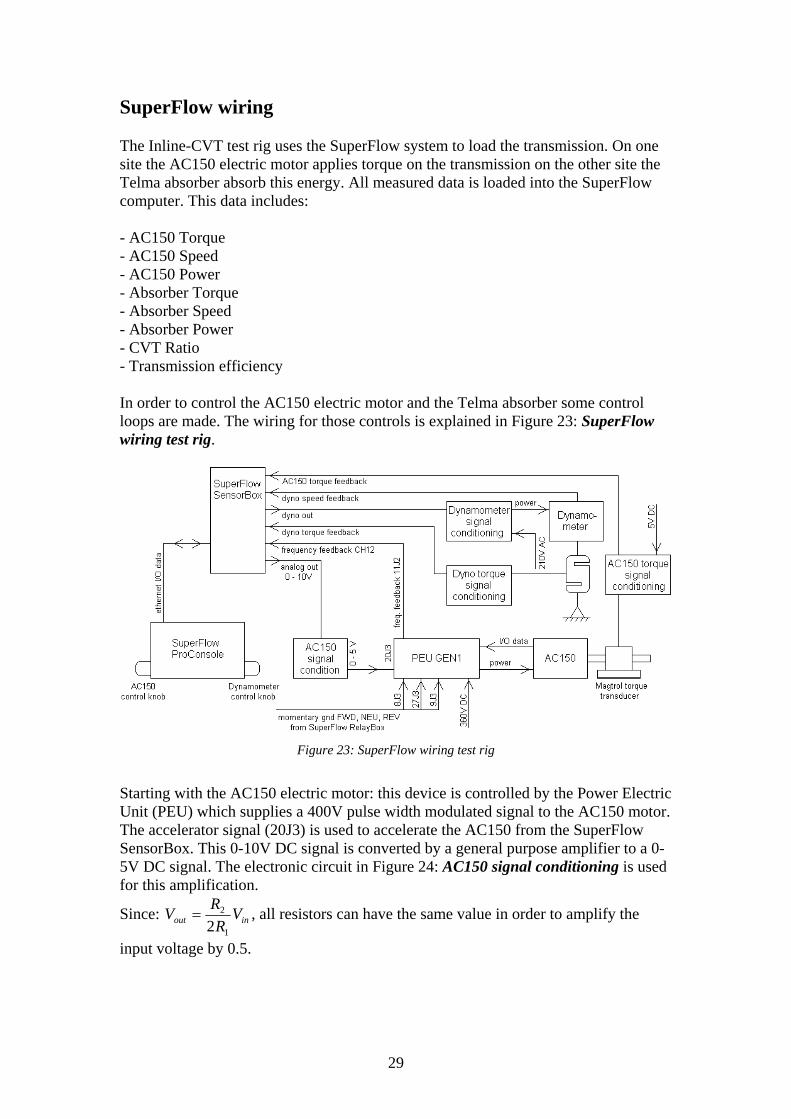
SuperFlow wiring The Inline-CVT test rig uses the SuperFlow system to load the transmission. On one site the AC150 electric motor applies torque on the transmission on the other site the Telma absorber absorb this energy. All measured data is loaded into the SuperFlow computer. This data includes: - AC150 Torque - AC150 Speed - AC150 Power - Absorber Torque - Absorber Speed - Absorber Power - CVT Ratio - Transmission efficiency In order to control the AC150 electric motor and the Telma absorber some control loops are made. The wiring for those controls is explained in Figure 23: SuperFlow wiring test rig.
Figure 23: SuperFlow wiring test rig
Starting with the AC150 electric motor: this device is controlled by the Power Electric Unit (PEU) which supplies a 400V pulse width modulated signal to the AC150 motor. The accelerator signal (20J3) is used to accelerate the AC150 from the SuperFlow SensorBox. This 0-10V DC signal is converted by a general purpose amplifier to a 0-5V DC signal. The electronic circuit in Figure 24: AC150 signal conditioning is used for this amplification.
Since: inout VR
RV1
2
2= , all resistors can have the same value in order to amplify the
input voltage by 0.5.
29

Figure 24: AC150 signal conditioning
The PEU generates a pulse signal (11J2) which frequency is proportional to the rotational speed of the AC150. This signal is used as a feedback to control the AC150 speed. Connecting 8J3, 27J3 and 9J3 respectively to a momentary ground switches the PEU to forward, neutral and reverse mode. This is done by the SuperFlow RelayBox which is connected to the ProConsole through the Ethernet connection. It is also possible to control the input torque by using the AC150 torque feedback signal from the Magtrol torque transducer which is connected to channel 4 on the SuperFlow SensorBox. A filter connected close to this torque transducer is designed to avoid noise on the wires to the SensorBox. This filter (Figure 25: Magtrol signal conditioning) basically sets the torque transducers impedance to zero in order to make signal less sensible for noise. The Motorola MC33204P rail-to-rail amplifier used for this circuit is fed by an external 5V DC power supply, connected to pin 4 and 7 (not shown).
Figure 25: Magtrol signal conditioning
To be able to control the Telma absorber the SuperFlow absorber controller converts 240 VAC wall power to a 192 VDC control signal. The controller, which is mounted to the rig base side, receives its command signals from the ProSensor Box. Torque and speed feedback are realized by signals from the strain gauge and the Hall sensor mounted on the absorber.
30

Chapter 6 Using the test rig Before using the Inline-CVT test rig some remarks need to be taken in account. The first point of attention is safety since the test rig uses high voltages (400 VDC) and uncovered U-joint shafts. So a safety check needs to be done in the first place, this is where the start up procedure begins. After starting the SuperFlow system and the National Instruments PXI, one can start the power sources and start testing. Underneath a punctual outline is given which needs to be followed in order to use the test rig correctly. This outline generally consists of three parts; safety checks, starting the National Instruments system for controlling and analyzing the Inline-CVT and starting the SuperFlow system to control and analyse the dynamometer stand. Safety checks/remarks
1. Make sure both test rig shafts can rotate freely 2. Make sure the absorber is covered with the available steel covers 3. Before applying torque to the system manually check for clamping
pressure 4. Check oil level, level gauge should be on ¾. Top up with Dextron III ATF
(the Inline-CVT uses 2.5 liters). 5. The power to the AC150 electric motor can be terminated at any time
when pressing ‘AC150 neutral’ button on the ProConsole National Instruments system
1. Start the NI PXI chassis 2. Start LabView 7.1 software 3. Open file: startup.vi 4. Turn servo motor power source ON and set voltage to 150 VDC 5. Check red and green lights on servo amplifier box, both should be ON 6. Start LVDT power source (24 VDC) 7. Start lubrication pump 8. Run VI file and apply pressure 9. Check for clamping pressure before spinning the test rig 10. Close startup.vi and open working_front_panel.vi
SuperFlow system
1. Turn SuperFlow main switch ON 2. Turn SuperFlow ProConsole ON for 5 seconds and turn it back OFF 3. Turn SuperFlow SensorBox ON 4. Turn SuperFlow ProConsole ON 5. Start PC, log in = enter 6. Start WinDyn software 7. Check if network connection is available 8. Open screen in WinDyn: Design Test Group PROCON.tpg, sensors
will autozero now, this can also be done manually by autozeroing channel 2 and channel 4.
31
9. Change AC150 servo control mode* to ACTrq (torque controlled) or ACSpd (speed controlled) in order to control the electric motor
10. Change Dyno servo control mode* to DynTrq (torque controlled) or DynSpd (speed controlled) in order to control the absorber
11. Turn 12V battery ON and softstart high voltage battery box by turning the first switch ON, pressing the SS button for about 10 seconds and turning the second switch ON
12. Check battery voltage (should be above 270 VDC) 13. Turn PEU switch box to MAIN ON and enable the PEU system
*: The internal PID controllers can be tuned individually, see next chapter Charging batteries
1. Softstart batteries as in 11. 2. Make sure wall power is turned OFF 3. Plug PEU cable to 208 VAC wall contact 4. Turn wall power ON 5. PEU will now charge fully automated
32
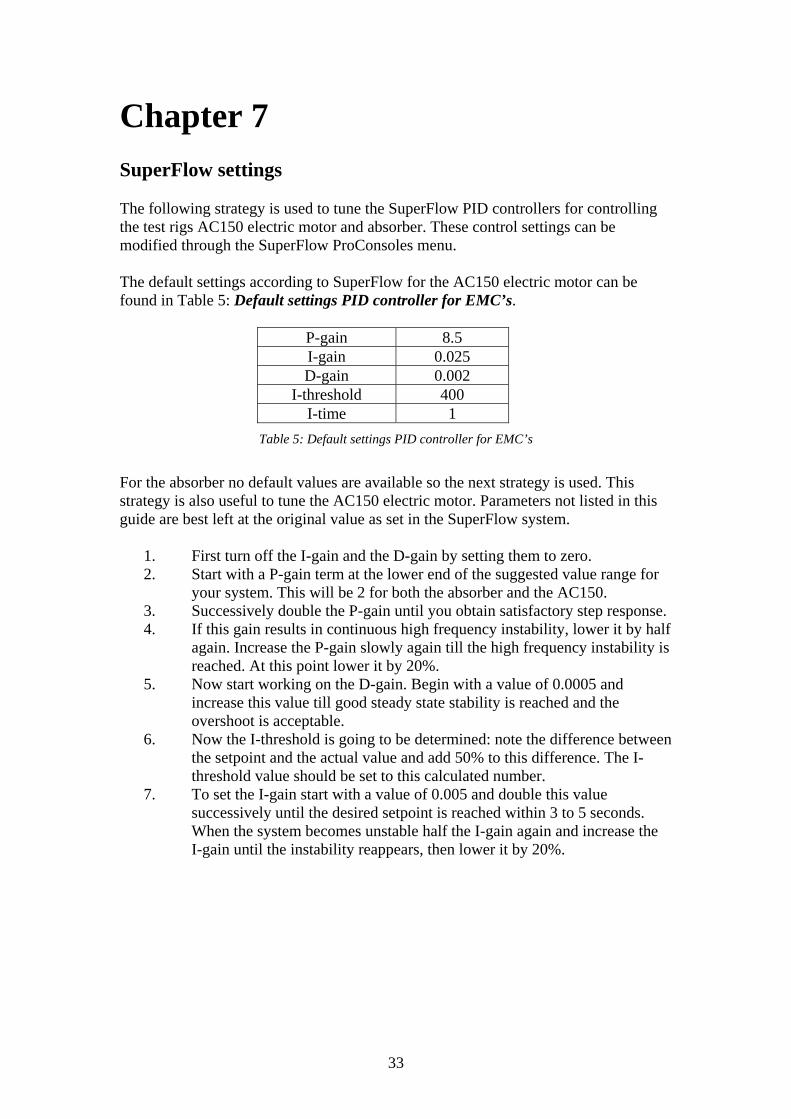
Chapter 7 SuperFlow settings The following strategy is used to tune the SuperFlow PID controllers for controlling the test rigs AC150 electric motor and absorber. These control settings can be modified through the SuperFlow ProConsoles menu. The default settings according to SuperFlow for the AC150 electric motor can be found in Table 5: Default settings PID controller for EMC’s.
P-gain 8.5 I-gain 0.025 D-gain 0.002
I-threshold 400 I-time 1
Table 5: Default settings PID controller for EMC’s For the absorber no default values are available so the next strategy is used. This strategy is also useful to tune the AC150 electric motor. Parameters not listed in this guide are best left at the original value as set in the SuperFlow system.
1. First turn off the I-gain and the D-gain by setting them to zero. 2. Start with a P-gain term at the lower end of the suggested value range for
your system. This will be 2 for both the absorber and the AC150. 3. Successively double the P-gain until you obtain satisfactory step response. 4. If this gain results in continuous high frequency instability, lower it by half
again. Increase the P-gain slowly again till the high frequency instability is reached. At this point lower it by 20%.
5. Now start working on the D-gain. Begin with a value of 0.0005 and increase this value till good steady state stability is reached and the overshoot is acceptable.
6. Now the I-threshold is going to be determined: note the difference between the setpoint and the actual value and add 50% to this difference. The I-threshold value should be set to this calculated number.
7. To set the I-gain start with a value of 0.005 and double this value successively until the desired setpoint is reached within 3 to 5 seconds. When the system becomes unstable half the I-gain again and increase the I-gain until the instability reappears, then lower it by 20%.
33
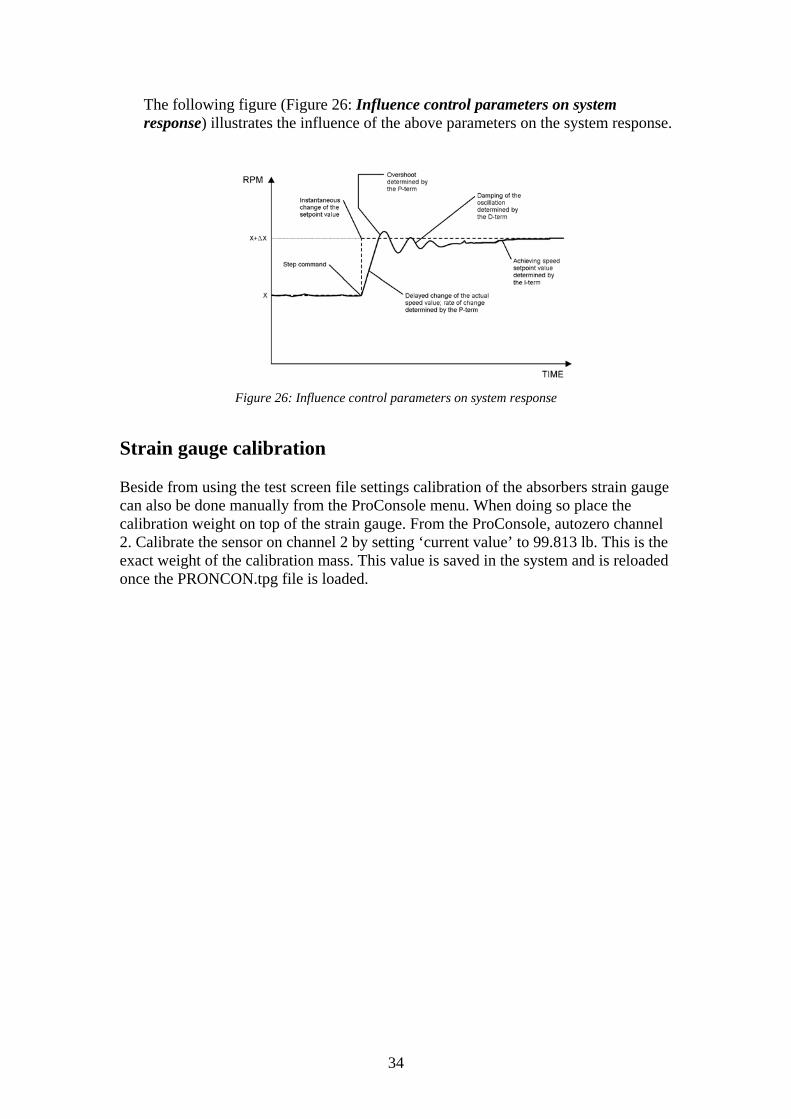
The following figure (Figure 26: Influence control parameters on system response) illustrates the influence of the above parameters on the system response.
Figure 26: Influence control parameters on system response
Strain gauge calibration Beside from using the test screen file settings calibration of the absorbers strain gauge can also be done manually from the ProConsole menu. When doing so place the calibration weight on top of the strain gauge. From the ProConsole, autozero channel 2. Calibrate the sensor on channel 2 by setting ‘current value’ to 99.813 lb. This is the exact weight of the calibration mass. This value is saved in the system and is reloaded once the PRONCON.tpg file is loaded.
34
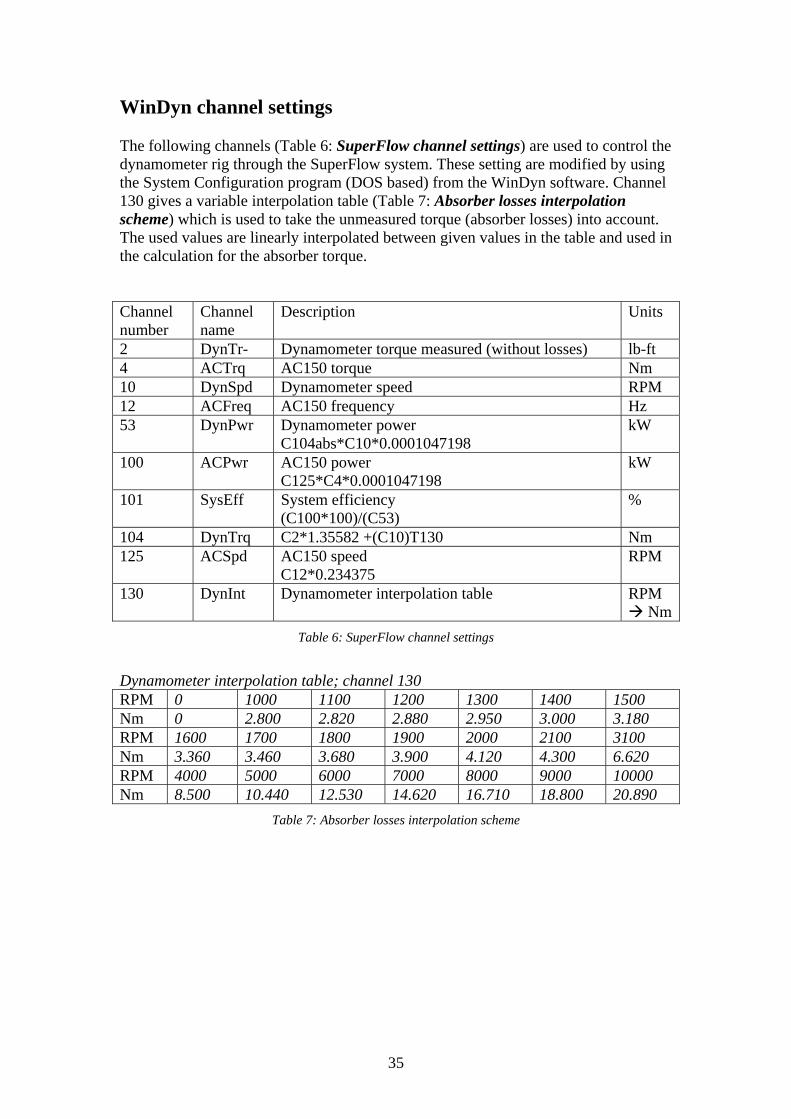
WinDyn channel settings The following channels (Table 6: SuperFlow channel settings) are used to control the dynamometer rig through the SuperFlow system. These setting are modified by using the System Configuration program (DOS based) from the WinDyn software. Channel 130 gives a variable interpolation table (Table 7: Absorber losses interpolation scheme) which is used to take the unmeasured torque (absorber losses) into account. The used values are linearly interpolated between given values in the table and used in the calculation for the absorber torque. Channel number
Channel name
Description Units
2 DynTr- Dynamometer torque measured (without losses) lb-ft 4 ACTrq AC150 torque Nm 10 DynSpd Dynamometer speed RPM 12 ACFreq AC150 frequency Hz 53 DynPwr Dynamometer power
C104abs*C10*0.0001047198 kW
100 ACPwr AC150 power C125*C4*0.0001047198
kW
101 SysEff System efficiency (C100*100)/(C53)
%
104 DynTrq C2*1.35582 +(C10)T130 Nm 125 ACSpd AC150 speed
C12*0.234375 RPM
130 DynInt Dynamometer interpolation table RPM Nm
Table 6: SuperFlow channel settings
Dynamometer interpolation table; channel 130 RPM 0 1000 1100 1200 1300 1400 1500 Nm 0 2.800 2.820 2.880 2.950 3.000 3.180 RPM 1600 1700 1800 1900 2000 2100 3100 Nm 3.360 3.460 3.680 3.900 4.120 4.300 6.620 RPM 4000 5000 6000 7000 8000 9000 10000 Nm 8.500 10.440 12.530 14.620 16.710 18.800 20.890
Table 7: Absorber losses interpolation scheme
35
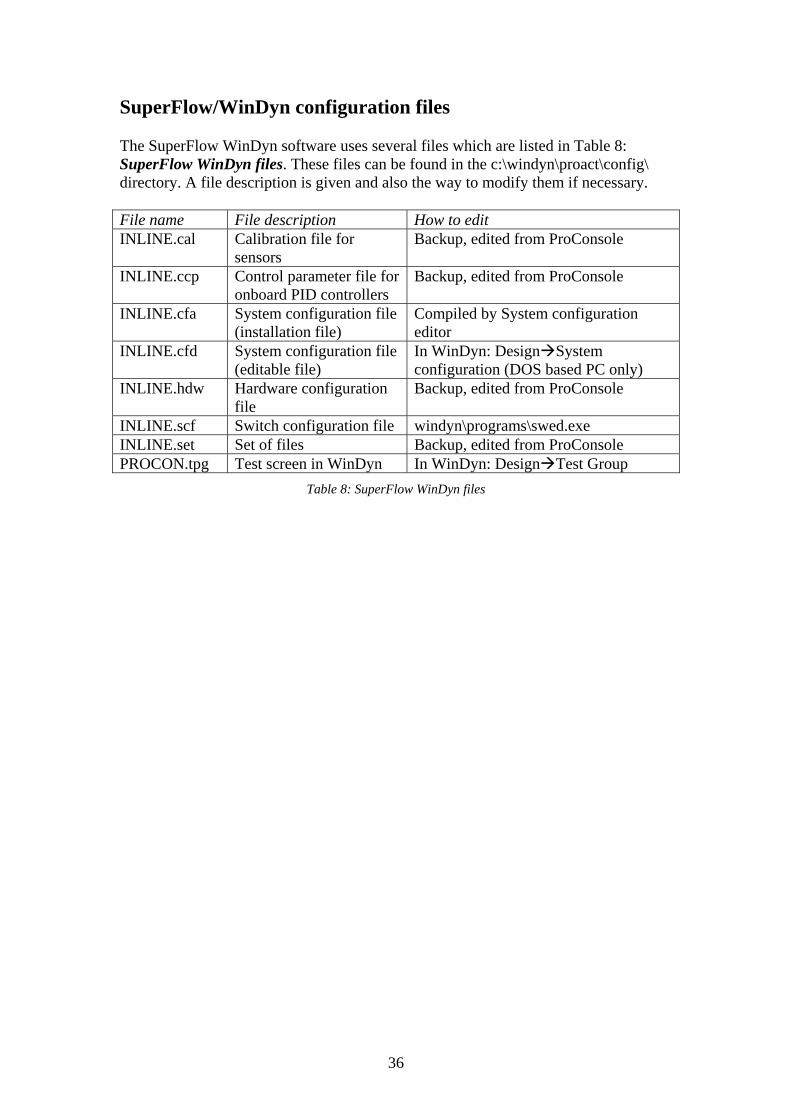
SuperFlow/WinDyn configuration files The SuperFlow WinDyn software uses several files which are listed in Table 8: SuperFlow WinDyn files. These files can be found in the c:\windyn\proact\config\ directory. A file description is given and also the way to modify them if necessary. File name File description How to edit INLINE.cal Calibration file for
sensors Backup, edited from ProConsole
INLINE.ccp Control parameter file for onboard PID controllers
Backup, edited from ProConsole
INLINE.cfa System configuration file (installation file)
Compiled by System configuration editor
INLINE.cfd System configuration file (editable file)
In WinDyn: Design System configuration (DOS based PC only)
INLINE.hdw Hardware configuration file
Backup, edited from ProConsole
INLINE.scf Switch configuration file windyn\programs\swed.exe INLINE.set Set of files Backup, edited from ProConsole PROCON.tpg Test screen in WinDyn In WinDyn: Design Test Group
Table 8: SuperFlow WinDyn files
36

Chapter 8 Inline-CVT improvements Several problems were experienced after 2 hours of running the Inline-CVT. Underneath all these problems are explained and a solution for them is given. Because of limited time not all solutions are implemented. Heat Running the Inline-CVT for 15 minutes caused the transmission to reach temperatures above normal working temperature of 80 C (176 F). This could happen since the sump can only contain 2.5 liters of oil. This cooling problem could be solved by adding an oil cooler. Next proposal is about a thermostatic oil cooler with a fan available at ‘Summit racing’. This cooler comes with a 160 F thermostat and is also available with a fan controller which enables you to set the oil temperature to a certain level. For sellers contact information: see appendix 1.
Figure 27: Oil cooler BMM-70297
Manufacturer: B&M Order number:BMM-70297 Dimensions: 343 x 229 x 89 mm (13 ½” x 9 x 3 ½”) Inlet size: ½” NPT Outlet size: ½” NPT Max pressure: 13.5 bar (200 psi) Cost: $209.88 To improve the oil quality in general a magnetic oil filter might be considered.
37
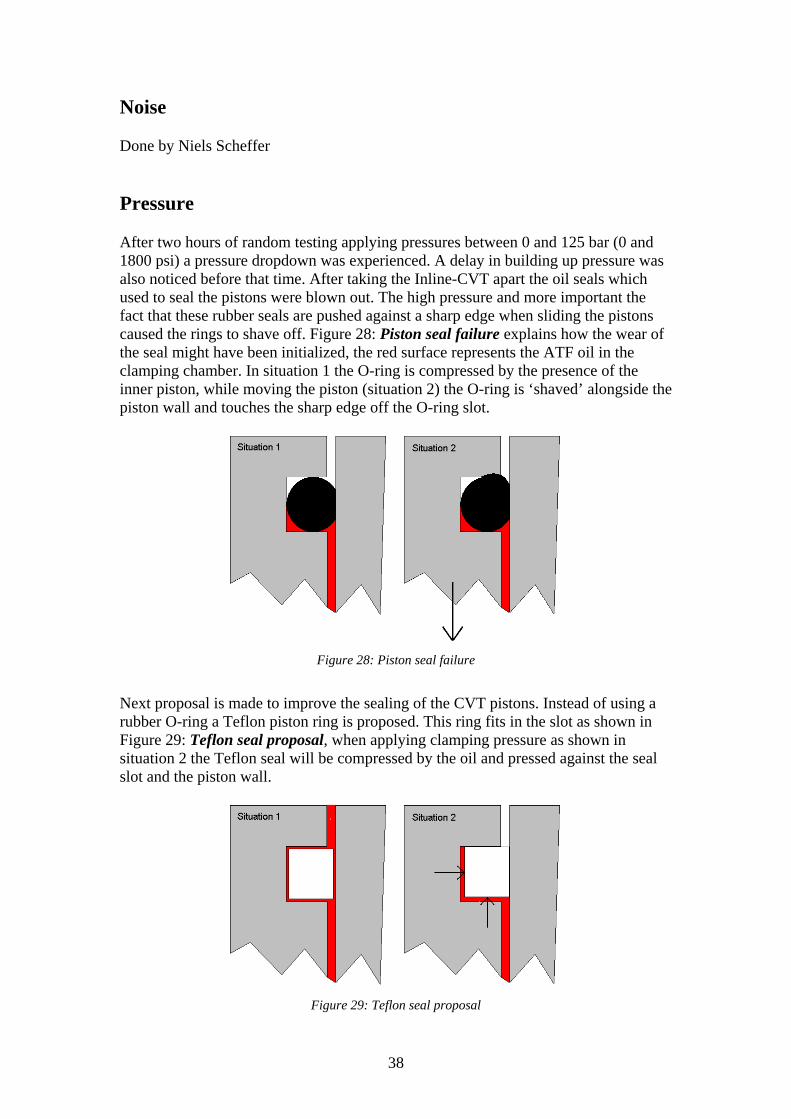
Noise Done by Niels Scheffer Pressure After two hours of random testing applying pressures between 0 and 125 bar (0 and 1800 psi) a pressure dropdown was experienced. A delay in building up pressure was also noticed before that time. After taking the Inline-CVT apart the oil seals which used to seal the pistons were blown out. The high pressure and more important the fact that these rubber seals are pushed against a sharp edge when sliding the pistons caused the rings to shave off. Figure 28: Piston seal failure explains how the wear of the seal might have been initialized, the red surface represents the ATF oil in the clamping chamber. In situation 1 the O-ring is compressed by the presence of the inner piston, while moving the piston (situation 2) the O-ring is ‘shaved’ alongside the piston wall and touches the sharp edge off the O-ring slot.
Figure 28: Piston seal failure
Next proposal is made to improve the sealing of the CVT pistons. Instead of using a rubber O-ring a Teflon piston ring is proposed. This ring fits in the slot as shown in Figure 29: Teflon seal proposal, when applying clamping pressure as shown in situation 2 the Teflon seal will be compressed by the oil and pressed against the seal slot and the piston wall.
Figure 29: Teflon seal proposal
38
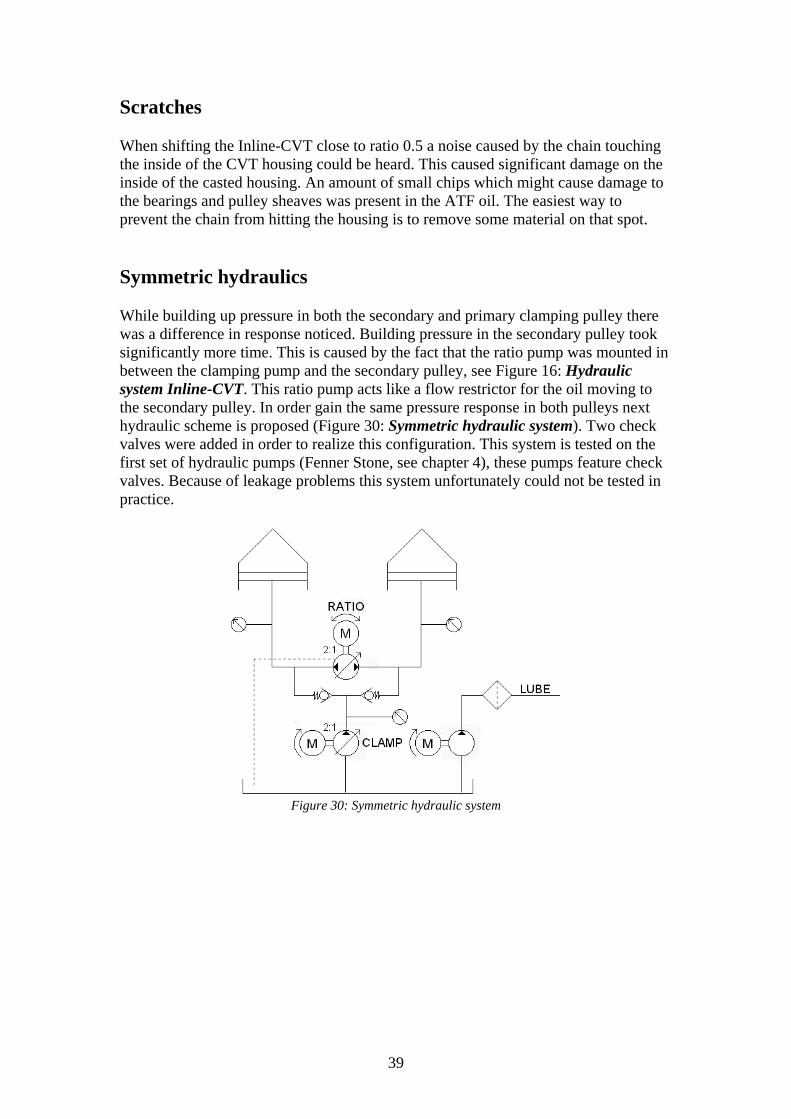
Scratches When shifting the Inline-CVT close to ratio 0.5 a noise caused by the chain touching the inside of the CVT housing could be heard. This caused significant damage on the inside of the casted housing. An amount of small chips which might cause damage to the bearings and pulley sheaves was present in the ATF oil. The easiest way to prevent the chain from hitting the housing is to remove some material on that spot. Symmetric hydraulics While building up pressure in both the secondary and primary clamping pulley there was a difference in response noticed. Building pressure in the secondary pulley took significantly more time. This is caused by the fact that the ratio pump was mounted in between the clamping pump and the secondary pulley, see Figure 16: Hydraulic system Inline-CVT. This ratio pump acts like a flow restrictor for the oil moving to the secondary pulley. In order gain the same pressure response in both pulleys next hydraulic scheme is proposed (Figure 30: Symmetric hydraulic system). Two check valves were added in order to realize this configuration. This system is tested on the first set of hydraulic pumps (Fenner Stone, see chapter 4), these pumps feature check valves. Because of leakage problems this system unfortunately could not be tested in practice.
Figure 30: Symmetric hydraulic system
39
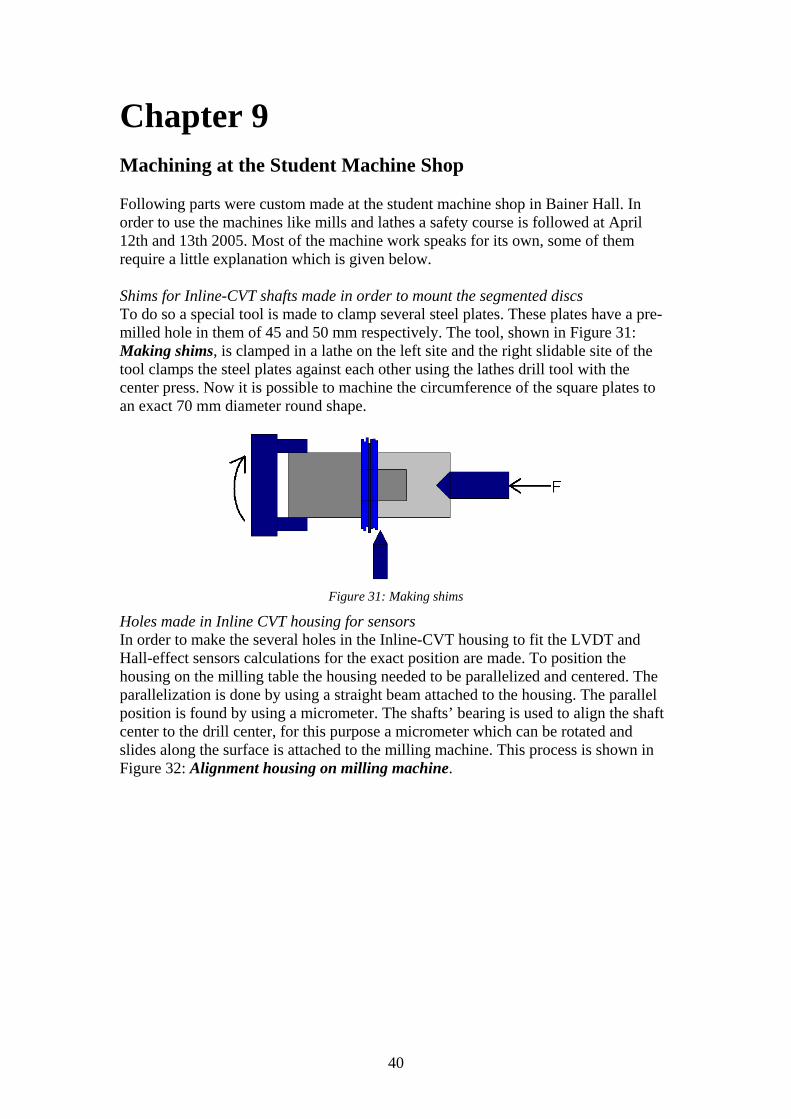
Chapter 9 Machining at the Student Machine Shop Following parts were custom made at the student machine shop in Bainer Hall. In order to use the machines like mills and lathes a safety course is followed at April 12th and 13th 2005. Most of the machine work speaks for its own, some of them require a little explanation which is given below. Shims for Inline-CVT shafts made in order to mount the segmented discs To do so a special tool is made to clamp several steel plates. These plates have a pre-milled hole in them of 45 and 50 mm respectively. The tool, shown in Figure 31: Making shims, is clamped in a lathe on the left site and the right slidable site of the tool clamps the steel plates against each other using the lathes drill tool with the center press. Now it is possible to machine the circumference of the square plates to an exact 70 mm diameter round shape.
Figure 31: Making shims
Holes made in Inline CVT housing for sensors In order to make the several holes in the Inline-CVT housing to fit the LVDT and Hall-effect sensors calculations for the exact position are made. To position the housing on the milling table the housing needed to be parallelized and centered. The parallelization is done by using a straight beam attached to the housing. The parallel position is found by using a micrometer. The shafts’ bearing is used to align the shaft center to the drill center, for this purpose a micrometer which can be rotated and slides along the surface is attached to the milling machine. This process is shown in Figure 32: Alignment housing on milling machine.
40

Figure 32: Alignment housing on milling machine
Other parts which don’t need any further technical explanation are listed below. Mounting bracket made for pump assembly Mounting brackets made for the test rig bed Modification made on hydraulic pumps; explained in chapter 4
Shaft modification made to improve oil flow Bearing caps welded to housing Shrinkfit bushing made to close internal oil lines
Leak line connection made to Inline-CVT sump Hall sensor thread partial removed Distance bushings for Inline-CVT mounting plate made Magtrol torque transducer housing modified Special thanks goes to Mike and Leo from the student machine shop, they have been a great help while solving our machining problems.
41

Conclusions The work done at the UCDavis HEV center resulted in a test rig suitable for testing the Inline-CVT for efficiency and slip. Future students in Automotive Engineering can operate the test rig to analyze the Inline-CVT while using this report as a guide. Besides testing the Inline-CVT the SuperFlow system makes it possible to analyze other transmissions as well. This makes the test rig universally applicable for future projects. A lot is learned from working in a team and as a team, realization of big projects like a test rig cannot be done by one man alone.
42

Recommendations In the first week of July several important parts of the control system (the PXI chassis among others) had to be send to a test facility of a company in Michigan. Because of this the Inline-CVT is only tested for two hours. The transmission properly broke in and can be used for further testing. The improvements mentioned in chapter 9 have to be applied in the first place. The test rig can now be used to measure among others efficiency. When doing so the power and torque limitations of the absorber and the AC150 electric motor need to be taken in account. While doing the tests, make sure the steel dynamometer covers are attached. In a later stadium, when using the Inline-CVT in a car one might consider applying a more powerful servo motor to drive the pumps since the gear reduction might provide a too slow ratio change compared to other prototype which use external hydraulics to drive their CVT’s.
43
Literature N.Scheffer, Development of the Inline CVT test rig, 2005 Internship at the HEV Center UCDavis California, USA Ir. J. van Rooij VDI, Nuenen/NL, Prof. Dr. A.A. Frank Ph.D. Ph.D Davis/USA, Development of a 700 Nm Chain-CVT, VDI-berichte nr. 1709,2002 A.W. Brown (A.W. Brown Co.), J. van Rooij (GCI), and A.A. Frank(UCDavis), The Design of an Inline GCI Chain CVT For Large Vehicles, 2004 UCDavis CVT congress paper Brian Johnston, Development of an Engine Testing Facility Capable of Simulating Dynamic Engine Operation in UC Davis Hybrid Electric Vehicles, University of California, Davis 1995 Nicholaus Struven, Experimental Facilities And Engine Studies For A Parallel Hybrid Electric Vehicle, University of California, Davis 2002 SuperFlow/WinDyn manual Labview 7.1 manual
44
Appendix 1 Seller contact information. Linear displacement sensor (LVDT): INELTA Sensorsysteme GmbH&Co. Hermann-Oberth-Str. 7 85640 Putzbrunn, Germany Phone: 01149-894-6094-100 Fax: 01149-894-6094-244 Hall-effect sensors: Spectec Sensors PO Box 360 Emigrant, MT 59027 USA Phone: 1-406-333-4967 Fax: 1-406-333-4259 www.spectecsensors.com Segmented discs: Mr. Shims 727 N. Yale Avenue Unit B Villa Park, IL 60181 USA Phone: 1-630-832-5084 Fax: 1-630-832-5744 www.mrshims.com Torque transducer ingoing axle: Magtrol, Inc. 70 Gardenville Parkway Buffalo, NY 14224 USA Phone: 1-716-668-5555 Fax: 1-716-668-8705 www.magtrol.com Strain gauge outgoing axle: Interface Advanced Force Measurement 7401 East Butherus Drive Scottsdale, AZ 85260 USA Phone: 1-800-947-5598 Fax: 1-480-948-1924 www.interfaceforce.com Amplifier strain gauge outgoing axle: Honeywell Sensotec 2080 Arlingate Lane Columbus, OH 43228 USA Phone: 1-614-850-5000 Fax: 1-614-850-1111 www.sensotec.com
45

Pressure sensors: MSI Sensors 1000 Lucas Way Hampton, VA 23666 USA Phone: 1-757-766-1500 Fax: - www.msiusa.com Thermocouple: OMEGA Engineering P.O. Box 4047 One Omega Drive Stamford, Connecticut 06907 USA Phone: 1-800-848-4286 Fax: 1-203-359-7700 www.omega.com Fenner/Stone hydraulic pumps: Surplus Center P.O. Box 82209 Lincoln, NE 68501 USA Phone: 1-800-488-3407 Fax: 1-402-474-5198 Haldex hydraulic pumps: Berendsen Fluid Power 1730 Terminal Street West Sacramento, CA 95691 USA Phone: 1-916-372-0550 Fax: 1-916-372-3817 www.bfpna.com Hydraulic hoses and fittings: Fluid Tech Hydraulics (free BBQ each months last Friday) 8432 Tiogawoods Drive Sacramento, CA 95828 USA Phone: 1-916-681-0888 AC150 electric motor and PEU Gen 1: AC Propulsion 441 Borrego Court San Dimas, CA 91773 USA Phone: 1-909-592-5399 Fax: 1-909-394-4598 www.acpropulsion.com
46

B&M oil cooler: Summit Racing 960 East Glendale Sparks, NV 89431 USA Phone: 1-775-352-8787 Orders:1-800-230-3030
47