REAL-TIME RT-PCR AND PROTEOMIC ANALYSIS OF ADIPOSE …
149
REAL-TIME RT-PCR AND PROTEOMIC ANALYSIS OF ADIPOSE TISSUE FROM OB/OB MICE TREATED WITH LEPTIN by WEI ZHANG (Under the Direction of Clifton A. Baile) ABSTRACT Leptin, a hormone secreted by adipose tissue, plays a critical role in regulating body weight, energy expenditure, lipid metabolism, and adipocyte apoptosis. In order to elucidate the underlying signaling pathways of leptin on adipocytes, advanced real-time RT-PCR and proteomic technologies were performed to compare mRNA and protein levels from white adipose tissue between control and leptin-treated ob/ob mice. ob/ob mice were treated with either PBS (control), or leptin (2.5 μg/d or 10 μg/d) for 14 days via sc osmotic mini pumps, and three fat depots were collected at the end of the experiment. In the first study, eighteen genes were found to be the potential targets of leptin in inguinal fat pad of ob/ob mice by real-time RT-PCR and TaqMan ® low-density arrays (24 genes format). They are classified as genes related to energy expenditure (UCP2, ADRB3, MFN2, SIRT3), genes involved in lipid metabolism (HSL, SCD1, FAS, RBP4), transcription factor SREBF1, genes related to apoptosis (Bcl-2, Bax, Caspase 3), cytokines (TNF α, adiponectin, complement 3), as well as genes taking part in inhibition of angiogenesis (Angiopoietin 2).
Transcript of REAL-TIME RT-PCR AND PROTEOMIC ANALYSIS OF ADIPOSE …

REAL-TIME RT-PCR AND PROTEOMIC ANALYSIS OF ADIPOSE TISSUE FROM OB/OB
MICE TREATED WITH LEPTIN
by
WEI ZHANG
(Under the Direction of Clifton A. Baile)
ABSTRACT
Leptin, a hormone secreted by adipose tissue, plays a critical role in regulating body weight,
energy expenditure, lipid metabolism, and adipocyte apoptosis. In order to elucidate the
underlying signaling pathways of leptin on adipocytes, advanced real-time RT-PCR and
proteomic technologies were performed to compare mRNA and protein levels from white
adipose tissue between control and leptin-treated ob/ob mice. ob/ob mice were treated with
either PBS (control), or leptin (2.5 µg/d or 10 µg/d) for 14 days via sc osmotic mini pumps, and
three fat depots were collected at the end of the experiment.
In the first study, eighteen genes were found to be the potential targets of leptin in inguinal
fat pad of ob/ob mice by real-time RT-PCR and TaqMan® low-density arrays (24 genes format).
They are classified as genes related to energy expenditure (UCP2, ADRB3, MFN2, SIRT3),
genes involved in lipid metabolism (HSL, SCD1, FAS, RBP4), transcription factor SREBF1,
genes related to apoptosis (Bcl-2, Bax, Caspase 3), cytokines (TNF α, adiponectin, complement
3), as well as genes taking part in inhibition of angiogenesis (Angiopoietin 2).

In the second study, different detergent combinations were tested, and a modified protocol
was described as the basis of extraction buffer, including 8.4M urea, 2.4M thiourea, 2% CHAPS
(v/v), 2% ASB14 (v/v), 1% IPG buffer, 15mM Tris and 50 mM DTT.
In the third study, comparative proteomic analysis was performed between control and
leptin-treated ob/ob mice in parametrial adipose tissue. Twelve protein entries were
differentially expressed, functionally classified as molecular chaperones (CRT, PDIA3, PHB,
and Prx-VI), cytoskeleton proteins (β-actin, α-tubulin and desmin) and other proteins (PC,
GDEase, UQCRC, PTRF, and fibrinogen). The mRNA levels of CRT, PDIA3 and PHB were
consistent with the fold changein protein expression level by real-time RT-PCR.
In general, our results demonstrated that proteomic analysis offers a promising tool to study
the global analysis of proteins, and real-time RT-PCR is a reliable, sensitive and medium-
throughput platform to measure mRNA quantitatively in a complex biological system (ob/ob
mice) under certain external stimuli (leptin treatment).
INDEX WORDS: Leptin, ob/ob, Real-time RT-PCR, Proteomics, Adipose Tissue

REAL-TIME RT-PCR AND PROTEOMIC ANALYSIS OF ADIPOSE TISSUE
FROM OB/OB MICE TREATED WITH LEPTIN
by
WEI ZHANG
B.S., HARBIN MEDICAL UNIVERSITY, CHINA, 1997
M.S., HARBIN MEDICAL UNIVERSITY, CHINA, 2000
A Dissertation Submitted to the Graduate Faculty of The University of Georgia in Partial
Fulfillment of the Requirements for the Degree
DOCTOR OF PHILOSOPHY
OF FOODS AND NUTRITION
ATHENS, GEORGIA
2007

© 2007
Wei Zhang
All Rights Reserved

REAL-TIME RT-PCR AND PROTEOMIC ANALYSIS OF ADIPOSE TISSUE
FROM OB/OB MICE TREATED WITH LEPTIN
by
Wei Zhang
Major Professor: Clifton Baile
Committee: Dorothy Hausman
Roger Dean
Michael Azain
Arthur Grider
Electronic Version Approved: Maureen Grasso Dean of the Graduate School The University of Georgia August, 2007

iv
DEDICATION
I dedicate my dissertation to my parents and younger brother, whose consistent love,
encouragement and support have made it possible for me to fly halfway around the earth to come
study for my Ph.D. degree at the University of Georgia.

v
ACKNOWLEDGEMENTS
I would like to express my deepest gratitude to my major professor, Dr. Clifton Baile for his
financial support and invaluable guidance during the past three and a half years. Many thanks to
Diane Hartzell, who helped me achieve the best possible experimental conditions by paying
attention to the details. I would also like to thank my committee members, Drs. Dorothy
Hausman, Roger Dean, Michael Azain, and Arthur Grider, for providing me with critical
suggestions for my research, and also to Dr. Mary Anne Della-Fera, who greatly assisted me in
dissertation writing and revising.
I would like to thank Dr. Tracy Andacht, who spent much time helping me overcome
problems encountered in the proteomics experiment, and also Dr. Jaxk Reeves for his statistical
analysis help with real-time RT-PCR data. I am grateful for the assistance of Pam Kirby and
Gabriela Brambila with the 2-DE and MALTI-TOF MS facilities, as well as for Kara Huff and
Roger Nilsen for assistance with ABI 7900 systems.
I sincerely appreciate the help of Dr. Mary Ann Johnson for her guidance in courses
choosing and dissertation submission. And I would be lost without the help of Stephanie
Chirello in ordering reagents on time.
I would also like to thank the entire Baile lab, especially Ji Lin, ChangLong Li, Qiang Li,
Jiuhua Duan, Hea Jin Park, Ronda Wheeler, Srujana Rayalam, Suresh Ambati, Jeong Yeh Yang,
Karen Page, Gily Raz, and Shana Bartell. I wish to also thank all of my friends, particularly
Shiying Lu, Jerry Liu, Sohyun Park, Rui Zhang, Yihui Zhu, Guodong Zhang, Yi Kuang, Ling

vi
Zhao and Down Pawn. Without their friendship and support, I would not have enjoyed graduate
school as much as I have.
Finally, I would like to thank my parents. Without your years of inspiration and generous
support, I would not have been able to complete my Ph.D. degree.

vii
TABLE OF CONTENTS
Page
ACKNOWLEDGEMENTS.............................................................................................................v
LIST OF TABLES......................................................................................................................... ix
LIST OF FIGURES .........................................................................................................................x
CHAPTER
1 INTRODUCTION .........................................................................................................1
2 REVIEW OF THE LITERATURE ...............................................................................4
White Adipose Tissue and Lipid Metabolism...........................................................4
ob Gene and Leptin ...................................................................................................5
Leptin: an Essential Regulator of Lipid Metabolism ................................................7
Adipokines...............................................................................................................12
Conclusion...............................................................................................................15
3 WHITE ADIPOSE TISSUE GENE EXPRESSION PROFILES IN OB/OB
MICE TREATED WITH LEPTIN..............................................................................17
Abstract ...................................................................................................................18
Introduction .............................................................................................................20
Materials and Methods ............................................................................................21
Results .....................................................................................................................24
Discussion ...............................................................................................................26

viii
4 TEST OF DIFFERENT DETERGENT COMBINATIONS TO ENHANCE
THE DECTIONO OF PROTEOME FROM MURINE ADIPOSE TISSUE..............45
5 A PROTEOMIC ANALYSIS OF ADIPOSE TISSUE FROM OB/OB MICE
TREATED WITH LEPTIN.........................................................................................57
Abstract ...................................................................................................................58
Introduction .............................................................................................................60
Research Methods ...................................................................................................61
Results .....................................................................................................................66
Discussion ...............................................................................................................68
6 SUMMARY AND CONCLUSION ............................................................................87
REFERENCES ............................................................................................................................117
APPENDICES ...............................................................................................................................90
A ABBREVIATIONS .....................................................................................................90
B REAL-TIME RT-PCR AND PROTEOMIC ANALYSIS ..........................................93
C SAS CODES FOR REAL-TIME RT-PCR DATA....................................................116

ix
LIST OF TABLES
Page
Table 2.1.: Adipokines and Their Main Effects.............................................................................14
Table 3.1.: Probes Used in Real-time PCR I .................................................................................37
Table 4.1.: The Composition of Extraction Buffer in Sample Preparation ...................................56
Table 5.1.: 2D-DIGE Experimental Design...................................................................................79
Table 5.2.: Probes Used in Real-time PCR II ................................................................................80
Table 5.3.: Proteins Identified by MALDI-TOF MS in Adipose Tissue .......................................81
x
LIST OF FIGURES
Page
Figure 2.1.: Subcutaneous Adipose Tissue ......................................................................................5
Figure 2.2.: Adipocyte Leptin and the Regulation of Adipose Tissue Mass ...................................6
Figure 2.3.: Release of Fatty Acids from Triacylglycerol in
Adipose Tissue is Hormone-Dependent......................................................................9
Figure 2.4.: Functional Groups of Adipokines ..............................................................................13
Figure 5: Effects of 14-day s.c. Infusion of Leptin on Gene Expression
in Adipose Tissue from ob/ob Mice
Figure 3.1.: Leptin and Leptin Receptor........................................................................................39
Figure 3.2.: UCP1-3, ADRB3, MFN2 and SIRT3.........................................................................40
Figure 3.3.: HSL, SCD1, FAS .......................................................................................................41
Figure 3.4.: GLUT 4, RBP 4..........................................................................................................41
Figure 3.5.: SREBF1, PPAR α, PPAR γ and C/EBP α ..................................................................42
Figure 3.6.: BCL2, BAX and CASPASE3 ....................................................................................42
Figure 3.7.: TNF α, Adiponectin, Complement 3..........................................................................43
Figure 3.8.: Angiopoietin 2............................................................................................................43
Figure 3.9.: Effects of Leptin on BAT Weight, Percentage of BAT vs. BW,
and Weight of GC Muscle .........................................................................................44
Figure 4.1.: Flow Chart of Separation and Extraction of Proteins from Adipose Tissue
of ob/ob Mice ............................................................................................................53

xi
Figure 4.2.: Patterns of Two-dimensional Gels in Adipose Tissue of ob/ob Mice…....................54
Figure 5.1.: Sypro Ruby Stained Master 2-D Gel in Adipose Tissue of ob/ob Mice
Annotated with Master Spot Numbers ........................................................................73
Figure 5.2.: Three protein Functional Groups in Adipose Tissue of ob/ob Mice
Treated with 10 µg/d Leptin........................................................................................74
Figure 5.3.: Bar Charts of Functional Classes of Proteins as Molecular Chaperons and
Redox Proteins; Cytoskeleton Proteins and Other Proteins ........................................75
Figure 5.4.: Co-migration Proteins in Spot 545.............................................................................77
Figure 5.5.: Gene Expression (CRT, PDIA3 and PHB) in Adipose Tissue of
ob/ob Mice Treated with Leptin ..................................................................................78
1
CHAPTER 1 INTRODUCTION
The rapid increase in obesity and associated disorders worldwide has attracted great interest
in the study of white adipose tissue, which is now recognized as a major endocrine cell for
secreting bioactive peptides and hormones, regulating lipid metabolism. Of them, leptin, the
product of ob gene, is derived primarily from adipocytes and acts as ‘lipostat factor’ to regulate
body weight through changes in food intake, energy expenditure (1), lipid metabolism (2) and
adipose tissue vascularization (3). Although some genes involved in the regulation of appetite,
energy expenditure and apoptosis have been identified (such as UCPs (4), TNF α (5,6),
Neuropeptide Y (NPY) (7) and pro-opiomelanocortin (POMC) (8)), molecular mechanisms
underlying leptin’s effect on weight loss, especially on fat loss, are still unclear. But adipose
tissue is an important target organ of leptin, and following leptin treatment.
The genetically obese ob/ob mice (9) are characterized by hyperphagia, early-onset obesity,
insulin resistance, low core temperature and infertility due to the single ob gene mutation, and
now are widely used as one of animal models for the research on obesity and diabetes. Leptin,
the product of ob gene, is the adipocyte-derived hormone as an afferent factor, acting primarily
in the hypothalamus to regulate body weight in humans and rodents in a negative-feed back loop
(1). The interests in leptin specifically stem from its special properties of weight-reducing
effects, which are greatly different from food-restriction from the aspect of metabolism (10). In
a recent study, ob/ob mice were treated with s.c. leptin at the dose of either 0, 2.5 µg or 10 µg for
14 days. Consistent with previous literature, ob/ob mice showed significant reduction in body
weight, food intake, weights of all three fat depots (inguinal, parametrial and retroperitoneal)

2
examined, and fat percentage was also reduced in the leptin-treated group compared to control
group (11). In addition, leptin significantly increased body temperature, physical activity and
adipose tissue apoptosis in ob/ob mice compared to control ob/ob mice (11). Moreover, insulin
sensitivity was increased in ob/ob mice by leptin treatment (11). Adipose tissue from these
ob/ob mice provide a unique model for characterizing how leptin-induced alterations in cellular
functions are mediated through significant changes in expression of specific genes and/or their
protein products.
Therefore, the purpose of the present was to explore several possible cellular pathways at
the mRNA and protein level, through which leptin may regulate body weight and fat mass.
Chapter 3 focuses on target genes functionally classified as energy expenditure, lipogenesis and
lipolysis, adipocyte apoptosis, adipocyte differentiation, glucose transporter, insulin sensitivity
and angiogenesis inhibition. Changes in gene expression in adipose tissue following leptin
treatment in ob/ob mice were determined by real-time RT-PCR combined with Low Density
Card. Chapter 4 and 5 focus on the protein changes in the adipose tissue by leptin treatment in
ob/ob mice. Since proteins extracted from adipose tissue are hard to be resolved on two-
dimensional (2-D) gel using traditional extraction buffer due to its large amount of lipids,
different detergent combinations were varied, tested and assessed by 1-D gel and small size 2-D
gel in order to optimize protein separation. Based on the protocol from chapter 4, a global
protein analysis was compared in the adipose tissue of leptin-treated as compared with control
ob/ob mice (Chapter 5). Twelve different proteins have been identified and functionally
classified as molecular chaperones and redox group, cytoskeleton structure proteins and other
proteins. Some proteins of interest such as molecular chaperons were further verified by real-
time RT-PCR.

3
Thus, the overall purpose of the reported studies was to identify potential target genes and
proteins of leptin in adipose tissue which might be involved in the signaling pathways mediating
fat loss in ob/ob mice treated with leptin.

4
CHAPTER 2 REVIEW OF THE LITERATURE
2.1. White Adipose Tissue and Lipid Metabolism
The prevalence of obesity in the U.S. has recently increased, with almost 65% of adults now
overweight [body mass index (BMI) ≥25] and 33% being obese (BMI≥30). Worldwide, around
250 million people are obese, which is alarming, given that obesity is a major risk factor for
many chronic diseases such as type 2 diabetes and cardiovascular diseases (12). The direct cost
of obesity is currently estimated at around 7-9% of total health care costs in the U.S. (13).
Obesity is characterized not only by excessive deposition of adipose tissue, but also by the
generalized steatosis, lipotoxicity, and lipoapoptosis in non-adipose tissues such as pancreatic
beta-cells, liver, myocardium, and skeletal muscle due to the over-accumulation of lipids (14).
This worldwide increase in incidence of obesity has attracted scientists to the biology of adipose
tissue (15).
Adipose tissue generally constitutes 18% of an average person’s body weight, and is the
main organ providing fuel reserves for the organism. Without the fat stores in adipose tissue, we
could not live for more than a few days without eating. Adipose tissue belongs to loose
connective tissue, and is composed of unilocular adipocytes (about 90% of mass) filled mainly
with triacylglycerol (TAG), blood cells, immune cells and fibroblasts (Figure 2.1) (16). Adipose
tissue is richly vascularized and innervated, indicating its high metabolic activity. This tissue
may develop almost anywhere, but is mainly located subcutaneously and viscerally.
Although there is no limit for adipocytes to store lipid, animals maintain their body weight
fairly constant, and adipose tissue is under tight neural and hormonal control (17). The relatively

5
constant level of body fat and body weight in the adult mammal is elucidated by the “lipostat”
theory. An adiposity signal in the hypothalamus reflects total body fat content by either direct or
indirect adipose tissue regulation`. This is supported partially by the experiments with parabiotic
animals (18). The successful cloning of the ob gene from ob/ob mice (1) in 1994 and the db
gene from db/db mice (19) in 1995, as well as the subsequent characterization of leptin and its
receptor, has made great progress in understanding the control of energy balance and lipid
metabolism in rodents and humans. It is now widely accepted that leptin provides an adiposity
signal from body stores to the hypothalamus, binding to receptors to regulate energy balance.
Figure 2.1. Subcutaneous adipose tissue (16)
2.2. Ob Gene and Leptin
Leptin, the product of the ob gene, acts primarily on the brain to regulate energy balance
and food intake in a negative-feedback loop regulating the mass of adipose tissue (1) (Figure 2.2).
The hormone, which is composed of 167 amino acid residues, is produced almost exclusively

6
from adipose tissue, and is released into the bloodstream in proportion to the amount of adipose
tissue as a signal of adiposity (1). Leptin is primarily secreted from adipose tissue, but is also
present in the stomach (20), skeletal muscle (21), mammary gland and placenta (22).
Figure 2.2. Adipocyte leptin and the regulation of adipose tissue mass (10)
There are at least six isoforms of leptin receptors (Ob -Ra, -Rb, -Rc, -Rd, -Re and -Rf) (23),
one of which (Ob -Rb) is predominantly localized in the hypothalamus, and is known to be
responsible for transmitting and activating the intracellular signal of leptin (24). Within the
hypothalamus, different neuronal populations mediate leptin’s downstream effects on body
weight and energy balance. Leptin decreases expression of orexigenic peptides such as
neuropeptide Y (NPY) (25) and agouti-related peptide (AGRP) (26), and increases expression of
anorexigenic peptides such as proopiomelanocortin (POMC) (8) and cocaine and amphetamine
regulated transcript (CART) (27), leading to an overall decrease in appetite and body weight (28).
7
Interests in leptin stem from evidence of its special weight-reducing effects in rodents.
Central and peripheral administration of leptin results in a dose-dependent decrease in body
weight for both ob/ob and wild-type mice (29,30), and leptin-induced weight loss is specifically
restricted to adipose tissue while lean body mass (LBM) was spared (29,31). Furthermore,
leptin-treated ob/ob mice exhibited a greater decrease in body and fat weights than pair-fed ob/ob
mice (32). Following reduced food intake, ob/ob mice treated with leptin maintained high
energy expenditures, while food-restricted mice demonstrated a reduction in energy expenditure
(30). In addition to regulating food intake and thermogenesis, leptin also protects skeletal
muscle (14), pancreatic islets (33), and myocardium (34) from lipotoxicity and lipoapoptosis (14).
Although leptin plays a critical role in reproduction (35), immunity (36), blood cell development
(37), and bone formation (38), this review focuses specifically on lipid metabolism and its
related systems. Although leptin can regulate adiposity indirectly by modulating food intake and
energy expenditure (1), accumulating evidence (39,40) indicates that leptin directly acts on
adipocytes in regulating cellular lipid balance and promoting β-oxidation.
2.3. Leptin: an Essential Regulator of Lipid Metabolism
Leptin: Lipogenesis and Lipolysis
The amount of adipose tissue is defined by the size and number of constituent adipocytes.
In adult animals, changes in triglycerol content determine changes of fat mass. Numerous
studies have shown that leptin has a direct action on the rates of synthesis and degradation of
lipids as an autocrine or paracrine signal.
Fruhbeck et al (41) demonstrated that in vitro leptin induced lipolysis in a dose-dependent
manner in mouse adipocytes from ob/ob mice. Fruhbeck et al (42) also demonstrated that
lipolytic rates were increased in adipocytes from ob/ob (no functional leptin), while no changes
were observed in db/db mice (no functional leptin receptor) after i.p. injection of leptin. In

8
addition, ob/ob mice had much more sensitivity to enhanced lipolytic rates of adipocytes by
leptin treatment than did the wild type mice (42).
Leptin appears to inhibit lipogenesis by changing the activity of a few key enzymes in lipid
metabolism. The procedure of de novo lipogenesis in these tissues includes two rate-limiting
enzymes: acetyl coenzyme A (CoA) carboxylase (ACC) and the terminal enzyme fatty acid
synthase (FAS) (43). For example, leptin suppresses the activity of ACC, therefore inhibiting
the subsequent process of triglyceride formation in the fat cells (44). Leptin also decreases the
mRNA expression of FAS, and increases the lipolytic enzymes, including lipoprotein lipase
(LPL) and hormone-sensitive lipase (HSL) (or Triacylglycerol lipase) (Figure 2.3) in adipose
tissue of wild type mice (45). Leptin treatment has been shown to induce lipolysis without a
concomitant increase in plasma free fatty acids, as typically occurs during fasting-induced fat
mobilization (46).
Although the signaling pathway used by leptin to stimulate lipolysis is not clear, it is
suggested that leptin, like catecholamines and glucagon, promotes lipolysis by increasing the
concentration of cAMP and stimulating adenylate cyclase protein levels (47).
Leptin and Adipocyte Apoptosis
In addition to regulating lipogenesis and lipolysis in adipocytes, leptin may also reduce
adipose mass by inducing adipocyte apoptosis. Apoptosis, or programmed cell death, is a term
coined in 1972 by Kerr et al (48), and is a normal physiological process involved in deleting
unwanted cells such as aged cells, damaged cells, or precancerous cells, from living tissue during
embryonic and adult tissue homeostasis (49). Apoptotic cells are characterized by membrane
blebbing, chromatin condensation, fragmentation of nuclear DNA, and formation of apoptotic
bodies, which are disposed of without inflammation. Apoptosis is regulated by phylogenetically
conserved genetic cascades that rapidly and selectively eliminate unwanted cells, and occurs in

9
almost all cell types. The process can be initiated through a number of pathways such as
intrinsic (or mitochondrial) and extrinsic (death receptor) pathways (50), but ultimately involves
the activation of cytoplasmic proteases called caspases that lead to DNA fragmentation, the
hallmark of apoptosis (51).
Figure 2.3. Release of fatty acids from triacylglycerol in adipose tissue is hormone-dependent (43)

10
Although apoptosis has been extensively studied in cancer cells, it has been recognized as a
normal part of the adipocyte life cycle only in the past 15 years. Even though adipocytes had
been thought to be an extremely stable cell type, Prins (6) contended that fat mass is balanced by
cell acquisition and deletion, and that apoptosis plays an important role in the regulation of
adipose tissue mass in humans. In addition, adipocyte apoptosis has been described in people
with malignant tumors (5), people infected with the human immunodeficiency virus (52) and in
diabetic rats (53). There might also be a site-specific difference in the susceptibility of human
preadipocytes to apoptosis, with omental preadipocytes being more susceptible to apoptotic
stimuli than subcutaneous preadipocytes (54).
Adipose tissue apoptosis induced by leptin was first described by Qian et al in 1998 (55). In
his experiment, adipose tissue from leptin-treated rats demonstrated characteristic features of
apoptosis as detected by gel electrophoresis, TUNEL in situ staining and histological sectioning.
Apoptotic DNA fragmentation was not detected in other tissues and organs from the leptin-
treated rats, i.e. muscle, brain, liver, kidney, lung, or heart, indicating that leptin-induced
apoptosis is an adipocyte-specific response (unpublished). Della-Fera et al (56) have shown that
continuous 13-day intraperitoneal infusion of leptin significantly increases adipocyte apoptosis in
white adipose tissue in male and female mice, but only male mice developed reduced
responsiveness to leptin-induced apoptosis after high-fat (45% fat) feeding for 5 or 15 weeks,
thus extending the findings that leptin-induced apoptosis can occur with peripheral infusion in
mice. The beta-2 adrenergic agonist, clenbuterol, increased adipose tissue apoptosis in vivo,
suggesting that activation of adrenergic receptors on adipocytes may be involved in adipocyte
apoptosis (57). Gullicksen et al (58) have shown that i.c.v. injection of 10 µg leptin for 4 days in
Sprague Dawley rats reduced fat mass by both decreasing adipocyte volume and increasing
11
apoptosis in fat pads. Moreover, ob/ob mice are more sensitive to leptin-induced adipose tissue
apoptosis than lean mice (11).
We have identified a number of agents which can induce adipocyte apoptosis in in vitro and
in vivo studies. Ciliary neurotrophic factor (CNTF) injection centrally leads to adipose tissue
apoptosis in rats (59,60). Dietary conjugated linoleic acid (CLA) (60) and genistein (61), have
been demonstrated to induce adipocyte apoptosis in mice, while green tea polyphenol
epigallocatechin gallate (EGCG) (62), ajoene (63), esculetin (64), and docosahexaenoic acid (65)
have been shown to induce adipocyte apoptosis in 3T3-L1 adipocytes.
The cellular and molecular mechanisms of leptin-induced apoptosis are not fully understood.
Qian et al (66) found that i.c.v. leptin treatment (5 µg/day for 5 days) decreased TNF α
expression in adipose tissue by 40% only in young rats, whereas older rats were resistant to
leptin’s effects. The expression of peroxisome proliferation-activated receptor-γ (PPAR-γ) in
adipose tissue was increased by 70-80%, and the expression of uncoupling protein 2 (UCP2) was
decreased in young rats, while increased in old rats (66). In addition, down-regulation of
CCAAT/ enhancer binding proteins alpha, beta and delta (C/EBP α, β, δ) in adipose tissue
occurred in the adipose tissue of leptin-treated rats (67).
Leptin and Adipose Tissue Vascularization
The growth of both normal tissues and tumors is angiogenesis-dependent (68), and adipose
tissue as a highly vascularized tissue is no exception (69). Angiogenesis inhibitors have been
shown to decrease body fat in a variety of models of obesity (3). Rupnick et al (3) found that
anti-angiogenic agents resulted in a dose-dependent, reversible weight reduction and adipose
tissue loss from different obesity models of mice. In adipose tissue sections, vascular
remodeling indicates that there is a decreased endothelial proliferation and increased apoptosis in
mice treated with angiogenesis inhibitors compared with controls (3). In addition, the preferred
12
energy substrates shifted from carbohydrate to fatty acid (3). Angiogenic factors such as
vascular endothelial growth factor (VEGF), VEGF-C, VEGF-D, soluble VEGF receptor-2
(sVEGFr2), angiopoietin-2, angiogenin and endostatin, are all elevated in overweight and obese
individuals (70), indicating the possible link between the increased risk of metastasis rate in
obese patients with cancers. Leptin induced the expression of angpoietin-2 (Angpt-2), an
angiogenesis inhibitor, in the adipose tissue in an autocrine manner in ob/ob mice (71). To be
noted, this induction of Angpt-2 is associated with the initiation of apoptosis in the endothelial
cells of adipose tissue, which is proposed to be one of the reasons leading to adipose tissue
regression (71).
2.4. Adipokines
Since the discovery of leptin in 1994 (1), a wide range of protein factors and signals (over
50) termed adipokines, have been recognized as being released from white adipose tissue at
various expression levels (Table 2.1) (72,73). These bioactive factors integrate with other tissues
and organs such as the skeletal muscle, brain and sympathetic nervous system, taking part in
energy balance, immunity, insulin sensitivity, angiogenesis, blood pressure, lipid metabolism and
homeostasis (Figure 2.4) (74). As a result, adipose tissue is now recognized as a major
endocrine and secretory organ that acts both locally (paracrine) and distally (endocrine).
Although white adipose tissue secretes a variety of factors, only leptin and adiponectin (and
possibly resistin) are primarily produced by adipocytes.
Adiponectin
Adiponectin, (a.k.a. adipocyte complement-related protein (Acrp 30), ACDC) is a complex
high molecular protein secreted almost exclusively from adipocytes, with the principal role of
protecting against the development of insulin resistance. Adiponectin is an abundant protein

13
with a serum concentration between 5-10 ng/ml. In contrast to most adipocytokines and
specifically leptin, the level of serum adiponectin is reduced in obese humans and rodents (75).
The loss of body weight increases its expression, while re-feeding will return adiponectin to its
previous low level (76). Furthermore, adiponectin has been shown to act in the brain to decrease
body weight (77). Two adiponectin receptors (Adipo R1 and Adipo R2) have been recently
identified (78) in muscles and in the liver. The beneficial effect of adiponectin on insulin
resistance seems to be the promotion of fatty acid oxidation in muscle cells partly by the
activation of 5'-AMP-activated protein kinase (AMPK) (78).
Figure 2.4. Functional groups of adipokines (74)
The expression of adiponectin mRNA was increased in leptin-treated ob/ob mice and 3T3-
F442A adipocytes (79). A combination of physiological doses of adiponectin and leptin can
completely reverse insulin resistance, while either adiponectin or leptin alone only partially
reverse such resistance. In addition, in ob/ob mice transfected with the adiponectin gene, insulin
resistance could be partly improved, but not obesity, indicating that adiponectin and leptin
appeared to have both distinct and overlapping functions (80). Plasma adiponectin and cytokines

14
in vivo were inversely related, suggesting that interleukin (IL) 6 and TNF-α are potent inhibitors
of adiponectin expression (81).
Table 2.1 Adipokines and their main effects (72)
The expression of adiponectin mRNA was increased in leptin-treated ob/ob mice and 3T3-
F442A adipocytes (79). A combination of physiological doses of adiponectin and leptin can
completely reverse insulin resistance, while either adiponectin or leptin alone only partially
reverse such resistance. In addition, in ob/ob mice transfected with the adiponectin gene, insulin

15
resistance could be partly improved, but not obesity, indicating that adiponectin and leptin
appeared to have both distinct and overlapping functions (80). Plasma adiponectin and cytokines
in vivo were inversely related, suggesting that interleukin (IL) 6 and TNF-α are potent inhibitors
of adiponectin expression (81).
Resistin (Retn)
The name of resistin comes from its association with obesity-related insulin resistance (82).
Three groups discovered resistin independently with different goals (82-84). Steppan’s group
identified resistin when screening potential targets of thiazolidinedione (TZD) in 3T3-L1
adipocytes (82). Kim’s group identified resistin as a cytokine factor secreted from adipose tissue
by micro-array analysis (83). The Holcomb group found resistin (or FIZZ1) as an expressed
sequence tag associated with pulmonary inflammation (84).
The expression of resistin is elevated in ob/ob and db/db mice, as well as in the diet-induced
model of diabetes and obesity (82). Resistin mRNA and proteins are down-regulated by
antidiabetic TZDs (76) and insulin (77) in 3T3-L1 adipocytes, and is regulated by members of
C/EBPs and PPARs family (85), suggesting that resistin expression occurs in response to insulin
sensitizing agents. Moreover, resistin mRNA and proteins are both enhanced during 3T3-L1
adipogenesis (73, 74).
2.5. Conclusion
Leptin mediates lipid metabolism by different routes. Its effects are exerted both indirectly
through the central nervous system and directly on the peripheral tissues. Both pathways end up
with similar outcomes: a decrease in triacylglycerol synthesis, an increase in lipid oxidation and
adipocyte apoptosis, and recently, vascular inhibition in adipose tissue. Better understanding of
the mechanisms that affect adipose tissue mass are important in developing better treatments for

16
obesity. Of all peptides studied that affect food intake and body energy balance, leptin is unique
in that it acts in the brain to induce loss of adipose tissue by both apoptosis and increased lipid
metabolism. Presently, a number of factors (86,87) have been identified that predispose or
protect against leptin-induced adipose metabolism/apoptosis, but the complex interaction of
these factors makes studies difficult to design and interpret. Therefore, in this project, we used
advanced proteomics and real-time RT-PCR technologies to identify specific proteins/genes
through which leptin exerts its effects on adipose tissue apoptosis and metabolism.

17
CHAPTER 3
WHITE ADIPOSE TISSUE GENE EXPRESSION PROFILES IN OB/OB MICE
TREATED WITH LEPTIN BY REAL-TIME RT-PCR
Wei Zhang, Mary Anne Della-Fera, Diane L Hartzell1, Dorothy Hausman and Clifton A. Baile. Submitted to Endocrinology
18
ABSTRACT
Leptin, a hormone secreted by adipocytes, has been shown to play a critical role in
regulating body weight, lipid metabolism, apoptosis and microvasculature of adipose tissue.
Ob/ob mice were treated with either PBS (control) or leptin (2.5µg/d or 10µg/d) for 14 days via
subcutaneous (sc) osmotic minipumps. The total RNA from the inguinal (ING) fat pad was
extracted, reverse transcribed to cDNA, followed by quantitative PCR (TaqMan®) assays using
Low Density Arrays (LDA) via an ABI PRISM 7900 Sequence Detection System (SDS) in order
to characterize the potential target genes of leptin related to lipid metabolism and energy
expenditure. Eighteen genes were found to be differentially expressed between control ob/ob
mice and leptin-treated ob/ob mice. mRNA expression for the leptin receptor, genes involved in
lipolysis (hormone sensitive lipase (HSL)), genes related to energy expenditure (uncoupling
protein 2 (UCP2), adrenergic receptor β3 (ADRB3), mitofusion 2 (MFN2), sirtuin 3 (SIRT3)),
transcription factor sterol regulatory element binding factor 1 (SREBF1), genes related to
apoptosis (Bcl-2, Bax, Caspase 3), cytokines (tumor necrosis factor α (TNF α), adiponectin,
complement 3 (C3), as well as genes taking part in inhibition of angiogenesis (angiopoietin 2
(ANGPT2)) were increased. Expression of lipogenesis enzymes (stearoyl-coenzyme A
desaturase 1 (SCD1), fatty acid synthase (FAS)), and retinol binding protein 4 (RBP4) were
repressed. There were no changes in expression of transcription factors involved in adipocyte
differentiation (C/EBPα, PPARα, and PPARγ). Several cellular mechanisms involved in leptin-
mediated adipose tissue loss were identified in ob/ob mice, including the promotion of lipid
oxidation and inhibition of lipid synthesis, increase in energy dissipation and apoptosis of
adipose tissue. In addition, inhibition of angiogenesis in adipose tissue was another possible
pathway by which leptin induced fat loss.

19
Key words: Apoptosis, Lipolysis, Lipogenesis, Angiogenesis
20
1. Introduction
Identification of the ob gene product, leptin, in 1994 (1), was a breakthrough for obesity
research due to its prominent effects on fat metabolism and energy expenditure. For example, in
an experiment conducted in 1995, leptin treatment specifically induced fat loss while
maintaining lean body mass (30,32). Furthermore, leptin-treated ob/ob mice exhibited a greater
decrease in body and fat weights than pair-fed ob/ob mice (33). Following reduced food intake,
ob/ob mice treated with leptin maintained high energy expenditure, while food-restricted mice
demonstrated a reduction in energy expenditure (31). The effect of leptin on body weight is
mediated primarily through its receptors in the hypothalamus (19), through which it increases
expression and triggers the release of anorexigenic peptides and decreases the expression and
release of orexigenic molecules (7,8). Leptin receptors are also expressed in peripheral organs
such as in adipose tissue, liver, and pancreas (89). Accumulating evidence (40,41) indicates that
peripheral leptin administration regulates cellular lipid balance, promoting β-oxidation instead of
lipid synthesis.
Leptin’s effect on body weight, food intake and white adipose tissue adipocyte apoptosis
(11) and loss of bone marrow adipocytes (90) was confirmed by our group. In addition, Duan
(91) found that expression of hypothalamic neuropeptide Y (NPY), agouti-related protein
(AGRP), and arginine vasopressin (AVP) mRNA were down-regulated, while suppressor of
cytokine signaling 3 (SOCS3) was up-regulated (92) in the brain of leptin-treated ob/ob mice
used for the present study. This suggests that the hypothalamus also takes part in the weight-
reducing action of leptin. Both NPY and AGRP are neuropeptides produced in the brain that
increase appetite and decrease metabolism and energy expenditure (93). SOCS3 appears to be of
particular importance in the development of leptin resistance (94).
21
Leptin may induce fat loss in rodents in several ways, for instance via increased lipid
metabolism, inhibition of adipocyte differentiation, increased mitochondrial proton leakage, and
changes in fuel metabolism from carbohydrates to lipids. However, the underlying cellular and
molecular mechanism of fat ablation induced by leptin is not well understood. The present study
takes advantage of medium-throughput real-time RT-PCR techniques and TaqMan® low-density
arrays (TLDAs) (24-gene format), to delineate the multiple gene clusters simultaneously affected
by leptin in ob/ob mice. These findings will help us better understand leptin’s target genes and
signaling pathways during weight loss.
2. Materials and Methods
2.1. Animals
All experimental and surgical procedures in this study were approved by the Animal Care
and Use Committee of The University of Georgia. Fifteen-week-old female obese ob/ob mice
(strain B6.V-Lepob, stock no. 000632) (n=12 for each group) were obtained from Jackson
Laboratories, Inc. After the mice were acclimated for about one week, they were surgically
implanted with osmotic minipumps (model 1002, 0.25 µL/h; Alzet Corp., Cupertino, CA) for s.c.
infusion of treatment solutions. Leptin was administered at doses of 0 (control), 2.5 µg/d and 10
µg/d for 14 consecutive days. Inguinal (ING) fat pads were collected, weighed, and then frozen
in liquid nitrogen prior to being stored at -80°C. The details of animal studies are further
described in Della-Fera et al (11).
2.2. RNA extraction
Total RNA was isolated from the ING fat pads of ob/ob mice, using Trizol reagent
(Invitrogen, Carlsbad, CA) in accordance with the manufacturer’s protocol. One hundred mg of
frozen adipose tissue from each sample was homogenized by adding 1 ml of Trizol reagent. The

22
samples were centrifuged at 12,000 × g for 15 min at 4º C and the aqueous phase was removed
and mixed with 0.5 ml of isopropyl alcohol. After centrifugation at 12,000 × g for 10 min at 4º,
the pellet was washed with 1 ml of 75% ethanol and then dissolved in 12 µl RNase -free water.
1.0 µl of the 12 µl sample was used as an integrity check and for quantification by the Agilent
2100 bioanalyzer and RNA 6000 Nano Assay (Agilent Technologies, Foster City, CA).
2.3. Reverse Transcription and Real-Time RT-PCR
All reagents were from Applied Biosystems (ABI) (Foster City, CA). Five hundred
nanograms of total RNA in a 20 µl reaction was reverse transcribed using a cDNA archive kit
(Applied Biosystems Inc., CA, part No.4322171) in accordance with the manufacturer’s
protocols. Three µl cDNA was mixed well with 47 µl water, and 50 µl TaqMan® Universal PCR
Master Mix, and used for PCR reactions. Reactions were incubated initially at 25ºC for 10 min
and subsequently at 37°C for 120 min. Quantitative PCR (Taqman®) assays were performed
using 384-well Low Density Arrays on an ABI PRISM 7900 Sequence Detection System. All of
the oligonucleotide primers and fluorogenic probe for TaqMan® real time PCR were prepared by
ABI (Table 3.1). The cycle conditions were: 94.5°C for 15s, followed by 40 cycles of 97°C for
30 s, and 59.7°C for 1 min. Through comparing and analyzing the variability of two
housekeeping genes (HKG) (18s and glyceraldehyde-3-phosphate dehydrogenase (GADPH))
from the amplification plot shown in the SDS software, the expression of a target gene was
normalized by using GADPH as an endogenous control reference gene, and sample number of
2038 as a calibrator to correct the differences in the amount of total RNA added to each reaction.
2.4. Quantification of RT-PCR
We used a relative quantification method (also known as the ∆∆ Ct method) to calculate the
gene expression values as described (User Bulletin No. 2, Applied Biosystems). In brief, the

23
amplification plot is the plot of fluorescence versus PCR number. The threshold cycle value (Ct)
is the fractional PCR cycle number at which the fluorescent signal was accumulating enough to
reach detection threshold. Therefore, the input cDNA copy number and Ct are inversely related.
Data were analyzed with the Sequence Detector System (SDS) software version 2.1 (ABI) and
Ct value is automatically converted to fold change RQ value. The Fold change (RQ) = 2 − (∆∆CT),
where–(∆∆CT) = - (∆CT, trt -∆CT, control) = - [(Ct Target - Ct GADPH) trt- (Ct Target - Ct GADPH) control.
The RQ values from each gene were then used to compare the adipocyte gene expression across
all groups (control, 2.5 µg/d and 10 µg/d leptin).
2.5. Statistical Analysis
All statistical analyses were conducted with SAS (Version 9.0) (SAS institute, Cary, NC).
The whole procedure and SAS codes are in the appendix. The Ct value can be automatically
transferred to the RQ value by the software sequence detection system (SDS) (Applied
Biosystems). In brief, RQ values in all samples were submitted to logarithm transformation at
the base of 2 in order to create a linear range between fluorescent signal versus cycle number
(95). The transformed RQ value was then winsorized for dealing with the outliners (96).
Statistical significance of treatment (p<0.05) was assessed by a general linear model based on the
transformed and winsorized data (tRQ) derived from the original RQ value. The tRQ values
were expressed as means ± standard error for all genes. Least square means was used to
determine significance of differences among means (p<0.05). The correlation between body
weight and leptin mRNA expression was examined by means of Spearman’s correlation
coefficients.

24
3. Results
3.1. Effect of S.C. Leptin Injection on Leptin and Leptin Receptor mRNA Expression
in Adipose Tissue of ob/ob Mice
Expression of leptin and leptin receptor mRNA in adipose tissue were measured by real
time RT-PCR. In the 10 µg/d leptin treated group, leptin mRNA was only 27% of the control
group (Figure 3.1A) (P<0.05). In contrast, expression of leptin receptor was 6.9- and 5.4-fold
higher in the 10 µg/d and 2.5 µg/d leptin treatment groups, respectively, compared to the control
group (Figure 3.1A) (P<0.05). In spite of the suppression of leptin expression by administration
of exogenous leptin, there was still a strong correlation between leptin mRNA and body weight
(R=0.76, p<0.05; Figure 3.1B).
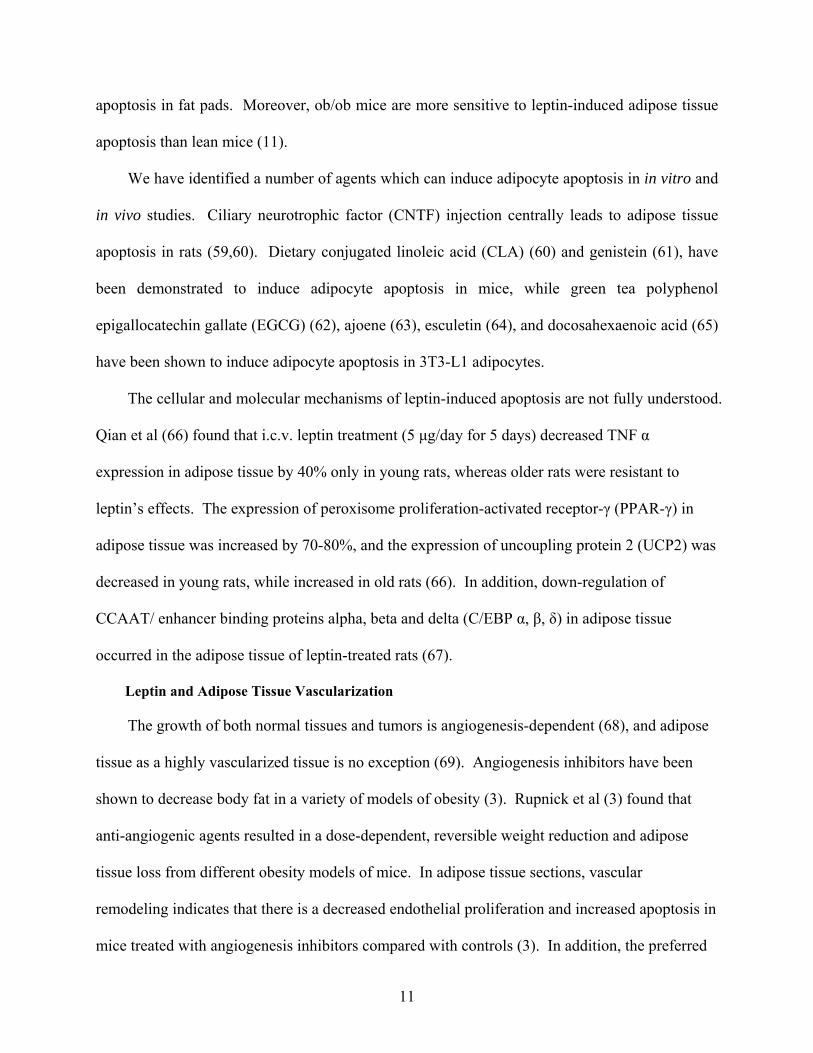
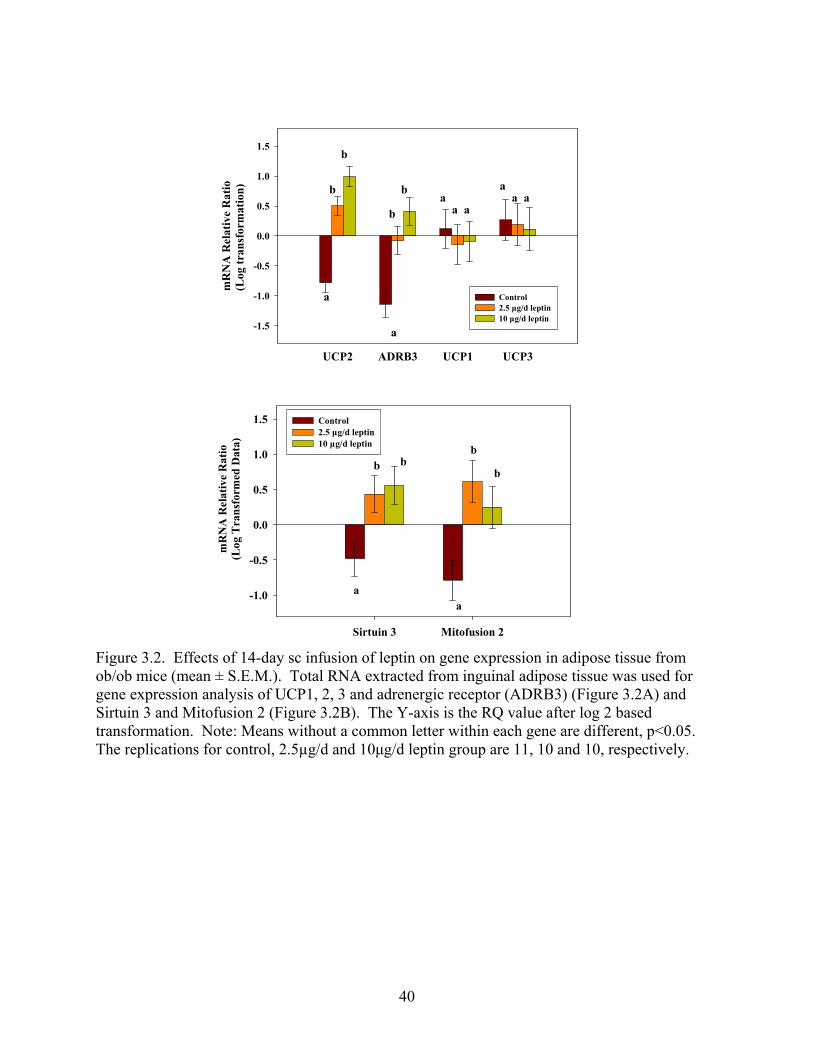
3.2. Energy Expenditure Genes (UCP1, UCP2, UCP3, ADR3, MFN2, and SIRT3)
mRNA in Adipose Tissue of ob/ob Mice
Next we examined the expression of several genes related to energy expenditure. Leptin
treatment increased the gene expression of UCP2 and adrenergic receptor β3 (ADRB3) in a
dose-dependent manner (p<0.05) (Figure 3.2A). 10 µg/d leptin and 2.5 µg/d leptin increased the
mRNA expression of UCP2 by 5.85-fold and 1.63-fold, respectively, compared to the control
group (p<0.05). Similarly, the mRNA level of ADRB3 was increased 4.72-fold (p<0.05) and
1.62-fold by 10 µg/d leptin and 2.5 µg/d leptin, respectively, compared to the control group
(p<0.05). However, leptin injections had no effect on the mRNA expression of UCP1 and UCP3.
Leptin treatment also increased mRNA expression of another two genes related to mitochondrial
energy metabolism: Mitofusion-2 (MFN2) (p<0.05), which is involved in mitochondrial fusion,
and sirtuin-3 (SIRT3), which is responsible for increased thermogenesis (97) (Figure 3.2B)
(p<0.05).

25
3.3. Expression of Key Enzyme Genes (HSL, SCD1, and FAS) in Adipose Tissue of
ob/ob Mice
To further investigate the effects of leptin on adipose metabolism, we examined the mRNA
expression of some key enzymes involved in lipid metabolism. Leptin tended to increase the
mRNA expression of lipolytic enzymes and decrease the mRNA expression of lipid synthesis
enzymes (Figure 3.3). The mRNA levels of hormone sensitive lipase (HSL) in leptin-treated
groups were 3.4- and 2.2-fold higher compared to the control group (p<0.05) in adipose tissue.
In contrast, 10 µg/d leptin decreased the mRNA level of the lipid synthesis enzyme - stearoyl
coenzyme A desaturase 1(SCD1) (p<0.05), while both doses of leptin decreased the mRNA level
of fatty acid synthase (FAS) (p<0.05).
3.4. Expression of Genes -Glucose transporter (GLUT 4) and RBP-4 in Adipose Tissue
of ob/ob Mice
There were no mRNA changes in GLUT4 (also known as Slc2a4), a major glucose
transporter in muscle and adipose cells (Figure 3.4). The mRNA level of RBP4, a mediator
associated with decreasing GLUT 4 transporter and impairing insulin action, was reduced
significantly by 10 µg/d leptin in ob/ob mice (p<0.05).
3.5. Expression of Adipogenesis-Related Genes- C/EBPα, PPAR-α, PPAR-γ, SREBF-1
in Adipose Tissue of ob/ob Mice
Next, we examined the mRNA expression of transcription factors related to adipogenesis.
No mRNA changes were observed for the transcription factors CCAAT/enhancer binding protein
alpha (C/EBPα), peroxisome proliferator activated receptor alpha (PPARα) or gamma (PPARγ)
(Figure 3.5). However, leptin increased the expression of sterol regulatory element binding
factor 1 (also known as SREBF-1 or SREBP-1) (Figure 3.5).
26
3.6. Expression of Apoptotic Markers Related Genes - Bcl-2, Bax and Caspase-3 in
Adipose Tissue of ob/ob Mice
The mRNA expression of Bcl-2, Bax and caspase-3 was increased by leptin in ob/ob mice
(p<0.05) (Figure 3.6).
3.7. Expression of Cytokines (TNFα, Adiponectin, Complement 3) in Adipose Tissue of
ob/ob Mice
The mRNA level of TNFα, an adipose tissue cytokine which takes part in apoptosis and the
lipolytic process, was increased significantly by 10 µg/d leptin (Figure 3.7) (p<0.05). The
mRNA expression of adiponectin (also known as ACDC), a cytokine involved in glucose and
lipid metabolism, was also increased by 10 µg/d leptin (p<0.05). The mRNA level of
complement 3, a cytokine participating in increased insulin sensitivity, was increased by leptin
(p<0.05).
3.8. Angiopoietin-2 (ANGPT2) mRNA in Adipose Tissue of ob/ob Mice
Leptin treatment of ob/ob mice also increased mRNA level of angiopoietin-2, an inhibitor
of angiogenesis in adipose tissue (p<0.05) (Figure 3.8).
4. Discussion
Obese ob/ob mice are characterized by adipose tissue hyperplasia, hypothermia, morbid
obesity, insulin resistance, and multiple endocrine abnormalities due to the absence of leptin (32).
Leptin, as a signal of adiposity, has been widely studied in the regulation of body weight, food
intake and body temperature. Consequently, this strain of mouse has been used as a classical
model to study obesity and diabetes mellitus. In the present study, s.c. infusion of leptin
normalized the phenotype of ob/ob mice, causing a decrease in food intake, body weight and fat
pad weights (11). These results are consistent with those of previous studies utilizing i.c.v.
27
administration of leptin (56). In addition, the mass of brown adipose tissue (BAT) and
gastrocnemius (GC) muscle were both significantly increased in leptin-treated groups (Figure
3.9). Furthermore, leptin- treated ob/ob mice exhibited a greater decrease in body and fat
weights than pair-fed ob/ob mice (33). This suggests that there are mechanisms other than
decreased food intake that are involved in leptin-mediated decrease in body weight; for example,
increased energy expenditure.
There are several different ways to increase energy expenditure, including increased core
body temperature, increased physical activity, and increased non-shivering thermo-genesis
mediated by BAT and GC muscle, which can play an important role in energy expenditure in
rodents. In addition, leptin treatment was also shown to favor the use of lipid rather than
carbohydrate as the energy substrate, as evidenced by the decrease in respiratory quotient of
ob/ob mice treated with leptin (98).
Leptin administration also increased expression of the UCP2 transcript (p<0.05) in adipose
tissue. The role of UCP2 and UCP3 is still not as clear as that of its homologue UCP1, which
takes part in disrupting the proton gradient in the mitochondria, releasing stored energy as heat
without producing ATP. However, an involvement of UCP2 and UCP3 in transporting fatty
acids has been hypothesized (99), and it is assumed that the up-regulation of this protein
following leptin treatment would increase fatty acid transport across the mitochondrial
membrane and enhance lipid β-oxidation. Moreover, leptin only induced the expression of
UCP2 in adipose tissue, with no change in level of UCP1 and UCP3 in the present study, which
is in agreement with other studies done in normal rats (4,100). One possible explanation is that
each subtype of the uncoupling proteins exists in different tissues, UCP 1 is primarily located in
BAT, UCP2 is widely expressed in white adipose tissue, heart and muscle; and UCP3 is

28
expressed mainly in BAT and skeletal muscle (101,102). In the present study, we only measured
the expression of UCP homologues in the adipose tissue, but it would be useful to also know
their levels in BAT.
The three known subtypes of β-adrenoreceptors (β (1)-AR, β (2)-AR, and β (3)-AR) are
differentially expressed in brown and white adipose tissue, and mediate peripheral responses to
central modulation of sympathetic outflow by leptin. β-3-AR expression was higher in the ING
fat pad of leptin-treated groups in the present study. This subtype of β-adrenoreceptor is a
critical signal mediating peripheral responses of leptin to activate sympathetic nervous system
(SNS) output from the hypothalamus (103) affecting body temperature and metabolic rate,
primarily via BAT. It is also required for leptin-mediated regulation of ob mRNA expression in
adipose tissue (104). Therefore, there may be increased numbers of adrenergic receptors in
adipose tissue of leptin treated mice (104). β3-receptors probably mediate the increase in
thermogenesis and lipolysis that occurs with adrenergic stimulation. β3-receptor activation also
suppresses leptin expression and secretion (105).
The expression of mitofusion 2 (MFN2) was also increased in the leptin-treated groups
(p<0.05). Mitofusion 2, a mitochondria membrane protein of large GTPase, is essential for
mitochondrial fusion. Mitochondria are dynamic organelles, and both fission and fusion
processes are normal events for mitochondria to regulate apoptosis and production of energy. Its
homologue is well studied in Drosophila fuzzy onion (Fzo) (106) and yeast (Fzo 1) (107),
although much less is known about the role of mitofusion 2 in the process of regulating
mitochondria morphology in mammals. The activity of MFN 2 was reduced in obesity, and
increased following surgery for reducing body weight (108). It is also hypothesized that pro-

29
fusion factors make cells resistant to apoptosis, while pro-fission factors make cells sensitive to
apoptosis (109,110), but this still needs further research.
Sirtuin3 expression was also increased by leptin. Sirtuin3 is the sirtuin homolog of the
yeast sir 2 gene, which is critical for the effect of caloric restriction on extending life span in
yeast and C. elegans. Sirt3 can be expressed in both white and brown adipose tissues, and it not
only promotes the activity of UCP1 and augments thermogenesis, but also increases oxygen
consumption (97). Moreover, SIRT3 expression in brown adipose tissue is down-regulated in
several strains of genetically obese mice (25). Our finding that leptin treatment increased
expression of Sirt3 is consistent with the increased thermogenesis and fat loss that we
demonstrated in the ob/ob mice treated with leptin (11).
The coordinated regulation between lipid synthesis and oxidation, adipocyte differentiation
and de-differentiation determines fat mass. The two opposing biochemical processes, lipolysis
and lipid synthesis, are controlled by different enzymes and hormones. Leptin can act as an
autocrine or paracrine signal to change the rate of synthesis and degradation of lipids (42,111).
Therefore, we hypothesized that leptin regulates gene expression of key enzymes related to lipid
metabolism. As expected, the level of expression of hormone sensitive lipase (HSL) (Figure 3)
in leptin-treated groups was increased (p<0.05). HSL is the rate-limiting enzyme responsible for
the intracellular TG hydrolysis and fatty acid mobilization in adipose tissue. Leptin decreased
expression of the lipogenesis enzymes SCD1 and FAS (Figure 3.3) (p<0.05). SCD1 is a
lipogenic enzyme catalyzing the synthesis of monounsaturated fatty acids (MUFAs), which are
important components of phospholipids, triglycerides and cholesteryl esters, from saturated fatty
acids (112). Knockout SCD-1 mice have reduced body fat content and are resistant to diet-
induced obesity (113). Mice with disruption of both SCD-1 and ob/ob genes are less obese than

30
ob/ob control mice, and have reduced serum triacylglycerols and very low density lipoproteins in
liver (114). Hepatic steatosis and hyperinsulinemia have been improved dramatically in
lipoatrophic mice treated with i.c.v. leptin injection, an effect which was due to suppression of
SCD1 expression and activity (115). It is proposed that mice lacking SCD-1 have increased
energy expenditure and increased oxygen consumption. All findings indicate that down–
regulation of SCD-1 is an important component of the metabolic response to leptin. Fatty acid
synthase (FAS) is a unique enzyme involved in catalyzing de novo lipid synthesis in the cytosol
by converting acetyl-CoA to the long-chain fatty acids palmitate (C16), which is further
synthesized into triacylglycerols, and then stored in adipose tissue (116). Our finding of reduced
FAS expression in leptin-treated ob/ob mice is consistent with their reduced body weight and fat
loss (11).
Retinol binding protein 4 (RBP4) was recently identified as a cytokine from adipose tissue
by DNA array analysis (117), and it is associated with decreased activity of the GLUT4 glucose
transporter, leading to impaired insulin sensitivity. It was also demonstrated that RBP4 level in
adipose tissue was increased in knockout Glut -/- mice (117). The serum RBP4 levels were
elevated in mice and humans with insulin resistance (118), and decreased by rosiglitazone, a
drug used for improving insulin sensitivity. The mechanism by which RBP4 affects insulin
action and glucose metabolism is not clearly understood. It was shown that RBP4 reduced
activity of PI-3 kinase for phosphorylation of insulin receptor substrate-1 and phosphoenol
pyruvate carboxykinase (PEPCK) for gluconeogenesis in liver (117). In the present study, leptin
reduced the RBP4 level in adipose tissue, which is consistent with leptin-induced enhanced
insulin sensitivity in ob/ob mice. It is also consistent with the present results that
hyperinsulinemia was partly corrected by leptin (11).
31
In addition to regulating lipid metabolism, leptin is believed to reduce adipose mass by
inducing adipocyte apoptosis. Previous studies showed that leptin treatment caused a rapid loss
of fat in rodents, and that body weight remained low even after leptin treatment was terminated
(119). Qian, et al., hypothesized that this delayed recovery was due to apoptosis of adipose
tissue. In agreement with previous data (56), leptin induced apoptosis in all three fat depots in
the present study (11). The genes related to apoptosis (Bcl-2, Bax, and Caspase 3) were
correspondingly modified at the level of mRNA (Figure 3.6). The intrinsic pathway of apoptosis
is mainly determined by the balance of pro- (Bax, Bak, Bok) and anti-apoptotic (Bcl-2, Bcl-XL)
members of Bcl-2 family in the mitochondria (120). Usually, Bax promotes apoptotic death and
Bcl2 protein inhibits apoptosis by affecting the electron transport chain and cytochrome c release
into the cytoplasm (121,122). To be noted, the ratio of Bcl-2/Bax appears to regulate
mitochondrial membrane permeability and therefore modify the susceptibility to apoptosis
following an apoptotic stimulus (120). Furthermore, leptin-induced apoptosis was partly
mediated by the up-regulation of Bax in adipose tissue (59) and these two proteins, bcl-2 and bax,
also took part in the apoptosis observed in BAT (122).
The caspase family of cysteine proteases are primary mediators of apoptosis (120). They are
triggered in response to various apoptotic stimuli and mediate proteolytic cleavage of cellular
substrates. Caspase-3 is thought of as an effector or executioner caspase and is a crucial
mediator for mitochondrial apoptosis (123). Caspase-3 may take part in the process of leptin-
induced apoptotic pathways in adipose tissue in rats (124), and inhibition of caspases protects
BAT from apoptosis (125).
In the present study, the expression of Bax and caspase-3 were increased significantly by
leptin treatments, which is consistent with previous studies (59,124), indicating they may take

32
part in the apoptosis pathway. However, no change was observed for the ratio of Bcl-2/Bax
(data not shown). Considering the role of Bcl-2 as an anti-apoptotic signal, its increased level
seems contradictory to the increased apoptosis in adipose tissue observed in the present study
and, thus, further study will be required to confirm this observation.
In contrast to leptin, insulin has a lipogenic effect on cultured adipocytes (45). Leptin
inhibits the binding of insulin to adipocytes (126) (127), and the lipogenic effect of insulin in
skeletal muscle was decreased by leptin treatment (128). In the present study, the reduced level
of insulin and its corresponding lipogenic effect may have contributed to the fat loss (11).
There were no leptin-induced changes in expression of C/EBPα, PPARα, and PPARγ,
transcription factors critical for adipogenic regulation, in the current study. PPARα and γ are
ligand-activated transcription factors that belong to the nuclear hormone receptor superfamily.
PPARα regulates the genes related to fatty acid β-oxidation in liver, whereas PPAR γ promotes
adipocyte differentiation and lipid storage preferentially residing in adipose tissue. The
expression of PPARγ in normal rats treated with leptin was reported to be up-regulated (129),
which may be due to different species genetic background and/or experimental methods, and it
need to be further studied. Interestingly, mutant mice with both PPARγ and ob dysfunctional
genes had a normal phenotype (130).
There are few studies in the literature about the effect of leptin on the expression of PPARα,
and it was reported (131) that it was up-regulated in myoblasts by leptin. PPARα-null mice are
protected from high-fat diet-induced insulin resistance (132). C/EBPα is another transcription
factor which is expressed during late phase of adipogenesis (133). Reports about the effect of
leptin on C/EBPα expression are not consistent; one study showed it was down-regulated (134),
while another study demonstrated no change in expression by leptin (135).
33
Sterol regulatory element binding factor 1 (SREBF-1) has been shown to regulate several
key genes related to lipid metabolism, particularly FAS in cultured adipocytes and ob mice
(136,137). In the present study, leptin increased SREBF-1 expression, which is contrary to a
microarray study which showed that leptin decreased SREBF-1 expression at the RNA and
protein level in white adipose tissue (138). Recent evidence also shows that SREBF-1 regulated
lipid metabolism in the liver and is not involved in obesity in ob/ob mice (139). Further studies
are needed to define the relationship between SREBF-1 and lipid metabolism with leptin
treatment.
Adipocyte leptin production and secretion are probably maintained through direct autocrine
and/or paracrine negative feedback signals (140), as well as regulation by cytokines, such as
TNFα (141) and adiponectin (74,142). Expression of both TNFα and adiponectin were increased
in the leptin-treated groups in this study. TNFα is a cytokine that acts as a lipolytic factor (143),
stimulating lipolysis and inducing apoptosis in adipose tissue (67,144), stimulating VLDL
production in the liver, and regulating other adipokines. TNFα promotes lipolysis by inhibiting
lipoprotein lipase activity in vivo (145), inhibiting food intake, and promoting insulin resistance.
ACDC (adiponectin), is secreted specifically by differentiated adipocytes, and like leptin, it is an
abundant adipocytokine primarily produced from subcutaneous fat. Adiponectin has been
implicated in improving insulin sensitivity. In contrast to most adipocytokines, and specifically
leptin, the level of serum adiponectin is reduced in obese humans and rodents (76), and loss of
body weight increases its expression, while refeeding will return adiponectin to its previous low
level (77). In the present study, leptin treatment increased the expression of adiponectin in white
adipose tissue in ob/ob mice, which is consistent with the study of Delporte et al (80).

34
There are several potential mechanisms that could explain why leptin treatment up-
regulated adiponectin mRNA expression in adipose tissue in ob/ob mice. First, the reduced body
weight, especially the reduced fat depots per se, is a critical factor to determine the expression
level of adiponectin. Fat mass is usually negatively correlated with the expression of adiponectin
(77). Second, enhanced sympathetic nervous activity could be a potential factor. The
sympathetic nervous system is a primary pathway through which leptin regulates adipose tissue
metabolism (104). The increased weight of BAT and GC muscle, together with the up-regulated
expression of ADRB3 and UCP2 are good indicators of enhanced sympathetic tone. It was
shown that acute exposure to β-adrenergic agonists decreased adiponectin mRNA levels (146).
Third, the reduced hyperinsulinemia or improved insulin sensitivity might play a role in up-
regulating adiponectin mRNA level.(147).
C3 was traditionally assumed to be synthesized by the liver (148),, but it is also produced by
human adipocytes (149). Acylation-stimulating protein (ASP), a cleavage product of C3, can act
as a paracrine signal to be a potent stimulator of triglyceride synthesis (150), and also
participates in energy repartitioning (151,152). Plasma C3 was shown to be increased by high
fat diet feeding (153), TNFα (154), and in obese animals (155); whereas it was decreased in
humans after weight loss. The increased expression of C3 by leptin treatment would tend to
increase triglyceride synthesis and decrease energy expenditure, which was contrast to fat loss
effect of leptin in the present study. Therefore, further study is needed on the role of C3 in
adipose tissue of ob/ob mice.
In addition to the contributions of increasing energy expenditure, lipid oxidation, and
adipose cell apoptosis, the increased fat loss caused by leptin treatment could be due to the
degeneration of blood vessels in the adipose tissue (72,156). The growth of both normal tissues

35
and tumors is angiogenesis-dependent, and adipose tissue is no exception (70). Angiogenesis
inhibitors have been shown to decrease body fat in a variety of models of obesity (54). ANG-2
was expressed primarily by adipose endothelial cells as a receptor antagonist, taking part in
vascular remodeling. Cohen (72,114) showed that the induction of ANG-2 coincided with
initiation of apoptosis in endothelial cells in adipose tissue, leading to regression of adipose
tissue. In our present study, leptin was shown to induce ANG-2 expression in adipose tissue,
suggesting a possible vasculature regression effect. However, other studies reported no mRNA
change in ANG2 expression in ob/ob mice following leptin treatment (157). This could be due
to differences in age of the ob/ob mice and difference in the dose and length of leptin treatment.
In summary, peripheral leptin is able to increase lipid metabolism via many different routes,
including a decrease in lipid synthesis partly mediated by the decreased expression of SCD1 and
FAS, and an increase in lipid oxidation partly mediated by the increased expression of HSL.
Furthermore, the ability of leptin to reduce lipogenesis can be mediated by insulin, TNFα and
adiponectin. Adipocyte apoptosis mediated by the cytokine TNFα, by caspase-3, and mitofusion
2 is another possible way by which leptin may act to reduce adipose tissue mass. Repressed
angiogenesis in adipose tissue via increased ANG-2 expression is also a possible mechanism to
enhance the capacity of leptin to regulate fat metabolism. In addition, the reduced food intake
(energy input) and the increased energy expenditure through increased physical activity, higher
core body temperature, and nonshivering thermogenesis all contributed to leptin’s weight-loss
effects. The increased expression of β-3AR and Sirturin 3, resulting from increased sympathetic
tone, play a role in the increased thermogenesis induced by leptin acting via its hypothalamic
receptors.

36
Acknowledgments
We are grateful for the assistance by Roger Nelson and Kara Huff with the RT-PCR
facilities and advice. We appreciate the help with statistical analyses by Jaxk Reeves and
Rebecca Barrett. We are also grateful for Ji Lin and Srujana Rayalam for assistance for choosing
the specific genes of the low-density card, and Hea Jin Park for assistance with the photographs.
This work was supported in part by the Georgia Research Alliance Eminent Scholar
endowment held by CAB.

37
Table 3.1. Probes used in real-time PCR I
Gene Symbol Gene Name Context Sequence
18S Eukaryotic 18S rRNA CCATTGGAGGGCAAGTCTGGTGCCA ACDC Adipocyte, C1Q and collagen domain containing AAGGAGATGCAGGTCTTCTTGGTCC ADRB3 Adrenergic receptor, beta 3 TCCACCGCTCAACAGTTCCCTTCTT
ANGPT2 Angiopoietin 2 ACCCAACTCCAAGAGCTCGGTTGCT CACH Cytosolic acetyl-CoA hydrolase AGCAGGTTCAGCGATTCCATTTGTA CEBPα CCAAT/enhancer binding protein (C/EBP), alpha AGCCACCGCCGCCACCGCCACCGCC
FAS Fatty acid synthase GTGGATGGAGGTATCAACCCAGCCT GAPDH Glyceraldehyde-3-phosphate dehydrogenase GTGAACGGATTTGGCCGTATTGGGC GPD1 Glycerol-3-phosphate dehydrogenase 1 (soluble) TGCCCCCCAATGTGGTGGCCATCCC LEP Leptin TTTCACACACGCAGTCGGTATCCGC
LEPR Leptin receptor AGCTGAGGTATCACAGGCGCAGCCT HSL Lipase, hormone sensitive GCCCACAGCAGAGTCTGTGCGCCCC LPL Lipoprotein lipase ATCCATGGATGGACGGTAACGGGAA
MFN2 Mitofusin 2 TTTTTTGGCCGGACGAGCAATGGGA PPARα Peroxisome proliferator activated receptor alpha TGTGGAGATCGGCCTGGCCTTCTAA PPARγ Peroxisome proliferator activated receptor gamma AGTGGAGACCGCCCAGGCTTGCTGA SCD1 Stearoyl-Coenzyme A desaturase 1 CACCTGCCTCTTCGGGATTTTCTAC
SIRT3 Sirtuin 3 (silent mating type information regulation 2, homolog) 3
(S. cerevisiae) AGGGGAAGACATATGGGCTGATGTG
GLUT4 Solute carrier family 2
(facilitated glucose transporter), member 4 TGGCTCTGCTGCTGCTGGAACGGGT SREBF1 Sterol regulatory element binding factor 1 ACATCGAAGACATGCTCCAGCTCAT TNF α Tumor necrosis factor CCCAAAGGGATGAGAAGTTCCCAAA UCP1 Uncoupling protein 1, mitochondrial AAAGTCCGCCTTCAGATCCAAGGTG UCP2 Uncoupling protein 2 CTCTGGAAAGGGACTTCTCCCAATG UCP3 Uncoupling protein 3, mitochondrial GGTCCGTCTGCAGATCCAAGGGGAG Bcl-2 B-cell leukemia/lymphoma 2 GATAACGGAGGCTGGGATGCCTTTG Bax Bcl2-associated X protein CTGGTGCTCAAGGCCCTGTGCACTA

38
Gene Symbol Gene Name Context Sequence Casp3 Caspase 3 TACAGCACCTGGTTACTATTCCTGG
C3 Complement component 3 TGAAGGTCGTGCCAGAAGGAATGAG RBP-4 Retinol binding protein 4, plasma ACACAATGGTTACTGTCAAAGCAGG

39
Lep Lepr
-1.5
-1.0
-0.5
0.0
0.5
1.0
1.5
Control2.5 µg/d leptin10 µg/d leptin
a
b
b
a
bab
mR
NA
Rel
ativ
e R
atio
(Log
tran
sfor
mat
ion)
Body Weight
30 35 40 45 50 55 60 65 70
Lept
in m
RN
A e
xpre
ssio
n
-3
-2
-1
0
1
2
3
R2= 0.76
Figure 3.1. Effects of 14-day sc infusion of leptin on gene expression in adipose tissue from ob/ob mice (mean ± S.E.M.). Total RNA extracted from inguinal adipose tissue was used for gene expression analysis of leptin and leptin receptor (Figure 3.1A). The correlation between body weight and leptin mRNA expression was examined by means of Spearman’s correlation coefficients (Figure 3.1B). The Y-axis is the RQ value after log 2 based transformation. Note: Means without a common letter within each gene are different, p<0.05. The replications for control, 2.5µg/d and 10µg/d leptin group are 11, 10 and 10, respectively.
40
UCP2 ADRB3 UCP1 UCP3
-1.5
-1.0
-0.5
0.0
0.5
1.0
1.5
Control2.5 µg/d leptin10 µg/d leptin
a
b
b
a
b
ba
a a
aa a
mR
NA
Rel
ativ
e R
atio
(Log
tran
sfor
mat
ion)
Sirtuin 3 Mitofusion 2
-1.0
-0.5
0.0
0.5
1.0
1.5 Control2.5 µg/d leptin10 µg/d leptin
mR
NA
Rel
ativ
e R
atio
(Log
Tra
nsfo
rmed
Dat
a)
a
b
a
b
bb
Figure 3.2. Effects of 14-day sc infusion of leptin on gene expression in adipose tissue from ob/ob mice (mean ± S.E.M.). Total RNA extracted from inguinal adipose tissue was used for gene expression analysis of UCP1, 2, 3 and adrenergic receptor (ADRB3) (Figure 3.2A) and Sirtuin 3 and Mitofusion 2 (Figure 3.2B). The Y-axis is the RQ value after log 2 based transformation. Note: Means without a common letter within each gene are different, p<0.05. The replications for control, 2.5µg/d and 10µg/d leptin group are 11, 10 and 10, respectively.

41
HSL SCD 1 FAS-1.5
-1.0
-0.5
0.0
0.5
1.0
1.5
2.0
Control2.5 µg/d leptin10 µg/d leptin
a
b
ba
ab
b
a
b
c
mR
NA
Rel
ativ
e R
atio
(Log
Tra
nsfo
rmat
ion)
Figure 3.3. Effects of 14-day sc infusion of leptin on gene expression in adipose tissue from ob/ob mice (mean ± S.E.M.). Total RNA extracted from inguinal adipose tissue was used for gene expression analysis of HSL, SCD1 and FAS. The Y-axis is the RQ value after log 2 based transformation. Note: Means without a common letter within each gene are different, p<0.05. The replications for control, 2.5µg/d and 10µg/d leptin group are 11, 10 and 10, respectively.
GLUT RBP4
mR
NA
Rel
ativ
e R
atio
(Log
Tra
nsfo
rmed
Dat
a)
-1.5
-1.0
-0.5
0.0
0.5
1.0 Control2.5 µg/d leptin10 µg/d leptin
a
a
aa
a
b
Figure 3.4. Effects of 14-day sc infusion of leptin on gene expression in adipose tissue from ob/ob mice (mean ± S.E.M.). Total RNA extracted from inguinal adipose tissue was used for gene expression analysis of GLUT4 and RBP4. The Y-axis is the RQ value after log 2 based transformation. Note: Means without a common letter within each gene are different, p<0.05. The replications for control, 2.5µg/d and 10µg/d leptin group are 11, 10 and 10, respectively.

42
SREBF1 PPAR α PPAR γ C/EBP α-1.5
-1.0
-0.5
0.0
0.5
1.0
1.5
2.0Control2.5 µg/d leptin10 µg/d leptin
a
b
b
a
a
a
a
a
a
a
aa
mR
NA
Rel
ativ
e R
atio
(Log
Tra
nsfo
rmed
Dat
a)
Figure 3.5. Effects of 14-day sc infusion of leptin on gene expression in adipose tissue from ob/ob mice (mean ± S.E.M.). Total RNA extracted from inguinal adipose tissue was used for gene expression analysis of SREBF1, PPARα, PPARγ and C/EBPα. The Y-axis is the RQ value after log 2 based transformation. Note: Means without a common letter within each gene are different, p<0.05. The replications for control, 2.5µg/d and 10µg/d leptin group are 11, 10 and 10, respectively.
BCL 2 BAX CASPASE 3
-1.5
-1.0
-0.5
0.0
0.5
1.0
1.5 Control2.5 µg/d leptin10 µg/d leptin
mR
NA
Rel
ativ
e R
atio
(Log
Tra
nsfo
rmed
Dat
a)
a
bb
a
b
a
bb
b
Figure 3.6. Effects of 14-day sc infusion of leptin on gene expression in adipose tissue from ob/ob mice (mean ± S.E.M.). Total RNA extracted from inguinal adipose tissue was used for gene expression analysis of BCL2, BAX and CASPASE3. The Y-axis is the RQ value after log 2 based transformation. Note: Means without a common letter within each gene are different, p<0.05. The replications for control, 2.5µg/d and 10µg/d leptin group are 11, 10 and 10, respectively.

43
TNF α Adiponectin Complement 3-2.0
-1.5
-1.0
-0.5
0.0
0.5
1.0
1.5 Control2.5 µg/d leptin10 µg/d leptin
a
bb
a
b
b
a
b b
mR
NA
Rel
ativ
e R
atio
(Log
Tra
nsfo
rmed
Dat
a)
Figure 3.7. Effects of 14-day sc infusion of leptin on gene expression in adipose tissue from ob/ob mice (mean ± S.E.M.). Total RNA extracted from inguinal adipose tissue was used for gene expression analysis of TNFα, Adiponectin, Complement 3. The Y-axis is the RQ value after log 2 based transformation. Note: Means without a common letter within each gene are different, p<0.05. The replications for control, 2.5µg/d and 10µg/d leptin group are 11, 10 and 10, respectively.
Control 2.5 µg/d Leptin 10 µg/d Leptin
-1.5
-1.0
-0.5
0.0
0.5
1.0
1.5
a
b
c
mR
NA
Rel
ativ
e R
atio
(Log
Tra
nsfo
rmed
Dat
a)
Angiopoietin-2
Figure 3.8. Effects of 14-day sc infusion of leptin on gene expression in adipose tissue from ob/ob mice (mean ± SEM). Total RNA extracted from inguinal adipose tissue was used for gene expression analysis of Angpoietin-2. The Y-axis is the RQ value after log 2 based transformation. Note: Means without a common letter within each gene are different, p<0.05. The replications for control, 2.5µg/d and 10µg/d leptin group are 11, 10 and 10, respectively.

44
Figure 3.9. Effects of leptin on brown adipose tissue weight (Figure 3.9A), percentage of BAT vs. body weight (BW) (Figure 3.9B), and weight of gastrocnemius (GC) muscle (Figure 3.9C) from female ob/ob mice (mean ± SEM). Note: Means without a common letter are different, p<0.05. The replications for control, 2.5µg/d and 10µg/d leptin group are 11, 10 and 10, respectively.

45
CHAPTER 4
TEST OF DIFFERENT DEGERGENT COMBINATIONS TO ENHANCE THE
DETECTION OF PROTEOME FROM MURING ADIPOSE TISSUE
Wei Zhang, Tracy Andacht, Pam Kirby, Yang-Ho Choi, Diane L. Hartzell, Mary Anne Della-
Fera, Clifton A. Baile. Abstract to BHSI meeting (2005), Athens, GA

46
ABSTRACT
Proteins from adipose tissue are especially difficult to be resolved for 2-D analysis due to
the presence of extremely large amounts of lipid. To get the most protein spots in 2-D maps,
different combinations of chaotropes (urea and thiourea), surfactants (CHAPS and ASB14) and
reducing agents (DTT and 2-hydroxyethyldisulfide (HED)) were varied in the extraction buffer.
Inguinal white adipose tissue from ob/ob mouse was prepared by homogenizing, ultra
centrifuging and eliminating interferences by 2D clean-up kit (GE healthcare), and the extracted
proteins were measured by protein assay. IPG strips (11cm, pH 3-10) were applied by in-gel
sample rehydration in the first dimension IEF, and SDS-PAGE (8-16% Criterion precast gel) was
used in the second dimensional electrophoresis. These gels were then stained by SYPRO Ruby®
and scanned in order to be evaluated for protein patterns. We described the modification of a
protocol using a combination of chaotropic agents (8.4M urea and 2.4M thiourea), zwitterionic
agents (2% CHAPS and 2% ASB14), 1% IPG buffer, 15mM Tris and 50nM DTT for reducing
reagents as the basis for sample preparation and IEF solutions, giving better efficiency in
solubilization, separation and recovery of proteins from mouse inguinal adipose tissue.
Key words: Proteomics, ob/ob, Leptin, Mouse, Obesity

47
Proteomics could be described as the comprehensive study of the structures, functions and
interactions of whole sets of proteins globally and dynamically (158). The combined use of 2-
dimensional electrophoresis (DE) for protein separation and Mass Spectrometry (MS) for protein
identification is the method of choice for characterization of proteins expressed at a given time
under certain biological conditions in intricate samples. The ability to separate proteins with
high resolution is the critical and first step for proteome analysis. Some technical improvements
have been made in order to increase the resolving power in 2-DE such as the use of IPGs (159),
narrow pH gradients (zoom gels) (160), long IPG strip, and IEF prefractionation (161). However,
samples from adipose tissue are particularly difficult to study due to the large amounts of lipid
present.
With the steadily increasing incidence of obesity all over the world, the biochemistry of
white adipose tissue attracts great attention since obesity is an important risk factor in the
development of type 2 diabetes and cardiovascular diseases (12). Knowledge about the role of
white adipose tissue has changed from the assumption that it was only a passive organ for lipid
storage to the understanding that it is an active endocrine and paracrine organ, which can secrete
several adipokines such as leptin, TNFα, adiponectin, and resistin (162). It is these cytokines
that have a role in influencing many metabolic processes, such as mobilization of lipids from
adipose tissue, and stimulating glycolysis and glucogenesis in the liver. Therefore, one of the
major interests in obesity research is to investigate these cytokines, with the objective of
developing potential anti-obesity drugs.
Leptin, the product of the ob gene first discovered in 1994 (1), has been a major focus in the
field of obesity research due to its specific role in regulation of food intake and energy
expenditure (30,32). We have been interested in determining the differential expression of

48
proteins in adipose tissue of control ob/ob mice compared to leptin-treated ob/ob mice in order to
better understand the potential mechanisms involved in weight-loss induced by leptin. However,
due to its large amount of intracellular lipids, adipose tissue imposes problems in the use of 2-D
analysis to separate and identify proteins. Thus, in this preliminary work, we have optimized a
protocol for extraction buffer and IEF procedure with IPGs 3-10 (11cm) strips for adipose tissue
from ob/ob mice, which will lay the groundwork for our further proteomic studies on adipose
tissue in ob/ob mice.
The inguinal white adipose tissue from 15 week old female obese ob/ob mice (C57BL/6J
background; purchased from Jackson Laboratory, Bar Harbor, ME) was used. It was frozen
immediately after dissection and stored at -80° until homogenization. Before homogenization,
the fat pads were weighed and thawed in the different extraction buffers (total volume 2 ml/g fat
pad) as described in table 4.1. The flow chart is presented in Figure 4.1. The homogenization
(Fisher Scientific PowerGen 700D, Hampton, NH) was performed on ice at 18,500 rpm for 2
minutes, followed by centrifugation at 13,000 g at 4°C for 20 minutes. Three fractions were
obtained: the upper layer consisting of fat; a water soluble infranatant which was transferred to a
new ultracentrifuge tube while avoiding a small amount of un-homogenized material at the
bottom of the tube. The infranatant fluid was then ultra-centrifuged at 40,000 g at 4°C for 4
hours (Sorvall® DiscoveryTM 100 ultracentrifuge and rotor T-880, GMI Inc., Ramsey, MN, USA).
Another three fractions were obtained as before and the infranatant was transferred to a new tube
and further purified by 2D clean-up kit as recommended by the manufacturer (GE Healthcare),
therefore the extracted proteins were purified by removing lipids, nucleic acids, salts and any
other interfering contaminants under the condition of the least protein loss. Thus, proper
isoelectric focusing and minimal streaking was obtained for the first dimensional electrophoresis.

49
The proteins were re-suspended in the corresponding extraction buffer. The protein
concentration was measured by the Bradford dye-binding method (Bio-Rad, Hercules, CA) (163).
The pH of the samples was adjusted to be between 8.3-8.5. The samples then were aliquoted and
stored at -80°C until the 2-DE analysis was performed. A crude estimate of extraction efficiency
for each extraction buffer was obtained by 1-D SDS-PAGE analysis with molecular markers as
standards (data not shown). Subsequent analytical 2-D gels are able to provide more overall
protein patterns and accurate extraction power between different extraction detergents. The
experiments were performed in duplicate for each condition and pH range.
Criterion Tris-HCl gel (8-16%), Protean IEF cell, and Criterion Cell were from Bio-Rad.
IPG Strips (11cm, pH 3 -10) were applied by in-gel sample rehydration. Each strip was
rehydrated in a total volume of 185 µl rehydration solvent, which was composed of 10–50 µl of
protein solution equal to 75 µg protein for each gel. The focusing was carried out in the
following sequence according to the literature (164): 30V for 12h, 120V for 1h, 200V for 1h,
500V for 1h, 1000V for 1h, 2000V for 1h, 3000V for 1h, 4000V for 4h to reach a total of ~22
KVh. IPG strips were immediately equilibrated for SDS-PAGE. To achieve equilibration and
reduction of disulphides, the IEF strips were incubated (5 min, gentle shaking) with 6 M urea,
2% SDS, 50 mM Tris (pH 8.8), 65 mM DTT, 30% glycerol (w/v) and 0.02% bromophenol blue
after the IEF run. In a second step, alkylation of sulphydryl groups was carried out in the same
solution, except that DTT was replaced by 260 mM IAA (15min, gentle shaking). The
equilibrated strips were immersed in SDS running buffer (25mM Tris, 192mM glycine and 0.1%
SDS) for approximately 15s before they were sealed at the top of the second dimension gel with
0.6% agarose submerged in SDS running buffer. Molecular protein marker and BSA were

50
loaded as internal standards. Electrophoresis was performed in the Criterion Cell at 125 V for 2-
3 h until the tracking dye, bromophenol blue, reached the anodic end of the gels.
Staining with SYPRO Ruby® was essentially performed as recommended by the
manufacturer (BioRad): the gels were fixed with 30% ethanol, 7.5% acetic acid for 1 h, stained
in SYPRO Ruby®, 50 ml/gel, for 12-16 h in the dark and then rinsed in 10% methanol, 6% acetic
acid for 15min. For visualization of the proteins, the gels were scanned directly with a Typhoon
9400 scanner (GE Healthcare).
The “standard” IEF sample solution (8 M urea, 4% CHAPS, 50-100 mM DTT and 40 mM
Tris base.) is not ideal for many membrane proteins and samples such as adipose tissue, and
serum. The inclusion of thiourea in the IEF procedure greatly increases the resolution of the gel
spots, especially for membrane proteins (165,166) and adipose tissue (167). Initially in the
present study, IEF separations (pH 3–10) of proteins from mouse white adipose tissue were
performed and a comparison between two different concentration combinations of thiourea and
urea (2M thiourea + 7M urea vs. 2.4M thiourea + 8.4M urea) was made. The latter cocktail
(Figure 4.1B) exerts a higher quality of protein patterns than the former one (Figure 4.1A), while
no spots disappeared or showed decreased in density.
Chaotropic agents, such as urea, are strong denaturants of proteins, disrupting their
hydrogen bonds, exposing their hydrophobic residues to contact with the solution, and unfolding
protein structure (168). The Rabilloud group (166) first introduced the combination use of
thiourea and urea to improve the solubilization of the proteins during the IEF procedure.
Thiourea is a strong agent for breaking hydrophobic bonds. Therefore, the mixture of urea and
thiourea offers excellent results in many cases (169,170). Although thiourea is a competent
chaotrope, it requires a high concentration of urea for its solubility, and the optimal condition

51
includes solutions of 2-3 M thioruea plus 5-7 M urea. Based on reports in the literature
(167,171), we decided to include thiourea in the extraction buffer, and two different
concentrations of urea and thiourea were compared and optimized (Figure 4.1A and 4.1B). We
showed that the extraction buffer and IEF solution that was the most efficient had a
concentration of 2.4 M thiourea in 8.4 M urea.
Besides the use of thiourea/urea mixtures, it is usual to have at least one surfactant in the
extraction buffer and IEF solution. Surfactants present help to solubilize the unfolded proteins
following exposure by strong chaotropic agents. Surfactants such as the Triton X-100 and
Nonidet P-40 are traditionally used. Recently, surfactant agents such as CHAPS and
sulfobetaines have become first choices, especially ASB14, ASB16, as well as C8φ (172). They
have excellent compatibility with urea/thiourea mixtures compared to CHAPS due to their
zwitterionic head groups and long alkyl tails (172).
Considering the commercial availability, a comparison among the zwitterionic detergents
CHAPS (5%) (Figure 4.1B), ASB 14 (4%) (Figure 4.1C) and their combination (2% each) (4.1D)
was made using 2.4 M thiourea and 8.4 M urea as chaotropes. It is clear that the combination of
ASB14 and CHAPS of 2% each could yield better solubility power for proteins and well
separated spots.
Next, based on the above chaotropes and surfactant chosen, we tested and compared two
different reducing reagents of DTT and HED. Such agents are necessary to reduce disulfide
bonds in order to allow complete unfolding of proteins and to stabilize them in the solvent.
There are many kinds of reducing reagents in the market such as β-mercaptoethanol, DTT, TBP
and recently reported HED (173). According to the literature for proteins extracted from adipose
tissue (167,171), we decided to utilize and compare the two reducing reagents DTT and HED,
52
based on the above optimal detergents. As shown in Figure 4.1D and E, the protein spots seem
much more round, smaller and focused when the reducing reagent DTT was applied, which is
not completely consistent with the published studies (173).
In conclusion, in our study, the optimal extraction buffer was the combination of 2.4M
thiourea, 8.4M urea, 2% ASB14 (w/v), 2% CHAPS (w/v), 1% IPG buffer (v/v), 15mM Tris base
(pH 8.3) and 50mM DTT.
With the completion of mouse genome sequencing (174,175), the maturity of mass
spectrometry technique in the analyses of protein (176), and the establishment of the protein
database, 2-DE of preparative gels have became the workhorse technique to identify and
characterize “unknown” proteins. Although thiourea improved the resolution of many proteins
from adipose tissue, it is not sufficient to identify most of the hydrophobic/membrane proteins
(164). Therefore some other methods will be considered in the future, such as stepwise
fractionation (177), other chemicals or non-gel shotgun (178) or Isotope-coded affinity tagging
(ICAT) techniques which avoid gel separation.(179)
ACKNOWLEDGMENTS
We wish to thank Tracy Andacht for her helpful discussion and technical advice, Pam Kirby
for her assistance for 2-DE facilities. We are also grateful for Jerry Liu for assistance with the
photographs.
GRANTS
This work was supported in part by the Georgia Research Alliance Eminent Scholar
endowment held by CAB.

53
Figure 4.1. Flow chart of separation and extraction of proteins from adipose tissue of ob/ob mice

54

55
Figure 4.2. Patterns of two-dimensional gels in adipose tissue of ob/ob mice. IEF with IPG (linear 3-10 pH, 11 cm) were carried out with 75 µg of protein loaded. The second dimension SDS-PAGE gel was 8-16% and stained with SYPRO Ruby®. Detection was scanned with Typhoon 9400. The different extraction buffers were listed as below: (A) 8.4M urea, 2.4M thiourea, 5% CHAPS (w/v), 15mM Tris base (pH8.3), 1% IPG buffer (v/v) and 50mM DTT, pH8.3; (B) 7M urea, 2M thiourea, 4% CHAPS(w/v),15mM Tris base (pH8.3), 1% IPG buffer (v/v) and 50mM DTT, pH8.3. (C) 8.4M urea, 2.4M thiourea, 4% ASB14 (w/v), 15mM Tris base (pH 8.3), 1% IPG buffer (v/v) and 50mM DTT, pH8.3; (D) 8.4M urea, 2.4M thiourea, 2% ASB14 (w/v), 2% CHAPS (w/v), 15mM Tris base (pH 8.3), 1% IPG buffer (v/v) and 50mM DTT, pH8.3; (E) 8.4M urea and 2.4M thiourea, 2% ASB14 (w/v), 2% CHAPS (w/v),15mM Tris base(pH8.3), 1% IPG buffer(v/v) and 100mM HED, pH8.3.
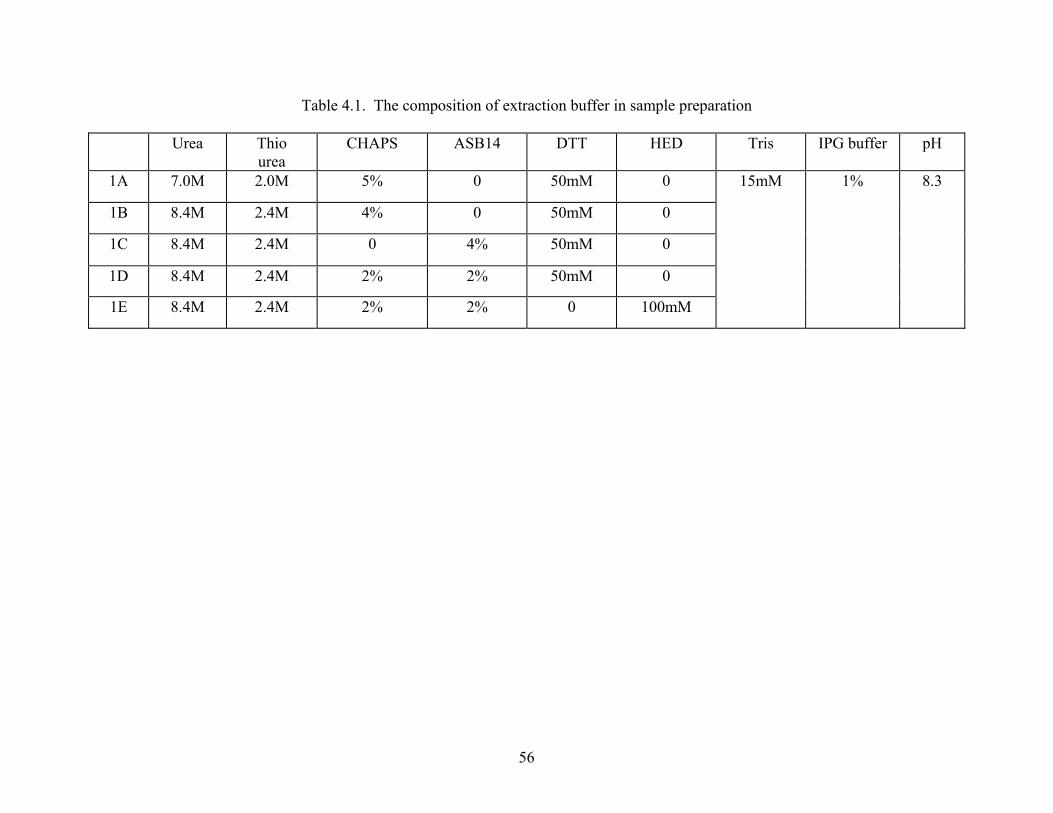
56
Table 4.1. The composition of extraction buffer in sample preparation
Urea Thio urea
CHAPS
ASB14 DTT HED Tris IPG buffer pH
1A 7.0M 2.0M 5% 0 50mM 0
1B 8.4M 2.4M 4% 0 50mM 0
1C 8.4M 2.4M 0 4% 50mM 0
1D 8.4M 2.4M 2% 2% 50mM 0
1E 8.4M 2.4M 2% 2% 0 100mM
15mM
1%
8.3

57
CHAPTER 5
A PROTEOMIC ANALYSIS OF ADIPOSE TISSUE FROM OB/OB MICE
TREATED WITH LEPTIN
Endocrine Meeting, Boston, MA (06/2006) Identification of Differentially Expressed Proteins in White Adipose Tissue of ob/ob Mice Treated with Leptin. Wei Zhang, Tracy Andacht, Diane L. Hartzell, Pamela S. Kirby, Gabriela S. Brambila, Mary Anne Della-Fera, Clifton A. Baile

58
ABSTRACT
Objective The differentially expressed proteins from adipose tissue between leptin-treated
and control ob/ob mouse were obtained by the method of two-dimensional electrophoresis (2-DE)
and matrix-assisted laser desorption/ionization time-of-flight mass spectrometry (MALDI-TOF
MS). Leptin may alter lipid metabolism and induce adipose tissue apoptosis through the
pathways of these identified proteins.
Research Methods and Procedures Fifteen week old female ob/ob mice were treated
with either PBS (control), 2.5 µg/d or 10µg/d leptin (treatment) for 14 days via subcutaneous
(sc) osmotic minipumps. Total proteins from the parametrial white adipose tissue of control
and 10µg/d leptin-treated ob/ob mice were extracted, labeled with sensitive CyDye difference
in-gel electrophoresis (DIGE) fluors, and then separated by two-dimensional electrophoresis.
Some spots in the gel that showed differentially expressed were picked and digested with
trypsin, and subjected to MALDI-TOF MS for protein identification. The mRNA levels of
some identified proteins from the inguinal adipose tissue in three groups (control, 2.5 µg/d or
10µg/d leptin) were quantitatively measured by real-time RT-PCR
Results For proteomics analysis, twenty-seven protein spots equivalent to twelve protein
entries were found differentially expressed in adipose tissue of ob/ob mice treated with leptin
compared to control ob/ob mice, including molecular chaperones and redox such as calreticulin
(CRT) ( +1.63- fold), protein disulfide isomerase associated 3 (PDIA3) (+2.68- fold), prohibitin
(PHB) (+1.96- fold), peroxiredoxin-VI (Prx-VI) (-1.67- fold); cytoskeleton proteins such as β
actin (+1.64- fold), desmin (+1.55- fold) and α tubulin (-1.47- fold); other proteins such as
pyruvate carboxylase (PC) (-2.0- fold), guanine deaminase (GDEase) (+1.45- fold), ubiquinol-
cytochrome-c reductase complex core protein 1 (UQCRC) (+1.49- fold), polymerase I and

59
transcript release factor (PTRF) (+1.44- fold) and fibrinogen β chain (FGB) (+1.63- fold). The
mRNA levels of CRT, PDIA3 and PHB were determined by real-time RT-PCR and found to be
up-regulated (p<0.05), consistent with the fold change in protein expression level.
Discussion Our studies suggested that leptin’s anti-obesity effect or more specifically the
ability to enhance apoptosis can be mediated by the alterations of molecular chaperones and
redox for regulating ER stress, cytoskeleton proteins for regulating mitochondrial morphology.
Key Words Proteomics, Mouse, Adipose tissue, Molecular Chaperone, Redox,
Cytoskeleton

60
1. Introduction
Leptin, the cytokine produced from white adipose tissue, acts as an adiposity signal and
functions both centrally and peripherally to specifically induce loss of adipose tissue (30,32).
Since the finding of rapid loss of adipose tissue following leptin treatment and delayed recovery
of fat depots (119), we hypothesized that this delayed recovery was due to apoptosis, the process
of programmed cell death. The apoptotic characteristic features in adipose tissue were observed
following i.c.v. injection of leptin (56), and a great number of downstream targets of leptin have
been identified, such as C/EBP α, β, δ (67), TNF α (180), and some mitochondria proteins such
as Bcl-2 and Bax (59), but it needs further confirmation. The study of cellular mechanisms of
apoptosis following leptin treatment may provide a potential effective therapeutic method for
obesity, but the mechanisms involved in leptin-induced apoptosis are not clearly understood.
The significant changes in the expression of many genes and/or their protein products are
usually the physiological reactions of organism (ob/ob mice) in response to external stimuli
(leptin treatment). Several proteomic and genomic analyses have been done in ob/ob mice and
wild type lean mice, and a number of proteins and genes have been identified as white adipose
tissue fat markers during various biological treatment conditions (138,181,182). An approach
that uses global analysis of protein (proteomics) is technically feasible with the complement of
genome sequencing and dramatic advances in the molecular technologies such as the creation of
protein databases. In the present study, we employed high-resolution 2-DE technique, sensitive
DIGE technology (183), as well as MALDI-TOF MS to compare the global protein expression
changes in white adipose tissue between control and leptin-treated ob/ob mice. Furthermore,
quantitative PCR (TaqMan®) assays of several selected genes corresponding to the identified

61
proteins were performed using 384-well Low Density Array on an ABI PRISM 7900 Sequence
Detection System.
In the master 2-DE gel map, 27 protein spots corresponding to 12 different protein entries
have been identified, and functionally classified as molecular chaperones and redox,
cytoskeleton proteins and other related proteins. These differentially expressed proteins may
provide a valuable starting point for analyzing the signaling pathways through which leptin
promotes adipose tissue apoptosis and regulates lipid metabolism in ob/ob mice.
2. Research Method
2.1. Animal Experiment
Leptin was administered subcutaneously to ob/ob mice (C57BL/6J background) (Jackson
Laboratory, Bar Harbor, ME) at the dose of either 0 µg/d (control), 2.5 µg/d or 10 µg/d leptin
(treatment group) for 14 days, with the replication of 11 mice in each group. At the end of the
experiment, three fat depots (inguinal, parametrial, and retroperitoneal) were obtained and stored
at -80° C until homogenization. A number of physiological and biochemical parameters (body
weight, food intake, body temperature, physical activity), mass of three fat pads and apoptosis,
body composition, and serum hormones (leptin, insulin, glucagon) of ob/ob mice were examined
and detailed previously(11).
2.2. Reagents and Apparatus
Urea, thiourea, 3-[(3-cholamidopropyl)-dimethylammonio]-1-propane sulfonate (CHAPS),
dithiothreitol (DTT), IPG buffer (18cm, pH 3-10), 2-D clean-up kit, IPG strip (pH3-10, 18cm),
Sypro Ruby® protein gel stain, CyDye DIGE Fluor Cy3,Cy5 minimal dye, iodoacetamide (IAA),
N,N-dimethylformamide (DMF) were from GE Healthcare (Piscataway, NJ). Lysine,
amidosulfobetainers14 (ASB 14), and α-Cyano-4-hydroxycinnamic acid diethylamine salt

62
(HPLC) were from Sigma-Aldrich (St. Louis, MO). Tris-Glycine Gels (Gradient 8-15%) were
from Jule Inc. (Milford, CT). Tris, glycine, SDS, acetontrile, methanol, trifluoroacetic acid
(TFA), ammonium bicarbonate, Bradford protein assay, and molecular protein markers
(precision plus protein in all blue standards) were from BioRad (Hercules,CA). Trypsin
(sequencing grade) was from Promega (Madison, WI). BSA was from Pierce (Rockford, IL).
Ultra pure water was used for the preparation of all solutions.
2.3. Sample Preparation and CyDye labeling
The homogenization of parametrial adipose tissue was performed in an extraction buffer
(8.4M urea, 2.4M thiourea, 2% v/v ASB14, 2% v/v CHAPS, 15mM Tris base, 50mM DTT, 1%
IPG buffer, pH 8.3) at 18,500 rpm for 2 minutes on ice, followed by ultra-centrifugation detailed
in Chapter 4. The extracted proteins were then subjected to a 2-D clean-up kit to eliminate
interferences such as lipids, and the protein concentration was assayed by the method of
Bradford.
To characterize the target proteins of leptin in ob/ob mice, a total of twenty-one analytical
gels in three blocks were run by performing 2D-DIGE (183). The CyDye fluor labeling was
performed according to Ettan™ DIGE protocol (GE Healthcare). An internal standard was
created by pooling equal aliquots of all the samples in the experiment. The use of an internal
standard guaranteed that all protein spots in the samples were represented on each gel so that
accurate quantification and spot statistics between gels was possible. The 50 µg internal
standard labeled with Cy2 minimal dye was mixed with a 50 µg control or a 50 µg treated
sample labeled both with molecular weight- and charge- matched Cy3 and Cy5 minimal dye
prior to electrophoresis. The reaction was quenched with the addition of 10 nmol lysine. After
labeling, 150 µg of each sample with all three different labeling were mixed and loaded on each

63
IPG strip via active rehydration. This experimental design (Table 5.1) had the advantage of the
reduced gel-to-gel variation over the conventional 2-D PAGE.
2.4. First Dimensional Isoelectric Focusing (IEF)
All gel equipment used for separation and imaging were from GE Healthcare. IPG Strips
(18cm, pH 3 -10) were applied by in-gel sample rehydration. Each strip was rehydrated for 12 h
(30 V) in a total volume of 325 µl rehydration solution (Urea 8M, CHAPS 2% (v/v), 50mM DTT,
0.5% IPG buffer 3–10 (v/v) and a trace of bromophenol blue), which contained 10-50µl of
protein solution equal to 50 µg protein for each gel. The strips were run under a layer of Drystrip
cover fluid at 20°C in an Ettan IPGphor IEF System according to the manufacturer’s instructions.
The focusing was carried out in the following steps: 500 V for 1 h, 1000 V for 1 h, 2000 V for 1h,
3000 V for 1h, and 4000 V for 6.5h to reach a total of ~32 KVh. IPG strips were immediately
equilibrated for SDS-PAGE.
2.5. Equilibration of IPG Strips and Reduction of Disulphides
To achieve equilibration and reduction of disulphides, the IEF strips were incubated in
reduction buffer (6M urea, 2% SDS, 50 mM Tris (pH 8.8), 65 mM DTT, 30% glycerol (v/v) and
a trace of bromophenol blue) for 5 minutes with gentle shaking. Then alkylation of sulphydryl
groups was carried out in the same solution, except that DTT was replaced by 260 mM IAA
(15min, gentle shaking).
2.6. Second Dimensional SDS-PAGE
The gels used in this study were 8-15% Tris-Glycine precast gesl. The equilibrated strips
were immersed in SDS running buffer for approximately 15s (25mM Tris base, 192mM glycine
and 0.1% SDS) before they were sealed at the top of the second dimensional gel with 0.6%
agarose submerged in SDS running buffer. Molecular protein markers and BSA were loaded as

64
internal standards. Electrophoresis was performed in the GE Ettan DALT Twelve Large Vertical
System at 5 Watts per gel for 1~2h until the voltage reaches 2 Watts and 40-50 mA per gel,
generally overnight.
2.7. Gel Scanning and Image Analysis
For visualization of the proteins, the gels were scanned directly with a Typhoon 9400
scanner. Each gel was scanned at three different wavelengths, and therefore three different gels
for each sample (either control or treatment) was produced and applied for the following
statistical analysis. The excitation wavelengths for Cy2-, Cy3-, and Cy5-labeled images were at
488 nm, 520 nm, and 620 nm respectively. The emission wavelengths for Cy2, Cy3, and Cy5
were 520 nm, 590 nm, and 680 nm respectively. DeCyder software version 4.0 was used for gel
analysis.
2.8. Protein Identification by MALDI-TOF MS
The analytical gel with the best resolution was selected for spot picking and post-stained
with Sypro Ruby®. The Sypro Ruby® image was matched to the analytical gels and spots of
interest meeting a minimum volume cutoff were selected for spot picking. Gel plugs of 2 mm
were cut using the Spot Handling Workstation automatically (GE Healthcare). In brief, the gel
plugs were washed twice in 50 mM ammonium bicarbonate (ACN)/50% methanol (v/v) in water
for 20 min, and once with 75% ACN (v/v) in water. After drying, the gel plugs were cleaved by
sequencing-grade trypsin at 37°C overnight using a standard in-gel trypsin digestion protocol.
The peptide fragments were extracted with 50% ACN (v/v), 0.1% trifluoroacetic acid (TFA) (v/v)
in water twice, and dried down in a vacuum concentrator (Jouan, ThermoElectron, Milford, MA).
Finally, the dissolved peptide fragments were spotted on MALDI target plates, dried and mixed
with a 50% saturated solution of α-cyano-4-hydroxycinnamic acid (CHCA) in 50% ACN (v/v),

65
0.1% TFA (v/v) in water. MS analyses were performed using the ABI 4700 Proteomics
Analyzer (Foster City, CA) in reflector mode for positive ion detection. Mass lists were
submitted to Mascot (www.matrixscience.com) against NCBInr (mammals) and Swiss-Prot
databases for protein identification, using the criteria of a minimum of five matching tryptic
fragments with a mass tolerance of 500 ppm, and more than 25% peptide coverage. Molecular
weight, isoelectric point and mass accuracy were checked for candidate proteins.
2.9. Real-time RT-PCR (q RT-PCR)
Total RNA was isolated from the inguinal adipose tissue of ob mice, using Trizol reagent
(Invitrogen, Carlsbad, CA) in accordance with the manufacturer’s protocol. 1.0 µl of the 12 µl
extract RNA was used as an integrity check and for quantification by the Agilent 2100
bioanalyzer and RNA 6000 Nano Assay (Agilent Technologies, Foster City, CA). All
instrument and reagents were from ABI (Foster City, CA). The experimental procedure of
reverse transcription and PCR reaction and statistical method were described in chapter 3
Materials and Method section. All of the oligonucleotide primers and fluorogenic probe sets for
Taqman® real time PCR were prepared by ABI (Table 5.2). Through comparing and analyzing
the variability of two housekeeping genes (HKG) (18s and GADPH) from the amplification plot
shown in the SDS software, the expression of a target gene was normalized by using GADPH as
the reference control gene, and sample number of 2038 as a calibrator to correct the differences
in the amount of total RNA added to each reaction.
2.10. Statistical Analysis
The statistical analyses of differentially expressed proteins were conducted with DeCyder
software version 4.0. The relative protein abundance from proteomic analysis was expressed as
means ± standard error. Statistical analysis of qPCR data was conducted with SAS (Version 9.0)

66
(SAS institute, Cary, NC). The whole procedure and SAS codes are in the appendix C. The Ct
value can be automatically transferred to the RQ value by the software sequence detection
system (SDS) (Applied Biosystems). In brief, RQ values in all samples were submitted to
logarithm transformation at the base of 2 in order to create a linear range between fluorescent
signal versus cycle number (95). The transformed RQ value was then winsorized for dealing
with the outliners (96). Statistical significance of treatment (p<0.05) was assessed by a general
linear model based on the transformed and winsorized data (tRQ) derived from the original RQ
value. The tRQ values were expressed as means ± standard error for all genes. Least square
means was used to determine significance of differences among means (p<0.05). The correlation
between body weight and leptin mRNA expression was examined by means of Spearman’s
correlation coefficients.
3. Results
3.1. 2-DE Gel Analysis and Identification of Proteins
For gel analysis, gel 125 was chosen as the master gel in the following statistical analysis
due to its maximal number of 1033 protein spots. All gels were then matched to the master gel
(Figure 5.1). Statistical analysis was performed on these 1033 spots matched across the 21 gels
by DeCyder software, and 130 proteins were selected as significant spots (p<0.01) with an
average volume ratio between treatment and control groups greater than or equal to 1.2, and with
an appearance in more than 50% of all gel images. A total of 65 spots of interest cut from
analytical gels (the preparative gel can not be used since it was loaded with too much proteins of
about 800 mg, and spots can not be distinguished between one to the other), trypsin digested and
identified by MALDI-TOF-MS. Twenty-seven protein spots were identified, including several
post-translational modifications of the same protein, therefore 12 different protein entries were

67
obtained, corresponding to 42% of success rate. Identified proteins and their MW, pI, peptide
mount, protein score and sequence coverage were listed in table 5.3. The unresolved spots can
be due to either few peptides hits from the database or poor MALDI spectrums.
3.2. Protein Functional Groups Modulated by Leptin
Proteins regulated by leptin treatment were classified as three functional groups (Figure 5.2),
and bar charts of fold changes of these proteins are shown (Figure 5.3). The major group
identified was molecular chaperone and redox, including 1.63-fold increase of CRT, 1.96-fold
increase of PHB, 2.68-fold increase of PDIA3, as well as 1.67-fold decrease of Prx VI in lepin-
treated as compared with control ob/ob mice. It was of particular interest that except for
peroxiredoxin VI, all of other listed proteins were up-regulated in leptin-treated ob/ob mice. Of
note, the spot 545 was a co-migration protein spot including two proteins of glucose-6-phosphate
1-dehydrogenase (G6PD1) and PDIA3 (Figure 5.4.). Its total fold change was a 2.68-fold
increase between leptin-treated and control ob/ob mice. The relative abundance of protein in
spots 535 and 537 (both spots were identified as a single protein as G6PD1) was very close to 1,
which suggested no change of G6PD1 between leptin-treated and control ob/ob mice. Therefore,
we attributed the 2.68-fold change in spot 545 to the protein PDIA3.
Another major group identified were proteins associated with cellular structure and
cytoskeleton organization, including a 1.64-fold increase of β actin, 1.55-fold increase of desmin
and 1.47-fold decrease of α tubulin in leptin-treated as compared with control ob/ob mice. Other
proteins identified as altered in adipose tissue of the leptin-treated ob/ob mice include a 2-fold
decrease of pyruvate carboxylase (PC), involved in carbohydrate metabolism; 1.45-fold increase
of guanine deaminase involved in guanine degradation; 1.44-fold increase of PTRF; facilitating
ribosomal RNA synthesis and possibly promoting lipolysis; 1.49-fold increase of UQCRC,

68
participating in energy transduction; and 1.63-fold increase of fibrinogen, which acts as a
hemostatic factor.
3.3. Real-time RT-PCR (qPCR)
To further validate the effects of leptin on mRNA gene expression in adipose tissue, we
examined the mRNA expression of molecular chaperones (CRT, PDIA3, and PHB), fibrinogen
and UQCRC. Leptin increased the mRNA expression of all three molecular chaperones (p<0.05)
(Figure 5.5), consistent with the fold change trends of proteins identified by proteomic analysis.
However, there was no change of mRNA expression for UQCRC and fibrinogen (data not
shown).
4. Discussion
The objective of this study was to identify and characterize the differentially expressed
proteins in adipose tissue between control and leptin-treated ob/ob mice by 2D DIGE coupled to
MS. These proteins and their corresponding post-translational modified forms may participate in
some critical signaling pathways through which leptin regulates lipid metabolism and related
systems. Notably, apoptosis was increased significantly in all three fat pads by leptin treatment
in ob/ob mice (11), including the parametrial fat pads from which proteins were extracted and
applied to comparative proteomics in the current study.
A major group of proteins identified in our study involved molecular chaperones and redox,
including CRT and PDIA3 located in ER, as well as PHB and Prx-VI, which reside in the
mitochondria. The molecular chaperones (such as CRT and PDIA3) in ER are involved in the
correct folding and oligomerization of newly-synthesized proteins in order to function properly
(184,185). Any factor which disturbs calcium homeostasis and restrains the formation of
disulfide bonds can lead to increased amounts of unfolded or mal-folded proteins in the ER,

69
termed “ER stress”. In response to “ER stress”, normal cells usually increase transcription of
ER-resident chaperone genes and degrade unfolded proteins. Proteins that failed to fold
correctly in the ER are subjected to proteasomal degradation or the cells are deleted by apoptosis.
Accumulating evidence has shown that CRT (186-188) and PDIA3 (189-191) were both up-
regulated in different types of cells undergoing apoptosis, with an increased release of
cytochrome c from the mitochondria (186). On the contrary, CRT deficient cells were
significantly resistant to apoptosis, with a decreased release of Cytochrome c from mitochondria
and low levels of caspase 3 activity (186). In addition, CRT is also a Ca2+-binding chaperone
and responsible for calcium concentration regulation with other proteins in ER. A great deal of
interest has recently been focused on the involvement of CRT (186,187) in the modulation of
apoptosis, and calcium may be the link between ER and mitochondria for handling apoptosis
(192). Higher levels of CRT produced higher levels of ER luminal Ca, which increased
sensitivity to apoptosis through suppressing the pro-survival kinase akt (188). In contrast, lower
levels or deficiency of CRT were associated with a lower concentration of ER luminal calcium,
and thus decreased sensitivity to apoptosis through reducing the activity of caspase-3 (186) or
altering p53 activity (193). The molecular mechanism between calcium and apoptosis is not
clearly delineated, and it was suggested that some Ca-dependent enzymes like kinases,
phosphatase, and cytoplasmic Ca binding proteins may be involved in signaling pathways during
the apoptotic process (188). In the present study, the up-regulated expression of CRT and
PDIA3 may be the normal physiological response of adipocytes to “ER stress” mediated by
leptin, and this response may help the body to delete unhealthy cells by the pathway of apoptosis.
PHB is present in the mitochondrial and acts as a molecular chaperone to stabilize newly
synthesized mitochondrial respiratory chain complexes (194). It also acts as a target for a pro-

70
apoptotic peptide, which causes ablation of adipose tissue by endothelial cell apoptosis (195),
and results in normalization of metabolism and increased energy expenditure in ob/ob mice (195).
In addition, prohibitin has recently been found to inhibit glucose and fatty acid synthesis in
adipocytes by specifically inhibiting the activity of pyruvate carboxylase (196). PC is an
cytosolic enzyme participating in lipogenesis and glucogenesis (197). It catalyzes the ATP-
dependent carboxylation of pyruvate to oxaloacetate, providing the acetyl group and reducing
potential NADPH that is required for de novo synthesis of fatty acids in the cytoplasm. The
down-regulated (2-fold) expression of PC in leptin-treated mice in the present study indicates
that lipogenesis was reduced in ob/ob mice, possibly one of the pathways of fat loss induced by
leptin in ob/ob mice.
The peroxiredoxin family is mainly present in cytoplasm and mitochondria, and Prx I, II, V
act to protect cells against oxidative stress and apoptotic stimuli, and tend to inhibit apoptosis in
mice or human (198-200). Prx VI in the present study was down-regulated (1.47- fold) by leptin,
which tended to increase oxidative stress or reactive oxygen species (ROS) in the cytosol, and
this may be one of the pathways that leptin induced adipocyte apoptosis.
The other striking findings of the present study were that the cytoskeleton proteins (α actin,
desmin, α tubulin) were all altered by leptin. Although the link between cytoskeleton and fat
loss mediated by leptin has not been established, a growing body of evidence (201,202) suggests
that interactions between mitochondria and cytoskeleton are essential for normal mitochondrial
morphology, motility and distribution. Cytoskeletons include three components, microfilaments
(MFs) composed of actin monomer; microtubules (MTs) composed of cylindrical polymers of
α/β-tubulin dimers; and intermediate filaments (IFs) composed of principal structural elements
including desmin (203). Of these three cytoskeleton proteins, actin might be involved in the

71
adipocytes apoptosis mediated by leptin, while the functional studies on desmin and tubulin are
very limited so far. The drug that stabilizes the actin cytoskeleton increases apoptosis in T cells
and several transformed murine cell lines (204,205), while the agent for stimulating actin
depolymerization (206) or actin-binding proteins repressed apoptosis (207,208). There is a large
and specific decrease in biosynthetic rates for β and γ actin, vimentin, α and β tubulin prior to
morphological differentiation of 3T3 adipocytes, strongly suggesting that cytoskeleton proteins
specifically take part in adipocyte differentiation and morphology (209). Therefore, leptin
appears to induce adipocyte apoptosis, partly by acting as an actin stabilizer, but it needs further
study.
Other identified proteins such as guanine deaminase (GDEase), UQCRC1, PTRF and
fibrinogen were altered by leptin treatment. Guanine deaminase (GDEase), is involved in for
purine degradation, and it recently has been shown to related to obese rats treated with tungstate
(a novel anti-obesity agent) by restoring high Rho-GTPase signaling in obese to basal level
(210). UQCRC1, a component of mitochondrial respiratory complex Ⅲ(211), is important in
redox reactions, electron transport as well as ATP production in the mitochondria (212), but it is
not clear whether this change was related body weight change. PTRF had originally been
identified as a nuclear factor for enhancing ribosomal RNA synthesis (213), but it was found to
specifically control lipolysis by binding to HSL(214,215). Therefore, the 1.44-fold increase in
PTRF expression in leptin treated ob/ob mice may be consistent with its role of fat mobilization.
Several isoforms of fibrinogen were all up-regulated in leptin-treated ob/ob mice compared to
control ob/ob mice. Fibrinogen which acts as one of the fibrinolytic components for blood
clotting, was proposed to be a signaling link as a major risk factor between obesity and the
development of cardiovascular diseases (216). The relationship has not been defined between

72
leptin and cardiovascular events (216-218), and further research is needed on the link between
leptin and fibrinogen.
In conclusion, this study allowed, for the first time, to identify 12 different proteins
(functionally classified as molecular chaperones and redox, cytoskeleton structure proteins and
other related proteins) as the potential targets of leptin in the adipose tissue of ob/ob mice by the
method of 2D-DIGE and MS. Some of them such as CRT, PDIA3, PHB, Prx-6 and actin have
already been linked to apoptosis, some of them such as pyruvate carboxylase, GDEase,
UQCRC1, PTRF or probably fibrinogen are related to obesity, others such as desmin, tubulin are
not clearly delineated. Regulation of these proteins and other unknown mechanisms might be
involved in the signaling pathways mediating fat loss in leptin-treated ob/ob mice. Whether
these protein molecules are direct targets of leptin action, or are secondary effects to body weight
loss and fat loss will be elucidated in further studies. Thus, the findings presented here gave new
potential regulators of leptin on fat loss, therefore providing potential treatments for obesity.
ACKNOWLEDGMENTS
We are grateful for the assistance by Pam Kirby and Gabriela S. Brambila with the 2-DE
and MALDI-TOF MS facilities. We appreciate the help with Ji Lin for critical suggestions. We
are grateful for Jerry Liu for assistance with the photographs.
GRANTS
This work was supported in part by the Georgia Research Alliance Eminent Scholar
endowment held by CAB.
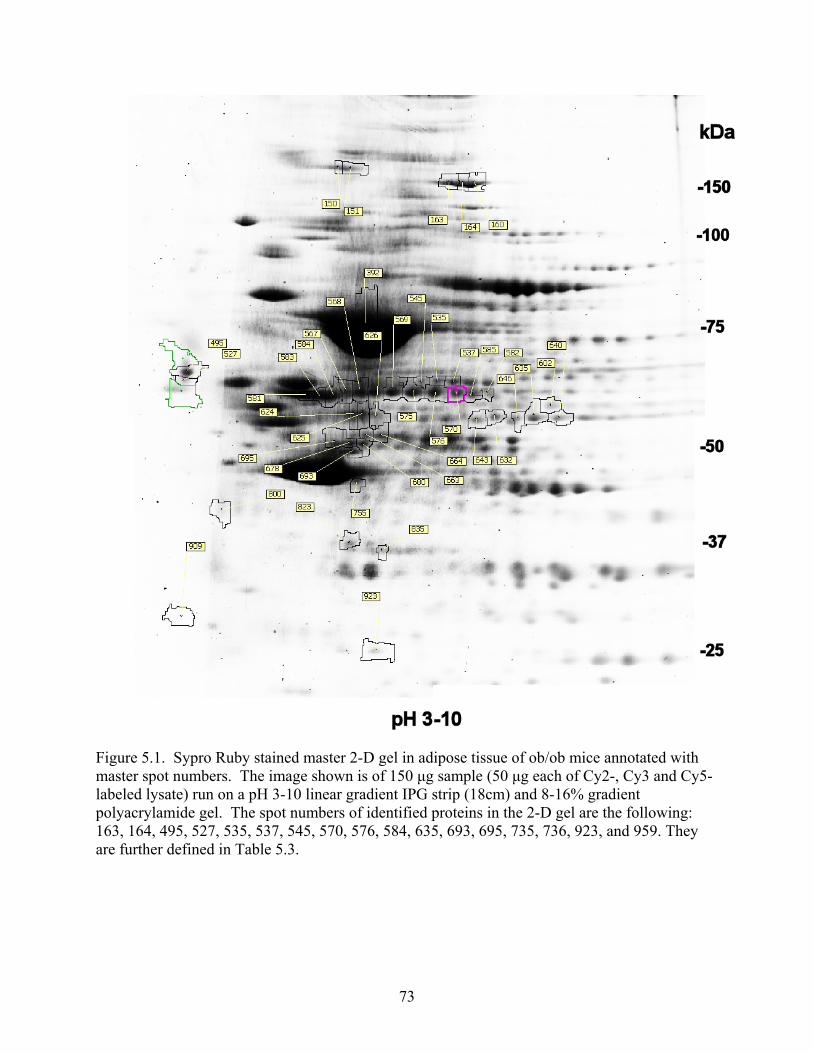
73
Figure 5.1. Sypro Ruby stained master 2-D gel in adipose tissue of ob/ob mice annotated with master spot numbers. The image shown is of 150 µg sample (50 µg each of Cy2-, Cy3 and Cy5-labeled lysate) run on a pH 3-10 linear gradient IPG strip (18cm) and 8-16% gradient polyacrylamide gel. The spot numbers of identified proteins in the 2-D gel are the following: 163, 164, 495, 527, 535, 537, 545, 570, 576, 584, 635, 693, 695, 735, 736, 923, and 959. They are further defined in Table 5.3.

74
Figure 5.2. Three protein functional groups in adipose tissue of ob/ob mice treated with 10 µg/d leptin. The two major protein groups are molecular chaperons and redox group (33.3%) and cellular structure proteins (25%), other proteins represent about 41.7% of all identified proteins. Under each protein group is the differentially expressed fold change in leptin-treated ob/ob mice compared to control ob/ob mice.

75
CRT PDIA3 PHB PRX-6
Rel
ativ
e Pr
otei
n A
bund
ance
0.0
0.5
1.0
1.5
2.0
2.5
Control10 µg/d leptin
a
b
a
b
a
b
a
b
A
Fold Change 1.63 2.68 1.96 0.6
Actin Desmin Tubulin
Prot
ein
Rel
ativ
e A
bund
ance
0.0
0.5
1.0
1.5
2.0
2.5
Control10 µg/d leptin
a
b
a
ba
b
B
Fold Change 1.64 1.55 0.68
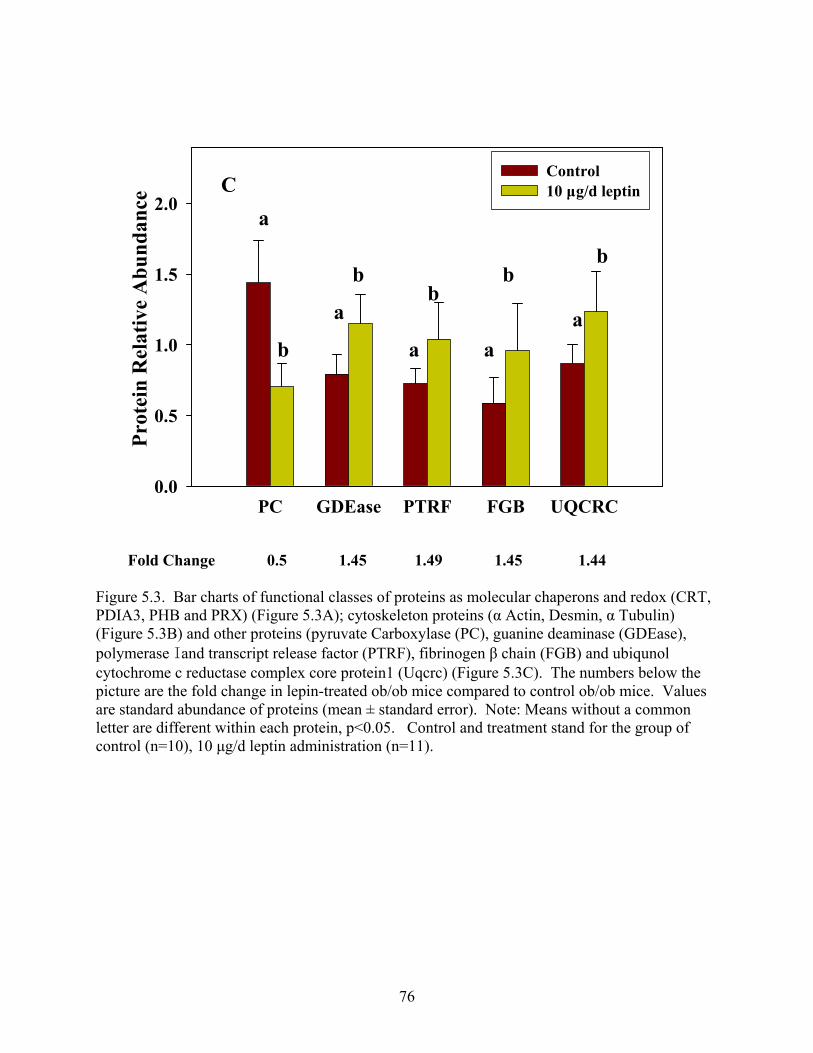
76
PC GDEase PTRF FGB UQCRC
Prot
ein
Rel
ativ
e A
bund
ance
0.0
0.5
1.0
1.5
2.0
Control10 µg/d leptin
a
b
a
b
a
b
a
b
a
b
C
Fold Change 0.5 1.45 1.49 1.45 1.44 Figure 5.3. Bar charts of functional classes of proteins as molecular chaperons and redox (CRT, PDIA3, PHB and PRX) (Figure 5.3A); cytoskeleton proteins (α Actin, Desmin, α Tubulin) (Figure 5.3B) and other proteins (pyruvate Carboxylase (PC), guanine deaminase (GDEase), polymerase Iand transcript release factor (PTRF), fibrinogen β chain (FGB) and ubiqunol cytochrome c reductase complex core protein1 (Uqcrc) (Figure 5.3C). The numbers below the picture are the fold change in lepin-treated ob/ob mice compared to control ob/ob mice. Values are standard abundance of proteins (mean ± standard error). Note: Means without a common letter are different within each protein, p<0.05. Control and treatment stand for the group of control (n=10), 10 µg/d leptin administration (n=11).

77
= Figure 5.4. Co-migration proteins in spot 545. Both spot 535 and 537 are single protein identified as glucose– 6 phosphate 1-dehydrogenase X (G6PD) with a relative ratio about 1, and spot 545 includes co-migration proteins of PDI and G6PD with fold change of 2.68-fold.
545 535 537

78
CRT PDIA3 PHB
-1
0
1
Control2.5 µg/dleptin10 µg/d leptin
mR
NA
Rel
ativ
e R
atio
(Log
Tra
nsfo
rmed
Dat
a)
a
bb
a
bb
a
b
b
Figure 5.5. Gene expression (CRT, PDIA3 and PHB) in adipose tissue of ob/ob mice treated with leptin (mean ± S.E.M.). Total RNA extracted from inguinal adipose tissue was used for analysis of calreticulin (CRT), protein disulfide associated protein 3 (PDIA3), and prohibitin (PHB). The Y-axis is the RQ value after log 2 based transformation as shown by mean ± standard error. Note: Means without a common letter are different within each gene, p<0.05. The replications for control, 2.5µg/d and 10µg/d leptin group are 11, 10 and 10, respectively.

79
Table 5.1. 2D DIGE Experimental Design
Block Gel No. Treatment Cy2
(Internal Standard)
Cy3 Cy 5
121 Treatment 50 µg 50 µg 50 µg 122 Control 50 µg 50 µg 50 µg 123 Treatment 50 µg 50 µg 50 µg 124 Control 50 µg 50 µg 50 µg 125 Control 50 µg 50 µg 50 µg 126 Treatment 50 µg 50 µg 50 µg
1 (n=7)
128 Treatment 50 µg 50 µg 50 µg 131 Control 50 µg 50 µg 50 µg 132 Treatment 50 µg 50 µg 50 µg 134 Control 50 µg 50 µg 50 µg 135 Treatment 50 µg 50 µg 50 µg 136 Control 50 µg 50 µg 50 µg
2 (n=6)
137 Treatment 50 µg 50 µg 50 µg 141 Treatment 50 µg 50 µg 50 µg 142 Control 50 µg 50 µg 50 µg 143 Treatment 50 µg 50 µg 50 µg 144 Control 50 µg 50 µg 50 µg 145 Control 50 µg 50 µg 50 µg 146 Treatment 50 µg 50 µg 50 µg 147 Control 50 µg 50 µg 50 µg
3 (n=8)
148 Treatment 50 µg 50 µg 50 µg

80
Table 5.2. Probes in Real time PCR II (www.appliedbiosystems.com)
Gene Symbol Gene Name Context Sequence
Bax Bcl2-associated X protein CTGGTGCTCAAGGCCCTGTGCACTA
Calr Calreticulin TAACATCATGTTTGGTCCGGACATC
18S Eukaryotic 18S rRNA CCATTGGAGGGCAAGTCTGGTGCCA
Fgb Fibrinogen, B beta polypeptide GAAGCAAGCTCAAGTTAAAGAGAAT
Gapdh Glyceraldehyde-3-phosphate dehydrogenase GAACGGATTTGGCCGTATTGGGCGC
Phb;Fyb Prohibitin; FYN binding protein GACATCGCTGATGGTTGCATCTATG
Pdia3 Protein disulfide isomerase associated 3 ATTAGCAAAGGTGGATTGCACTGCC
Uqcrc1 Ubiquinol-cytochrome c reductase core protein 1 CATGCTACCTGCACGGTGGGAGTGT
Fabp4 Fatty acid binding protein 4 CAAGCTGGTGGTGGAATGTGTTATG
Itlna Intelectin a GTGCAGTGTGGAGACTTTGCGTCAT
Lpl Lipoprotein lipase TGGATGGACGGTAACGGGAATGTAT
Pbef1 Pre-B-cell colony-enhancing factor GAGGAATATGGCCATGATCTTCTCC
Gpd1 Glycerol-3-phosphate dehydrogenase 1 (soluble) CCCCAATGTGGTGGCCATCCCAGAC

81
Table 5.3. Proteins Identified by MALDI-TOF MS in Adipose Tissue
Spot No. Protein Identification Accession No. Theory MW/pI
Peptide Count
Protein Score
Sequencecoverage
Fold Change
P value
163 Pyruvate carboxylase
PYC_MOUSE 130 kDa/6.25 23 161 28% 0.5 <0.01
164 Pyruvate carboxylase
PYC_MOUSE 130 kDa/6.25 24 150 28% 0.58 <0.01
495 Calreticulin precursor
CALR_MOUSE 48 kDa/4.33 10 65 19% 1.63 <0.01
527 Polymerase I and transcript release factor
PTRF_MOUSE 44 kDa /5.43
11 65 30% 1.44 <0.01
535 Glucose-6-phosphate1- dehydrogenase X (G6PD)
G6PD1_MOUSE 59.5 kDa /6.07
13 88 31% 1.07 0.92
537 G6PD G6PD1_MOUSE 59.5 kDa /6.07
17 133 42% 0.93 0.33
545 G6PD + PDIA 3 G6PD1_MOUSE +PDIA3_MOUSE
59.5 kDa/6.07;57 kDa /5.98
14 ;10
97; 52 32%; 21%
2.68 <0.01
570 Fibrinogen β chain precursor
FIBB_MOUSE 55.4 kDa /6.68 15 94 34% 1.93 <0.01
576 Fibrinogen β chain precursor
FIBB_MOUSE 55.4 kDa /6.68 19 145 44% 1.63 <0.01
584 Desmin DESM_MOUSE 53.5 kDa /5.21
20 150 44% 1.55 <0.01
635 Tubulin α-2 chain
TBA2_MOUSE 50.8 kDa /4.94
11 86 33% 0.68 <0.01
693 Guanine deaminase GUAD_MOUSE 51.5 kDa /5.36
13 100 37% 1.45 <0.01
695 Ubiquinol-cytochrome-c reductase complex core protein 1
UQCR1_MOUSE 53.4 kDa /5.75
9 63 27% 1.49 <0.01
735 Actin, cytoplasmic 1 (Beta-actin)
ACTB_MOUSE 42.1 kDa /5.29
10 71 43% 1.63 <0.01

82
Continued Spot No. Protein Identification Accession No. Theory
MW/pI Peptide Count
Protein Score
Sequencecoverage
Fold Change
P value
736 Actin, alpha skeletal muscle(Alpha-actin-1)
ACTS_MOUSE 42.4 kDa /5.23
12 95 45% 1.64 <0.01
923 Prohibitin PHB_MOUSE 29.9 kDa /5.57
8 74 39% 1.96 <0.01
959 Peroxiredoxin-6 PRDX6_MOUSE 25.0 kDa /5.71
11 109 51% 0.6 <0.01
a) Accession number corresponding to Swiss-Prot databases b) Theoretical MW and pI were calculated using the tool MW/pI from the Expasy server.

87
CHAPTER 6
SUMMARY AND CONCLUSION
Comparative proteomics analysis and real-time RT-PCR methods were performed in
adipose tissue of ob/ob mice treated with leptin in order to identify the protein and gene
expression changes as the potential targets of leptin. The finding of 12 protein entries and 18
gene transcripts differentially expressed in adipose tissue with leptin treatment in ob/ob mice
suggests that leptin may regulate body weight and lipid metabolism through different routes
ending up with similar outcomes: negative energy balance.
This is achieved by a reduction in food intake, increase in energy expenditure, regulation of
lipid metabolism, promotion of apoptosis and inhibition of angiogenesis. The increased energy
expenditure was shown by increased in body temperature, physical activity in ob/ob mice treated
with leptin, combined with the increased expression of UCP2, adrenergic receptor β3,
mitofusion 2 and sirturin 3 for promoting thermogenesis, probably through the pathway of
sympathetic nervous system innnervated to the brown adipose tissue.
The regulation of lipid metabolism by leptin treatment in ob/ob mice was demonstrated by
the reduced expression of lipogenetic enzymes such as steroyl CoA desaturase, fatty acid
synthetase and increased expression of lipolytic enzyme hormone sensitive lipase, combined
with significant reduction of fat mass and fat percentage in ob/ob mice treated with leptin.
The promotion of adipocyte apoptosis was confirmed by an increased expression of Caspase
3 and TNF α, two factors promoting apoptotic events in mitochondrial pathways, combined with

88
significantly increased apoptosis by gel electrophoresis in all three fat pads in ob/ob mice treated
with leptin.
The inhibition of angiogenesis was shown by the upregulated expression of angiogenesis
inhibitor angiopoietin-2. Increased sensitivity of insulin mediated by leptin was demonstrated by
the increased expression of adiponectin (promote insulin sensitivity) and decreased expression of
retinol binding protein 4, a glucose transporter inhibitor and insulin sensitivity inhibitor, together
with serum insulin in ob/ob mice treated to leptin decreasing to the level of wild-type lean mice.
For the global protein analysis, a modified protocol and extraction buffer was described in
order to enhance the proteome from adipose tissue due toits difficulty of handling proteins from
adipose tissue. There are three main types of detergents in the extraction buffer: 8.4M urea and
2.4M thiourea are detergents for denaturing proteins with strong efficiency; 2% CHAPS (v/v)
and 2% ASB14 (v/v) are detergents for completely solubizing the denatured proteins; and 50
mM DTT is applied as a reducing reagent for folding correctly the disulfide bonds of proteins.
This optimized protocol is the basis of ‘real’ proteomic analysis of the proteins from adipose
tissue for the study in chapter 5.
In chapter 5, 2D-DIGE combined with MALDI-TOF MS methods were used to identify
differentially expressed proteins between parametrial adipose tissue of control and leptin-treated
ob/ob mice. Twelve protein entries were differentially expressed, including molecular
chaperones and redox proteins (CRT, PDIA3 PHB, Prx-VI), cytoskeleton proteins (β-actin, α-
tubulin and desmin) and other proteins (PC, GDEase, UQCRC, PTRF, and fibrinogen). Some of
them have been shown to be related to apoptosis in other cell lines or rodents such as
calreticulim, protein disulifide associated protein 3, prohibition and peroxiredoxin-VI and actin.
Others have been demonstrated to be aligned to lipid metabolism or obesity such as pyruvate

89
carboxylase, guanine deaminase, ubiquinol-cytochrome-c reductase complex core protein 1,
polymerase I and transcript release factor, and possibly fibrinogen. Still others like desmin and
tubulin are not clearly delineated, and therefore further research is needed for elucidating the role
of these proteins in leptin-induced adipose apoptosis.
In total, regulation of these genes/proteins or other unknown mechanisms might be involved
in the signaling pathways mediating leptin-induced adipocyte apoptosis and fat loss in leptin-
treated ob/ob mice, and it provides new potential targets and regulators of leptin on adipose
tissue. Thus, the findings presented here open new insights for potential treatments of obesity.

90
APPENDIX A
ABBREVIATIONS
2-DE: Two-dimensional electrophoresis
ABI: Applied biosystems
ACN: Ammonium bicarbonate
ADRB3: Adrenergic receptor β3
Angpt2: Angiopoietin 2
ASB-14: Amidosulfobetainers 14
Bcl-2: B-cell lymphoma 2
C/EBP α, β, δ: CCAAT/ enhancer binding proteins alpha, beta and delta
CHAPS: 3-[(3-cholamidopropyl)-dimethylammonio]-1-propane sulfonate
CLA: Conjugated linoleic acid
CNTF: Ciliary neurotrophic factor
CRT: Calreticulin
DIGE: Difference in gel electrophoresis
DMF: N, N-dimethylformamide
DTT: Dithiothreitol
EGCG: Epigallocatechin gallate
FAS: Fatty acid synthase
FGB: Fibrinogen β chain

91
G6PD1: Glucose-6-phosphate 1-dehydragenase
GDEase: Guanine deaminase
HED: 2-Hydroxyethyl disulfide
HSL: Hormone sensitive lipase
IAA: Iodoacetamide
ICAT: Isotope-coded affinity tag
IEF: Isoelectric focusing
IL: Interleukin
ING: Inguinal
MALDI-TOF: Matrix-assisted laser desorption/ionization time-of-flight
MFN2: Mitofusion 2
MS: Mass spectrometry
PC: Pyruvate carboxylase
PCD: Programmed cell death
PDIA3: Protein disulfide isomerase associated 3
PHB: Prohibitin
POMC: Proopiomelanocortin
PPAR-α, γ: Peroxisome proliferation-activated receptor-α, γ
Prx-VI: Peroxiredoxin-VI
PTRF: Polymerase I and transcript release factor
qPCR: Real-time RT-PCR
RBP4: Retinol binding protein 4
RP: Retroperitoneal

92
SCD1: Stearoyl-coenzyme A desaturase 1
SIRT3: Sirtuin 3
SNS: Sympathetic nervous system
SREBF 1: Sterol regulatory element binding factor 1
TFA: Trifluoroacetic acid
TNF α: Tumor necrosis factor alpha
UCP2: Uncoupling protein 2
UQCRC: Ubiquinol-cytochrome-c reductase complex core protein 1
VEGF: Vascular endothelial growth factor
TAG: Triacylglycerol or Triglyceride
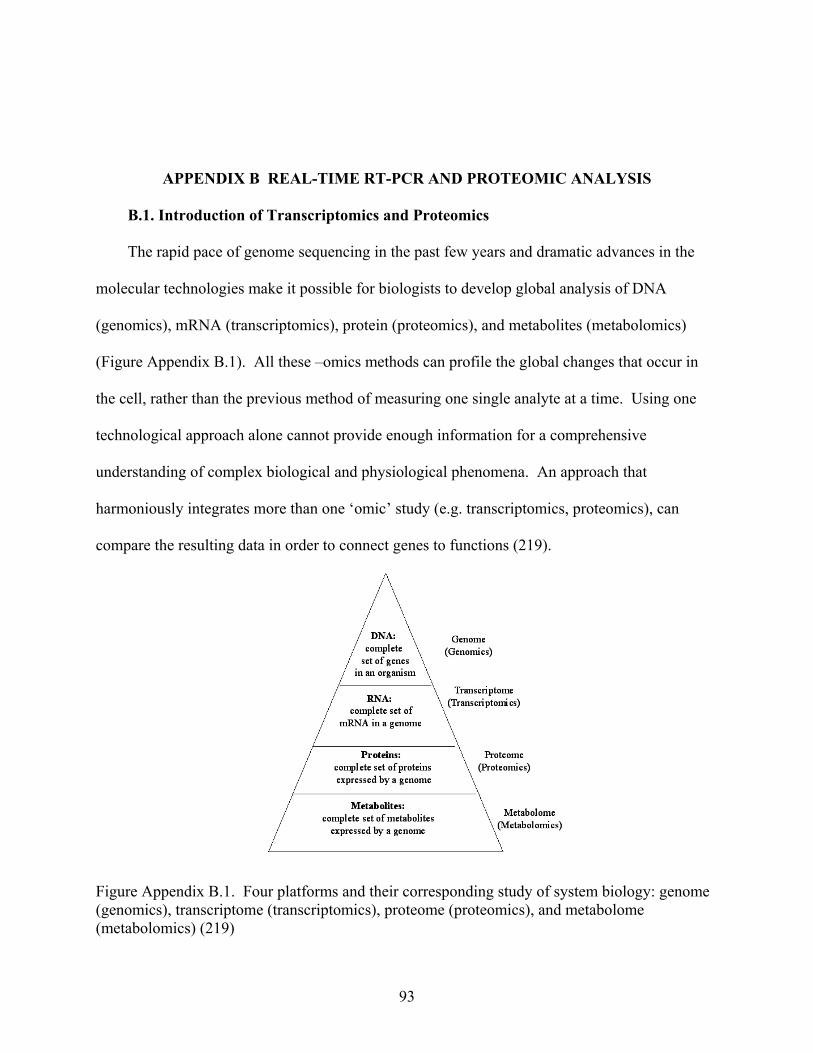
93
APPENDIX B REAL-TIME RT-PCR AND PROTEOMIC ANALYSIS
B.1. Introduction of Transcriptomics and Proteomics
The rapid pace of genome sequencing in the past few years and dramatic advances in the
molecular technologies make it possible for biologists to develop global analysis of DNA
(genomics), mRNA (transcriptomics), protein (proteomics), and metabolites (metabolomics)
(Figure Appendix B.1). All these –omics methods can profile the global changes that occur in
the cell, rather than the previous method of measuring one single analyte at a time. Using one
technological approach alone cannot provide enough information for a comprehensive
understanding of complex biological and physiological phenomena. An approach that
harmoniously integrates more than one ‘omic’ study (e.g. transcriptomics, proteomics), can
compare the resulting data in order to connect genes to functions (219).
Figure Appendix B.1. Four platforms and their corresponding study of system biology: genome (genomics), transcriptome (transcriptomics), proteome (proteomics), and metabolome (metabolomics) (219)

94
An organism (e.g. ob/ob mice) frequently responds to various internal or external stimuli
(e.g. leptin treatment) by intricately regulated systems. Cellular functions are mediated through
significant changes in expression of many genes and/or their protein products. In order to
elucidate the pathophysiological mechanisms involved in a disease like obesity, and to develop
the proper models to clarify the dynamics of molecular and cellular function, different strategies
must be integrated in a quantitative and temporal manner, particularly the study of RNA and
protein expression patterns.
The transcriptome is the complete set of all mRNA molecules or transcripts in a genome.
Proteome is the complete set of all proteins expressed by a genome. Transcriptomics and
proteomics are the study of the transcriptome and proteome. Unlike the genome, which has a
fixed number of genes expressed for a given cell population in a certain development phase, the
transcriptome and proteome are dynamic, and can vary with various internal or external stimuli
in a given cell type under defined treatment. Therefore, studies of the transcriptome and
proteome are much more complex, and they reflect the genes/proteins that are actively expressed
under defined conditions (220).
Transcriptomics and proteomics data are closely related, although different. On one hand, it
is proteins, not genes that actively take part in the cellular function. On the other hand, mRNA is
an intermediate step in the production of a protein, and it can be used to predict protein
expression to some degree. Technologically, transcriptomic analysis using microarray
technology is a high-throughput technology capable of simultaneously quantifying tens of
thousands of mRNA molecules. In contrast, the traditional proteomic analysis using 2-
dimensional electrophoresis is a labor-intensive and time-consuming platform for protein
separation, and the target proteins are limited to proteins with high abundance, soluble, and with

95
a suitable pH (pH 3-10) and molecular weight (10-200 kDa). Therefore, it is imperative to
integrate mRNA and protein expression into a common frame, analyzing changes in expression
of genes/proteins in functional categories globally, thereby providing a broader view of
systematic instead of individual alteration of genes/proteins.
B.2. Real-time Quantitative RT-PCR (qPCR or Real-time RT-PCR)
The traditional method for quantification of transcription includes northern blotting, in situ
hybridization (221), RNase protection assay (222), qPCR (223), and cDNA array (224). Of these,
qPCR is widely used due to its high sensitivity, specificity and reproducibility.
B.2.1. Introduction of qPCR
qPCR was first described in the 1990s (225), but it has only recently been widely accepted
as a valuable technique due to the application of low-cost thermocyclers and reagents. qPCR
takes advantage of special chemistries (probes) to report the presence of PCR products, dedicated
instrumentation for monitoring the signal as PCR progresses (i.e. in real time) and appropriate
software for quantitative analysis (226). Data from the fluorescent signal are collected
throughout the exponential phases of the PCR process rather than at the end of the PCR process
(end-point PCR). Therefore, it avoids the problems associated with quantitative detection in the
plateau stage of traditional PCR, and there are many advantages of qPCR to quantify gene
expression (www.appliedbiosystems.com).
qPCR is highly sensitive (can even detect a single copy of a specific transcript) (227),
highly sequence-specific, and reproducible (228), reliable, simple (without post-PCR processing),
amenable to high sample throughput benchmark technology with wide dynamic range (7-8 log
orders of magnitude) (229) for the detection and/or comparison of RNA levels quantitatively
(230,231). The only disadvantages of qPCR are expensive equipment and reagents. In addition,

96
sound experimental design, appropriate normalization choices and reasonable models for data
analysis are essential components for correct conclusions.
The general procedure of qPCR is the following: total RNA from tissue or cell lines are
extracted and used as a template to reverse transcribe to cDNA, followed by exponential
amplification in a PCR reaction (Figure Appendix B.2). During each cycle of amplification, the
fluorescent signals attached to the probes are detected.
The instrument and reagents used in the present study were from Applied Biosystems (ABI)
(Foster City, CA). The ABI instrument used for this research was a ABI 7900HT Fast Real-
Time PCR System (7900HT Fast System) combined with TaqMan® Low Density Arrays (LDA).
It is a medium-throughput design for 384-well format with highly sensitive laser. It is based on
fluorescent chemistries to detect the gene expression quantitatively as PCR progresses. Several
assay types can be performed on this system such as 96-well, 384-well and TaqMan®LDA
(www.appliedbiosystem.com). Another advantage of ABI 7900 is the “passive reference dye”
(ROXTM), to which the reporter dye signal can be normalized for the variation in the optics of the
system (232), which leads to increased data precision.
B.2.2. Theory and Quantitation of qPCR
The polymerase chain reaction (PCR) was first described in 1985 (233,234), and it is a
technique for enzymatic amplifying in vitro DNA. In PCR, the DNA template doubles with
every subsequent cycle of denaturation, annealing, and synthesis (234). RT-PCR differs from
PCR only by the addition of an initial step of reverse transcribing mRNA into cDNA. Real-time
RT-PCR is based on fluorescent probes to collect data throughout the PCR process allowing
gene expression to be measured quantitatively.

97
The qPCR plot is the plot of the fluorescent signals versus PCR cycle number (Figure
Apendix B.3). With each PCR cycle, the fluorescence signals become accumulated from the
baseline to the threshold where they are significantly higher than background fluorescence. The
threshold cycle value (Ct) is the fractional PCR cycle number at which the fluorescent signal
reaches threshold, and it is the basis for the DNA/RNA relative quantification (or comparative Ct)
method, which is in contrast to the absolute quantification (standard-curve) method. The
comparative Ct method is specially applied when only a limited amount of RNA can be obtained
or when a large number of samples need to be processed (www.appliedbiosystems.com).
Figure Appendix B.2. Experimental steps of Real-time PCR. Total RNA from tissue or cell lines are extracted and used as a template to reverse transcribe to cDNA, followed by exponential amplification in a PCR reaction. Normalized data are obtained based on the calibrator sample after normalization to the housekeeping gene (HKG), and the correct statistical model is created and statistical analysis is performed. The conclusions are drawn based on the analytical results.
Consequently, the Ct value and the target genes in initial samples are inversely related, and
the higher the initial input cDNA copy number, the faster the fluorescent signal will become
greater than background fluorescence, therefore producing a smaller Ct value. Of course, the
opposite is also true. Thus, the comparative Ct assays are used to analyze the changes in

98
expression of a nucleic acid sequence (target) in a treated sample to the same sequence relative to
an untreated control sample (calibrator) after normalization to a housekeeping gene (HKG)
(more detailed in the Section of Normalization) (235). Therefore, the amount of target,
normalized to an endogenous control and relative to a calibrator, is calculated as the fold change
(RQ), and RQ = 2 − ∆∆CT, where– (∆∆CT)= - (∆Ct, treatment -∆Ct, control)=- [(Ct, Target- Ct,
GADPH) treatment - (Ct, Target - Ct, GADPH) control (235). The RQ method allows accurate comparison of
target genes between the treated sample and untreated control samples without the application of
standard curves.
Figure Appendix B.3. Hypothetical amplification plot of qPCR (232). The amplification plot is the plot of fluorescence versus PCR number. The threshold cycle value (Ct) is the fractional PCR cycle number at which the fluorescent signal becomes accumulated enough to reach threshold for detection. Therefore, the input cDNA copy number and Ct are inversely related. The fold change (RQ) = 2 − (∆∆CT), where – (∆∆CT) = - (∆CT, treatment - ∆CT, control) = - [(Ct, Target - Ct, GADPH) treatment - (Ct, Target - Ct, GADPH) control.
The RQ method assumes that the ideal amplification efficiency of all target genes and the
endogenous control is 1, indicating that PCR product concentration increases twofold every
cycle within the exponential phase of the reaction. When the RQ method is applied by the ABI
systems, there is automatic correction of amplification efficiency (i.e. if not 1) (235), as long as

99
the amplification efficiency of the target genes and HKGs are approximately identical, preferably
over 90% or more. In addition, new primers can be designed and optimized to promise a
comparable efficiency for the each of the target genes and HKGs by ABI systems, as performed
in the present study. An alternative method to assess the amplification efficiency of two genes is
to determine how ∆∆CT varies with template dilution (235).
Normalization
In theory, the purpose of the endogenous control gene, usually the housekeeping gene
(HKG), is to normalize the starting material RNA for RT reaction, or the efficiency of the
reverse transcription. One of the assumptions of the RQ method was that the expression level of
a chosen HKG does not vary across experimental samples, and it may serve as an active
reference for the qPCR reaction. The commonly applied HKGs include GAPDH, β-actin, and
18s rRNA, since their expression tends to be relatively stable (236). However, there are
numerous reports (237) stressing that no single gene can be constitutively expressed in all cell
types under all developmental phases and treatments, and every gene is regulated to some degree.
Therefore, it is recommended that multiple endogenous control genes are chosen, compared and
validated to identify those which are not affected by the experiment treatment. An alternative
approach can be performed to validate the effect of experimental treatment on the expression of
the internal control gene (235).
Primers and Probes
Usually three kinds of primers are used to synthesize cDNA from mRNA: the random
primers, oligo-dT, and target gene-specific primers (231). Random primers are used in the
current real-time RT-PCR assays due to the advantage that RT was primed at multiple origins
along every RNA template, hence producing more than one cDNA target per original mRNA

100
target (231). Furthermore, primers designed to span the exon-exon boundary can efficiently
prevent detection of genomic DNA, therefore providing specificity (232).
B.2.3. Essentials of Real-time RT-PCR
Quality of RNA
The extraction of total RNA from the sample is the initial step of qRT-PCR assay, and its
quality is undoubtedly the most critical component for reproducibility and relevance of the
following qRT-PCR results. RNA is tremendously susceptible to degradation once removed
from its cellular environment. Therefore, its quality must be assessed for integrity before the
following reverse transcription reaction. The total RNA applied in RQ experiments should not
be contaminated with RT or PCR inhibitors, and be intact when visualized by gel electrophoresis.
The traditional gel electrophoresis requires a significant amount of valuable RNA, and it is a
time-consuming technique. The advanced technology of Agilent’s Bioanalyzer 2100 and RNA
Lab Chip (Palo Alto, CA) applied in the current experiment is by far the most convenient and
objective way of assessing the quality and quantity of RNA.
RT and PCR Reactions
After high-quality mRNA is extracted from tissue, it is reversed transcribed to cDNA by a
high capacity cDNA archive kit (PN 4322171) in order to perform the first step (RT) in the two-
step RT-PCR method. The following table is optimized for thermal parameters (Table Appendix
B.1) (www.appliedbiosystems.com).
Table Appendix B.1. The thermal parameters for RT reaction
Step Type Time (min) Temperature
Hold 10 25º
Hold 120 37º

101
After RT is complete, the second step of PCR in the two-step RT-PCR is initiated in order
to amplify cDNA. In this step, TaqMan® Universal PCR Master Mix is mixed with sample
cDNA (Table Appendix B.2), and loaded into eight TaqMan® Array sample ports; each port
feeds into 48 reaction wells for a total of 384 reactions. The TaqMan® array is then run on the
7900HT system for data collecting and quantitative analysis.
Table Appendix B.2. The components of PCR reaction
Component Volume (µl) per fill reservoir
cDNA sample (1000 ng) + RNase-free water 50.0
TaqMan® Universal PCR Master Mix (2X) 50.0
Total Volume 100.0
For real-time PCR reactions, the following condition below is the universal default
recommended thermal cycle condition is used 94.5° 15s for initial template denaturation, and 40
cycles of 97° 30s for denaturation and 59.7° 1 min for anneal/extension. This universal cycling
condition eliminates the need for optimization of the thermal cycles.
ABI TaqMan® Low Density Array
The TaqMan® Low Density Array is a 384-well micro fluidic card which is preloaded with
customizable probes and primer pairs of target genes from TaqMan® Gene Expression Assays,
thus allowing 384 simultaneous real-time PCR reactions, and analyzes from one to eight cDNA
samples according to the number of target genes using random primers on 7900HT Systems. It
is a low- to medium- throughput and a standardized technique for measuring and/or screening
gene expression across many samples. The array in the current experiment is a 24-format array,
which contains two endogenous control genes and 22 target genes, and allows measuring 8
cDNA samples simultaneously (www.appliedbiosystems.com).

102
The whole procedure is very simple to perform and without need for liquid-handling robots
or multi-channel pipettors to load samples (Figure Appendix B.4). It is an efficient method to
validate micro-array hits quickly and economically.
Figure Appendix B.4. The TaqMan® Low Density Array streamlines the reaction set-up process in four simple steps. Loading the array with a cDNA sample and TaqMan® Universal PCR Master Mix takes only five minutes (www.appliedbiosystems.com).
B.2.4. Conclusion of qPCR
The combined application of TaqMan® Low Density Array (LDA) for the RQ method in the
field of real-time RT-PCR undoubtedly can generate reliable, reproducible, and low- to medium
throughput results for measuring mRNA expression level quantitatively. This method can be
applied to measure significant changes in the expression of many genes in response to the
various external/internal stimuli (such as leptin) in animal model system (such as ob/ob mice).
Since the mRNA level can predict the level of protein expression to some degree, the differential
expression profiles of mRNA from adipose tissue between control and leptin treated ob/ob mice
can suggest some potential bio-markers responsive to leptin.
There are no previous publications that combined TaqMan® Low Density Array with qPCR
method to quantitatively measure the adipose tissue mRNA expression levels in ob/ob mice
103
treated with leptin, and but it is an efficient method to validate micro-array hits (138) quickly and
economically (238,239).
B.3. Proteomics
B.3.1. Introduction of Proteomics
Proteomics, the term coined in 1994, was the linguistic equivalent to genomics. It was
initially defined by Gygi et al (240) as the complete set of proteins globally and quantitatively in
a cell line, tissue, or organism at a given time point. The definition of proteomics has now been
broadened to embrace the study of comparative proteomics (differential display proteomics or
protein expression profiling), and cell-mapping proteomics (sub-cellular distribution, protein -
protein interactions) (3).
The tremendous progress in proteomics can be attributed to the complement sequencing of
genomes of several species, the technological breakthrough of mass spectrometry for analyzing
macromolecules, and protein databases available in the public domain. It is the product of
technological advances in chemistry, physics, bioinformatics, mathematics and molecular
biology. The emergence of proteomics has made it possible to automate the analysis and
identification of proteins in a large-scale manner, which is greatly improved in comparison to the
previous one-by-one analytical techniques of proteins. Therefore, it is a promising, high-
throughput technique.
Since the proteome of a cell is only a reflection of its immediate stimuli in the environment,
it is much more dynamic in nature. Basically, there's a change of the proteome of each cell at
each time point under each development phase, and every picture of gel is like taking a
“snapshot”. Contrary to proteomics, genomics is static, since at any time there is only one set of
genes in a given organism. From this aspect, the proteome dataset is much larger and more

104
complex because most mammalian genes show alternative splicing of transcripts, and the
proteins are functionally inactive only until they undergo different post-translational
modifications in the ER.
The traditional proteomic analysis usually has two steps: protein separation by 2-
dimensional electrophoresis and protein identification by MS. The first high resolution 2-DE
was developed independently by O’Farrell (241), Klose (242), and Scheele in the 1970s (243),
who began separating proteins from Escherichia coli, mouse, and guinea pig. Proteins are
separated by their orthogonal characteristics, isoelectric point (pI) and molecular weight (MW).
Although many technological improvements have been made for protein separation in the early
stage, the science of proteomics would wait until the sensitive and rapid analytical methods for
protein identification had emerged (such as the polymerase chain reaction and the automated
sequencer for DNA analysis). In the 1990s, technological breakthroughs for peptide analysis by
MS have marked the beginning of a new era for proteomics science.
B.3.2. Technology of Proteomics
Comparative proteomics is one of the frequent applications of 2-DE. A comparison of 2-D
gel images between control and treatment samples is usually performed, and the appearance or
disappearance of spots, as well as the abundance of those spots offer qualitative and quantitative
information about varying expression patterns of proteins. The comparison can be performed
among cells treated with various treatments, or tissue of normal versus disease status. This
allows identification of potential diagnosis markers, drug targets and specific biological events.
This review will focus on the technology of comparative proteomics.
The standard approach of comparative proteomics is to prepare samples and solubilize
proteins, and isolate proteins by 2-DE. The gels are then scanned and visualized by a special

105
instrument. Comparison and quantification of the protein spots are performed via highly
complex software packages. Consequently, the target protein spots are selected according to the
standards, and mostly cleaved and digested with amino acid-specific trypsin by in-gel digestion.
The data of peptide mass fingerprints (PMFs) analyzed by MALDI-TOF. The proteins are then
identified and characterized through comparing and searching protein databases (NCBI and
SWISS-PROT) with the help of search engine Mascot (Figure Appendix B.5).
Figure Appendix B.5. Common procedure for proteomics (244)
Sample Preparation
Sample preparation is often a critical component to perform 2-DE, and the proteins from the
samples are denatured, disaggregated, and reduced in order to be solubilized reproducibly (245).
It is difficult to visualize all proteins from a tissue due to the highly dynamic range of protein
abundance, and the variety of proteins with respect to their various properties of MW, pI, and
hydrophobicity. Although there is no single method for sample preparation that can be applied
to all kinds of samples, the general rules for protein extraction are simple. With these methods
protein modification can be prevented, interfering molecules such as proteolytic enzymes, lipids
and nucleic acids can be removed, and the protein of interest is likely to be in a range that can be
detected. Generally speaking, samples should be kept as cold as possible all the time (246).

106
Urea solutions should always be used fresh, and samples containing urea must not be heated to
avoid the carbamylation due to the decomposition of urea (247).
Cell lysis, removal of interfering substances, and solubilization of the proteins are three
major steps for sample preparation. Lysis of different types of cells can be achieved by
homogenizers, liquid nitrogen mortar and pestle method, enzymatic method, sonication, bead
method, or a combination of these methods. After cell lysis, it is necessary to remove or
inactivate the interfering compounds such as proteolytic enzymes, salts, lipids, and all other
insoluble components by high-speed centrifugation. Cold TCA/acetone precipitating technique
is also a very useful method for removing salts and lipid, but protein loss may occur to some
degree due to incomplete precipitation and/or resolubilization of proteins. 2-D clean-up kit (GE
Healthcare) takes advantages of the TCA/acetone method for optimization, and is an alternative
method (248). Spin dialysis is a commonly used method to remove salts. Proteases must be
inactivated to prevent protein degradation, but high concentration of urea can effectively prevent
protein degradation.
In the present study to obtain proteins from adipose tissue of ob/ob mice, homogenization
was applied for cell disruption, high-speed centrifugation and ultra-centrifugation; 2-D clean-up
kit and spin dialysis were all applied for removal of interfering compounds such as lipids, salts,
etc.
After cell lysis and the removal of interfering substances, the individual polypeptides must
be solubilized, denatured and reduced to completely break the interactions between the proteins.
Sample solubilization is usually carried out in a buffer containing chaotropes (e.g. urea and/or
thiourea), nonionic and/or zwitterionic detergents (e.g. CHAPS), reducing agents depending on
the type of sample, and protease inhibitors. The “standard” IEF sample solution (8 M urea, 4%
107
CHAPS, 50-100 mM DTT and 40 mM Tris base), is not ideal for many membrane proteins and
samples such as adipose tissue, and serum. The inclusion of thiourea in the IEF procedure
greatly increases the resolution of the gel spots, especially for membrane proteins (165,166) and
adipose tissue (167). Surfactants help to solubilize the unfolded proteins (membrane proteins)
following exposure by strong chaotropic agents and is a useful detergent for the solubilization of
membrane proteins in proteomics (172,177,249).
Separation of Proteins by 2-DE
One of the bottleneck steps in any proteomic analysis study is protein separation. In spite of
alternative technologies that have emerged (Multidimensional Protein Identification Technology,
Mud PIT (250)), protein or antibody arrays (251), shotgun proteomics technique (178), isotope
coded tag technique (ICAT) (252), 2-DE still remains the most effective element to resolve
proteins from a complex mixture, and it is a reliable technique that can be applied to comparative
expression profiles. Here the protein expression profiles of any two samples can be qualitatively
and quantitatively compared, and the changed expression of target proteins can provide
information about treatment/stimuli. In 2-DE, proteins are separated according to their charge by
IEF in the first dimension and molecular weight by SDS-PAGE in the second dimension.
Usually the standard 2-DE format can isolate and visualize 1000-3000 proteins depending on the
sensitivity of staining method. The molecular weight of the proteins separated are usually about
10-300 kDa, and 1ng is the sensitivity for each spot in 2-DE. One of its greatest advantages is its
ability to resolve proteins undergoing some form of posttranslational modification.
Isoelectric Focusing (IEF) of 2-DE
IEF with immobilized pH gradient strip (IPG )(253) (Figure Appendix B.6A) has replaced
the carrier ampholyte (CA) –based gel, and becomes the method of choice for the first dimension

108
of 2-D PAGE. The advantages of application of IPGs include the increased reproducibility, the
enhanced resolution (∆pI = 0.0001) (159) and loading capacity (254). IPG can be linear or
nonlinear (255), with different pH range (e.g. IPG 3-12, IPG 4-7, IPG 4.5-5.5), as well as in
different lengths (e.g. 7-24cm) (248). Prior to IEF, the IPG dry strips must be rehydrated to their
original thickness with a rehydration buffer, usually containing 8 M urea (or 2 M thiourea and 6
M urea), 2% CHAPS, 0.4% DTT as a reductant and 0.5% v/v carrier ampholyte (e.g. IPG buffer
or Pharmalyte 3-10). IPG strip manipulation can be either by in-gel or cup-loading rehydration.
Active rehydration (e.g. by applying low voltage under 50V) during re-swelling can be applied to
IEF in order to facilitate the entry of higher molecular weight proteins (such as 150 kDa).
Usually each IPG strip is set to 50mA for IEF, and temperature is an important parameter on the
2-DE gel, where 20° C is the optimal condition (256). The amount of protein loaded onto a
single IPG gel strip depends on the separation distance, pH gradient and protein complexities
with the aim to guarantee the maximum spot numbers and the minimum streaking/background.
For analytical gels, 100 mg of protein can be typically applied on an 18cm long, wide pH range
gradient (pH 3-10). For preparative gels, 5-10 times more samples can be applied.
The instrument IPGphor (GE Healthcare) (Figure Appendix B.6B) has simplified the IPG-
IEF procedure of 2-DE, where rehydration and IFE steps can be completed in one-step, and the
temperatures are controlled strictly and automatically (257). This instrument can accommodate
up to twelve individual strip holders, therefore 12 IPG strips can be run simultaneously.
SDS-PAGE
Prior to the second dimensional SDS-PAGE, the IPG strips are equilibrated in order to
enhance the protein transfer from the first to the second dimension and to interact completely
with SDS. SDS is an anionic detergent which denatures the proteins, unfolds them to a linear

109
molecular structure and imparts a negative charge. When reducing agents such as DTT is
present, proteins are therefore well separated according to their mass in SDS-PAGE.
A. IPG strips B. IPGphor
Figure Appendix B.6. IPG strips (A); IPGphor (B) (www. amersham.com)
The second dimension can be performed on horizontal or vertical systems (258). Horizontal
setups are suited for ready-made SDS polyacrylamide gels; whereas vertical systems allow
multiple gels to run in parallel, therefore increasing the reproducibility and saving time (259).
The Laemmli system has been the standard buffer used to perform SDS-PAGE (260). As with
the IPGphor, the Ettan Dalt II system (GE Healthcare) allows up to 12 gels to be run
simultaneously and the electrophoresis procedure often takes 4-6 hours to complete in a
temperature-control manner. Protein extracts are usually separated by IPG strip with pH 3-10 in
the first dimension and 9-16% linear gradient gels with format (18 X 20cm) in the second
dimension in vertical setups (246). This system usually provides a general image of the
proteome with molecular weight between 5–200 kDa with proper staining method (261).
Limitation of 2-DE
The number and type of proteins resolved and visualized by 2-DE are limited. Only the
highly abundant, soluble proteins can be identified, while the low-abundant, hydrophobic

110
proteins, can not be readily detected during analysis of total proteins (240). Due to their
interesting roles as potential targets of drug and in signal transduction, many enrichment methods
have been applied for low-copy proteins such as sub-cellular fractions and organelles (262), and
enrichment of proteins from larger volumes by selective fractionation, immuno-precipitation,
chromatographic methods (263-265). The introduction of thiourea and urea, as well as some
novel zwitterionic detergents such as ASB(n) and CΦ8, benefit at least some membrane proteins
(165).
The proteins with extreme pH and low/high molecular weight are frequently
underrepresented in 2-DE (Figure Appendix B.7) (266). This picture shows the sorting proteins
by charge and MW from mouse liver, and it is observed that most proteins identified have
masses between 10-80 kDa and pI range 4-10 (266). Some improvements in IPGs have enabled
the analysis of very acidic (pH2.5) or basic (pH12) proteins (248,267). IPGs up to 54 cm length
have been applied (268).
In order to separate low or high molecular mass proteins, gels with appropriate acrylamide
concentration have to be used (269,270). Tricine gels are specially applied to small proteins with
a mass range of about 6-25 kDa. In addition, LC-MS integration provides isolation alternatives
for the above mentioned proteins that have little chance to be separated on the 2-DE (271).
Staining
Once the protein spots are separated by 2-DE, they can be stained and further visualized by
the use of colorimetric and fluorescent dyes. The ideal staining dye should have a good linear
relationship between quantity of protein and the staining intensity, wide dynamic range, mass
spectrometry - compatible, easy-to-perform, and not too expensive. In spite of a number of
different dyes available, silver and Coomassie stains are most frequently used staining methods.

111
Figure Appendix B.7. The distribution of proteins in the different range
of pH and molecular weight (266)
Coomassie is preferred when the gels are intended for protein identification by mass
spectrometry, while silver stain is preferentially employed for gel comparison (248). Coomassie
staining uses a low cost dye, and a simple procedure, and it typically only detects 8–10 ng of
protein, while silver can stain trace proteins in the 1 ng range (20 fm dyes is just across 1-2
orders. Recently, the developments in fluorescence technologies have gained popularity, such as
SYPRO Ruby and CyDyes, due to their high sensitivity (equal to silver stain), wide linear
dynamic ranges (3 orders), MS-compatibility and highly reproducibility. Therefore, it is
particularly appropriate for quantification in comparative proteomics and suitable for detecting

112
protein spots with low-intensity (272). The only disadvantages are that the dyes are more
expensive, and a special instrument is needed to visualize the spots and to acquire the image for
image analysis.
Differential in-gel Electrophoresis (DIGE)
The exciting advance in 2-DE was the technology of difference in-gel electrophoresis
(DIGE) (273). CyDyeTM DIGE Fluor minimal dyes (Cy2, Cy3 and Cy5) are size- and charge-
matched fluorescent dyes, and are specifically designed to accurately analyze differences in
protein abundance between samples using Ettan TM DIGE systems. This system comprises
CyDye DIGE Fluor minimal dyes, Typhoon 9400 TM variable mode imager, and DeCyder
differential analysis software.
Before electrophoresis, different protein samples (control, treatment and internal standard as
a normalization), are individually labeled with Cy2, Cy3 and Cy5 dyes via an amide linkage of
lysine residues within proteins, and are subjected to exactly the same first- and second-dimension
running conditions. Therefore, the identical proteins labeled with each of the CyDye DIGE
Fluor dyes will migrate to the same position on a 2-D gel. This reduces gel-to-gel variation and
makes gel-to-gel matching consistent, and thus allows a more accurate and rapid quantification
of changes of protein abundance between samples. After 2-DE, the same gels are scanned by
Typhoon 9400 to obtain three images due to narrow and different wavelengths of each individual
fluorescent dye. The three images are then overlaid and combined for further statistical analysis
by DeCyder TM Differential Analysis Software (Version 4.0).
B.3.3. Protein Identification by MS
Mass spectrometry (MS)-based method is an indispensable platform for the identification of
gel-based peptide mass by peptide mass fingerprinting (PMF) or amino acid sequence (MS/MS)

113
in proteomic analysis. The location and type of protein identifications can also be determined.
Protein information identified by MS can be divided into three stages: (I) sample preparation; (II)
peptide mass fragment; and (III) database searching.
Sample Preparation
After the sample proteins are resolved from the 2-D gel, the next challenge is to extract
proteins from the gels, purify and analyze them by MS. The “in-gel” digestion with a protease
is the most efficient technique for recovering proteins from 2-D gels (274), and trypsin is the
favored enzyme for protein cleavage due to its low price, high specificity, and the peptides
generated (usually 8-10 amino acid) are appropriate for MS analysis.
MALDI-TOF MS and PMF
Mass spectrometers consist of three main components: the ionization source, the mass
analyzer, and the ion detector (275). An ionization source is responsible for transferring the
target molecules into gas-phase ions. A mass analyzer can separate gas-phase ions according to
their different physical properties such as time-of-flight (TOF), electric or magnetic field
(Quadruple or ion trap), which subsequently is measured by the ion detector. The contribution of
MS to proteomics is the technical breakthrough involving “soft” ionization that produces the
protein ions, peptides-matrix assisted laser desorption/ionization (MALDI) and electrospray
ionization (ESI).
In MALDI, analytes are first mixed with a UV-absorbing substance called matrix (e.g. 2,
5-dihydroxybenzoic acid or α-cyano-4-hydroxy-cinnamic acid), and spotted on a metal plate to
form a crystal. This 96-well format plate is then situated in the mass spectrometer. A pulsed
laser is then fired at a target molecule, and singly charged ions are primarily produced via the
transferred energy from the matrix to the embedded analytes. MALDI is frequently coupled to

114
TOF for mass analysis, and an m/z value is calculated as the time it takes ions to travel a certain
distance to reach the ion detector.
The basis of MALDI TOF for protein identification is peptide mass fingerprinting (PMF)
(276). The “unknown” proteins are digested with residue-specific protease, usually trypsin, thus
generating a series of peptide mass fingerprints. For protein identification, the experimentally
obtained peptide masses are compared with those of theoretical peptide masses, and the query
proteins can be characterized if there is sufficient number of peptides matches in a database
(244). Since PMF is not specifically for the purpose of obtaining the amino acid sequence, it is
most fit for distinguishing proteins from species of which complete genome sequences have been
determined. A mixture of proteins in one spot is not suitable for PMF, because it is not clear
which peptide in the mixture originate from which protein. Low molecular weight proteins are
the other limitation, since too few peptide fragments are produced, and not sufficient matched
hits are met to characterize a specific protein. In addition, PMF is a better fit for identification of
proteins separated from 2D gels, where the additional information regarding the proteins such as
pI and MW is helpful in protein identification.
Database searching allows protein identification from PMF data of MALDI-TOF MS. PMF
requires a number of user specified parameters such as protease used, mass type, charge and
tolerance; coverage, amino acid modifications; missed cleavages; minimum number of peptide
matches required as well as the database(s) to be searched (277).
The principle advantages of MALDI-TOF-MS is large-scale, high sensitivity (low fmol
range), accuracy (low ppm range), and tolerance to contaminants (244,278). Because of its
speed, it is frequently performed as the first line instrument for gel-based protein identification.

115
If proteins cannot be identified by PMF, they can be further analyzed by tandem MS/MS, where
amino acid sequence can be obtained.
B.3.4. Conclusion of Proteomics
The whole procedure of proteomics is demonstrated in Figure 2.15. Proteomics and
functional genomics are emerging new technologies offering promising tools to study the global
analysis of proteins and mRNA transcripts in a complex biological system under certain
external/internal stimuli. Although the applications of these two techniques are in their infancy
and have some limitations, integrating mRNA and protein expression into a common framework
has the potential to provide new insight into biology, which can not be obtained from the study
of individual proteins.

116
Appendix C SAS CODES FOR REAL-TIME RT-PCR DATA
dm 'log;clear;output;clear;'; options formdlim="*"; PROC IMPORT OUT= WORK.QPCR1 DATAFILE= "C:\Documents and Settings\weizhang\Desktop\Applied Biosystems files\qPCR for SAS qpcr1.xls" DBMS=EXCEL2000 REPLACE; SHEET="Sheet1$"; GETNAMES=YES; RUN; /*To see the distribution of the dataset after log transformation*/ data qpcr; set work.qpcr1; lrq=log (rq); run; /*Trim the double valuess or duplicate for each gene and each sample into the single value, get the average */ proc sort data=qpcr; by detector mouseid; run; proc means noprint data=qpcr; by detector mouseid; var lrq; output out=ltest mean= xlrq; id trt; proc print data=ltest; run; proc glm data=ltest; by detector; class trt cardno; model xlrq=trt cardno; lsmeans trt; lsmeans trt/pdiff stderr; run; proc gplot data=ltest; plot xlrq*detector; run; proc univariate data=ltest; var xlrq; by detector; output out=ldtest median=mlrq p10=llrq p90=ulrq; id trt detector; run; proc sort data=ltest;by detector;run;proc sort data=ldtest; by detector; data new2;merge ltest ldtest;by detector;run; proc print data=new2;run; data new3;set new2;s=(ulrq-llrq)/2.564; z=(xlrq-mlrq)/s; if ABS(z)>2.5 then z2=2.5; if ABS (z)<2.5 then z2=z; run; proc print data=new3; run; /*Normal Distibution of the transformed and truncated database*/ proc gplot data=new3; plot z2*detector; run; proc sort data=new3; by detector; run; proc print data=new3;run; /*Normal Distribution of the database*/ options formdlim="*"; proc glm data=new3; class trt; model z2=trt; lsmeans trt/pdiff stderr;by detector;run;

117
REFERENCES 1. Zhang, Y., Proenca, R., Maffei, M., Barone, M., Leopold, L. & Friedman, J. M. (1994) Positional cloning of the mouse obese gene and its human homologue. Nature 372: 425-432. 2. Reidy, S. P. & Weber, J. (2000) Leptin: an essential regulator of lipid metabolism. Comp Biochem Physiol A Mol Integr Physiol 125: 285-298. 3. Rupnick, M. A., Panigrahy, D., Zhang, C. Y., Dallabrida, S. M., Lowell, B. B., Langer, R. & Folkman, M. J. (2002) Adipose tissue mass can be regulated through the vasculature. Proc Natl Acad Sci U S A 99: 10730-10735. 4. Scarpace, P. J., Nicolson, M. & Matheny, M. (1998) UCP2, UCP3 and leptin gene expression: modulation by food restriction and leptin. J Endocrinol 159: 349-357. 5. Prins, J. B., Walker, N. I., Winterford, C. M. & Cameron, D. P. (1994) Human adipocyte apoptosis occurs in malignancy. Biochem Biophys Res Commun 205: 625-630. 6. Anonymous (1994) Apoptosis of human adipocytes in vitro. Biochem Biophys Res Commun 201: 500-507. 7. Stephens, T. W., Basinski, M., Bristow, P. K., Bue-Valleskey, J. M., Burgett, S. G., Craft, L., Hale, J., Hoffmann, J., Hsiung, H. M. et al. (1995) The role of neuropeptide Y in the antiobesity action of the obese gene product. Nature 377: 530-532. 8. Schwartz, M. W., Seeley, R. J., Campfield, L. A., Burn, P. & Baskin, D. G. (1996) Identification of targets of leptin action in rat hypothalamus. J Clin Invest 98: 1101-1106. 9. Ingalls, A. M., Dickie, M. M. & Snell, G. D. (1950) Obese, a new mutation in the house mouse. J Hered 41: 317-318. 10. Friedman, J. M. & Halaas, J. L. (1998) Leptin and the regulation of body weight in mammals. Nature 395: 763-770. 11. Della-Fera, M. A., Choi, Y. H., Hartzell, D. L., Duan, J., Hamrick, M. & Baile, C. A. (2005) Sensitivity of ob/ob mice to leptin-induced adipose tissue apoptosis. Obes Res 13: 1540-1547.

118
12. Visscher, T. L. & Seidell, J. C. (2001) The public health impact of obesity. Annu Rev Public Health 22: 355-375. 13. Wee, C. C., Phillips, R. S., Legedza, A. T., Davis, R. B., Soukup, J. R., Colditz, G. A. & Hamel, M. B. (2005) Health care expenditures associated with overweight and obesity among US adults: importance of age and race. Am J Public Health 95: 159-165. 14. Unger, R. H. (2002) Lipotoxic diseases. Annu Rev Med 53: 319-336. 15. Flier, J. S. (2004) Obesity wars: molecular progress confronts an expanding epidemic. Cell 116: 337-350. 16. Marieb, E. (2005) Human Anatomy & Physiology (7th Edition). 17. Ahima, R. S. & Flier, J. S. (2000) Adipose tissue as an endocrine organ. Trends Endocrinol Metab 11: 327-332. 18. Diepenhorst, M. J. & de, V. O. (1950) Haematological changes in parabiotic rats. Acta Physiol Pharmacol Neerl 1: 342-344. 19. Tartaglia, L. A., Dembski, M., Weng, X., Deng, N., Culpepper, J., Devos, R., Richards, G. J., Campfield, L. A., Clark, F. T. et al. (1995) Identification and expression cloning of a leptin receptor, OB-R. Cell 83: 1263-1271. 20. Bado, A., Levasseur, S., Attoub, S., Kermorgant, S., Laigneau, J. P., Bortoluzzi, M. N., Moizo, L., Lehy, T., Guerre-Millo, M. et al. (1998) The stomach is a source of leptin. Nature 394: 790-793. 21. Liu, Y. L., Emilsson, V. & Cawthorne, M. A. (1997) Leptin inhibits glycogen synthesis in the isolated soleus muscle of obese (ob/ob) mice. FEBS Lett 411: 351-355. 22. Hassink, S. G., de Lancey, E., Sheslow, D. V., Smith-Kirwin, S. M., O'Connor, D. M., Considine, R. V., Opentanova, I., Dostal, K., Spear, M. L. et al. (1997) Placental leptin: an important new growth factor in intrauterine and neonatal development? Pediatrics 100: E1. 23. Lee, G. H., Proenca, R., Montez, J. M., Carroll, K. M., Darvishzadeh, J. G., Lee, J. I. & Friedman, J. M. (1996) Abnormal splicing of the leptin receptor in diabetic mice. Nature 379: 632-635. 24. Ahima, R. S., Qi, Y., Singhal, N. S., Jackson, M. B. & Scherer, P. E. (2006) Brain adipocytokine action and metabolic regulation. Diabetes 55 Suppl 2: S145-154.

119
25. Schwartz, M. W., Baskin, D. G., Bukowski, T. R., Kuijper, J. L., Foster, D., Lasser, G., Prunkard, D. E., Porte, D., Jr., Woods, S. C. et al. (1996) Specificity of leptin action on elevated blood glucose levels and hypothalamic neuropeptide Y gene expression in ob/ob mice. Diabetes 45: 531-535. 26. Mizuno, T. M. & Mobbs, C. V. (1999) Hypothalamic agouti-related protein messenger ribonucleic acid is inhibited by leptin and stimulated by fasting. Endocrinology 140: 814-817. 27. Cheung, C. C., Clifton, D. K. & Steiner, R. A. (1997) Proopiomelanocortin neurons are direct targets for leptin in the hypothalamus. Endocrinology 138: 4489-4492. 28. Elias, C. F., Lee, C., Kelly, J., Aschkenasi, C., Ahima, R. S., Couceyro, P. R., Kuhar, M. J., Saper, C. B. & Elmquist, J. K. (1998) Leptin activates hypothalamic CART neurons projecting to the spinal cord. Neuron 21: 1375-1385. 29. Ahima, R. S. & Flier, J. S. (2000) Leptin. Annu Rev Physiol 62: 413-437. 30. Halaas, J. L., Gajiwala, K. S., Maffei, M., Cohen, S. L., Chait, B. T., Rabinowitz, D., Lallone, R. L., Burley, S. K. & Friedman, J. M. (1995) Weight-reducing effects of the plasma protein encoded by the obese gene. Science 269: 543-546. 31. Halaas, J. L., Boozer, C., Blair-West, J., Fidahusein, N., Denton, D. A. & Friedman, J. M. (1997) Physiological response to long-term peripheral and central leptin infusion in lean and obese mice. Proc Natl Acad Sci U S A 94: 8878-8883. 32. Pelleymounter, M. A., Cullen, M. J., Baker, M. B., Hecht, R., Winters, D., Boone, T. & Collins, F. (1995) Effects of the obese gene product on body weight regulation in ob/ob mice. Science 269: 540-543. 33. Levin, N., Nelson, C., Gurney, A., Vandlen, R. & de Sauvage, F. (1996) Decreased food intake does not completely account for adiposity reduction after ob protein infusion. Proc Natl Acad Sci U S A 93: 1726-1730. 34. Shimabukuro, M., Zhou, Y. T., Levi, M. & Unger, R. H. (1998) Fatty acid-induced beta cell apoptosis: a link between obesity and diabetes. Proc Natl Acad Sci U S A 95: 2498-2502. 35. Zhou, Y. T., Grayburn, P., Karim, A., Shimabukuro, M., Higa, M., Baetens, D., Orci, L. & Unger, R. H. (2000) Lipotoxic heart disease in obese rats: implications for human obesity. Proc Natl Acad Sci U S A 97: 1784-1789. 36. Bray, G. A. (1997) Obesity and reproduction. Hum Reprod 12 Suppl 1: 26-32.

120
37. Fantuzzi, G. & Faggioni, R. (2000) Leptin in the regulation of immunity, inflammation, and hematopoiesis. J Leukoc Biol 68: 437-446. 38. Gainsford, T., Willson, T. A., Metcalf, D., Handman, E., McFarlane, C., Ng, A., Nicola, N. A., Alexander, W. S. & Hilton, D. J. (1996) Leptin can induce proliferation, differentiation, and functional activation of hemopoietic cells. Proc Natl Acad Sci U S A 93: 14564-14568. 39. Fleet, J. C. (2000) Leptin and bone: does the brain control bone biology? Nutr Rev 58: 209-211. 40. Picard, F., Richard, D., Huang, Q. & Deshaies, Y. (1998) Effects of leptin adipose tissue lipoprotein lipase in the obese ob/ob mouse. Int J Obes Relat Metab Disord 22: 1088-1095. 41. Campfield, L. A., Smith, F. J., Guisez, Y., Devos, R. & Burn, P. (1996) OB protein: A peripheral signal linking adiposity and central neural networks. Appetite 26: 302. 42. Fruhbeck, G., Aguado, M. & Martinez, J. A. (1997) In vitro lipolytic effect of leptin on mouse adipocytes: evidence for a possible autocrine/paracrine role of leptin. Biochem Biophys Res Commun 240: 590-594. 43. Fruhbeck, G., Aguado, M., Gomez-Ambrosi, J. & Martinez, J. A. (1998) Lipolytic effect of in vivo leptin administration on adipocytes of lean and ob/ob mice, but not db/db mice. Biochem Biophys Res Commun 250: 99-102. 44. Grisham, G. (1999) Biochemistry (2nd Edition). 45. Bai, Y., Zhang, S., Kim, K. S., Lee, J. K. & Kim, K. H. (1996) Obese gene expression alters the ability of 30A5 preadipocytes to respond to lipogenic hormones. J Biol Chem 271: 13939-13942. 46. Sarmiento, U., Benson, B., Kaufman, S., Ross, L., Qi, M., Scully, S. & DiPalma, C. (1997) Morphologic and molecular changes induced by recombinant human leptin in the white and brown adipose tissues of C57BL/6 mice. Lab Invest 77: 243-256. 47. Commins, S. P., Watson, P. M., Padgett, M. A., Dudley, A., Argyropoulos, G. & Gettys, T. W. (1999) Induction of uncoupling protein expression in brown and white adipose tissue by leptin. Endocrinology 140: 292-300. 48. Fruhbeck, G., Gomez-Ambrosi, J. & Salvador, J. (2001) Leptin-induced lipolysis opposes the tonic inhibition of endogenous adenosine in white adipocytes. Faseb J 15: 333-340.

121
49. Kerr, J. F., Wyllie, A. H. & Currie, A. R. (1972) Apoptosis: a basic biological phenomenon with wide-ranging implications in tissue kinetics. Br J Cancer 26: 239-257. 50. Schulte-Hermann, R., Bursch, W., Kraupp-Grasl, B., Oberhammer, F. & Wagner, A. (1992) Programmed cell death and its protective role with particular reference to apoptosis. Toxicol Lett 64-65 Spec No: 569-574. 51. Gastman, B. R. (2001) Apoptosis and its clinical impact. Head Neck 23: 409-425. 52. Alnemri, E. S., Livingston, D. J., Nicholson, D. W., Salvesen, G., Thornberry, N. A., Wong, W. W. & Yuan, J. (1996) Human ICE/CED-3 protease nomenclature. Cell 87: 171. 53. Domingo, P., Matias-Guiu, X., Pujol, R. M., Francia, E., Lagarda, E., Sambeat, M. A. & Vazquez, G. (1999) Subcutaneous adipocyte apoptosis in HIV-1 protease inhibitor-associated lipodystrophy. Aids 13: 2261-2267. 54. Geloen, A., Roy, P. E. & Bukowiecki, L. J. (1989) Regression of white adipose tissue in diabetic rats. Am J Physiol 257: E547-553. 55. Niesler, C. U., Siddle, K. & Prins, J. B. (1998) Human preadipocytes display a depot-specific susceptibility to apoptosis. Diabetes 47: 1365-1368. 56. Qian, H., Azain, M. J., Compton, M. M., Hartzell, D. L., Hausman, G. J. & Baile, C. A. (1998a) Brain administration of leptin causes deletion of adipocytes by apoptosis. Endocrinology 139: 791-794. 57. Della-Fera, M. A., Li, C. & Baile, C. A. (2003) Resistance to IP leptin-induced adipose apoptosis caused by high-fat diet in mice. Biochem Biophys Res Commun 303: 1053-1057. 58. Page, K. A., Hartzell, D. L., Li, C., Westby, A. L., Della-Fera, M. A., Azain, M. J., Pringle, T. D. & Baile, C. A. (2004) beta-Adrenergic receptor agonists increase apoptosis of adipose tissue in mice. Domest Anim Endocrinol 26: 23-31. 59. Gullicksen, P. S., Hausman, D. B., Dean, R. G., Hartzell, D. L. & Baile, C. A. (2003) Adipose tissue cellularity and apoptosis after intracerebroventricular injections of leptin and 21 days of recovery in rats. Int J Obes Relat Metab Disord 27: 302-312. 60. Duff, E., Li, C. L., Hartzell, D. L., Choi, Y. H., Della-Fera, M. A. & Baile, C. A. (2004) Ciliary neurotrophic factor injected icv induces adipose tissue apoptosis in rats. Apoptosis 9: 629-634.

122
61. Hargrave, K. M., Meyer, B. J., Li, C., Azain, M. J., Baile, C. A. & Miner, J. L. (2004) Influence of dietary conjugated linoleic Acid and fat source on body fat and apoptosis in mice. Obes Res 12: 1435-1444. 62. Kim, H. K., Nelson-Dooley, C., Della-Fera, M. A., Yang, J. Y., Zhang, W., Duan, J., Hartzell, D. L., Hamrick, M. W. & Baile, C. A. (2006) Genistein decreases food intake, body weight, and fat pad weight and causes adipose tissue apoptosis in ovariectomized female mice. J Nutr 136: 409-414. 63. Lin, J., Della-Fera, M. A. & Baile, C. A. (2005) Green tea polyphenol epigallocatechin gallate inhibits adipogenesis and induces apoptosis in 3T3-L1 adipocytes. Obes Res 13: 982-990. 64. Yang, J. Y., Della-Fera, M. A., Nelson-Dooley, C. & Baile, C. A. (2006) Molecular mechanisms of apoptosis induced by ajoene in 3T3-L1 adipocytes. Obesity (Silver Spring) 14: 388-397. 65. Yang, J. Y., Della-Fera, M. A. & Baile, C. A. (2006) Esculetin induces mitochondria-mediated apoptosis in 3T3-L1 adipocytes. Apoptosis 11: 1371-1378. 66. Kim, H. K., Della-Fera, M., Lin, J. & Baile, C. A. (2006) Docosahexaenoic acid inhibits adipocyte differentiation and induces apoptosis in 3T3-L1 preadipocytes. J Nutr 136: 2965-2969. 67. Qian, H., Hausman, G. J., Compton, M. M., Azain, M. J., Hartzell, D. L. & Baile, C. A. (1998b) Leptin regulation of peroxisome proliferator-activated receptor-gamma, tumor necrosis factor, and uncoupling protein-2 expression in adipose tissues. Biochem Biophys Res Commun 246: 660-667. 68. Anonymous (1998c) Down-regulation of CCAAT/enhancer binding proteins alpha, beta and delta in adipose tissue by intracerebroventricular leptin in rats. Biochim Biophys Acta 1442: 245-251. 69. Langer, R., Conn, H., Vacanti, J., Haudenschild, C. & Folkman, J. (1980) Control of tumor growth in animals by infusion of an angiogenesis inhibitor. Proc Natl Acad Sci U S A 77: 4331-4335. 70. Rak, J., Filmus, J. & Kerbel, R. S. (1996) Reciprocal paracrine interactions between tumour cells and endothelial cells: the 'angiogenesis progression' hypothesis. Eur J Cancer 32A: 2438-2450. 71. Silha, J. V., Krsek, M., Sucharda, P. & Murphy, L. J. (2005) Angiogenic factors are elevated in overweight and obese individuals. Int J Obes (Lond) 29: 1308-1314. 72. Cohen, B., Barkan, D., Levy, Y., Goldberg, I., Fridman, E., Kopolovic, J. & Rubinstein, M. (2001) Leptin induces angiopoietin-2 expression in adipose tissues. J Biol Chem 276: 7697-7700.

123
73. Ronti, T., Lupattelli, G. & Mannarino, E. (2006) The endocrine function of adipose tissue: an update. Clin Endocrinol (Oxf) 64: 355-365. 74. Trayhurn, P. & Beattie, J. H. (2001) Physiological role of adipose tissue: white adipose tissue as an endocrine and secretory organ. Proc Nutr Soc 60: 329-339. 75. Trayhurn, P. & Wood, I. S. (2004) Adipokines: inflammation and the pleiotropic role of white adipose tissue. Br J Nutr 92: 347-355. 76. Arita, Y., Kihara, S., Ouchi, N., Takahashi, M., Maeda, K., Miyagawa, J., Hotta, K., Shimomura, I., Nakamura, T. et al. (1999) Paradoxical decrease of an adipose-specific protein, adiponectin, in obesity. Biochem Biophys Res Commun 257: 79-83. 77. Liu, Y. M., Lacorte, J. M., Viguerie, N., Poitou, C., Pelloux, V., Guy-Grand, B., Coussieu, C., Langin, D., Basdevant, A. & Clement, K. (2003) Adiponectin gene expression in subcutaneous adipose tissue of obese women in response to short-term very low calorie diet and refeeding. J Clin Endocrinol Metab 88: 5881-5886. 78. Qi, Y., Takahashi, N., Hileman, S. M., Patel, H. R., Berg, A. H., Pajvani, U. B., Scherer, P. E. & Ahima, R. S. (2004) Adiponectin acts in the brain to decrease body weight. Nat Med 10: 524-529. 79. Yoon, M. J., Lee, G. Y., Chung, J. J., Ahn, Y. H., Hong, S. H. & Kim, J. B. (2006) Adiponectin increases fatty acid oxidation in skeletal muscle cells by sequential activation of AMP-activated protein kinase, p38 mitogen-activated protein kinase, and peroxisome proliferator-activated receptor alpha. Diabetes 55: 2562-2570. 80. Delporte, M. L., El Mkadem, S. A., Quisquater, M. & Brichard, S. M. (2004) Leptin treatment markedly increased plasma adiponectin but barely decreased plasma resistin of ob/ob mice. Am J Physiol Endocrinol Metab 287: E446-453. 81. Yamauchi, T., Kamon, J., Waki, H., Imai, Y., Shimozawa, N., Hioki, K., Uchida, S., Ito, Y., Takakuwa, K. et al. (2003) Globular adiponectin protected ob/ob mice from diabetes and ApoE-deficient mice from atherosclerosis. J Biol Chem 278: 2461-2468. 82. Bruun, J. M., Lihn, A. S., Verdich, C., Pedersen, S. B., Toubro, S., Astrup, A. & Richelsen, B. (2003) Regulation of adiponectin by adipose tissue-derived cytokines: in vivo and in vitro investigations in humans. Am J Physiol Endocrinol Metab 285: E527-533. 83. Steppan, C. M., Bailey, S. T., Bhat, S., Brown, E. J., Banerjee, R. R., Wright, C. M., Patel, H. R., Ahima, R. S. & Lazar, M. A. (2001) The hormone resistin links obesity to diabetes. Nature 409: 307-312.

124
84. Kim, K. H., Lee, K., Moon, Y. S. & Sul, H. S. (2001) A cysteine-rich adipose tissue-specific secretory factor inhibits adipocyte differentiation. J Biol Chem 276: 11252-11256. 85. Holcomb, I. N., Kabakoff, R. C., Chan, B., Baker, T. W., Gurney, A., Henzel, W., Nelson, C., Lowman, H. B., Wright, B. D. et al. (2000) FIZZ1, a novel cysteine-rich secreted protein associated with pulmonary inflammation, defines a new gene family. Embo J 19: 4046-4055. 86. Song, H., Shojima, N., Sakoda, H., Ogihara, T., Fujishiro, M., Katagiri, H., Anai, M., Onishi, Y., Ono, H. et al. (2002) Resistin is regulated by C/EBPs, PPARs, and signal-transducing molecules. Biochem Biophys Res Commun 299: 291-298. 87. Della-Fera, M. A., Qian, H. & Baile, C. A. (2001) Adipocyte apoptosis in the regulation of body fat mass by leptin. Diabetes Obes Metab 3: 299-310. 88. Gullicksen, P. S., Flatt, W. P., Dean, R. G., Hartzell, D. L. & Baile, C. A. (2002) Energy metabolism and expression of uncoupling proteins 1, 2, and 3 after 21 days of recovery from intracerebroventricular mouse leptin in rats. Physiol Behav 75: 473-482. 89. Fruhbeck, G., Gomez-Ambrosi, J. & Martinez, J. A. (1999) Pre- and postprandial expression of the leptin receptor splice variants OB-Ra and OB-Rb in murine peripheral tissues. Physiol Res 48: 189-195. 90. Hamrick, M. W., Della-Fera, M. A., Choi, Y. H., Pennington, C., Hartzell, D. & Baile, C. A. (2005) Leptin treatment induces loss of bone marrow adipocytes and increases bone formation in leptin-deficient ob/ob mice. J Bone Miner Res 20: 994-1001. 91. Duan J, Y.-H. C., DL Hartzell, M.A. Della-Fera, M.W. Hamrick, C.A.Baile Obesity Research (Accepted). 92. Della-Fera MA, Duan J, Choi YH, Hartzell DL, Barb CR, Hamrick MW & CA, B. (2005 Neuroscience meeting, Washington DC.) Hypothalamic gene expression in leptin-treated lean and ob/ob 93. Arora, S. & Anubhuti (2006) Role of neuropeptides in appetite regulation and obesity--a review. Neuropeptides 40: 375-401. 94. Howard, J. K. & Flier, J. S. (2006) Attenuation of leptin and insulin signaling by SOCS proteins. Trends Endocrinol Metab 17: 365-371. 95. Yuan, J. S., Reed, A., Chen, F. & Stewart, C. N., Jr. (2006) Statistical analysis of real-time PCR data. BMC Bioinformatics 7: 85.
125
96. Wikepedia http://en.wikipedia.org/wiki/Winsorized_mean. 97. Shi, T., Wang, F., Stieren, E. & Tong, Q. (2005) SIRT3, a mitochondrial sirtuin deacetylase, regulates mitochondrial function and thermogenesis in brown adipocytes. J Biol Chem 280: 13560-13567. 98. Hwa, J. J., Ghibaudi, L., Compton, D., Fawzi, A. B. & Strader, C. D. (1996) Intracerebroventricular injection of leptin increases thermogenesis and mobilizes fat metabolism in ob/ob mice. Horm Metab Res 28: 659-663. 99. Jezek, P., Hanus, J., Semrad, C. & Garlid, K. D. (1996) Photoactivated azido fatty acid irreversibly inhibits anion and proton transport through the mitochondrial uncoupling protein. J Biol Chem 271: 6199-6205. 100. Zhou, Y. T., Shimabukuro, M., Koyama, K., Lee, Y., Wang, M. Y., Trieu, F., Newgard, C. B. & Unger, R. H. (1997) Induction by leptin of uncoupling protein-2 and enzymes of fatty acid oxidation. Proc Natl Acad Sci U S A 94: 6386-6390. 101. Gong, D. W., He, Y., Karas, M. & Reitman, M. (1997) Uncoupling protein-3 is a mediator of thermogenesis regulated by thyroid hormone, beta3-adrenergic agonists, and leptin. J Biol Chem 272: 24129-24132. 102. Fleury, C., Neverova, M., Collins, S., Raimbault, S., Champigny, O., Levi-Meyrueis, C., Bouillaud, F., Seldin, M. F., Surwit, R. S. et al. (1997) Uncoupling protein-2: a novel gene linked to obesity and hyperinsulinemia. Nat Genet 15: 269-272. 103. Zhao, J., Cannon, B. & Nedergaard, J. (1998) Thermogenesis is beta3- but not beta1-adrenergically mediated in rat brown fat cells, even after cold acclimation. Am J Physiol 275: R2002-2011. 104. Commins, S. P., Watson, P. M., Levin, N., Beiler, R. J. & Gettys, T. W. (2000) Central leptin regulates the UCP1 and ob genes in brown and white adipose tissue via different beta-adrenoceptor subtypes. J Biol Chem 275: 33059-33067. 105. Mantzoros, C. S., Qu, D., Frederich, R. C., Susulic, V. S., Lowell, B. B., Maratos-Flier, E. & Flier, J. S. (1996) Activation of beta(3) adrenergic receptors suppresses leptin expression and mediates a leptin-independent inhibition of food intake in mice. Diabetes 45: 909-914. 106. Hales, K. G. & Fuller, M. T. (1997) Developmentally regulated mitochondrial fusion mediated by a conserved, novel, predicted GTPase. Cell 90: 121-129.

126
107. Hermann, G. J., Thatcher, J. W., Mills, J. P., Hales, K. G., Fuller, M. T., Nunnari, J. & Shaw, J. M. (1998) Mitochondrial fusion in yeast requires the transmembrane GTPase Fzo1p. J Cell Biol 143: 359-373. 108. Mingrone, G., Manco, M., Calvani, M., Castagneto, M., Naon, D. & Zorzano, A. (2005) Could the low level of expression of the gene encoding skeletal muscle mitofusin-2 account for the metabolic inflexibility of obesity? Diabetologia 48: 2108-2114. 109. Karbowski, M., Lee, Y. J., Gaume, B., Jeong, S. Y., Frank, S., Nechushtan, A., Santel, A., Fuller, M., Smith, C. L. & Youle, R. J. (2002) Spatial and temporal association of Bax with mitochondrial fission sites, Drp1, and Mfn2 during apoptosis. J Cell Biol 159: 931-938. 110. Delivani, P. & Martin, S. J. (2006) Mitochondrial membrane remodeling in apoptosis: an inside story. Cell Death Differ 13: 2007-2010. 111. Siegrist-Kaiser, C. A., Pauli, V., Juge-Aubry, C. E., Boss, O., Pernin, A., Chin, W. W., Cusin, I., Rohner-Jeanrenaud, F., Burger, A. G. et al. (1997) Direct effects of leptin on brown and white adipose tissue. J Clin Invest 100: 2858-2864. 112. Miyazaki, M., Gomez, F. E. & Ntambi, J. M. (2002) Lack of stearoyl-CoA desaturase-1 function induces a palmitoyl-CoA Delta6 desaturase and represses the stearoyl-CoA desaturase-3 gene in the preputial glands of the mouse. J Lipid Res 43: 2146-2154. 113. Rahman, S. M., Dobrzyn, A., Dobrzyn, P., Lee, S. H., Miyazaki, M. & Ntambi, J. M. (2003) Stearoyl-CoA desaturase 1 deficiency elevates insulin-signaling components and down-regulates protein-tyrosine phosphatase 1B in muscle. Proc Natl Acad Sci U S A 100: 11110-11115. 114. Cohen, P., Miyazaki, M., Socci, N. D., Hagge-Greenberg, A., Liedtke, W., Soukas, A. A., Sharma, R., Hudgins, L. C., Ntambi, J. M. & Friedman, J. M. (2002) Role for stearoyl-CoA desaturase-1 in leptin-mediated weight loss. Science 297: 240-243. 115. Dobrzyn, P., Dobrzyn, A., Miyazaki, M., Cohen, P., Asilmaz, E., Hardie, D. G., Friedman, J. M. & Ntambi, J. M. (2004) Stearoyl-CoA desaturase 1 deficiency increases fatty acid oxidation by activating AMP-activated protein kinase in liver. Proc Natl Acad Sci U S A 101: 6409-6414. 116. Griffin, M. J. & Sul, H. S. (2004) Insulin regulation of fatty acid synthase gene transcription: roles of USF and SREBP-1c. IUBMB Life 56: 595-600. 117. Yang, Q., Graham, T. E., Mody, N., Preitner, F., Peroni, O. D., Zabolotny, J. M., Kotani, K., Quadro, L. & Kahn, B. B. (2005) Serum retinol binding protein 4 contributes to insulin resistance in obesity and type 2 diabetes. Nature 436: 356-362.

127
118. Graham, T. E., Yang, Q., Bluher, M., Hammarstedt, A., Ciaraldi, T. P., Henry, R. R., Wason, C. J., Oberbach, A., Jansson, P. A. et al. (2006) Retinol-binding protein 4 and insulin resistance in lean, obese, and diabetic subjects. N Engl J Med 354: 2552-2563. 119. Azain, M. J., Wang, T., Hulsey, M. G., Qian, H., Hartzell, D. L. & Baile, C. A. (1999) Effects of intracerebroventricularly administered leptin on protein selection in the rat. Physiol Behav 66: 537-541. 120. Hengartner, M. O. (2000) The biochemistry of apoptosis. Nature 407: 770-776. 121. Green, D. R. & Reed, J. C. (1998) Mitochondria and apoptosis. Science 281: 1309-1312. 122. Briscini, L., Tonello, C., Dioni, L., Carruba, M. O. & Nisoli, E. (1998) Bcl-2 and Bax are involved in the sympathetic protection of brown adipocytes from obesity-linked apoptosis. FEBS Lett 431: 80-84. 123. Kuribayashi, K., Mayes, P. A. & El-Deiry, W. S. (2006) What are caspases 3 and 7 doing upstream of the mitochondria? Cancer Biol Ther 5: 763-765. 124. Qian, H., Hausman, D. B., Compton, M. M., Martin, R. J., Della-Fera, M. A., Hartzell, D. L. & Baile, C. A. (2001) TNFalpha induces and insulin inhibits caspase 3-dependent adipocyte apoptosis. Biochem Biophys Res Commun 284: 1176-1183. 125. Navarro, P., Valverde, A. M., Conejo, R., Benito, M. & Lorenzo, M. (1999) Inhibition of caspases rescues brown adipocytes from apoptosis downregulating BCL-XS and upregulating BCL-2 gene expression. Exp Cell Res 246: 301-307. 126. Walder, K., Filippis, A., Clark, S., Zimmet, P. & Collier, G. R. (1997) Leptin inhibits insulin binding in isolated rat adipocytes. J Endocrinol 155: R5-7. 127. Collier, G. R., De Silva, A., Sanigorski, A., Walder, K., Yamamoto, A. & Zimmet, P. (1997) Development of obesity and insulin resistance in the Israeli sand rat (Psammomys obesus). Does leptin play a role? Ann N Y Acad Sci 827: 50-63. 128. Muoio, D. M., Dohm, G. L., Fiedorek, F. T., Jr., Tapscott, E. B. & Coleman, R. A. (1997) Leptin directly alters lipid partitioning in skeletal muscle. Diabetes 46: 1360-1363. 129. Qian, H., Hausman, G. J., Compton, M. M., Azain, M. J., Hartzell, D. L. & Baile, C. A. (1998c) Leptin regulation of peroxisome proliferator-activated receptor-gamma, tumor necrosis factor, and uncoupling protein-2 expression in adipose tissues. Biochem Biophys Res Commun 246: 660-667.

128
130. Gray, S. L., Nora, E. D., Grosse, J., Manieri, M., Stoeger, T., Medina-Gomez, G., Burling, K., Wattler, S., Russ, A. et al. (2006) Leptin deficiency unmasks the deleterious effects of impaired peroxisome proliferator-activated receptor gamma function (P465L PPARgamma) in mice. Diabetes 55: 2669-2677. 131. Suzuki, A., Okamoto, S., Lee, S., Saito, K., Shiuchi, T. & Minokoshi, Y. (2007) Leptin stimulates fatty acid oxidation and PPAR{alpha} gene expression in mouse C2C12 myoblasts by changing the subcellular localization of the {alpha}2 form of AMP-activated protein kinase. Mol Cell Biol. 132. Guerre-Millo, M., Rouault, C., Poulain, P., Andre, J., Poitout, V., Peters, J. M., Gonzalez, F. J., Fruchart, J. C., Reach, G. & Staels, B. (2001) PPAR-alpha-null mice are protected from high-fat diet-induced insulin resistance. Diabetes 50: 2809-2814. 133. Hwang, C. S., Mandrup, S., MacDougald, O. A., Geiman, D. E. & Lane, M. D. (1996) Transcriptional activation of the mouse obese (ob) gene by CCAAT/enhancer binding protein alpha. Proc Natl Acad Sci U S A 93: 873-877. 134. Qian, H., Hausman, G. J., Compton, M. M., Azain, M. J., Hartzell, D. L. & Baile, C. A. (1998) Down-regulation of CCAAT/enhancer binding proteins alpha, beta and delta in adipose tissue by intracerebroventricular leptin in rats. Biochim Biophys Acta 1442: 245-251. 135. Sloop, K. W., Surface, P. L., Heiman, M. L. & Slieker, L. J. (1998) Changes in leptin expression are not associated with corresponding changes in CCAAT/enhancer binding protein-alpha. Biochem Biophys Res Commun 251: 142-147. 136. Kim, J. B. & Spiegelman, B. M. (1996) ADD1/SREBP1 promotes adipocyte differentiation and gene expression linked to fatty acid metabolism. Genes Dev 10: 1096-1107. 137. Kim, J. B., Sarraf, P., Wright, M., Yao, K. M., Mueller, E., Solanes, G., Lowell, B. B. & Spiegelman, B. M. (1998) Nutritional and insulin regulation of fatty acid synthetase and leptin gene expression through ADD1/SREBP1. J Clin Invest 101: 1-9. 138. Soukas, A., Cohen, P., Socci, N. D. & Friedman, J. M. (2000) Leptin-specific patterns of gene expression in white adipose tissue. Genes Dev 14: 963-980. 139. Yahagi, N., Shimano, H., Hasty, A. H., Matsuzaka, T., Ide, T., Yoshikawa, T., Amemiya-Kudo, M., Tomita, S., Okazaki, H. et al. (2002) Absence of sterol regulatory element-binding protein-1 (SREBP-1) ameliorates fatty livers but not obesity or insulin resistance in Lep(ob)/Lep(ob) mice. J Biol Chem 277: 19353-19357. 140. Jequier, E. (2002) Leptin signaling, adiposity, and energy balance. Ann N Y Acad Sci 967: 379-388.
129
141. Fawcett, R. L., Waechter, A. S., Williams, L. B., Zhang, P., Louie, R., Jones, R., Inman, M., Huse, J. & Considine, R. V. (2000) Tumor necrosis factor-alpha inhibits leptin production in subcutaneous and omental adipocytes from morbidly obese humans. J Clin Endocrinol Metab 85: 530-535. 142. Ueno, N., Dube, M. G., Inui, A., Kalra, P. S. & Kalra, S. P. (2004) Leptin modulates orexigenic effects of ghrelin and attenuates adiponectin and insulin levels and selectively the dark-phase feeding as revealed by central leptin gene therapy. Endocrinology 145: 4176-4184. 143. Mahony, S. M., Beck, S. A. & Tisdale, M. J. (1988) Comparison of weight loss induced by recombinant tumour necrosis factor with that produced by a cachexia-inducing tumour. Br J Cancer 57: 385-389. 144. Prins, J. B., Niesler, C. U., Winterford, C. M., Bright, N. A., Siddle, K., O'Rahilly, S., Walker, N. I. & Cameron, D. P. (1997) Tumor necrosis factor-alpha induces apoptosis of human adipose cells. Diabetes 46: 1939-1944. 145. Semb, H., Peterson, J., Tavernier, J. & Olivecrona, T. (1987) Multiple effects of tumor necrosis factor on lipoprotein lipase in vivo. J Biol Chem 262: 8390-8394. 146. Zhang, Y., Matheny, M., Zolotukhin, S., Tumer, N. & Scarpace, P. J. (2002) Regulation of adiponectin and leptin gene expression in white and brown adipose tissues: influence of beta3-adrenergic agonists, retinoic acid, leptin and fasting. Biochim Biophys Acta 1584: 115-122. 147. Delporte, M. L., Brichard, S. M., Hermans, M. P., Beguin, C. & Lambert, M. (2003) Hyperadiponectinaemia in anorexia nervosa. Clin Endocrinol (Oxf) 58: 22-29. 148. Alper, C. A., Johnson, A. M., Birtch, A. G. & Moore, F. D. (1969) Human C'3: evidence for the liver as the primary site of synthesis. Science 163: 286-288. 149. Cianflone, K. & Maslowska, M. (1995) Differentiation-induced production of ASP in human adipocytes. Eur J Clin Invest 25: 817-825. 150. Murray, I., Sniderman, A. D., Havel, P. J. & Cianflone, K. (1999) Acylation stimulating protein (ASP) deficiency alters postprandial and adipose tissue metabolism in male mice. J Biol Chem 274: 36219-36225. 151. Xia, Z., Stanhope, K. L., Digitale, E., Simion, O. M., Chen, L., Havel, P. & Cianflone, K. (2004) Acylation-stimulating protein (ASP)/complement C3adesArg deficiency results in increased energy expenditure in mice. J Biol Chem 279: 4051-4057.

130
152. Xia, Z., Sniderman, A. D. & Cianflone, K. (2002) Acylation-stimulating protein (ASP) deficiency induces obesity resistance and increased energy expenditure in ob/ob mice. J Biol Chem 277: 45874-45879. 153. Messiha, N. & Watson, R. R. (1989) The effects on complement component 3 of dietary variation of protein, fat and vitamin E during growth of young mice. Life Sci 44: 49-55. 154. Julen, N., Davrinche, C., Ozanne, D., Lebreton, J. P., Fontaine, M., Ripoche, J. & Daveau, M. (1992) Differential modulation of complement factor H and C3 expression by TNF-alpha in the rat. In vitro and in vivo studies. Mol Immunol 29: 983-988. 155. Boggs, R. D., McCumbee, W. D., Cobbs, S. L., Todd, D. G., Kahle, E. B., Stewart, N. L., Bailey, M. & Reichenbecher, V. E. (1998) Increased expression of complement component C3 in the plasma of obese Zucker fa and LA/N fa(f) rats compared with their lean counterparts. Obes Res 6: 361-367. 156. Sierra-Honigmann, M. R., Nath, A. K., Murakami, C., Garcia-Cardena, G., Papapetropoulos, A., Sessa, W. C., Madge, L. A., Schechner, J. S., Schwabb, M. B. et al. (1998) Biological action of leptin as an angiogenic factor. Science 281: 1683-1686. 157. Dallabrida, S. M., Zurakowski, D., Shih, S. C., Smith, L. E., Folkman, J., Moulton, K. S. & Rupnick, M. A. (2003) Adipose tissue growth and regression are regulated by angiopoietin-1. Biochem Biophys Res Commun 311: 563-571. 158. Graves, P. R. & Haystead, T. A. (2002) Molecular biologist's guide to proteomics. Microbiol Mol Biol Rev 66: 39-63; table of contents. 159. Gorg, A., Postel, W. & Gunther, S. (1988) The current state of two-dimensional electrophoresis with immobilized pH gradients. Electrophoresis 9: 531-546. 160. Wildgruber, R., Harder, A., Obermaier, C., Boguth, G., Weiss, W., Fey, S. J., Larsen, P. M. & Gorg, A. (2000) Towards higher resolution: two-dimensional electrophoresis of Saccharomyces cerevisiae proteins using overlapping narrow immobilized pH gradients. Electrophoresis 21: 2610-2616. 161. Zuo, X. & Speicher, D. W. (2000) A method for global analysis of complex proteomes using sample prefractionation by solution isoelectrofocusing prior to two-dimensional electrophoresis. Anal Biochem 284: 266-278. 162. Guerre-Millo, M. (2004) Adipose tissue and adipokines: for better or worse. Diabetes Metab 30: 13-19.

131
163. Bradford, M. M. (1976) A rapid and sensitive method for the quantitation of microgram quantities of protein utilizing the principle of protein-dye binding. Anal Biochem 72: 248-254. 164. Sanchez, J. C., Chiappe, D., Converset, V., Hoogland, C., Binz, P. A., Paesano, S., Appel, R. D., Wang, S., Sennitt, M. et al. (2001) The mouse SWISS-2D PAGE database: a tool for proteomics study of diabetes and obesity. Proteomics 1: 136-163. 165. Rabilloud, T. (1998) Use of thiourea to increase the solubility of membrane proteins in two-dimensional electrophoresis. Electrophoresis 19: 758-760. 166. Rabilloud, T., Adessi, C., Giraudel, A. & Lunardi, J. (1997) Improvement of the solubilization of proteins in two-dimensional electrophoresis with immobilized pH gradients. Electrophoresis 18: 307-316. 167. Lanne, B., Potthast, F., Hoglund, A., Brockenhuus von Lowenhielm, H., Nystrom, A. C., Nilsson, F. & Dahllof, B. (2001) Thiourea enhances mapping of the proteome from murine white adipose tissue. Proteomics 1: 819-828. 168. Rabilloud, T. (1996) Solubilization of proteins for electrophoretic analyses. Electrophoresis 17: 813-829. 169. Pasquali, C., Fialka, I. & Huber, L. A. (1997) Preparative two-dimensional gel electrophoresis of membrane proteins. Electrophoresis 18: 2573-2581. 170. Fialka, I., Pasquali, C., Lottspeich, F., Ahorn, H. & Huber, L. A. (1997) Subcellular fractionation of polarized epithelial cells and identification of organelle-specific proteins by two-dimensional gel electrophoresis. Electrophoresis 18: 2582-2590. 171. Corton, M., Villuendas, G., Botella, J. I., San Millan, J. L., Escobar-Morreale, H. F. & Peral, B. (2004) Improved resolution of the human adipose tissue proteome at alkaline and wide range pH by the addition of hydroxyethyl disulfide. Proteomics 4: 438-441. 172. Chevallet, M., Santoni, V., Poinas, A., Rouquie, D., Fuchs, A., Kieffer, S., Rossignol, M., Lunardi, J., Garin, J. & Rabilloud, T. (1998) New zwitterionic detergents improve the analysis of membrane proteins by two-dimensional electrophoresis. Electrophoresis 19: 1901-1909. 173. Olsson, I., Larsson, K., Palmgren, R. & Bjellqvist, B. (2002) Organic disulfides as a means to generate streak-free two-dimensional maps with narrow range basic immobilized pH gradient strips as first dimension. Proteomics 2: 1630-1632.

132
174. Kawai, J., Shinagawa, A., Shibata, K., Yoshino, M., Itoh, M., Ishii, Y., Arakawa, T., Hara, A., Fukunishi, Y. et al. (2001) Functional annotation of a full-length mouse cDNA collection. Nature 409: 685-690. 175. Blake, J. A., Eppig, J. T., Richardson, J. E. & Davisson, M. T. (2000) The Mouse Genome Database (MGD): expanding genetic and genomic resources for the laboratory mouse. The Mouse Genome Database Group. Nucleic Acids Res 28: 108-111. 176. Service, R. F. (2001) Nobel prize in chemistry. Chemists hear one hand clapping. Science 294: 503-505. 177. Santoni, V., Molloy, M. & Rabilloud, T. (2000) Membrane proteins and proteomics: un amour impossible? Electrophoresis 21: 1054-1070. 178. Wu, C. C. & MacCoss, M. J. (2002) Shotgun proteomics: tools for the analysis of complex biological systems. Curr Opin Mol Ther 4: 242-250. 179. Gygi, S. P., Rist, B., Gerber, S. A., Turecek, F., Gelb, M. H. & Aebersold, R. (1999) Quantitative analysis of complex protein mixtures using isotope-coded affinity tags. Nat Biotechnol 17: 994-999. 180. Qian, H., Hausman, G. J., Compton, M. M., Azain, M. J., Hartzell, D. L. & Baile, C. A. (1998) Leptin regulation of peroxisome proliferator-activated receptor-gamma, tumor necrosis factor, and uncoupling protein-2 expression in adipose tissues. Biochem Biophys Res Commun 246: 660-667. 181. Sanchez, J. C., Converset, V., Nolan, A., Schmid, G., Wang, S., Heller, M., Sennitt, M. V., Hochstrasser, D. F. & Cawthorne, M. A. (2002) Effect of rosiglitazone on the differential expression of diabetes-associated proteins in pancreatic islets of C57Bl/6 lep/lep mice. Mol Cell Proteomics 1: 509-516. 182. Edvardsson, U., Alexandersson, M., Brockenhuus von Lowenhielm, H., Nystrom, A. C., Ljung, B., Nilsson, F. & Dahllof, B. (1999) A proteome analysis of livers from obese (ob/ob) mice treated with the peroxisome proliferator WY14,643. Electrophoresis 20: 935-942. 183. Tonge, R., Shaw, J., Middleton, B., Rowlinson, R., Rayner, S., Young, J., Pognan, F., Hawkins, E., Currie, I. & Davison, M. (2001) Validation and development of fluorescence two-dimensional differential gel electrophoresis proteomics technology. Proteomics 1: 377-396. 184. Trombetta, E. S. & Parodi, A. J. (2003) Quality control and protein folding in the secretory pathway. Annu Rev Cell Dev Biol 19: 649-676.

133
185. Corbett, E. F., Oikawa, K., Francois, P., Tessier, D. C., Kay, C., Bergeron, J. J., Thomas, D. Y., Krause, K. H. & Michalak, M. (1999) Ca2+ regulation of interactions between endoplasmic reticulum chaperones. J Biol Chem 274: 6203-6211. 186. Nakamura, K., Bossy-Wetzel, E., Burns, K., Fadel, M. P., Lozyk, M., Goping, I. S., Opas, M., Bleackley, R. C., Green, D. R. & Michalak, M. (2000) Changes in endoplasmic reticulum luminal environment affect cell sensitivity to apoptosis. J Cell Biol 150: 731-740. 187. Arnaudeau, S., Frieden, M., Nakamura, K., Castelbou, C., Michalak, M. & Demaurex, N. (2002) Calreticulin differentially modulates calcium uptake and release in the endoplasmic reticulum and mitochondria. J Biol Chem 277: 46696-46705. 188. Kageyama, K., Ihara, Y., Goto, S., Urata, Y., Toda, G., Yano, K. & Kondo, T. (2002) Overexpression of calreticulin modulates protein kinase B/Akt signaling to promote apoptosis during cardiac differentiation of cardiomyoblast H9c2 cells. J Biol Chem 277: 19255-19264. 189. Nomura, Y. (2004) Neuronal apoptosis and protection: effects of nitric oxide and endoplasmic reticulum-related proteins. Biol Pharm Bull 27: 961-963. 190. Prasad, S. C., Soldatenkov, V. A., Kuettel, M. R., Thraves, P. J., Zou, X. & Dritschilo, A. (1999) Protein changes associated with ionizing radiation-induced apoptosis in human prostate epithelial tumor cells. Electrophoresis 20: 1065-1074. 191. Margittai, E., Banhegyi, G., Kiss, A., Nagy, G., Mandl, J., Schaff, Z. & Csala, M. (2005) Scurvy leads to endoplasmic reticulum stress and apoptosis in the liver of Guinea pigs. J Nutr 135: 2530-2534. 192. Szabadkai, G. & Rizzuto, R. (2004) Participation of endoplasmic reticulum and mitochondrial calcium handling in apoptosis: more than just neighborhood? FEBS Lett 567: 111-115. 193. Mesaeli, N. & Phillipson, C. (2004) Impaired p53 expression, function, and nuclear localization in calreticulin-deficient cells. Mol Biol Cell 15: 1862-1870. 194. Nijtmans, L. G., Artal, S. M., Grivell, L. A. & Coates, P. J. (2002) The mitochondrial PHB complex: roles in mitochondrial respiratory complex assembly, ageing and degenerative disease. Cell Mol Life Sci 59: 143-155. 195. Kolonin, M. G., Saha, P. K., Chan, L., Pasqualini, R. & Arap, W. (2004) Reversal of obesity by targeted ablation of adipose tissue. Nat Med 10: 625-632.

134
196. Vessal, M., Mishra, S., Moulik, S. & Murphy, L. J. (2006) Prohibitin attenuates insulin-stimulated glucose and fatty acid oxidation in adipose tissue by inhibition of pyruvate carboxylase. Febs J 273: 568-576. 197. Mackall, J. C. & Lane, M. D. (1977) Role of pyruvate carboxylase in fatty acid synthesis: alterations during preadipocyte differentiation. Biochem Biophys Res Commun 79: 720-725. 198. Zhou, Y., Kok, K. H., Chun, A. C., Wong, C. M., Wu, H. W., Lin, M. C., Fung, P. C., Kung, H. & Jin, D. Y. (2000) Mouse peroxiredoxin V is a thioredoxin peroxidase that inhibits p53-induced apoptosis. Biochem Biophys Res Commun 268: 921-927. 199. Kim, H., Lee, T. H., Park, E. S., Suh, J. M., Park, S. J., Chung, H. K., Kwon, O. Y., Kim, Y. K., Ro, H. K. & Shong, M. (2000) Role of peroxiredoxins in regulating intracellular hydrogen peroxide and hydrogen peroxide-induced apoptosis in thyroid cells. J Biol Chem 275: 18266-18270. 200. Park, S. H., Chung, Y. M., Lee, Y. S., Kim, H. J., Kim, J. S., Chae, H. Z. & Yoo, Y. D. (2000) Antisense of human peroxiredoxin II enhances radiation-induced cell death. Clin Cancer Res 6: 4915-4920. 201. Boldogh, I. R. & Pon, L. A. (2006) Interactions of mitochondria with the actin cytoskeleton. Biochim Biophys Acta 1763: 450-462. 202. Gourlay, C. W. & Ayscough, K. R. (2005) A role for actin in aging and apoptosis. Biochem Soc Trans 33: 1260-1264. 203. Bremer, A. & Aebi, U. (1992) The structure of the F-actin filament and the actin molecule. Curr Opin Cell Biol 4: 20-26. 204. Odaka, C., Sanders, M. L. & Crews, P. (2000) Jasplakinolide induces apoptosis in various transformed cell lines by a caspase-3-like protease-dependent pathway. Clin Diagn Lab Immunol 7: 947-952. 205. Posey, S. C. & Bierer, B. E. (1999) Actin stabilization by jasplakinolide enhances apoptosis induced by cytokine deprivation. J Biol Chem 274: 4259-4265. 206. Yamazaki, Y., Tsuruga, M., Zhou, D., Fujita, Y., Shang, X., Dang, Y., Kawasaki, K. & Oka, S. (2000) Cytoskeletal disruption accelerates caspase-3 activation and alters the intracellular membrane reorganization in DNA damage-induced apoptosis. Exp Cell Res 259: 64-78.

135
207. Sun, H. Q., Yamamoto, M., Mejillano, M. & Yin, H. L. (1999) Gelsolin, a multifunctional actin regulatory protein. J Biol Chem 274: 33179-33182. 208. Koya, R. C., Fujita, H., Shimizu, S., Ohtsu, M., Takimoto, M., Tsujimoto, Y. & Kuzumaki, N. (2000) Gelsolin inhibits apoptosis by blocking mitochondrial membrane potential loss and cytochrome c release. J Biol Chem 275: 15343-15349. 209. Spiegelman, B. M. & Farmer, S. R. (1982) Decreases in tubulin and actin gene expression prior to morphological differentiation of 3T3 adipocytes. Cell 29: 53-60. 210. Barcelo-Batllori, S., Corominola, H., Claret, M., Canals, I., Guinovart, J. & Gomis, R. (2005) Target identification of the novel antiobesity agent tungstate in adipose tissue from obese rats. Proteomics 5: 4927-4935. 211. Rieske, J. S. (1976) Composition, structure, and function of complex III of the respiratory chain. Biochim Biophys Acta 456: 195-247. 212. Trumpower, B. L. & Edwards, C. A. (1979) Purification of a reconstitutively active iron-sulfur protein (oxidation factor) from succinate . cytochrome c reductase complex of bovine heart mitochondria. J Biol Chem 254: 8697-8706. 213. Jansa, P. & Grummt, I. (1999) Mechanism of transcription termination: PTRF interacts with the largest subunit of RNA polymerase I and dissociates paused transcription complexes from yeast and mouse. Mol Gen Genet 262: 508-514. 214. Aboulaich, N., Vainonen, J. P., Stralfors, P. & Vener, A. V. (2004) Vectorial proteomics reveal targeting, phosphorylation and specific fragmentation of polymerase I and transcript release factor (PTRF) at the surface of caveolae in human adipocytes. Biochem J 383: 237-248. 215. Aboulaich, N., Ortegren, U., Vener, A. V. & Stralfors, P. (2006) Association and insulin regulated translocation of hormone-sensitive lipase with PTRF. Biochem Biophys Res Commun 350: 657-661. 216. Mertens, I., Considine, R. V., Van der Planken, M. & Van Gaal, L. F. (2006) Hemostasis and fibrinolysis in non-diabetic overweight and obese men and women. Is there still a role for leptin? Eur J Endocrinol 155: 477-484. 217. Soderberg, S., Olsson, T., Eliasson, M., Johnson, O. & Ahren, B. (1999) Plasma leptin levels are associated with abnormal fibrinolysis in men and postmenopausal women. J Intern Med 245: 533-543.

136
218. Wannamethee, S. G., Tchernova, J., Whincup, P., Lowe, G. D., Kelly, A., Rumley, A., Wallace, A. M. & Sattar, N. (2007) Plasma leptin: associations with metabolic, inflammatory and haemostatic risk factors for cardiovascular disease. Atherosclerosis 191: 418-426. 219. Simpons, R. J. (2001) Proteins and Proteomics. 220. Hegde, P. S., White, I. R. & Debouck, C. (2003) Interplay of transcriptomics and proteomics. Curr Opin Biotechnol 14: 647-651. 221. Parker, R. M. & Barnes, N. M. (1999) mRNA: detection by in Situ and northern hybridization. Methods Mol Biol 106: 247-283. 222. Hod, Y. (1992) A simplified ribonuclease protection assay. Biotechniques 13: 852-854. 223. Weis, J. H., Tan, S. S., Martin, B. K. & Wittwer, C. T. (1992) Detection of rare mRNAs via quantitative RT-PCR. Trends Genet 8: 263-264. 224. Bucher, P. (1999) Regulatory elements and expression profiles. Curr Opin Struct Biol 9: 400-407. 225. Higuchi, R., Fockler, C., Dollinger, G. & Watson, R. (1993) Kinetic PCR analysis: real-time monitoring of DNA amplification reactions. Biotechnology (N Y) 11: 1026-1030. 226. Orlando, C., Pinzani, P. & Pazzagli, M. (1998) Developments in quantitative PCR. Clin Chem Lab Med 36: 255-269. 227. Palmer, S., Wiegand, A. P., Maldarelli, F., Bazmi, H., Mican, J. M., Polis, M., Dewar, R. L., Planta, A., Liu, S. et al. (2003) New real-time reverse transcriptase-initiated PCR assay with single-copy sensitivity for human immunodeficiency virus type 1 RNA in plasma. J Clin Microbiol 41: 4531-4536. 228. Schmittgen, T. D., Zakrajsek, B. A., Mills, A. G., Gorn, V., Singer, M. J. & Reed, M. W. (2000) Quantitative reverse transcription-polymerase chain reaction to study mRNA decay: comparison of endpoint and real-time methods. Anal Biochem 285: 194-204. 229. Morrison, T. B., Weis, J. J. & Wittwer, C. T. (1998) Quantification of low-copy transcripts by continuous SYBR Green I monitoring during amplification. Biotechniques 24: 954-958, 960, 962. 230. Wong, M. L. & Medrano, J. F. (2005) Real-time PCR for mRNA quantitation. Biotechniques 39: 75-85.
137
231. Bustin, S. A., Benes, V., Nolan, T. & Pfaffl, M. W. (2005) Quantitative real-time RT-PCR--a perspective. J Mol Endocrinol 34: 597-601. 232. Ginzinger, D. G. (2002) Gene quantification using real-time quantitative PCR: an emerging technology hits the mainstream. Exp Hematol 30: 503-512. 233. Saiki, R. K., Scharf, S., Faloona, F., Mullis, K. B., Horn, G. T., Erlich, H. A. & Arnheim, N. (1985) Enzymatic amplification of beta-globin genomic sequences and restriction site analysis for diagnosis of sickle cell anemia. Science 230: 1350-1354. 234. Lee, T. H., Kim, S. U., Yu, S. L., Kim, S. H., Park, D. S., Moon, H. B., Dho, S. H., Kwon, K. S., Kwon, H. J. et al. (2003) Peroxiredoxin II is essential for sustaining life span of erythrocytes in mice. Blood 101: 5033-5038. 235. Livak, K. J. & Schmittgen, T. D. (2001) Analysis of relative gene expression data using real-time quantitative PCR and the 2(-Delta Delta C(T)) Method. Methods 25: 402-408. 236. Mullis, K. B. & Faloona, F. A. (1987) Specific synthesis of DNA in vitro via a polymerase-catalyzed chain reaction. Methods Enzymol 155: 335-350. 237. Bustin, S. A. (2000) Absolute quantification of mRNA using real-time reverse transcription polymerase chain reaction assays. J Mol Endocrinol 25: 169-193. 238. Miyazato, A., Ueno, S., Ohmine, K., Ueda, M., Yoshida, K., Yamashita, Y., Kaneko, T., Mori, M., Kirito, K. et al. (2001) Identification of myelodysplastic syndrome-specific genes by DNA microarray analysis with purified hematopoietic stem cell fraction. Blood 98: 422-427. 239. Steg, A., Wang, W., Blanquicett, C., Grunda, J. M., Eltoum, I. A., Wang, K., Buchsbaum, D. J., Vickers, S. M., Russo, S. et al. (2006) Multiple gene expression analyses in paraffin-embedded tissues by TaqMan low-density array: Application to hedgehog and Wnt pathway analysis in ovarian endometrioid adenocarcinoma. J Mol Diagn 8: 76-83. 240. Gygi, S. P., Rist, B. & Aebersold, R. (2000) Measuring gene expression by quantitative proteome analysis. Curr Opin Biotechnol 11: 396-401. 241. O'Farrell, P. H. (1975) High resolution two-dimensional electrophoresis of proteins. J Biol Chem 250: 4007-4021. 242. Klose, J. (1975) Protein mapping by combined isoelectric focusing and electrophoresis of mouse tissues. A novel approach to testing for induced point mutations in mammals. Humangenetik 26: 231-243.

138
243. Scheele, G. A. (1975) Two-dimensional gel analysis of soluble proteins. Charaterization of guinea pig exocrine pancreatic proteins. J Biol Chem 250: 5375-5385. 244. Thiede, B., Hohenwarter, W., Krah, A., Mattow, J., Schmid, M., Schmidt, F. & Jungblut, P. R. (2005) Peptide mass fingerprinting. Methods 35: 237-247. 245. Rabilloud, T. (1999) Solubilization of proteins in 2-D electrophoresis. An outline. Methods Mol Biol 112: 9-19. 246. Dunn, M. J. (1993) Gel Electrophoresis: Proteins, BIOS. 247. Lippincott, J. & Apostol, I. (1999) Carbamylation of cysteine: a potential artifact in peptide mapping of hemoglobins in the presence of urea. Anal Biochem 267: 57-64. 248. Gorg, A., Weiss, W. & Dunn, M. J. (2004) Current two-dimensional electrophoresis technology for proteomics. Proteomics 4: 3665-3685. 249. Luche, S., Santoni, V. & Rabilloud, T. (2003) Evaluation of nonionic and zwitterionic detergents as membrane protein solubilizers in two-dimensional electrophoresis. Proteomics 3: 249-253. 250. Washburn, M. P., Wolters, D. & Yates, J. R., 3rd (2001) Large-scale analysis of the yeast proteome by multidimensional protein identification technology. Nat Biotechnol 19: 242-247. 251. Francavilla, T. L., Miletich, R. S., DeMichele, D., Patronas, N. J., Oldfield, E. H., Weintraub, B. D. & Di Chiro, G. (1991) Positron emission tomography of pituitary macroadenomas: hormone production and effects of therapies. Neurosurgery 28: 826-833. 252. Moseley, M. A. (2001) Current trends in differential expression proteomics: isotopically coded tags. Trends Biotechnol 19: S10-16. 253. Bjellqvist, B., Ek, K., Righetti, P. G., Gianazza, E., Gorg, A., Westermeier, R. & Postel, W. (1982) Isoelectric focusing in immobilized pH gradients: principle, methodology and some applications. J Biochem Biophys Methods 6: 317-339. 254. Bjellqvist, B., Sanchez, J. C., Pasquali, C., Ravier, F., Paquet, N., Frutiger, S., Hughes, G. J. & Hochstrasser, D. (1993) Micropreparative two-dimensional electrophoresis allowing the separation of samples containing milligram amounts of proteins. Electrophoresis 14: 1375-1378.

139
255. Bjellqvist, B., Pasquali, C., Ravier, F., Sanchez, J. C. & Hochstrasser, D. (1993) A nonlinear wide-range immobilized pH gradient for two-dimensional electrophoresis and its definition in a relevant pH scale. Electrophoresis 14: 1357-1365. 256. Gorg, A., Postel, W., Friedrich, C., Kuick, R., Strahler, J. R. & Hanash, S. M. (1991) Temperature-dependent spot positional variability in two-dimensional polypeptide patterns. Electrophoresis 12: 653-658. 257. Gorg, A., Obermaier, C., Boguth, G. & Weiss, W. (1999) Recent developments in two-dimensional gel electrophoresis with immobilized pH gradients: wide pH gradients up to pH 12, longer separation distances and simplified procedures. Electrophoresis 20: 712-717. 258. Gorg, A., Boguth, G., Obermaier, C., Posch, A. & Weiss, W. (1995) Two-dimensional polyacrylamide gel electrophoresis with immobilized pH gradients in the first dimension (IPG-Dalt): the state of the art and the controversy of vertical versus horizontal systems. Electrophoresis 16: 1079-1086. 259. Giorgianni, F., Desiderio, D. M. & Beranova-Giorgianni, S. (2003) Proteome analysis using isoelectric focusing in immobilized pH gradient gels followed by mass spectrometry. Electrophoresis 24: 253-259. 260. Laemmli, U. K. (1970) Cleavage of structural proteins during the assembly of the head of bacteriophage T4. Nature 227: 680-685. 261. Fountoulakis, M. (2001) Proteomics: current technologies and applications in neurological disorders and toxicology. Amino Acids 21: 363-381. 262. Dreger, M. (2003) Subcellular proteomics. Mass Spectrom Rev 22: 27-56. 263. Fountoulakis, M., Takacs, M. F. & Takacs, B. (1999a) Enrichment of low-copy-number gene products by hydrophobic interaction chromatography. J Chromatogr A 833: 157-168. 264. Fountoulakis, M., Takacs, M. F., Berndt, P., Langen, H. & Takacs, B. (1999b) Enrichment of low abundance proteins of Escherichia coli by hydroxyapatite chromatography. Electrophoresis 20: 2181-2195. 265. Righetti, P. G., Castagna, A., Antonioli, P. & Boschetti, E. (2005) Prefractionation techniques in proteome analysis: the mining tools of the third millennium. Electrophoresis 26: 297-319. 266. Garbis, S., Lubec, G. & Fountoulakis, M. (2005) Limitations of current proteomics technologies. J Chromatogr A 1077: 1-18.

140
267. Fountoulakis, M., Takacs, B. & Langen, H. (1998) Two-dimensional map of basic proteins of Haemophilus influenzae. Electrophoresis 19: 761-766. 268. Neubauer, H., Clare, S. E., Kurek, R., Fehm, T., Wallwiener, D., Sotlar, K., Nordheim, A., Wozny, W., Schwall, G. P. et al. (2006) Breast cancer proteomics by laser capture microdissection, sample pooling, 54-cm IPG IEF, and differential iodine radioisotope detection. Electrophoresis 27: 1840-1852. 269. Langen, H., Roder, D., Juranville, J. F. & Fountoulakis, M. (1997) Effect of protein application mode and acrylamide concentration on the resolution of protein spots separated by two-dimensional gel electrophoresis. Electrophoresis 18: 2085-2090. 270. Khalkhali-Ellis, Z. (1995) An improved SDS-polyacrylamide gel electrophoresis for resolution of peptides in the range of 3.5-200kDa. Prep Biochem 25: 1-9. 271. Peng, J. & Gygi, S. P. (2001) Proteomics: the move to mixtures. J Mass Spectrom 36: 1083-1091. 272. Patton, W. F. (2002) Detection technologies in proteome analysis. J Chromatogr B Analyt Technol Biomed Life Sci 771: 3-31. 273. Unlu, M., Morgan, M. E. & Minden, J. S. (1997) Difference gel electrophoresis: a single gel method for detecting changes in protein extracts. Electrophoresis 18: 2071-2077. 274. Rosenfeld, J., Capdevielle, J., Guillemot, J. C. & Ferrara, P. (1992) In-gel digestion of proteins for internal sequence analysis after one- or two-dimensional gel electrophoresis. Anal Biochem 203: 173-179. 275. Wilson, K. E., Ryan, M. M., Prime, J. E., Pashby, D. P., Orange, P. R., O'Beirne, G., Whateley, J. G., Bahn, S. & Morris, C. M. (2004) Functional genomics and proteomics: application in neurosciences. J Neurol Neurosurg Psychiatry 75: 529-538. 276. Henzel, W. J., Watanabe, C. & Stults, J. T. (2003) Protein identification: the origins of peptide mass fingerprinting. J Am Soc Mass Spectrom 14: 931-942. 277. Barrett, J., Brophy, P. M. & Hamilton, J. V. (2005) Analysing proteomic data. Int J Parasitol 35: 543-553. 278. Lahm, H. W. & Langen, H. (2000) Mass spectrometry: a tool for the identification of proteins separated by gels. Electrophoresis 21: 2105-2114.