Real-Time Control Strategies for Rail Transit · Real-Time Control Strategies for Rail Transit...
21
12/08/03 1.224J/ESD.204J 1 Real-Time Control Strategies for Rail Transit Outline: • Problem Description and Motivation • Model Formulation • Model Application and Results • Implementation Issues • Conclusions
-
Upload
duongthien -
Category
Documents
-
view
216 -
download
0
Transcript of Real-Time Control Strategies for Rail Transit · Real-Time Control Strategies for Rail Transit...

12/08/03 1.224J/ESD.204J 1
Real-Time Control Strategies for Rail Transit
Outline:
• Problem Description and Motivation
• Model Formulation
• Model Application and Results
• Implementation Issues
• Conclusions
12/08/03 1.224J/ESD.204J 2
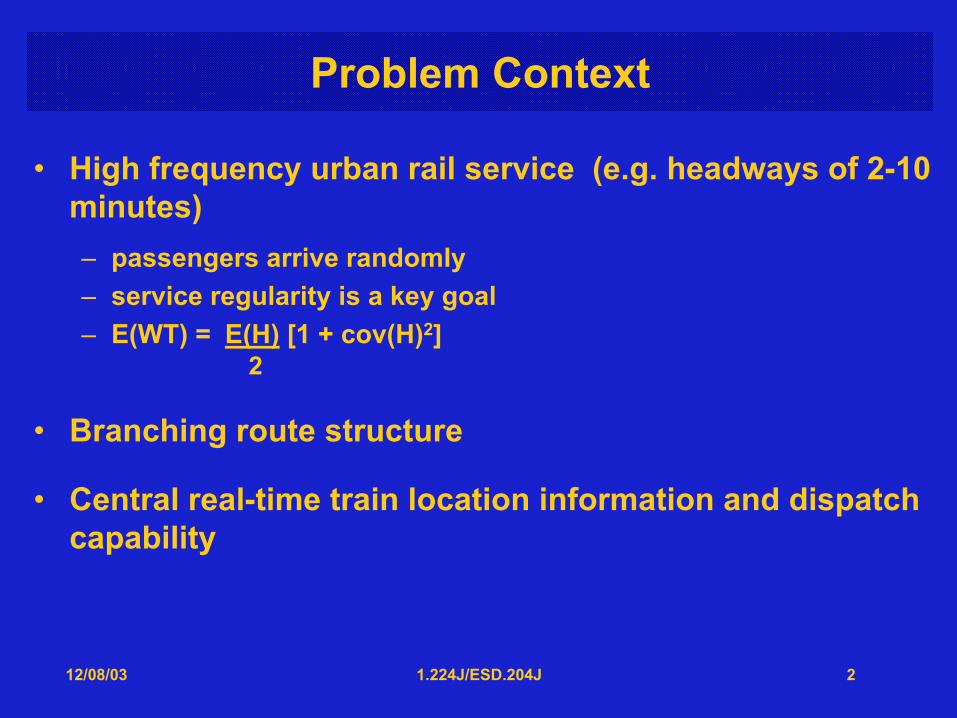
Problem Context
• High frequency urban rail service (e.g. headways of 2-10 minutes)– passengers arrive randomly– service regularity is a key goal– E(WT) = E(H) [1 + cov(H)2]
2
• Branching route structure
• Central real-time train location information and dispatch capability

12/08/03 1.224J/ESD.204J 3
Three Levels of Control Problems
Routine disturbances - several minutes’ deviation from scheduleControl Strategies:• speed adjustment• dwell time adjustment (selective holding) terminal recovery
Short-term disruptions: 5-30 minute blockages on the line
Longer-term disruptions - greater than 30 minute blockagesControl Strategies:• single-track reverse direction operations• replacement bus service around blockage

12/08/03 1.224J/ESD.204J 4
Blockage Held trains
Train
Station
KEY
Terminal A Terminal B
XX
Express trainafter clearance
short-turnoption 1
short-turnoption 2
Disruption Response Strategies
12/08/03 1.224J/ESD.204J 5
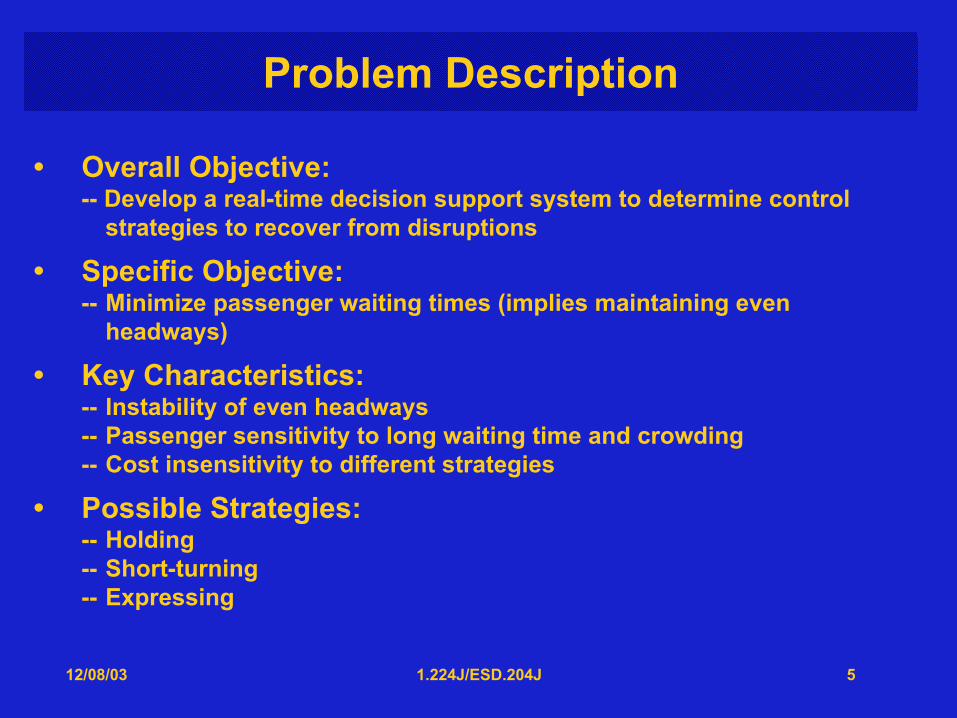
Problem Description
• Overall Objective:-- Develop a real-time decision support system to determine control
strategies to recover from disruptions
• Specific Objective:-- Minimize passenger waiting times (implies maintaining even
headways)
• Key Characteristics:-- Instability of even headways-- Passenger sensitivity to long waiting time and crowding-- Cost insensitivity to different strategies
• Possible Strategies:-- Holding-- Short-turning-- Expressing

12/08/03 1.224J/ESD.204J 6
Example of Transit Control Strategies
Vehicle Stop
T1Õ
T3 T2
S2
20 passengers/min
4 passengers/min
S1
T1T4
Blockage
• 6-minute scheduled headways• 3-minute minimum safe headway• 10-minute disruption• impact set includes trains T2, T3, and T4 and stations S1 and S2

12/08/03 1.224J/ESD.204J 7
Example Results
2. Holding: Hold T2 at S2 for 4 mins. Then at S2: hT2 = 10 mins.; hT3 = 12 mins.; hT4 = 3 mins.
3. Expressing: Express T3 past S1 to save 1 minute in travel time.Then at S2: hT2 = 6 mins.; hT3 = 15 mins.; hT4 = 4 mins.
1. Do nothing: hT2 = 6 mins.; hT3 = 16 mins.; hT4 = 3 mins.
Total Passenger Waiting Time =124(162 + 32 )[ ] +
1220(62 +162 + 32 )[ ] = 3540 pass −mins.
T P W T =124(162 + 32 )( +20(102 + 122 + 32 ))[ ] = 3060 pass −mins.
T P W T =124 *192 + 20(62 +152 + 42 )[ ] = 3492 pass − mins.
12/08/03 1.224J/ESD.204J 8
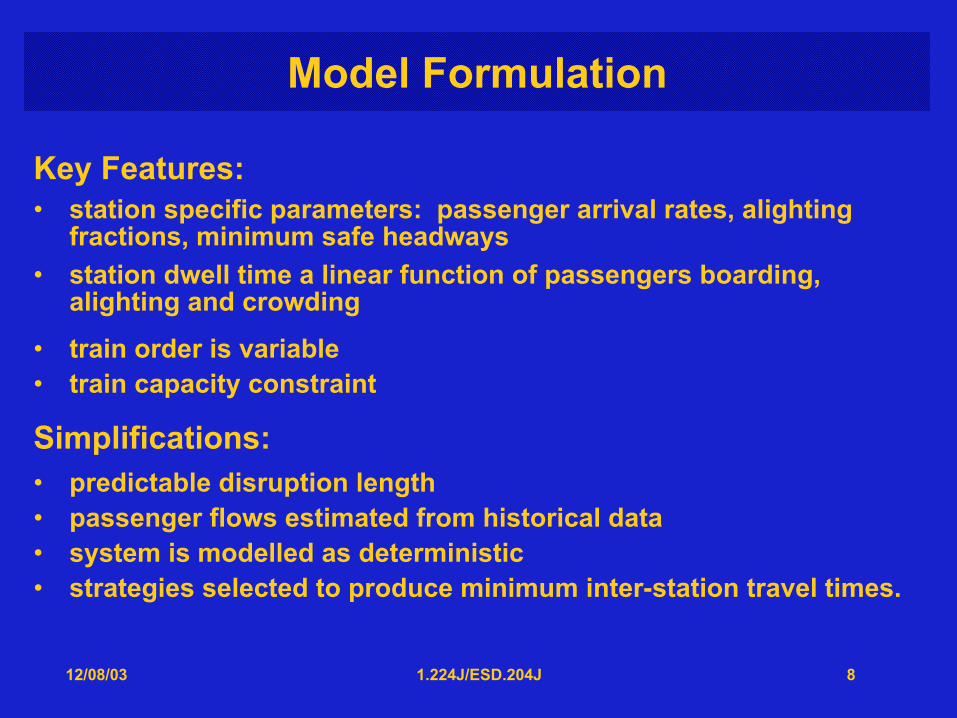
Model Formulation
Key Features:• station specific parameters: passenger arrival rates, alighting
fractions, minimum safe headways• station dwell time a linear function of passengers boarding,
alighting and crowding
• train order is variable• train capacity constraint
Simplifications: • predictable disruption length• passenger flows estimated from historical data• system is modelled as deterministic• strategies selected to produce minimum inter-station travel times.
12/08/03 1.224J/ESD.204J 9
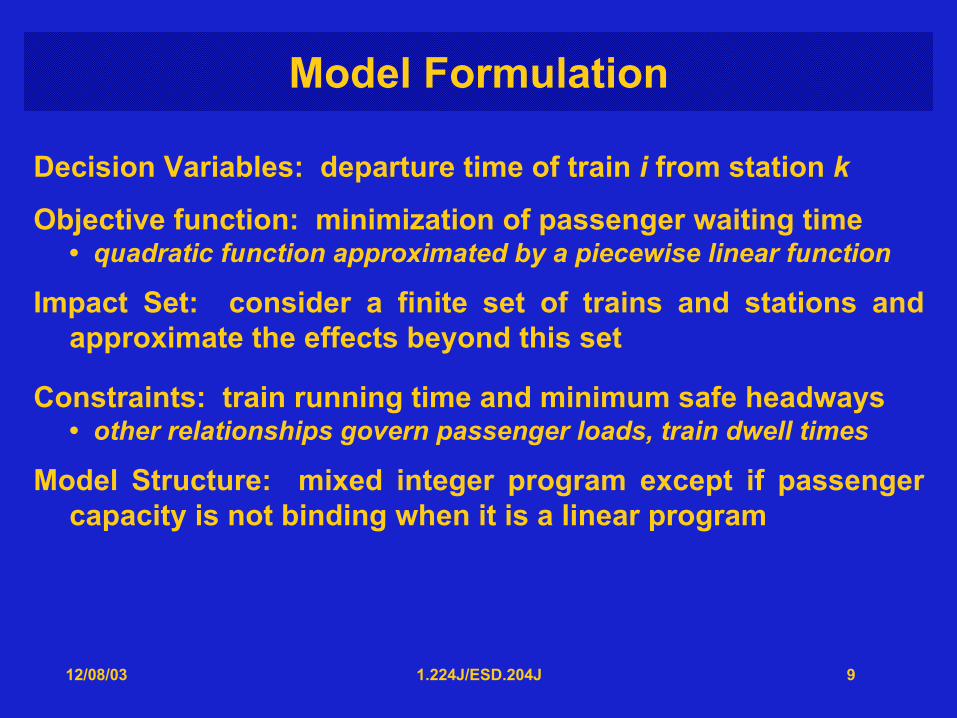
Decision Variables: departure time of train i from station k
Objective function: minimization of passenger waiting time• quadratic function approximated by a piecewise linear function
Impact Set: consider a finite set of trains and stations and approximate the effects beyond this set
Constraints: train running time and minimum safe headways• other relationships govern passenger loads, train dwell times
Model Structure: mixed integer program except if passenger capacity is not binding when it is a linear program
Model Formulation
12/08/03 1.224J/ESD.204J 10
Specific Models
Holding Strategy Models:• Hold all• Hold once• Hold at first station
Combined Short-turning and Holding Models:• Predetermined train order• Undetermined train order
12/08/03 1.224J/ESD.204J 11
Model Application
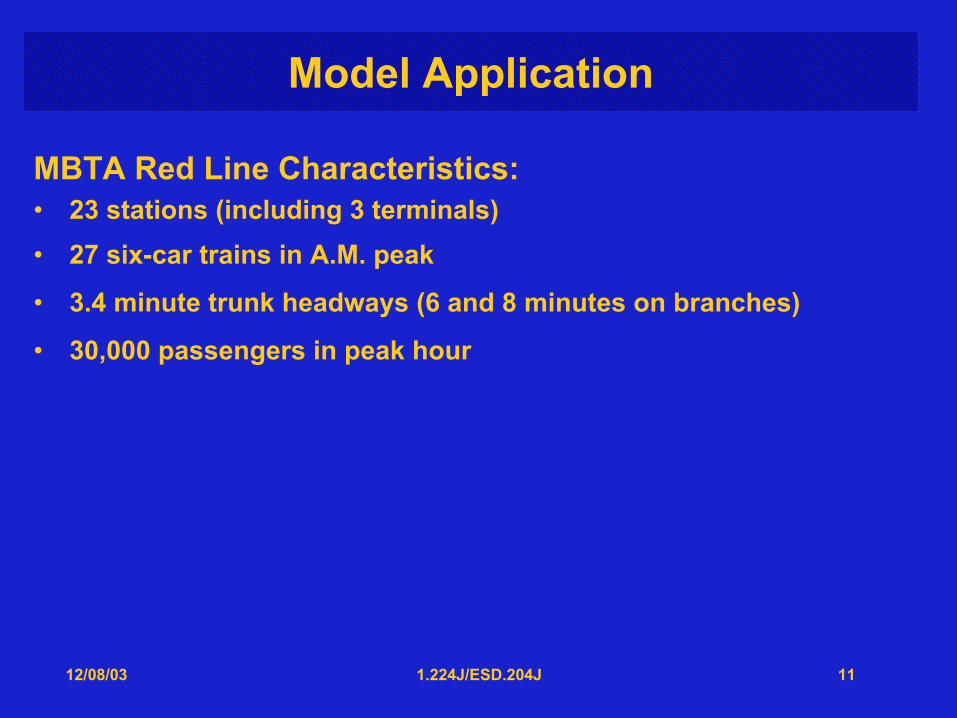
MBTA Red Line Characteristics:• 23 stations (including 3 terminals)• 27 six-car trains in A.M. peak
• 3.4 minute trunk headways (6 and 8 minutes on branches)
• 30,000 passengers in peak hour

12/08/03 1.224J/ESD.204J 12
Red Line
Blockage Location,Incident 2
Blockage Location,Incident 1
KEY:Ashmont TrainBraintree TrainStationBlockage
NorthAshmont
Braintree
Harvard Square
Kendall/MIT
Alewife
Park Street

Control Strategies
FOHPC STPPPassenger Waiting Time
(Passenger-Minutes)Do
NothingHoldAll
HoldOnce
Hold atFirst
HoldAll
Ahead of Blockage 11202 8863 8931 8961 9997
Savings (percent) 15% 14% 14% 8%
Behind Blockage 4791 4763 4753
Savings (percent) 0% 0%
Maximum Train Load 988 603 614 666 603
Problem Size 95 95 95 88
CPU Time (seconds) 22 37 21 16
Incident 1, Ten Minute Delay

Control Strategies
FOHPC STPPPassenger Waiting Time
(Passenger-Minutes)Do
NothingHoldAll
HoldOnce
Hold atFirst
HoldAll
Ahead of Blockage 36868 16934 17306 17385 16836
Savings (percent) 43% 42% 42% 43%
Behind Blockage 9218 7833 6842
Savings (percent) 3% 5%
Maximum Train Load 1646 666 759 805 651
Problem Size 95 95 95 88
CPU Time (seconds) 25 82 27 17
Incident 1, Twenty Minute Delay

Control Strategies
FOHPC STPPPassenger Waiting Time
(Passenger-Minutes)Do
NothingHoldAll
HoldOnce
Hold atFirst
HoldAll
Ahead of Blockage 32495 23101 24465 25327 23016
Savings (percent) 25% 21% 19% 25%
Behind Blockage 5593 5320 5404
Savings (percent) <1% <1%
Maximum Train Load 1336 1137 964 985 776
Problem Size 69 69 69 78
CPU Time (seconds) 17 274 23 12
Incident 2, Ten Minute Delay
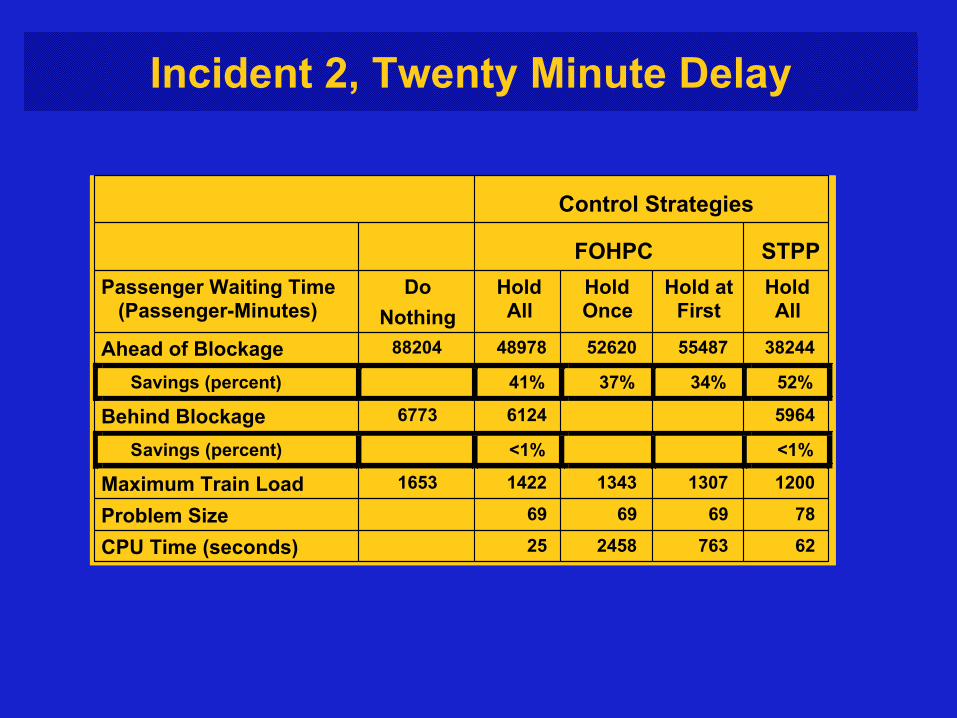
Control Strategies
FOHPC STPPPassenger Waiting Time
(Passenger-Minutes)Do
NothingHoldAll
HoldOnce
Hold atFirst
HoldAll
Ahead of Blockage 88204 48978 52620 55487 38244
Savings (percent) 41% 37% 34% 52%
Behind Blockage 6773 6124 5964
Savings (percent) <1% <1%
Maximum Train Load 1653 1422 1343 1307 1200
Problem Size 69 69 69 78
CPU Time (seconds) 25 2458 763 62
Incident 2, Twenty Minute Delay
12/08/03 1.224J/ESD.204J 17
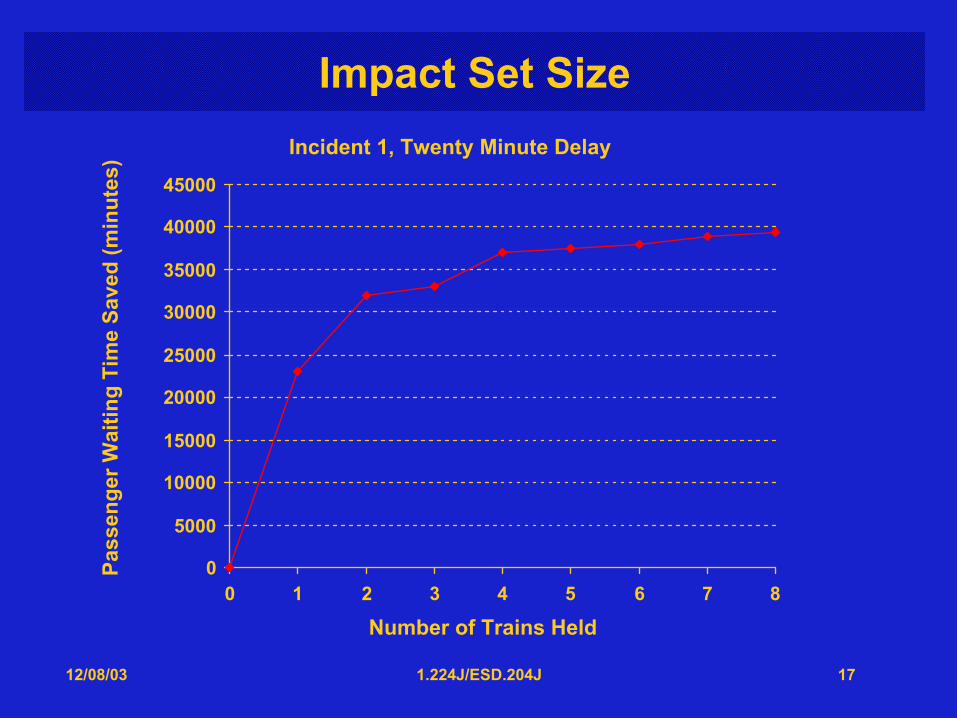
Impact Set Size
0
5000
10000
15000
20000
25000
30000
35000
40000
45000
0 1 2 3 4 5 6 7 8
Number of Trains Held
Incident 1, Twenty Minute DelayPa
ssen
ger W
aitin
g Ti
me
Save
d (m
inut
es)
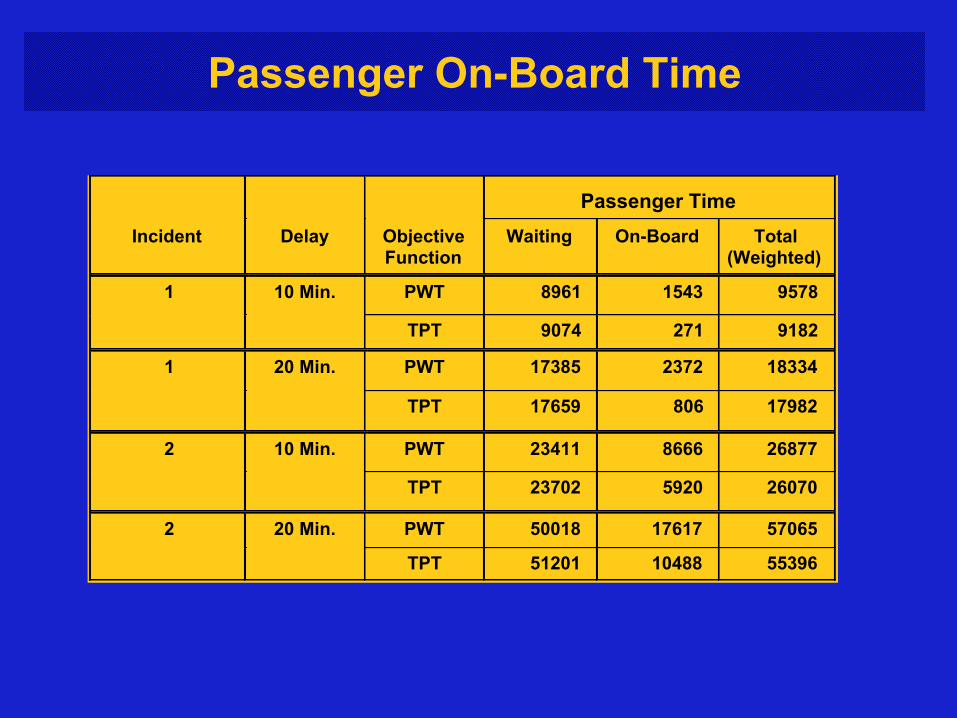
Passenger TimeIncident Delay Objective
FunctionWaiting On-Board Total
(Weighted)
1 10 Min. PWT 8961 1543 9578
TPT 9074 271 9182
1 20 Min. PWT 17385 2372 18334
TPT 17659 806 17982
2 10 Min. PWT 23411 8666 26877
TPT 23702 5920 26070
2 20 Min. PWT 50018 17617 57065
TPT 51201 10488 55396
Passenger On-Board Time

12/08/03 1.224J/ESD.204J 19
Execution Times
• Sun SPARC 20 workstation• GAMS V. 2.25• CPLEX V. 3.0• Simple front-end heuristic to fix some binary variables
Large Problems: 11-13 trains, 69-95 train/station decision var.Execution Time: 10 out of 16 <30 sec.
Realistic Size: 7-8 trains, 40-50 train/station decision var.Execution Time: 16 out of 16 <34 sec.

12/08/03 1.224J/ESD.204J 20
Conclusions
• Holding and short-turning models formulated and solved to optimality
• Active control strategies result in significant passenger waiting time savings
• Train control set can be reduced to trains ahead of the blockage
• Train control set need not be large

12/08/03 1.224J/ESD.204J 21
Conclusions
• Hold at First or Hold Once strategies can be almost as effective as Hold All strategy
• Short-turning most effective where:-- blockage is long relative to short-turn time-- number of stations outside the short-turn loop is small
• Consideration of on-board time is desirable
• Execution time is 30 seconds or less but faster heuristics are probably achievable