KORO 101000 € 136,00 SET VIAGGIO 3 TROLLEY - Dimensioni: 71-61-51

MEASUREMENTSRELATEDTO PAIN IN NEUROCIRCULATORYASTHENIA, ANXIETY NEUROSIS, OR EFFORTSYNDROME:
LEVELS OF HEAT STIMULUS PERCEIVEDASPAINFUL ANDPRODUCINGWINCEAND
WITHDRAWALREACTIONS'
By WILLIAM P. CHAPMAN,MANDELE. COHEN, AND STANLEYCOBB
(From the Department of Medicine, Massachusetts General Hospital, the Massachusetts GeneralHospital Branch of the Hall-Mercer Hospital, the Department of Medicine and
Neurology and Psychiatry of the Harvard Medical School, Boston)
(Received for publication August 4, 1946)
Multiple complaints of discomfort such as aches,pains and distress are a commonfinding in patientswith neurocirculatory asthenia (N.C.A.). Amongthe symptoms listed in our patients with this con-dition are chest pain 92 per cent, headaches 66 percent, "indigestion" 64 per cent, marked self-observation including observation of disagreeablesymptoms 64 per cent. In addition, discomfortseems to affect the behavior and lead to great dis-ability in these patients. In attempting to putthrough a program of training, it was found thatpatients would not submit to the various exercisesproposed by the trainer (1). The patients statedthat exercise made them too uncomfortable andled to aches and pains.
It was felt, therefore, that investigation of thepatients' level of awareness of painful stimuli, i.e.perception, and the patients' reaction to painfulstimuli, should be studied. For the purpose ofstudying the threshold at which patients perceiveda standard stimulus as painful, and the level atwhich the patient reacted (winced or pulledaway), we employed the Hardy-Wolff radiationapparatus (2).
METHOD
On grounds of history alone, 2 groups of patients weredistinguished. Those who had a life long course, or whocould never do hard work or take part in athletics, werecalled chronic N.C.A.; those who gave convincing evi-dence of good health, good work or athletic ability andnervous stability previous to onset of the disorder werecalled acute N.C.A. Measurements were made in 94 pa-tients, members of the armed forces, of whom 63 werecases of chronic N.C.A., and 31 cases of acute N.C.A.
.1 The work described in this paper was done under a
contract, recommended by the Committee on Medical Re-search, between the Office of Scientific Research and De-velopment and the Massachusetts General Hospital. Re-sponsible Investigators: Stanley Cobb and Paul D. White.
The control subjects were 44 healthy individuals, 36 ofwhom were in military service, and 8 medical students.Patients and controls were men, and were roughly com-parable as regards age range, economic, social and ethnicgroups. Additional control subjects were 17 convalescentsoldiers recovering from infected bone injuries sustainedin combat or while in military service.
The stimulus consisted of varying intensities of heatsupplied by the radiation apparaus (3). The source ofheat was a 1,000 watt Mazda lamp with the light focusedonto the midline of the forehead by 2 plano-convex lensesthrough an aperture 2.5 cm.' in area. To standardize theabsorption of light, the forehead was first blackened withIndia ink. Each exposure was kept constant at 3 secondsby means of a shutter operated by a telechron motor, andthe intensity was varied uniformly by a wire rheostat.The amount of stimulus used was calibrated periodicallyby a radiometer, and expressed in absolute end point val-ues of gram cal. per sec. and cm.' of skin surface.*
Each subject was tested on 2 separate occasions, butnever on the same day. With few exceptions, each testconsisted of from 10 to 14 exposures to the stimulus, withapproximpately a 2-minute interval between exposures.Before the start of the first test, no comments were madeor instructions given, other than to tell the subject to keephis eyes closed during each stimulus. After each expo-sure the subject was asked these non-committal questions:(1) "What did you feel?" (2) "How would you de-scribe what you felt when the stimulus was most intense ?"(3) "Was the stimulus as intense, less or more intensethan the previous one?" (4) "Was the stimulus like any-thing you have ever felt before?" (A card with 7 num-
bered circles varying from the diameter of a silver dollar,4 cm., to a pin head, 1 mm., was held before the subject.)He was asked which circle corresponded in area to thesize of the place on his forehead where the stimulusseemed most intense. The purpose of these questions wasto have the patient describe what he felt when the stimu-lus was applied, avoiding suggesting the answer.
Wealso wished to learn whether N.C.A. subjects de-scribed their feelings at the painful level in the same or
in a different manner from the control subjects.The second test was administered in a slightly different
* This is commonly expressed as gm. cal./sec./cm.'890
MEASUREMENTSOF PAIN IN N.C.A.
manner from the first. The subject was given the fol-lowing description of the stimulus: "At the beginning,the exposures feel like a warm glow. As they becomemore intense, the sensation feels smaller and hot or
burny. Eventually, the most intense part of the stimuluschanges from a burn to a sharp piercing quality aboutthe size of a pencil point." He was also asked to keephis forehead at the aperture until told to move it away.
The lowest level of stimulus at which the subject saidhe felt a sharp jabbing or piercing sensation, i.e., the end-point for perception, was calculated as the mean of theconsistent values plus the inconsistent values. A con-
sistent value was one at which the subject felt the sharp,jabbing or piercing sensation, but it must be one of a
series on a given day in which there were no failures atperceiving the endpoint sensation. An inconsistent valuewas one at which the subject felt the endpoint sensationat least once but also failed to do so on one or more
subsequent exposures at that level. Any values whichwere higher than the consistent ones were excluded. Thethreshold of motor reaction was taken to be the lowestlevel at which the subject winced, as evidenced by a be-ginning contraction of the muscles at the outer canthus ofthe eye. This value was calculated in the same manner
as that for the subjective endpoint of pain, that is, bytaking the mean of the consistent value plus the in-consistent value.
From the first exposure where a warm glow was felt,to levels where the sharp jabbing endpoint was felt, andwhere wincing occurred, the stimulus was varied from.030 to .040 gram cal. per sec. and cm.' each time. Inorder to obtain as closely as possible the endpoint levels,the stimulus was altered as little as .005 or .010 gram cal.per sec. and cm.' each time. At the completion of eachtest, notations were made regarding factors such as nerv-
ousness, restlessness, taking of medication or alcohol. Ifthe subjects had taken either analgesic medication or alco-hol, no test was performed on that day. When both testswere finished, the word "pain" was mentioned by the ex-
aminer for the first time. The subject was asked to define"pain," and to state whether he thought the sharp, jabbingend point seemed like a "pain" sensation.
Also, a certain number of subjects were asked to recallif they winced, and to state why they winced.
The results of these tests were then correlated withother clinical and laboratory findings to determine theirpossible interrelationship.
Most of the tests were made by the same examiner.To rule out any variation which might be due to thetester, another physician performed the test on 18 of thecontrol subjects and 15 of the patients.
RESULTS
(A) Lowest level at which stimulus is perceivedas painful, and at which patient winces or
pulls away
Figure 1 presents the data from our second testfor the level at which the stimulus was perceived
as painful by each patient. The levels at whichcontrol subjects and patients with neurocirculatoryasthenia perceived the stimulus as painful are al-most identical in the 4 groups.
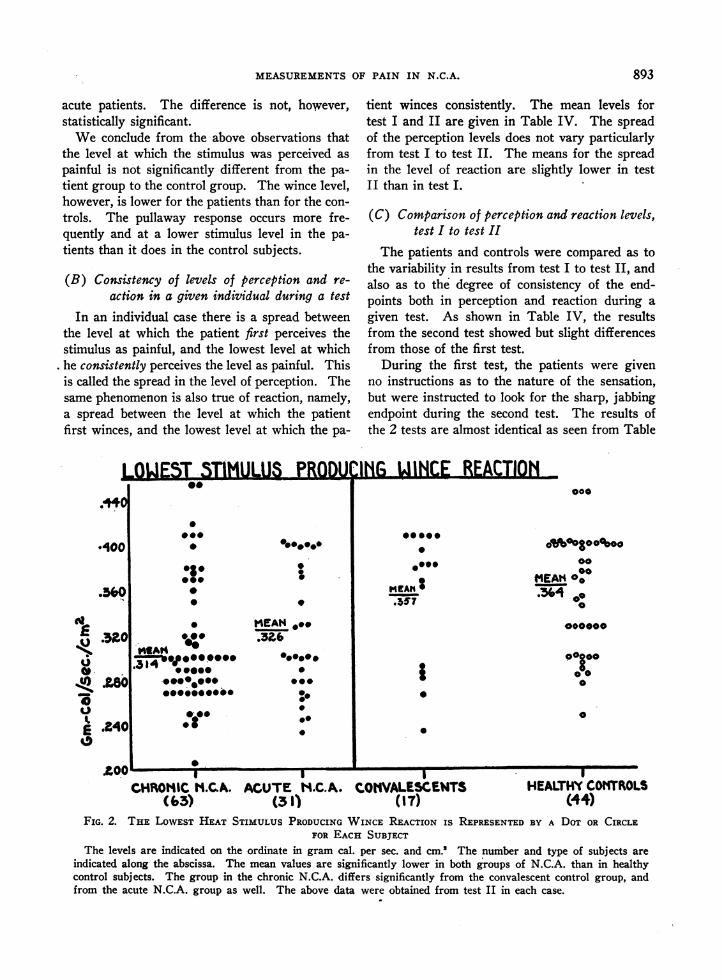
However, when the means of the levels at whichstimuli produce wince reaction are compared, pa-tients with chronic N.C.A. react at the lowestlevel, acute N.C.A. at the next level, convalescentswince at a higher level and the healthy controlsubjects wince at the highest levels of all (Figure2). The differences between the chronic N.C.A.and the control groups are significant statistically(Table II).
In addition to the wince reaction, many of thepatients pulled their heads away from the appa-ratus. This response occurred (Table III) fre-quently in patients and almost not at all in healthyand convalescent controls. At levels lower than.351 gram cal. per sec. per cm.2, 3 per cent ofhealthy control subjects pulled away, 7 per centconvalescents, 32 per cent acute N.C.A. patients,and 49 per cent chronic N.C.A. patients pulledaway. The differences at this stimulus level be-tween the N.C.A. patients and the control sub-ject, both healthy and convalescent, are highly sig-
TABLE I
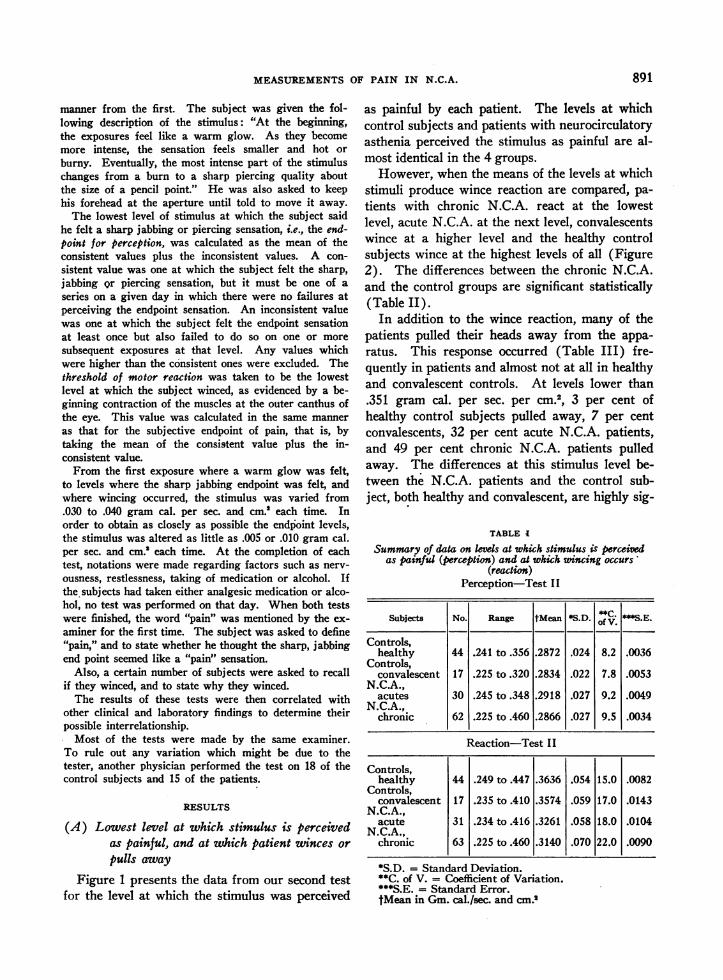
Summary of data on kvels at which stimulus is perceivedas painful (perception) and at which wincing occurs'
(reaction)Perception-Test II
Subjects No. Range tMean *S.D. 5C.S.E.
Controls,healthy 44 .241 to .356 .2872 .024 8.2 .0036
Controls,convalescent 17 .225 to.320 .2834 .022 7.8 .0053
N.C.A.,acutes 30 .245 to.348 .2918 .027 9.2 .0049
N.C.A.,chronic 62 .225 to .460 .2866 .027 9.5 .0034
Reaction-Test II
Controls,healthy 44 .249 to .447 .3636 .054 15.0 .0082
Controls,convalescent 17 .235 to .410 .3574 .059 17.0 .0143
N.C.A.,gacute 31 .234 to .416 .3261 .058 18.0 .0104
N.C.A ,chronic 63 .225 to.460 .3140 .070 22.0 .0090
*S.D. = Standard Deviation.**C. of V. = Coefficient of Variation.***S.E. = Standard Error.tMean in Gm. cal./sec. and cm.'
891

WILLIAM P. CHAPMAN, MANDELE. COHEN, AND STANLEY COBB
LOWE5T 5TIMULU5 PERCEIVED
00.0
@00
_ab
rs^v
0
@0
T.9.
0@
*s.
a a 0~~~~~~~aI ICHRIOINIC H.CA. ACUTE t.C. A.
(6t4 (30)
AS
0
0
2SM"EAMtZ63 _*
COIiVALESCEMIT(17)
HEALTHYCOThROkS(44)
FIG. 1. THE LOWESTLEVEL OF HEAT STIMULUS PERCEIVEDAS PAINFUL IN EACH INDIVIDUALSUBJECT IS PRESENTEDABOVEAS A DOT OR CIRCLE
The levels are indicated on the ordinate in gram cal. and sec. per cm.'. The number and type ofsubjects are indicated along the abscissa. This figure shows that the mean of the observation is thesame for all groups. The slight differences are not significant; the distributions are similar for the 4groups. Above data are charted from values obtained in test II in each case.
TABLE II
Significance of the difference between the meansof the various groups
Chrn-AcuesChron- Con- AcutesChron Ate ics vs. valesc. s
healthy healthy valsc. healthy valeac.
Test II-PerceptionDifference between
meansStandard error .0046 .0058 .0062 .0061 .0070Significance ratio .13 .80 .52 .63 1.19
ReactionDifference between
meansStandard error .0120 .0132 .0168 .0164 .0176Significance ratio 4.12 2.85 2.58 .38 1.77
Difference (test II-test I):Reaction
Standard error .0071 .0081 .0127 .0135 .0133Significance mtio .95 .62 .26 .74 .38
Individual spreadPerception
Test I difference ..... .0027Standard error .0004Significance ratio .66
Test II difference .0021Standard error 3.89Significance ratio .54
nificant, with a significance ratio of 5.50. TableIII also illustrates that at the lowest stimulus levelpatients and control subjects do not differ particu-larly, but, as the stimulus is increased, the differ-ences between patients and control subjects inwithdrawal becomes more marked. At the 3 high-est stimulus levels, a greater proportion of chronicpatients pull away from the apparatus than do the
TABLE III
Percentage incidence of puling head away from apparatusat various heat levls (Controls vs. N.C.A.)
Gram cal. per sec. per cm.2At level, gram caL. per
sec. and cm.2, of kss than.276 .301 .326 .351
Healthy (28) 0 0 0 3Convalescent (15) 0 0 0 7Acute N.C.A. (23) 8 21 30 32Chronic N.C.A. (50) 5 27 38 49
PAI NFUL
.100
.@36044
9
.to0*00
0000
0 0%~
50*0ooo
- - -- . o - - - - - . . - - .-a -m
892
MEASUREMENTSOF PAIN IN N.C.A.
acute patients. The difference is not, however,statistically significant.
Weconclude from the above observations thatthe level at which the stimulus was perceived aspainful is not significantly different from the pa-tient group to the control group. The wince level,however, is lower for the patients than for the con-trols. The pullaway response occurs more fre-quently and at a lower stimulus level in the pa-tients than it does in the control subjects.
(B) Consistency of levels of perception and re-action in a given individual during a test
In an individual case there is a spread betweenthe level at which the patient first perceives thestimulus as painful, and the lowest level at whichhe consistently perceives the level as painful. Thisis called the spread in the level of perception. Thesame phenomenon is also true of reaction, namely,a spread between the level at which the patientfirst winces, and the lowest level at which the pa-
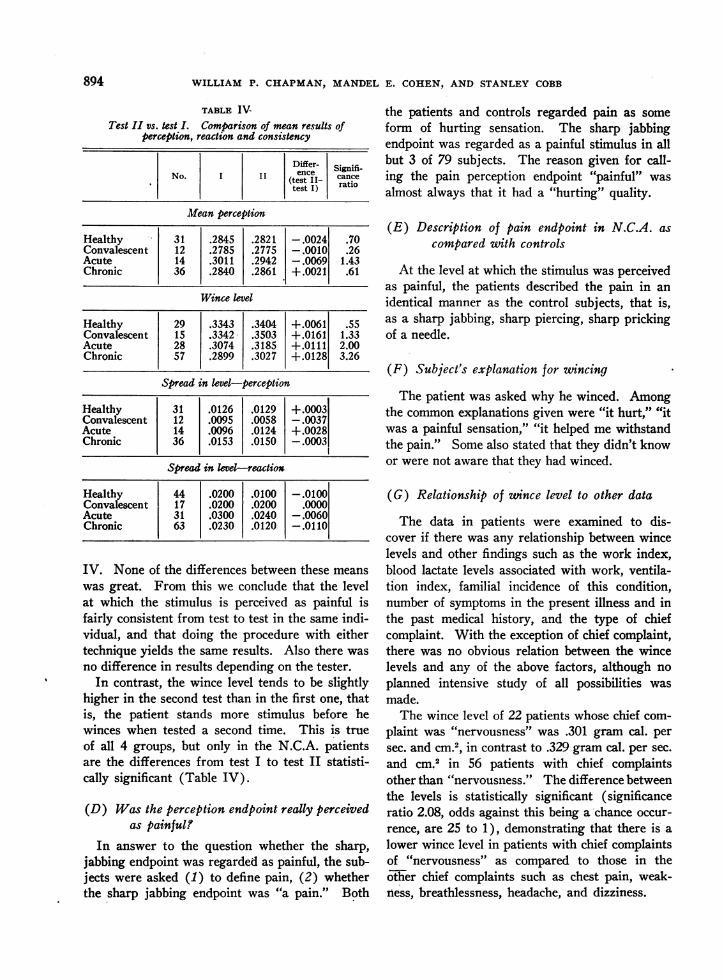
tient winces consistently. The mean levels fortest I and II are given in Table IV. The spreadof the perception levels does not vary particularlyfrom test I to test II. The means for the spreadin the level of reaction are slightly lower in testII than in test I.
(C) Comparison of perception and reaction levels,test I to test II
The patients and controls were compared as tothe variability in results from test I to test II, andalso as to the degree of consistency of the end-points both in perception and reaction during agiven test. As shown in Table IV, the resultsfrom the second test showed but slight differencesfrom those of the first test.
During the first test, the patients were givenno instructions as to the nature of the sensation,but were instructed to look for the sharp, jabbingendpoint during the second test. The results ofthe 2 tests are almost identical as seen from Table
LOWESTSTIMULUS PROUiG WINCE REACTIO
*400
.3'o
.320
a,8Cg.
2 .2400
0e
0*--
9000
.
0
*000
*A@@-00.0.-*eel* [email protected]
*.@o* I
00
0
MEAN*.e.326
@0..0*00
@000
0000:
*Ih( I .~~~ m.m m- -- aI
000
*00 00
.000
MEAN
0
oF°°8°°%oo@0
@00*00
0
0
I I I I
CHROMICM.CGA. ACUTE H.C.A. COI0VALESCEWTS HEALTH CONTROLS(6.3) (.31) (IT) (44)
FIG. 2. THE LOWESTHEAT STIMULUS PRODUCINGWINCE REACTION IS REPRESENTEDBY A DOT OR CIRCLEFOR EACH SUBJECT
The levels are indicated on the ordinate in gram cal. per sec. and cm.' The number and type of subjects areindicated along the abscissa. The mean values are significantly lower in both groups of N.C.A. than in healthycontrol subjects. The group in the chronic N.C.A. differs significantly from the convalescent control group, andfrom the acute N.C.A. group as well. The above data were obtained from test II in each case.
893
a
WILLIAM P. CHAPMAN, MANDELE. COHEN, AND STANLEY COBB
TABLE IV-Test II vs. test I. Comparison of mean results of
perception, reaction and consistency
Differ- SgiiNo. I I ence cance(test II1- ratiotest I)
Mean perception
Healthy 31 .2845 .2821 -.0024 .70Convalescent 12 .2785 .2775 -.0010 .26Acute 14 .3011 .2942 -.0069 1.43Chronic 36 .2840 .2861 +.0021 .61
Wince level
Healthy 29 .3343 .3404 +.0061 .55Convalescent 15 .3342 .3503 +.0161 1.33Acute 28 .3074 .3185 +.0111 2.00Chronic 57 .2899 .3027 +.0128 3.26
Spread in level-perception
Healthy 31 .0126 .0129 +.0003Convalescent 12 .0095 .0058 -.0037Acute 14 .0096 .0124 +.0028Chronic 36 .0153 .0150 -.0003
Spread in level-reaction
Healthy 44 .0200 .0100 -.0100Convalescent 17 .0200 .0200 .0000Acute 31 .0300 .0240 -.0060Chronic 63 .0230 .0120 -.0110
IV. None of the differences between these means
was great. From this we conclude that the levelat which the stimulus is perceived as painful isfairly consistent from test to test in the same indi-vidual, and that doing the procedure with eithertechnique yields the same results. Also there was
no difference in results depending on the tester.In contrast, the wince level tends to be slightly
higher in the second test than in the first one, thatis, the patient stands more stimulus before hewinces when tested a second time. This is trueof all 4 groups, but only in the N.C.A. patientsare the differences from test I to test II statisti-cally significant (Table IV).
(D) Was the perception endpoint really perceivedas painful!
In answer to the question whether the sharp,jabbing endpoint was regarded as painful, the sub-jects were asked (1) to define pain, (2) whetherthe sharp jabbing endpoint was "a pain." Both
the patients and controls regarded pain as someform of hurting sensation. The sharp jabbingendpoint was regarded as a painful stimulus in allbut 3 of 79 subjects. The reason given for call-ing the pain perception endpoint "painful" wasalmost always that it had a "hurting" quality.
(E) Description of pain endpoint in N.C.A. ascompared with controls
At the level at which the stimulus was perceivedas painful, the patients described the pain in anidentical manner as the control subjects, that is,as a sharp jabbing, sharp piercing, sharp prickingof a needle.
(F) Subject's explanation for wincing
The patient was asked why he winced. Amongthe common explanations given were "it hurt," "itwas a painful sensation," "it helped me withstandthe pain." Somealso stated that they didn't knowor were not aware that they had winced.
(G) Relationship of zwince level to other data
The data in patients were examined to dis-cover if there was any relationship between wincelevels and other findings such as the work index,blood lactate levels associated with work, ventila-tion index, familial incidence of this condition,number of symptoms in the present illness and inthe past medical history, and the type of chiefcomplaint. With the exception of chief complaint,there was no obvious relation between the wincelevels and any of the above factors, although noplanned intensive study of all possibilities wasmade.
The wince level of 22 patients whose chief com-plaint was "nervousness" was .301 gram cal. persec. and cm.2, in contrast to .329 gram cal. per sec.and cm.2 in 56 patients with chief complaintsother than "nervousness." The difference betweenthe levels is statistically significant (significanceratio 2.08, odds against this being a chance occur-rence, are 25 to 1), demonstrating that there is alower wince level in patients with chief complaintsof "nervousness" as compared to those in the6tiher chief complaints such as chest pain, weak-ness, breathlessness, headache, and dizziness.
8094

MEASUREMENTSOF PAIN IN N.C.A.
(H) Is there a relation in individual cases be-tueen perception and reaction levels!
When individual data for perception and wincelevels were correlated in the 4 groups, it was foundthat in each group the reaction level depended onthe level of perception. The higher the perceptionlevel the higher was the level of reaction
The values for the correlation coefficients are:chronic N.C.A., .64; acute N.C.A., .29; convales-cent controls, .50; healthy controls, .53, all but thesecond being significant. Inasmuch as the meanperception level in all 4 groups was the same,the low wince levels in the patient groups couldnot be explained by a low perception level.
SUMMARYOF RESULTS
(A) 1. Patients with N.C.A. perceive the heatstimulus as painful at the same level as do the con-trol subjects.
2. Patients with N.C.A. wince at a lower levelof stimulus than do the controls.
3. This is also true for the levels at which theypull away from the apparatus, a higher proportionof patients withdrawing at each level and at lowerlevels as compared with the controls.
4. Patients with chronic N.C.A. react (wince,pull away) at lower levels than do patients withacute N.C.A.
(B) The degree of consistency of the levels atwhich each stimulus is perceived as painful, andat which wincing occurs, was no different in pa-tients and controls during a given test.
(C) 1. Perception levels do not differ signifi-cantly from test I to test II.
2. Wince levels tend to be slightly higher in testII; this is significantly so in both groups of N.C.A.patients.
3. Similar results were obtained in perceptionlevel, whether subject is instructed to look for jab-bing sensation or is given no instruction and volun-teers a description of this endpoint.
4. There is no change in consistency in pain orwince level from test I to test II.
(D) The subjects report the stimulus as a jab-bing, piercing, hurting sensation and agree that itis painful.
(E) Patients and control subjects use the sametype and intensity of wording in describing theheat stimulus at the pain perception endpoint.
(F) Patients explained that they winced be-cause "it hurt" or to "withstand the pain."
(G) There was a significantly lower wince levelin patients with chief complaint of nervousnessthan in patients with the chief complaints otherthan nervousness, such as chest pain, headache,weakness, breathlessness, or dizziness. There wasno other correlation of wince level with otherfindings from history, or from other tests.
(H) There is positive correlation in individualcases between levels of perception and reaction(wince).
DISCUSSION
This test measures the amount of heat stimuluswhich is perceived as painful on the mid-line ofthe forehead. The fact that this is the same forpatients and controls does not imply that the samewould hold for other locations, for visceral pain,or for other unpleasant stimuli. No support is of-fered by this finding for the idea that these patientscomplain more of discomfort because they feelpain with less stimulus. The patients' descriptionmakes it certain that it is a pain that is experi-enced and not some other sensation, as far as onecan be certain of sensation.
The reaction level offered an estimation of theamount of stimulus at which motor reactionoccurred.
The exact neurologic pathways of these re-sponses are not known, nor is the entire signifi-cance of them understood. The fact that the pa-tients with "nervousness" as a chief complaintshow the lowest wince levels, suggests that thefactor of "nervousness" may be an important fac-tor in the low wince levels in N.C.A. In otherstudies, low wince level has been shown to be re-lated to age and ethnic group of subject (3), butthese factors are not important in this study, ascomparable controls were used.
The finding of a low wince level in N.C.A. cor-responds with a similar finding in a previous study(4) in various types of neurosis. This providesa further point of correspondence between neuro-circulatory asthenia and patients commonly placedin the neurosis category (5). In this paper neura-circulatory asthenia, anxiety neurosis, and effortsyndrome are considered as synonyms describingone syndrome (6).
The patients' reaction at a lower stimulus level
895

WILLIAM P. CHAPMAN, MANDELE. COHEN, AND STANLEY COBB
corresponds to the patients' poor performnance inholding an uncomfortable grip dynamometer, poorperformance in breath holding, and in general topatients' statement of inability to tolerate dis-comfort (1).
It is of further interest that the values checkfrom test I to test II and during each test, despitethe subjective nature of part of the procedure.The checks are as good in the patients as in con-trols, suggesting that patients of this type may beconsistent witnesses of subjective data.
This test might be used as an aid in the diag-nosis of neurocirculatory asthenia, effort syn-drome, and anxiety neurosis. A wince level above.400 gram cal. per sec. and cm.2 makes a diagnosisof neurocirculatory asthenia improbable, as fewerthan 10 per cent of patients are above .400. Awince level below .290 gram cal. per sec. and cm.2is corroboration for the diagnosis of neurocircula-tory asthenia, it being improbable that such a sub-ject is normal, as only 10 per cent of healthy con-trols fall below this level.
CONCLUSIONS
1. The level at which patients with neurocircula-tory asthenia, effort syndrome or anxiefy neurosisperceive the heat stimulus as painful is the sameas thlat for control subjects.
2. In contrast, the level at which the N.C.A.patient reacts to the heat stimulus (winces, pullsaway) is lower than that for the control subjects.
3. This difference is most marked in chronicN.C.A.; less in acute N.C.A.
4. N.C.A. patients with nervousness as a chiefcomplaint wince at a lower wince level than doN.C.A. patients with other chief complaints.
5. The reaction of N.C.A. patients at a lowstimulus level offers a quantitative correlate of theclinical impression of the patients' inability tostand discomfort.
6. This test may be of use in establishing thediagnosis of neurocirculatory asthenia, effort syn-drome, or anxiety neurosis.
BIBLIOGRAPHY
1. Cohen, M. E., Johnson, R. E., Cobb, S., Chapman,W. P., and White, P. D., Studies of work and dis-comfort in patients with neurocirculatory asthenia.J. Clin. Invest., 1944, 23, 934.
2. Hardy, J. D., Wolff, H. G., and Goodell, H., Studieson pain. A new method for measuring pain thresh-old: Observations on spatial summation of pain.J. Clin. Invest., 1940, 19, 649.
3. Chapman, W. P., and Jones, C. M., Variations in cuta-neous and visceral pain sensitivity in normal sub-jects. J. Clin. Invest., 1944, 23, 81.
4. Chapman, W. P., Measurement of pain sensitivity innormal control subjects and in psychoneurotic pa-tients. Psychosom. Med., 1944, 6, 252.
5. White, P. D., Cobb, S., Chapman, W. P., Cohen, M. E.,and Badal, D. W., Observations on neurocircula-tory asthenia. Trans. Ass. Am. Phys., 1944, 58,129.
6. Cohen, M. E., Johnson, R. E., Chapman, W. P., Badal,D. W., Cobb, S., and White, P. D., A study ofneurocirculatory asthenia, anxiety neurosis, or ef-fort syndrome. Final report to the Committee onMedical Research of the Office of Scientific Re-search and Development under Contract OEM-CMR-157, 135 pp., 1946.
896