ReactionFlow: an interactive visualization tool for ...
18
RESEARCH Open Access ReactionFlow: an interactive visualization tool for causality analysis in biological pathways Tuan Nhon Dang, Paul Murray, Jillian Aurisano, Angus Graeme Forbes * From 5th Symposium on Biological Data Visualization Dublin, Ireland. 10-11 July 2015 Abstract Background: Molecular and systems biologists are tasked with the comprehension and analysis of incredibly complex networks of biochemical interactions, called pathways, that occur within a cell. Through interviews with domain experts, we identified four common tasks that require an understanding of the causality within pathways, that is, the downstream and upstream relationships between proteins and biochemical reactions, including: visualizing downstream consequences of perturbing a protein; finding the shortest path between two proteins; detecting feedback loops within the pathway; and identifying common downstream elements from two or more proteins. Results: We introduce ReactionFlow, a visual analytics application for pathway analysis that emphasizes the structural and causal relationships amongst proteins, complexes, and biochemical reactions within a given pathway. To support the identified causality analysis tasks, user interactions allow an analyst to filter, cluster, and select pathway components across linked views. Animation is used to highlight the flow of activity through a pathway. Conclusions: We evaluated ReactionFlow by providing our application to two domain experts who have significant experience with biomolecular pathways, after which we conducted a series of in-depth interviews focused on each of the four causality analysis tasks. Their feedback leads us to believe that our techniques could be useful to researchers who must be able to understand and analyze the complex nature of biological pathways. ReactionFlow is available at https://github.com/CreativeCodingLab/ReactionFlow. Background Understanding complicated networks of interactions and chemical components is essential to solving contempor- ary problems in modern biology, especially in domains such as cancer and systems research [1]. Pathways are essentially subsets of a very large graph; their boundaries are inherently ambiguous, but they are used to limit the scope of analysis. Molecular activation pathways are of critical importance to cancer researchers, who hope to understand - and potentially disrupt - malignant cycles of uncontrolled cellular growth, replication, and mediated cell death [2]. Research in drug development involves determining how proteins affected by a drug in turn affect important cellular pathways, and in this domain the downstream consequences of a particular drug effect are especially important [3]. In a separate domain, stem- cell researchers aim at initiating pathways that will preci- pitate a desired cellular differentiation into specific cell types [4]. Researchers who work with pathway data are con- fronted with a number of challenges [5,6]. Pathway files may contain hundreds of proteins and biomolecules (often nested within protein “complexes”) that participate in a variety of reactions. In an abstract sense, reactions can be seen as state transitions with multiple inputs and outputs. Participants can act as inputs or outputs to mul- tiple reactions, and the relationships between reactions inherently include feedback loops. Reactions often have an effect on other reactions, inhibiting or promoting their frequency. These molecular activation pathways are inherently dynamic, which limits the utility of any static * Correspondence: [email protected] Department of Computer Science M/C 152, University of Illinois at Chicago, 851 S. Morgan, Room 1120, Chicago 60607-7053, IL, USA Dang et al. BMC Proceedings 2015, 9(Suppl 6):S6 http://www.biomedcentral.com/1753-6561/9/S6/S6 © 2015 Dang et al. This is an Open Access article distributed under the terms of the Creative Commons Attribution License (http:// creativecommons.org/licenses/by/4.0), which permits unrestricted use, distribution, and reproduction in any medium, provided the original work is properly cited. The Creative Commons Public Domain Dedication waiver (http://creativecommons.org/publicdomain/ zero/1.0/) applies to the data made available in this article, unless otherwise stated.
Transcript of ReactionFlow: an interactive visualization tool for ...

RESEARCH Open Access
ReactionFlow: an interactive visualization tool forcausality analysis in biological pathwaysTuan Nhon Dang, Paul Murray, Jillian Aurisano, Angus Graeme Forbes*
From 5th Symposium on Biological Data VisualizationDublin, Ireland. 10-11 July 2015
Abstract
Background: Molecular and systems biologists are tasked with the comprehension and analysis of incrediblycomplex networks of biochemical interactions, called pathways, that occur within a cell. Through interviews withdomain experts, we identified four common tasks that require an understanding of the causality within pathways,that is, the downstream and upstream relationships between proteins and biochemical reactions, including:visualizing downstream consequences of perturbing a protein; finding the shortest path between two proteins;detecting feedback loops within the pathway; and identifying common downstream elements from two or moreproteins.
Results: We introduce ReactionFlow, a visual analytics application for pathway analysis that emphasizes thestructural and causal relationships amongst proteins, complexes, and biochemical reactions within a given pathway.To support the identified causality analysis tasks, user interactions allow an analyst to filter, cluster, and selectpathway components across linked views. Animation is used to highlight the flow of activity through a pathway.
Conclusions: We evaluated ReactionFlow by providing our application to two domain experts who have significantexperience with biomolecular pathways, after which we conducted a series of in-depth interviews focused on eachof the four causality analysis tasks. Their feedback leads us to believe that our techniques could be useful toresearchers who must be able to understand and analyze the complex nature of biological pathways. ReactionFlowis available at https://github.com/CreativeCodingLab/ReactionFlow.
BackgroundUnderstanding complicated networks of interactions andchemical components is essential to solving contempor-ary problems in modern biology, especially in domainssuch as cancer and systems research [1]. Pathways areessentially subsets of a very large graph; their boundariesare inherently ambiguous, but they are used to limit thescope of analysis. Molecular activation pathways are ofcritical importance to cancer researchers, who hope tounderstand - and potentially disrupt - malignant cycles ofuncontrolled cellular growth, replication, and mediatedcell death [2]. Research in drug development involvesdetermining how proteins affected by a drug in turnaffect important cellular pathways, and in this domain
the downstream consequences of a particular drug effectare especially important [3]. In a separate domain, stem-cell researchers aim at initiating pathways that will preci-pitate a desired cellular differentiation into specific celltypes [4].Researchers who work with pathway data are con-
fronted with a number of challenges [5,6]. Pathway filesmay contain hundreds of proteins and biomolecules(often nested within protein “complexes”) that participatein a variety of reactions. In an abstract sense, reactionscan be seen as state transitions with multiple inputs andoutputs. Participants can act as inputs or outputs to mul-tiple reactions, and the relationships between reactionsinherently include feedback loops. Reactions often havean effect on other reactions, inhibiting or promotingtheir frequency. These molecular activation pathways areinherently dynamic, which limits the utility of any static
* Correspondence: [email protected] of Computer Science M/C 152, University of Illinois at Chicago,851 S. Morgan, Room 1120, Chicago 60607-7053, IL, USA
Dang et al. BMC Proceedings 2015, 9(Suppl 6):S6http://www.biomedcentral.com/1753-6561/9/S6/S6
© 2015 Dang et al. This is an Open Access article distributed under the terms of the Creative Commons Attribution License (http://creativecommons.org/licenses/by/4.0), which permits unrestricted use, distribution, and reproduction in any medium, provided theoriginal work is properly cited. The Creative Commons Public Domain Dedication waiver (http://creativecommons.org/publicdomain/zero/1.0/) applies to the data made available in this article, unless otherwise stated.
graph representation [7]. Representing complexity whilealso enabling researchers to see higher order patterns is asignificant challenge [8].We worked closely over a period of six months with
four computational and molecular biologists to identifyand prioritize visualization tasks that were important tothe biological community. The experts include: a bioin-formatician working at a major cancer research lab(designated by the National Cancer Institute as a Com-prehensive Cancer Center); a graduate student with abackground in both biology and computer science; andtwo professors in a molecular biology department at alarge public university, each running their own researchlab. Our in-depth interviews with these experts led us toidentify four important tasks that were not currentlywell-supported in existing visualization tools for pathwayanalysis. These four tasks each involve reasoning aboutthe causal relationships between proteins and biochem-ical reactions within a pathway. We refer to these ascausality analysis tasks, in which an investigation of howupstream and downstream participants of biochemicalreactions may lead to new understanding of the nature ofthe pathway. The four tasks, described in more detaillater in the paper, include:T1 Visualizing the downstream consequences of per-
turbing a protein or protein complex;T2 Finding the shortest path between two proteins;T3 Detecting feedback loops within the pathway;T4 Identifying common downstream elements from
two or more proteins.Working with the domain experts led us to design and
implement a novel, interactive representation of biologi-cal pathways that emphasizes the causality within thepathway, focusing on the biochemical reactions as the“backbone” of the pathway, and highlighting the flow ofinput and output participants of these reactions throughvarious visual encodings, including animation. Our tool,ReactionFlow, visually separates the inputs and outputsof biochemical reactions within a pathway, and empha-sizes the relationships between reactions. Visual separa-tion of input and output participants helps reveal highlyconnected proteins and complexes which may be of par-ticular importance to understanding the nature of apathway. Perhaps the most useful aspect of Reaction-Flow involves the representation of causality within thepathway, highlighting casual relationships between reac-tions. We use animation as a means to clearly demon-strate the causal relationships in the pathway.To augment the visual representation of the pathway
with a “reaction-centric” view, we enable a variety ofuser interactions that make it easier to search throughproteins, complexes, or reactions (especially useful inlarger pathways), to organize the layout so that reactionsare clustered via a topological ordering algorithm or so
that edge-crossings are minimized, and to control theanimation speed of the flow of activity through thepathway from a selected starting point.The process of developing ReactionFlow was an itera-
tive process that relied on feedback from the fourdomain experts at various stages of the design andimplementation. Many of the ideas that were includedwere first suggested by one of the domain experts, oremerged organically through these conversations withthem. The contributions of this paper are centeredaround the ReactionFlow application and the tasks theyenable:
- We identify four tasks related to understandingcausal relationships within a pathway;- We introduce a novel visualization to enable caus-ality analysis tasks;- We make use of animation to highlight the flow ofactivity through a pathway;- We include mechanisms to search, filter, andorder pathways to more effectively present relevantdata;- We evaluate the effectiveness of our approachthrough interviews with domain experts.
Related workThe visualization of biological pathways is challengingdue to the complex nature of pathway data, as indicatedin the previous section. Given this complexity, publica-tions in molecular biology frequently present biologicalpathways with human-generated figures. Human creatorshave the flexibility to arrange visual elements in waysthat make representations human readable, and this canallow authors to efficiently encode large volumes of com-plex information. The human-generated nature of thesediagrams allows this complex information to be encodedthrough clear spatial layouts, organizing the pathway in ameaningful way.This hand-made approach has been replicated digitally
in public databases available online, such as the KyotoEncyclopedia of Genes and Genomes [9] as well as theReactome Pathway Database [10], allowing for clear com-munication and dissemination of established pathways.Several applications exist, such as Entourage [11], thatadapt these static figures to be interactive. While theseapplications preserve the layout and presentation of path-way information, they have several drawbacks. Creating,updating, or modifying figures is a labor-intensive process,and new data cannot be automatically integrated withexisting figures. Moreover, these human-generated figuresdo not easily scale to large, complex pathways. As a path-way increases in size and complexity, human effort to cre-ate and to comprehend them also increases considerably.These limitations are major problems in a research
Dang et al. BMC Proceedings 2015, 9(Suppl 6):S6http://www.biomedcentral.com/1753-6561/9/S6/S6
Page 2 of 18

community that is continually generating and updatingmolecular pathway data.Several tools exist which automatically produce inter-
active pathway visualizations from structured pathwaydata, rather than relying on layouts generated by hand.The visualizations produced by these tools mimic thestyle and visual encoding of human-generated figures inan attempt to to communicate complex network infor-mation efficiently. As the layout is computed algorithmi-cally, it is easily updated with new data without requiringextra human effort as networks increase in size. Promi-nent examples of this approach include Cytoscape [12],ChiBe [13], and VANTED [14]. Both of these tools loadpathway data that is represented in a standardized for-mat, such as BioPAX [15]. Users can select from severaldifferent layout configurations, and can choose to applycertain visual encodings, such as assigning a color scaleto different protein categories.In addition, ChiBe allows the user to search for pro-
teins of interest, to find relevant pathways, to interac-tively trace paths between entities, and to identifycommon regulators or targets of proteins. Finally, experi-mental data, such as gene expression data or diseaseassociation data, can be overlaid on these networks andencoded through color [11]. These features allowresearchers to relate pathway visualizations to biologicalquestions more directly than with non-interactive path-way diagrams. Cerebral [16], a Cytoscape plugin, includesvisual indications of intercellular context (such as therelative location of the cell wall or nucleus), features thatare often included in human-generated diagrams.VANTED enables the user to dynamically edit the net-work and its layout, and additionally supports the abilityto map experimental data to network elements, to per-form statistical tests, and to cluster data using machinelearning techniques; further analysis can be performedvia FluxMap [17], a VANTED plugin.However, complexity remains a significant challenge
for these applications, particularly with respect to the cri-tical task of viewing causality in a pathway. Pathwayvisualizations show causal direction through directededges from one event to another, allowing researchers toaddress questions about what lies downstream of oneprotein or reaction in a pathway. To see these causal rela-tionships, researchers must trace paths beginning atsome starting point and following directed edges throughthe pathway, but as the number of steps or branches in apathway increases this task becomes cognitivelychallenging.In addition, since these tools mimic the style of path-
way diagrams, they do not abstract away details to cap-ture higher-order patterns. For instance, researchers maywant to use pathway diagrams to understand the impor-tance of a particular protein in a pathway in order to find
suitable targets for drug design. However, critical pro-teins in a pathway may appear in more than one place inthe visualization, perhaps because they are involved inseveral reactions. To see this, the researcher must eitherscan visually or use a search tool to find all instances of aprotein. Multiple instances of one protein are not imme-diately evident from the representation, and can be diffi-cult to find through exploration.Other tools also make use of alternative approaches to
representing networks, such as the transition graphs intro-duced by Pretorius and van Wijk [18], or the interactivebipartite graphs explored by Schulz et al. [19]. Althoughintended for representing text documents, the design ofJigsaw [20] shares some features with ReactionFlow. Jigsawuses a table-style approach to represent entities of onespecific type; related entities that are of different types areconnected by links. However, there are basic differencesdue to specific aspects of pathway datasets. For example,proteins or biomolecules may participate in biochemicalreactions directly or they may first bind together in a com-plex hierarchy before participating. The main visual com-ponent of our application can be thought of as a hybridrepresentation that uses features of network and tablelayouts.
MethodsIn this section, we describe details about our application,ReactionFlow, which provides scalable views of pathwaydata that reduce complexity while retaining importantpathway information relevant for causality analysis tasks.All example biological pathways can be found in the Reac-tome Pathway Database and are encoded using the Bio-PAX format. ReactionFlow was created over the course ofsix months via an iterative development cycle in which wemade changes or added features based mainly on the feed-back from the four domain experts.
Overview of the ReactionFlow applicationFigure 1(a) shows an example of ReactionFlow display-ing several biochemical reactions, in this case using theERK activation pathway. Within this view - whichresembles a parallel coordinates layout - input proteinsare listed on the left, and output proteins are listed onthe right. Input proteins may directly participate in areaction (shown with green links) or they may formcomplexes with other proteins (shown with green links)before participating in a reaction (shown with bluelinks). Complexes are displayed either as blue diamondsor as blue triangles. Triangles represent complexes thatonly appear as inputs or outputs, while diamonds repre-sent complexes that act as both inputs and outputswithin the pathway. Larger triangles/diamonds indicatecomplexes containing more proteins. In the pathwayshown in Figure 1(a), there are 11 biochemical reactions
Dang et al. BMC Proceedings 2015, 9(Suppl 6):S6http://www.biomedcentral.com/1753-6561/9/S6/S6
Page 3 of 18
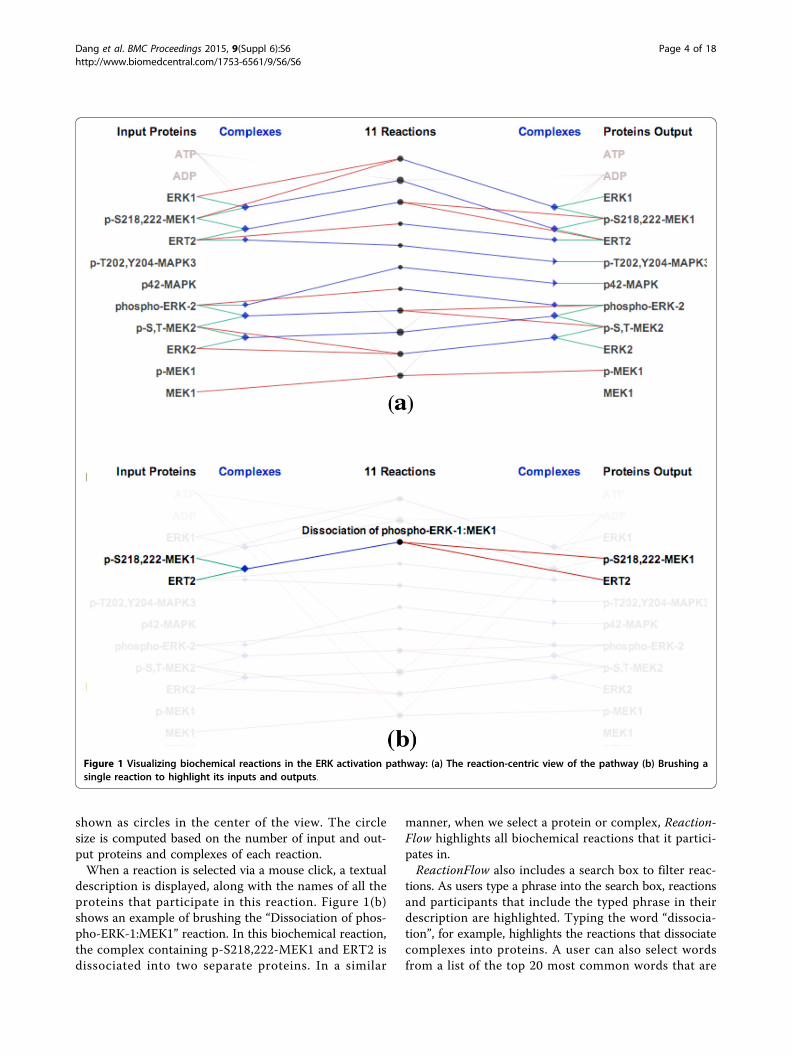
shown as circles in the center of the view. The circlesize is computed based on the number of input and out-put proteins and complexes of each reaction.When a reaction is selected via a mouse click, a textual
description is displayed, along with the names of all theproteins that participate in this reaction. Figure 1(b)shows an example of brushing the “Dissociation of phos-pho-ERK-1:MEK1” reaction. In this biochemical reaction,the complex containing p-S218,222-MEK1 and ERT2 isdissociated into two separate proteins. In a similar
manner, when we select a protein or complex, Reaction-Flow highlights all biochemical reactions that it partici-pates in.ReactionFlow also includes a search box to filter reac-
tions. As users type a phrase into the search box, reactionsand participants that include the typed phrase in theirdescription are highlighted. Typing the word “dissocia-tion”, for example, highlights the reactions that dissociatecomplexes into proteins. A user can also select wordsfrom a list of the top 20 most common words that are
Figure 1 Visualizing biochemical reactions in the ERK activation pathway: (a) The reaction-centric view of the pathway (b) Brushing asingle reaction to highlight its inputs and outputs.
Dang et al. BMC Proceedings 2015, 9(Suppl 6):S6http://www.biomedcentral.com/1753-6561/9/S6/S6
Page 4 of 18

found in the descriptions of biochemical reactions (shownin Figure 2(a)) or in the descriptions of complexes (shownin Figure 2(b)). The arcs in these lists connect terms thatfrequently appear together in descriptions of reactions andparticipants. Hovering over the word “phosphorylates,” forexample, will highlight reactions that are described
containing that term and that therefore involve phosphor-ylation, as shown in Figure 2(c).
Introduction to causality analysis in ReactionFlowOur visualization of biochemical reactions also enablesnew tasks related to the analysis of causality in
Figure 2 Visualizing the RAF cascade pathway: (a) Arcs diagram of popular terms in reaction descriptions (b) Arcs diagram of popularterms in complex descriptions (c) Filtering the reactions containing the word “phosphorylates” in their descriptions.
Dang et al. BMC Proceedings 2015, 9(Suppl 6):S6http://www.biomedcentral.com/1753-6561/9/S6/S6
Page 5 of 18

biological pathways. In ReactionFlow, we have defined a“causal relationship” between two reactions if the outputparticipants of one reaction act as the input to anotherreaction. Causality is therefore a directed relationship,and in our visualizations causality is depicted throughthe use of gradient-filled lines, where direction flowsfrom yellow to black as depicted in Figure 3. In otherwords, reaction 2 is “downstream” of reaction 1.Figure 4 shows a simple example of the “ERK1 activa-
tion” pathway. Figure 4(b) shows 5 causal relationshipsbetween 6 reactions in this pathway. “Downstream”reactions are shown with the gradient-filled arcs, whichflow from yellow to black along the center column ofthe visualization. Significantly, we use animation toemphasize the relationship between multiple inputs andoutputs in chains of biochemical reactions. Figure 5shows downstream animation after selecting a reactionin Figure 5(a). The “MEK1 binds ERK-1” reaction pro-duces ERK1 and p-S218,222-MEK1 complex which thenserves as the input for the second reaction in Figure 5
(b). In the two branches shown in Figure 5(d), only oneof them is continually animated since the other one cre-ates a loop back to the first reaction. Figure 5(f) shows aVCR control metaphor which enables the regulation ofspeed and the mechanism for rewinding the animation.As it is difficult to describe animation in static images,we also invite the reader to refer to the video in oursupplementary materials associated with this paper. Itshould be emphasized that the use of animation isalways optional. In cases where animation introducesvisual clutter, the user can simply disable this feature.As discussed later in this paper, the use of animationwas found to be effective at providing an overview ofthe causal relations within a pathway.Numerous causal arcs are difficult to follow in large
pathways. Figure 6(a) shows all causal relationshipsbetween 19 biochemical reactions in the “RAF cascade”pathway which itself contains the “ERK1 activation”pathway in the previous example. To make it easier tokeep track of visual relationships within the pathway, it
Figure 3 Gradient colors (yellow to black) are used to indicate the “causality” from reaction 1 to reaction 2.
Figure 4 Causality visualization for the ERK1 activation pathway: (a) The reaction-centric view of the pathway (b) The causalrelationships (indicated by the arcs) overlaid on top of the biochemical reactions in the center column.
Dang et al. BMC Proceedings 2015, 9(Suppl 6):S6http://www.biomedcentral.com/1753-6561/9/S6/S6
Page 6 of 18

is helpful to ensure that downstream reactions appearlater in the list. However, this is usually impossiblebecause a reaction can be both downstream andupstream of another reaction, which is very common in
pathway data. To address this, we introduce a modifica-tion to the topological sorting algorithm (i.e., “toposort”)so that it can handle directed cyclic graphs (usually notappropriate when a graph contains directed cycles).
Figure 5 Animation in the ERK1 activation pathway: (a) The first reaction contains the selected protein ERK1 in the input (b) Secondreaction (c) Third reaction (d) Fourth reaction (f) Fifth reaction (e) Animation controllers.
Dang et al. BMC Proceedings 2015, 9(Suppl 6):S6http://www.biomedcentral.com/1753-6561/9/S6/S6
Page 7 of 18
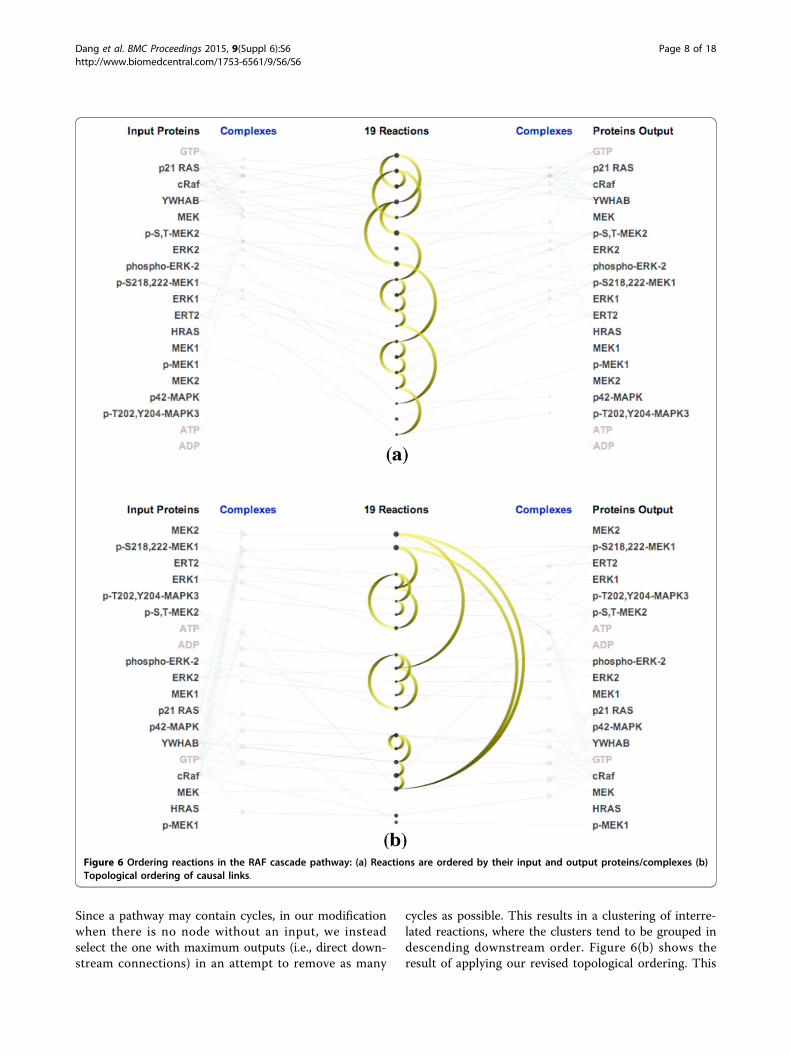
Since a pathway may contain cycles, in our modificationwhen there is no node without an input, we insteadselect the one with maximum outputs (i.e., direct down-stream connections) in an attempt to remove as many
cycles as possible. This results in a clustering of interre-lated reactions, where the clusters tend to be grouped indescending downstream order. Figure 6(b) shows theresult of applying our revised topological ordering. This
Figure 6 Ordering reactions in the RAF cascade pathway: (a) Reactions are ordered by their input and output proteins/complexes (b)Topological ordering of causal links.
Dang et al. BMC Proceedings 2015, 9(Suppl 6):S6http://www.biomedcentral.com/1753-6561/9/S6/S6
Page 8 of 18

ordering reveals interesting structures within the RAFcascade pathway. The first two reactions (“RAF1 phos-phorylates MEK1” and “RAF1 phosphorylates MEK2”)belong to the “RAF phosphorylates MEK” sub-pathway.These reactions generate phosphorylated MEK1 andphosphorylated MEK2 which serve as the inputs for twoother sub-pathways. The first one is the ERK1 activationpathway which contains the next five reactions in thelist. The second one is the ERK2 activation pathwaywhich contains the five next reactions. Notably, ERK1activation pathway and the ERK2 activation pathwayhave identical causal structure. Topological ordering ofreactions also helps to visually reveal feedback loops.Below we describe key tasks relevant for understandingcausality.
Task 1: Visualizing Downstream EffectsViewing the downstream components of a biochemicalreaction in a pathway helps biologists understand how adrug that perturbs a particular protein might also affectother proteins and complexes that participate in down-stream reactions [21].Different proteins play different roles in a pathway. A
few proteins control aspects of an entire pathway whileother proteins are responsible for a small part (a subsetof reactions) in the pathway. For example, the ERK1protein effects the entire ERK1 pathway while ERT2 isonly involved in two reactions. Figure 7 shows examplesof how three different proteins are related to down-stream reactions and participants in the “vitamin andcofactor metabolism” pathway. In ReactionFlow, simplyclicking on any of the biochemical components starts ananimation that highlights the downstream effects from agiven starting point. A user can use the animation toolsdescribed above to play, pause, speed up, slow down, orloop through the downstream effects.
Task 2: Finding the Shortest Path Between ProteinsReactionFlow also provides a tool that highlights theshortest path between two proteins in terms of thenumber of reactions between an input and an output.When users select an input protein, say, for example,cRaf, ReactionFlow displays numbers in front of outputproteins that indicate the minimum number of reactions- the number of biochemical “hops” from cRaf - that areneeded to generate each output protein from theselected starting point. The color of the links in thisview indicate whether steps involve proteins directly(red links) or proteins within a complex (green links).The path from a selected protein to other downstreamproteins can also be animated.Figure 8 shows the shortest path from the protein ERK1 to
other proteins in the ERK1 activation pathway. The anima-tion begins with the first reaction that is ERK1 is an input
into, which ultimately generates the ERK1:p-S218,222-MEK1 complex. We can also reach p-S218,222-MEK1 (asan individual protein) from ERK1 after 3 biochemical reac-tions. We can also see that p-MEK1 and MEK1 are notdownstream participants of the protein ERK1.
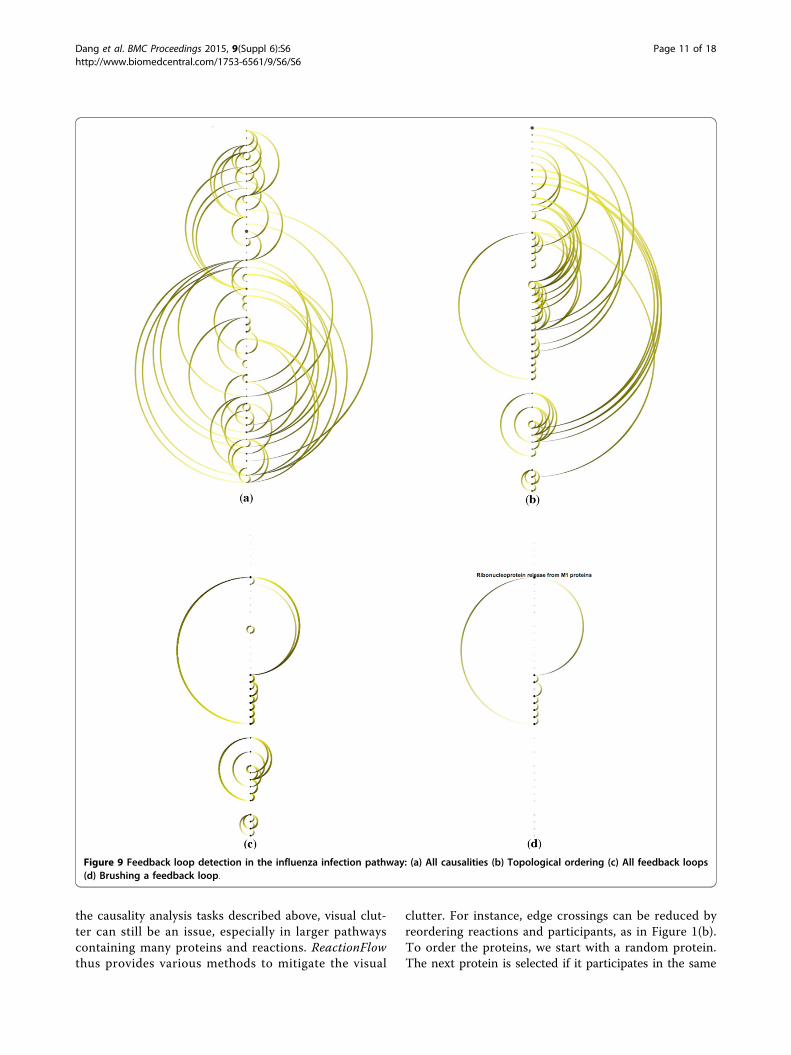
Task 3: Detecting Feedback LoopsWe can also use ReactionFlow to detect feedback loopswithin a pathway. This makes it easier to identify wherecyclical processes are occurring, and thus where pertur-bations in the network influence both downstream andupstream events. Figure 9 shows feedback loops in theinfluenza infection pathway (there are 52 biochemicalreactions in this pathway). In particular, Figure 9(c)shows all feedback loops. Figure 9(d) shows a selectedfeedback loop. The benefits of topological ordering canbe seen by comparing Figure 9(a) to Figure 9(b), wherethe topological ordering in Figure 9(b) helps to revealfeedback loops. When the “feedback loop” mode isenabled (via a button on the application), by default allfeedback loops are shown, and rolling over any of thereactions in the center column highlights only the feed-back loop that reaction is part of (if any).
Task 4: Finding Common Downstream ElementsAn important task for understanding the effects of path-ways involves finding common downstream elementsthat may participate in biochemical reactions. Forinstance, understanding the functionality of pathwaysthrough understanding downstream elements is an activearea of cancer research [22-24]. In some cases drugs donot yet exist that target cancerpromoting proteinsdirectly, but but studying pathway data researchers maydiscover that an existing drug has an indirect influenceon cancer-promoting proteins via downstream effects[21]. In other cases, understanding the complex mechan-isms behind certain cancers requires an understanding ofhow multiple activation pathways interact [24].ReactionFlow provides a “common downstream” func-
tion that highlights all reactions that are “downstream”of two or more input participants. Figure 10 shows anexample of finding common downstream elements onthe “NGF signaling via TRKA” pathway. In particular,Figure 10(b) highlights downstream reactions and theircausal relationships of the NTRK1 protein. Figure 10(c)highlights downstream reactions and their causal rela-tionships of the Atctive TrkA receptor:Phospho-PLCG1complex. Figure 10(d) highlights common downstreamelements (in blue) of the NTRK1 protein and the Atc-tive TrkA receptor:Phospho-PLCG1 complex.
Reducing visual clutterAlthough an aim of ReactionFlow is to simplify thevisual representation of a pathway, especially to aid in
Dang et al. BMC Proceedings 2015, 9(Suppl 6):S6http://www.biomedcentral.com/1753-6561/9/S6/S6
Page 9 of 18
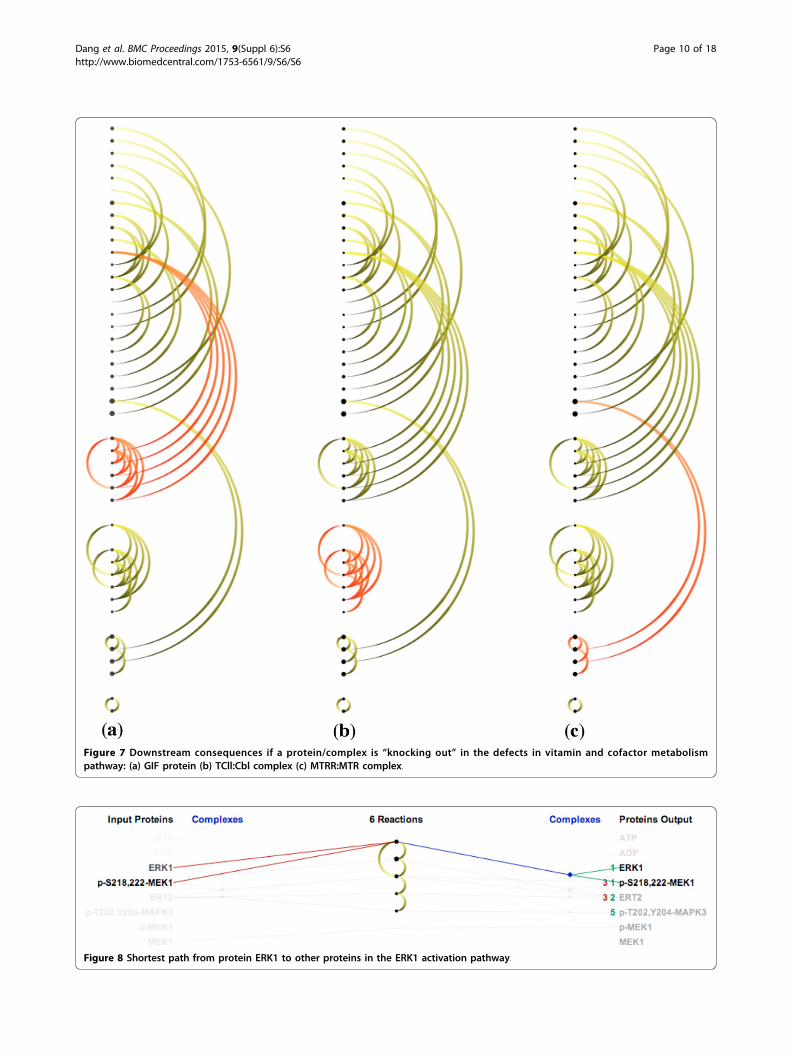
Figure 8 Shortest path from protein ERK1 to other proteins in the ERK1 activation pathway.
Figure 7 Downstream consequences if a protein/complex is “knocking out” in the defects in vitamin and cofactor metabolismpathway: (a) GIF protein (b) TCll:Cbl complex (c) MTRR:MTR complex.
Dang et al. BMC Proceedings 2015, 9(Suppl 6):S6http://www.biomedcentral.com/1753-6561/9/S6/S6
Page 10 of 18
the causality analysis tasks described above, visual clut-ter can still be an issue, especially in larger pathwayscontaining many proteins and reactions. ReactionFlowthus provides various methods to mitigate the visual
clutter. For instance, edge crossings can be reduced byreordering reactions and participants, as in Figure 1(b).To order the proteins, we start with a random protein.The next protein is selected if it participates in the same
Figure 9 Feedback loop detection in the influenza infection pathway: (a) All causalities (b) Topological ordering (c) All feedback loops(d) Brushing a feedback loop.
Dang et al. BMC Proceedings 2015, 9(Suppl 6):S6http://www.biomedcentral.com/1753-6561/9/S6/S6
Page 11 of 18

Figure 10 Example of task 4 on the NGF signaling via TRKA pathway: (a) All causalities (b) Downstream elements of the NTRK1protein (c) Downstream elements of the Atctive TrkA receptor:Phospho-PLCG1 complex (d) Common downstream elements of theNTRK1 protein and the Atctive TrkA receptor:Phospho-PLCG1 complex.
Dang et al. BMC Proceedings 2015, 9(Suppl 6):S6http://www.biomedcentral.com/1753-6561/9/S6/S6
Page 12 of 18

reaction and/or the same complex with the current pro-tein. This selection criteria make sure that proteins inthe same complex/reaction are placed next to eachother. Consequently, this helps to reduce edge crossings.In the next example, we use a larger pathway, NGF
signaling via TRKA from the plasma membrane path-way containing over a hundred biochemical reactions.Figure 11(a) shows the random order of proteins andreactions. A user can organize proteins in the samecomplex or reaction so that they remain close together,as in Figure 11(b), significantly reducing edge crossings.Users also have options to “fade out” a specified type(or types) of links in order to make the visualizationappear less cluttered, as depicted in Figure 11(c), wherethe reaction links are tapered and rendered with a lowopacity.Regarding the issue of clutter, we compare Reaction-
Flow to other popular tools. Cytoscape featuresadvanced layout algorithms that can minimize edgecrossings. Nonetheless, even a medium-sized pathwaynetwork, such as HIV life cycle which contains 206 pro-teins and molecules, 184 complexes, connected via 112biochemical reactions, demonstrates visual clutter dueto link crossing. ChiBE 2 avoids the issue of edge cross-ing by introducing duplicates of proteins if necessary.However, this makes it more difficult to keep track ofreactions involving a selected protein or protein com-plex (although ChiBE 2 mitigates this somewhat byusing different colors to encode proteins). Another pro-blem with node duplication is that for a set of n pro-teins there may be, at least potentially, up to 2n
complexes, greatly increasing the scale of the network.Figures 12(a) and 12(b) show screenshots of these toolsdisplaying the HIV life cycle. Since ReactionFlow pushesproteins and complexes participating into the samereactions together, Figures 12(c) presents two disjointset of reactions which are not obvious in ChiBE 2. Thelower reaction set is associated to the early phrase ofHIV life cycle while the upper reaction set is associatedto the late phrase of reaction HIV life cycle.The right panel of Figures 12 shows another example
of these tools on a larger input data, the signaling toGPCR pathway. GPCRs stands for G proteinlinkedreceptors, also known as seven-transmembrane domainreceptors. GPCRs are the largest receptor superfamily(with more than 800 G-protein coupled receptor) andalso the largest class of drug targets [25]. This pathwaycontains 413 proteins and molecules, 389 complexes,connected via 292 biochemical reactions. As depicted inthe screenshot of ReactionFlow shown in Figure 12(c),most inputs of biochemical reactions in this pathway areindividual proteins (red links) while most outputs arecomplexes (blue links). In other words, these are bindingreactions of proteins and molecules to form complexes.
Figure 11 Visualizing the NGF signaling via TRKA pathway:(a) Random order (b) Order proteins by their reaction/complexparticipations to minimize edge crossings (c) Fading outreaction links.
Dang et al. BMC Proceedings 2015, 9(Suppl 6):S6http://www.biomedcentral.com/1753-6561/9/S6/S6
Page 13 of 18
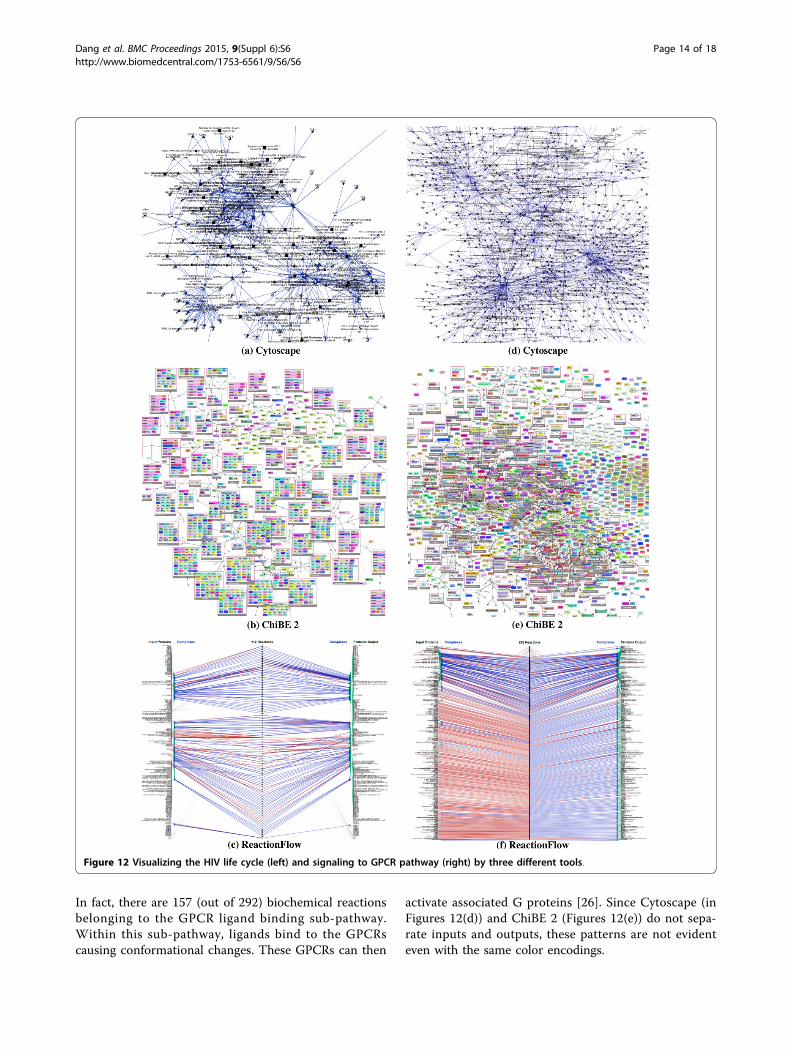
In fact, there are 157 (out of 292) biochemical reactionsbelonging to the GPCR ligand binding sub-pathway.Within this sub-pathway, ligands bind to the GPCRscausing conformational changes. These GPCRs can then
activate associated G proteins [26]. Since Cytoscape (inFigures 12(d)) and ChiBE 2 (Figures 12(e)) do not sepa-rate inputs and outputs, these patterns are not evidenteven with the same color encodings.
Figure 12 Visualizing the HIV life cycle (left) and signaling to GPCR pathway (right) by three different tools.
Dang et al. BMC Proceedings 2015, 9(Suppl 6):S6http://www.biomedcentral.com/1753-6561/9/S6/S6
Page 14 of 18
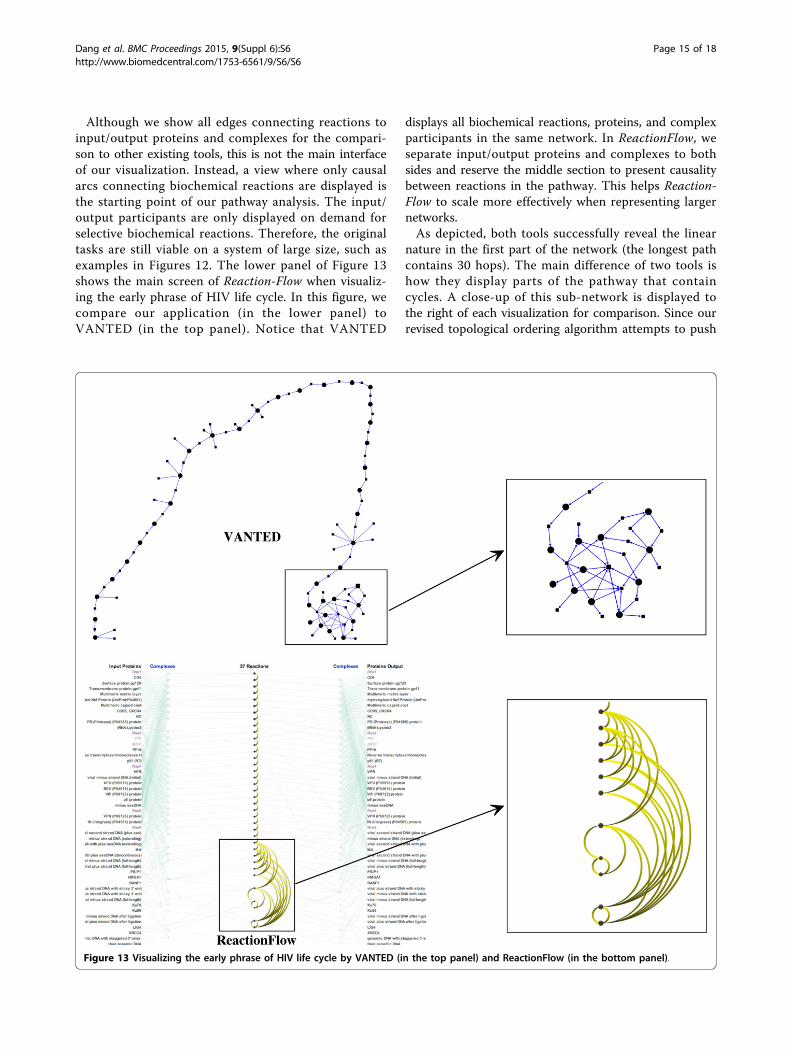
Although we show all edges connecting reactions toinput/output proteins and complexes for the compari-son to other existing tools, this is not the main interfaceof our visualization. Instead, a view where only causalarcs connecting biochemical reactions are displayed isthe starting point of our pathway analysis. The input/output participants are only displayed on demand forselective biochemical reactions. Therefore, the originaltasks are still viable on a system of large size, such asexamples in Figures 12. The lower panel of Figure 13shows the main screen of Reaction-Flow when visualiz-ing the early phrase of HIV life cycle. In this figure, wecompare our application (in the lower panel) toVANTED (in the top panel). Notice that VANTED
displays all biochemical reactions, proteins, and complexparticipants in the same network. In ReactionFlow, weseparate input/output proteins and complexes to bothsides and reserve the middle section to present causalitybetween reactions in the pathway. This helps Reaction-Flow to scale more effectively when representing largernetworks.As depicted, both tools successfully reveal the linear
nature in the first part of the network (the longest pathcontains 30 hops). The main difference of two tools ishow they display parts of the pathway that containcycles. A close-up of this sub-network is displayed tothe right of each visualization for comparison. Since ourrevised topological ordering algorithm attempts to push
Figure 13 Visualizing the early phrase of HIV life cycle by VANTED (in the top panel) and ReactionFlow (in the bottom panel).
Dang et al. BMC Proceedings 2015, 9(Suppl 6):S6http://www.biomedcentral.com/1753-6561/9/S6/S6
Page 15 of 18
the downstream arcs to the right of the reactions, everyarc on the left potentially creates a feedback loop. Inthis example, we can easily detect the feedback loopsassociated with these arcs; the same information is notas easy to discern in VANTED without further analysis.Following the recommendation given in a user studyconducted by Holten and van Wijk [27], our use oftapered edges also helps to emphasize directionality.
Implementation and requirementsReactionFlow is implemented in Java and built on top ofProcessing framework. It is cross-platform, with a mini-mum requirement of Java 7. ReactionFlow uses Paxtools[28] for managing BioPAX data. The application, sourcecode, and sample data are provided via our Githubrepository, located at https://github.com/CreativeCodin-gLab/ReactionFlow.
Results and discussionWe presented ReactionFlow to two domain experts, one amolecular biologist and the other a systems biologist,both active researchers highly familiar with particularfamilies of biological pathways that they investigate intheir research. We conducted in depth, in person inter-views regarding the relevance of our approach to theirresearch tasks, and specifically asked them to carry outeach of the four causality analysis tasks. Additionally, werecorded comments about the user interaction and theanimation. We also provided a link to the application sothat the experts could download the application to theirown computers and explore it more at their leisure. Wefurther solicited detailed feedback via email regardingspecific functionality related to causality analysis tasks, aswell asking for more general feedback about the usabilityof each of the visualization tools and for suggestionsabout other features that could be of importance to theirresearch and to other experts in their field.While we regard this as only first step toward a com-
prehensive, empirical evaluation of our application andthe main visualization techniques it features, we arealready encouraged by the positive expert feedback. Forinstance, both of the experts were excited about how werepresented causality. One of them told us: “The causal-ity mapping is very cool. I’ve not seen anything like itbefore, and I can see it being very useful.” The othernoted that the software was surprisingly user-friendlyfor a prototype application, and appreciated “the causal-ity connecting upstream/downstream reactions and theanimation showing each reaction input/output.” One ofthe experts characterized one aspect of his work as“making hypotheses” about the downstream effects ofintroducing new variables into a pathway, and appre-ciated that he could quickly mouse over proteins andprotein complexes to find the shortest path from an
input to output proteins. This expert also provided uswith suggestions for additional functionality for Reac-tionFlow, including the ability to load in multiple path-ways simultaneously, and also the option to manuallyselect and cluster a group of proteins in order to quicklydeclutter the view, hiding information less relevant totesting a hypothesis.One of the experts commented explicitly on the unu-
sual layout, mentioning that he was used to seeing path-ways organized as node-link diagrams and saying that“the difficulties in this layout could be with the under-standing the flow from left to right, but the animationhelps you see how the pathway is organized.” After theinitial interview, this expert wrote us further commentsabout the animation: “Animating the flow of biochem-ical reactions is very useful for understanding causalityin the network. Flexible control of that animation isessential, because networks have very different levels ofcomplexity, so some can be viewed quickly, but othersmust be slowly stepped through.” We also asked theexperts to comment on the specific tasks. In response toa question for feedback on Task 1, one expert comparedour visualization positively to the “gold-standard” ofhand-drawn diagrams: “I like hand-drawn diagramsbecause there is an order... and [ReactionFlow ] helpscapture some of that, which can be lost in some net-work layouts. Once you figure out what’s going on thistool seems more intuitive.” When pressed on how aninteractive layout could better support the ordering inhand-drawn diagrams, he replied: “You can’t completelyavoid the complexity - it’s inherent. But it’s good to getdifferent views that give you some more informationfrom a different perspective.”Regarding Task 2, one expert found out implementa-
tion a bit confusing, even after explanations of how itworked. Based on his evaluation, we plan to clarify thevisual encoding in a future version of the application.The other expert didn’t have trouble understanding thetask, but told us that it didn’t correspond to his interpre-tation of what it meant to find the shortest path: “I’d liketo be able to click on two proteins and see the shortestpath between them.” In our current implementation, theuser clicks on a single protein, and all downstream com-ponents are highlighted, with a number appearing toindicate how many “hops” away it is from the selectedprotein. The expert thought that provided too muchinformation and was perhaps too similar to Task 1.Both experts found Task 3 straightforward and easily
to understand, and both commented on the importanceof identifying feedback loops across multiple pathways, afeature we plan to include in later versions. RegardingTask 4, both experts remarked that it was useful to seewhich biochemical reactions are “common downstream”components from multiple proteins. One expert told us
Dang et al. BMC Proceedings 2015, 9(Suppl 6):S6http://www.biomedcentral.com/1753-6561/9/S6/S6
Page 16 of 18

that one main component of his research was preciselyrelated to this task, which was difficult to visualize inother tools without extensive manual curation: “Some-times I am interested in understanding how multipleupstream input signals are integrated to drive cellularresponses.” The other expert also described the useful-ness of Task 4: “Families of related proteins are com-mon in human biology. These proteins often sharemany reactions, but differ in a few key reactions. A viewthat highlights these commonalities and differences isvery useful to parse out these subtleties.”We also asked the experts to point out any other fea-
tures of ReactionFlow which they found to be eithereffective or ineffective. Both appreciated the grouping ofreactions using the topological ordering. One expertnoted “it helps to organize the reactions into modulesfor cleaner layout and visualization.” The other also toldus: “A key use for pathway representations is to quicklygrasp causality. The topological ordering helps a greatdeal in this by clustering groups of closely relatedreactions.”Both experts noted that they thought that node-link
diagrams, though imperfect in many ways, nonethelesswere a more familiar representation for pathways andwondered if that would make it difficult for our tool tobe adopted by other biologists. Again, they also bothsuggested as an obvious next step that we make it possi-ble to load in multiple pathways and moreover then beable to easily remove the elements that were not rele-vant to them, so as not to overwhelm the visualizationwith too much information. One expert was initiallyconfused about the use of arcs to indicate relationshipsin the search terms, since it seemed to clash with themain use of the arcs to illustrate causality between bio-chemical reactions.Despite these concerns, both experts were highly posi-
tive about the ability to observe and reason about thecausality within a pathway. One of the experts alsorepeatedly expressed his appreciation that our toolemphasized the biochemical reactions within the path-way, since that was a main interest in his own research,and since other visualizations he had used sometimesmade it difficult to see only the reactions.
ConclusionsReactionFlow presents an alternative visual representa-tion of biological pathways, not found in other visualiza-tion tools. Our visualization enables a series of noveltasks related to finding patterns within a pathway and tothe analysis of causal mechanisms involving proteinsand biochemical reactions. Enabling these tasks ispotentially very useful to biologists and cancer research-ers, as it provides with a means to more deeply under-stand aspects of biological pathways, such as the
downstream connections related to a specific proteincomplex, or quickly identifying feedback loops.Our interviews with domain experts show that our
visualization techniques, and especially our ability torepresent causality in different ways, have the potentialto be useful to the larger community of researchersinvestigating biological pathways. Although we areencouraged by the positive feedback, we have alreadyidentified areas for future investigation. For instance,although this paper focuses largely on an alternativerepresentation to a node-link diagram, we believe that itmay be possible to present our visualization techniquesalongside (instead of in replacement of) a node-link dia-gram. Although one advantage of our representations isthat they are less cluttered than node-link representa-tions, we plan to further investigate the scalability of oursystem and to explore other ways of interactively com-pressing or expanding parts of the pathway as needed,something that may prove important for very large path-ways containing more than a few dozen reactions.Finally, as suggested by the interviews with domainexperts, we plan to explore ways of visualizing multiplepathways simultaneously. A future aim is to enable biol-ogists to understand not just the functionality of a singlepathways, but also to help clarify how each pathwayfunctions within a forest of pathways.
Competing interestsThe authors declare that they have no competing interests.
Authors’ contributionsTND, PM, JA, and AGF conceived of the interactive visualization techniqueand its application to biological pathways. JA provided insight into thedatasets used during the development of the technique and TND, PM, JA,and AGF investigated related work. TND and AGF determined the causalityanalysis tasks through interviews with domain experts. TND designed andimplemented all aspects of the prototype visualization tool and providedthe comparison to existing tools. TND, PM, JA, and AGF drafted, read, andapproved the final manuscript.
AcknowledgementsWe thank Guang Yao and Ryan Gutenkunst who provided useful insight intobiological pathways and emphasized the importance of representingcausality when analyzing pathways. We also thank Emek Demir and TamaraMunzner for providing useful feedback on our design choices during thedevelopment of this application. This work was funded by the DARPA BigMechanism Program under ARO contract WF911NF-14-1-0395.
DeclarationsThis publication is supported by the DARPA Big Mechanism Program underARO contract WF911NF-14-1-0395.This article has been published as part of BMC Proceedings Volume 9Supplement 6, 2015: Proceedings of the 5th Symposium on Biological DataVisualization: Part 2. The full contents of the supplement are available onlineat http://www.biomedcentral.com/bmcproc/supplements/9/S6.
Published: 13 August 2015
References1. Hanahan D, Weinberg RA: Hallmarks of cancer: the next generation. Cell
2011, 144(5):646-674.
Dang et al. BMC Proceedings 2015, 9(Suppl 6):S6http://www.biomedcentral.com/1753-6561/9/S6/S6
Page 17 of 18

2. Cairns RA, Harris IS, Mak TW: Regulation of cancer cell metabolism. NatureReviews Cancer 2011, 11(2):85-95.
3. Luo J, Manning BD, Cantley LC: Targeting the pi3k-akt pathway in humancancer-rationale and promise. Cancer Cell 2003, 4(4):257-262.
4. Reya T, Morrison SJ, Clarke MF, Weissman IL: Stem cells, cancer, andcancer stem cells. Nature 2011, 414(6859):105-111.
5. Albrecht M, Kerren A, Klein K, Kohlbacher O, Mutzel P, Paul W, Schreiber F,Wybrow M: On open problems in biological network visualization. InGraph Drawing Lecture Notes in Computer Science. Volume 5849. Springer;Eppstein, D., Gansner, E 2010:256-267.
6. Kerren A, Schreiber F: Network visualization for integrative bioinformatics.In Approaches in Integrative Bioinformatics. Springer;Chen, M., Hofestädt, R2014:173-202.
7. Kitano H: Systems biology: a brief overview. Science 2002,295(5560):1662-1664.
8. Saraiya P, North C, Duca K: Visualizing biological pathways: requirementsanalysis, systems evaluation and research agenda. InformationVisualization 2005, 4(3):191-205.
9. Dubitzky W, Wolkenhauer O, Cho KH, Yokota H: Encyclopedia of SystemsBiology 2013.
10. Croft D, Mundo AF, Haw R, Milacic M, Weiser J, Wu G, et al: The reactomepathway knowledgebase. Nucleic Acids Research 2014, 42(D1):D472-D477.
11. Lex A, Partl C, Kalkofen D, Streit M, Gratzl S, Wassermann AM, et al:Entourage: Visualizing relationships between biological pathways usingcontextual subsets. Visualization and Computer Graphics, IEEE Transactions2013, 19(12):2536-2545.
12. Shannon P, Markiel A, Ozier O, Baliga NS, Wang JT, Ramage D, et al:Cytoscape: a software environment for integrated models ofbiomolecular interaction networks. Genome Research 2003,13(11):2498-2504.
13. Babur O, Dogrusoz U, Demir E, Sander C: Chibe: interactive visualizationand manipulation of biopax pathway models. Bioinformatics 2010,26(3):429-431.
14. Junker B, Klukas C, Schreiber F: Vanted: A system for advanced dataanalysis and visualization in the context of biological networks. BMCBioinformatics 2006, 7(1):109.
15. Demir E, Cary MP, Paley S, Fukuda K, Lemer C, Vastrik I, et al: The biopaxcommunity standard for pathway data sharing. Nature Biotechnology2010, 28(9):935-942.
16. Barsky A, Gardy JL, Hancock RE, Munzner T: Cerebral: a cytoscape pluginfor layout of and interaction with biological networks using subcellularlocalization annotation. Bioinformatics 2007, 23(8):1040-1042.
17. Rohn H, Hartmann A, Junker A, Junker B, Schreiber F: Fluxmap: A vantedadd-on for the visual exploration of flux distributions in biologicalnetworks. BMC Systems Biology 2012, 6(1):33.
18. Pretorius AJ, van Wijk JJ: Visual inspection of multivariate graphs.EuroVis’08 Proceedings of the 10th Joint Eurographics / IEEE - VGTC conferenceon Visualization8 2008, 967-974.
19. Schulz HJ, John M, Unger A, Schumann H: Visual analysis of bipartitebiological networks. EG VCBM’08 Proceedings of the First Eurographicsconference on Visual Computing for Biomedicine 2008, 135-142.
20. Stasko J, Görg C, Liu Z: Jigsaw: Supporting investigative analysis throughinteractive visualization. Information Visualization 2008, 7(2):118-132.
21. Pourdehnad M, Truitt ML, Siddiqi IN, Ducker GS, Shokat KM, Ruggero D:Myc and mtor converge on a common node in protein synthesis controlthat confers synthetic lethality in myc-driven cancers. Proceedings of theNational Academy of Sciences 2013, 110(29):11988-11993.
22. Shahbazian D, Roux PP, Mieulet V, Cohen MS, Raught B, Taunton J, et al:The mtor/pi3k and mapk pathways converge on eif4b to control itsphosphorylation and activity. EMBO J 2006, 25(12):2781-2791.
23. Zheng H, Ying H, Yan H, Kimmelman A, Hiller D, Chen AJ, Perry S, Tonon G,Chu G, Ding Z, et al: Pten and p53 converge on c-myc to controldifferentiation, self-renewal, and transformation of normal andneoplastic stem cells in glioblastoma. Cold Spring Harb Symp Quant Biol2008, 73:427-437.
24. Wilkinson DS, Barton MC: Tumor suppressors p53 and tgfβ converge toregulate the alpha-fetoprotein oncodevelopmental tumor marker. InTransforming Growth Factor-b in Cancer Therapy. Volume II. Springer;2008:309-320.
25. Fredriksson R, Lagerstrom MC, Lundin LG, Schioth HB: The G-protein-coupled receptors in the human genome form five main families.
Phylogenetic analysis, paralogon groups, and fingerprints. MolecularPharmacology 2003, 63(6):1256-1272.
26. Gether U, Asmar F, Meinild AK, Rasmussen SGF: Structural basis foractivation of G-protein-coupled receptors. Pharmacology and Toxicology2002, 91(6):304-312.
27. Holten D, van Wijk JJ: A user study on visualizing directed edges ingraphs. CHI ‘09 Proceedings of the SIGCHI Conference on Human Factors inComputing Systems 2009, 2299-2308.
28. Demir E, Babur Ö, Rodchenkov I, Aksoy BA, Fukuda KI, Gross B, et al: Usingbiological pathway data with paxtools. PLoS Computational Biology 2013,9(9):1003194.
doi:10.1186/1753-6561-9-S6-S6Cite this article as: Dang et al.: ReactionFlow: an interactive visualizationtool for causality analysis in biological pathways. BMC Proceedings 20159(Suppl 6):S6.
Submit your next manuscript to BioMed Centraland take full advantage of:
• Convenient online submission
• Thorough peer review
• No space constraints or color figure charges
• Immediate publication on acceptance
• Inclusion in PubMed, CAS, Scopus and Google Scholar
• Research which is freely available for redistribution
Submit your manuscript at www.biomedcentral.com/submit
Dang et al. BMC Proceedings 2015, 9(Suppl 6):S6http://www.biomedcentral.com/1753-6561/9/S6/S6
Page 18 of 18