Re-visiting Monitoring Protocols For Wetland Restoration
54
Re-visiting Monitoring Protocols For Wetland Restoration LCEP Science Work Group Meeting, Dec 18, 2019 Sarah Kidd, Sneha Rao Manohar Batwater Slough 2019
Transcript of Re-visiting Monitoring Protocols For Wetland Restoration

Re-visiting Monitoring Protocols For Wetland Restoration
LCEP Science Work Group Meeting, Dec 18, 2019
Sarah Kidd, Sneha Rao Manohar
Batwater Slough 2019

Purpose: Continue to the discussion of updating and adding to the original 2009 monitoring protocols.
Providing technical recommendations for monitoring the following parameters:
• Soil Conditions - LCEP• Sediment Accretion and Erosion –LCEP• Channel Cross-Sections - CLT• Water Surface Elevation & Temp - LCEP
Future Discussions: Fish & Macroinvertebrate Monitoring, UAV Data Collection, Data Management and Analysis

Purpose: Continue to the discussion of updating and adding to the original 2009 monitoring protocols.
October 2018 we published updates to the WSE and Temp ProtocolsYou can download them here https://bit.ly/2LYGm6w

Soil Monitoring
LCEP Science Work Group Meeting, Dec 18, 2019
Sarah Kidd,
Sneha Rao Manohar
Wallooskee Wetland 2015

WhyMonitor
Soil
Wetland Restoration (reintroduction of flooding or shift in flooding regime) dramatically alters soil conditions, creating the template for which new wetland plant communities will grow and develop overtime.
Soil is a critical component of any ecosystem• In wetlands the biogeochemistry of the soil drives many
wetland functions such as nutrient retention, seed germination, and plant growth
Rudy Lake 2018

WhyMonitor
Soil
Monitoring Soil Conditions Pre and Post Restoration can provide information on why or why not the plant communities are recovering as expected. Quick Resources for Tidal Wetland Soil Monitoring:
Zedler 2000, Seybold et al. 2002, Kidd 2017

What to Monitor
In the Field
• Soil Texture→ Sandy, Silty, Loam – these textures can
influence conditions and plant growth→ Soil Color is an indicator of hydric soil
conditions (Gleying and Mottling)
Photo Credit: http://nesoil.com/images/redox.htm
Gray soils indicate
chemical reduction of
iron and/or manganese
due to wetness and
lack of oxygen.

What to Monitor
In the Field
• pH → Is the soil too acidic or basic?
• Salinity/Conductivity → How has soil salinity changed?
Image Credit: https://www.soils.org/ Photo Credit: Sarah Kidd, Steamboat Slough 2013

What to Monitor
In the FieldHydric soil (develops with lack of O2) – Rate of O2 diffusion into soil dramatically reduced when soil is saturated with water. This can be measured as soil ORP – Oxygen Reduction Potential.
All Photos: Sarah Kidd – Colewort Creek – Astoria, Oregon – Sept 2015
This is an indicator of duration and timing of soil flooding – and these conditions can determine which plant communities can germinate and grow

What to Monitor
In the FieldSoil ORP – Oxygen Reduction Potential
Multiple soil and hydrologic metrics informplant community development, howeverpreliminary tidal wetland field data indicate a clear zonation based on observed soil ORP conditions
Restored Fresh Tidal Wetland Zonation
Methane =

What to Monitor
In the FieldSoil ORP – Oxygen Reduction Potential
Reed Canarygrass
Mudflat, Ponding, Aquatic sp
Native Emergent sp
Multiple soil and hydrologic metrics informplant community development, howeverpreliminary tidal wetland field data indicate a clear zonation based on observed soil ORP conditions
Restored Fresh Tidal Wetland Zonation
Methane =

FieldEquipment
• Extech ORP Meter• Extech Salinity, pH meter• For sites with more saline
influence – a refractometer can be used (Pore-water soil salinity)
Photo Sarah Kidd - Wallooskee Site, 2017

What to Monitor
In the Lab
• Bulk Density, Organic Matter Composition, Carbon, Nutrients (N, P etc.), and Mineral Composition, etc.
• Baseline Reference Conditions have been Established in Reference Wetlands through the EMP program (EMP 2019)
These are also important soil metrics that should be considered when monitoring restoration outcomes - however they do involve field collection and lab assessment

Current Practice
Field EMP Reference Sites & Level 2 AEMR Sites, Conducted Along Side of Vegetation Monitoring
Lab EMP Reference Sites, Soil Collected with Biomass and Vegetation Samples
pH Bulk Density
Salinity/Conductivity Organic Matter
ORPCarbon, Nitrogen,
Phosphorus Content
Texture/Color(to be added)
Texture

Next Steps &Understanding
Results
In the Office • Publish/Share Protocols • Take all collected data and develop thresholds
associated with plant community development and recovery• Use data to help explain why or why not
wetland plant community recovery is occurring across sites
Utilize soil and plant community data to set-up Blue Carbon Study – looking at methane and carbon emissions and storage across LCE wetlands.
Kidd 2019

Sediment Accretion and Erosion Monitoring
LCEP Science Workgroup Meeting
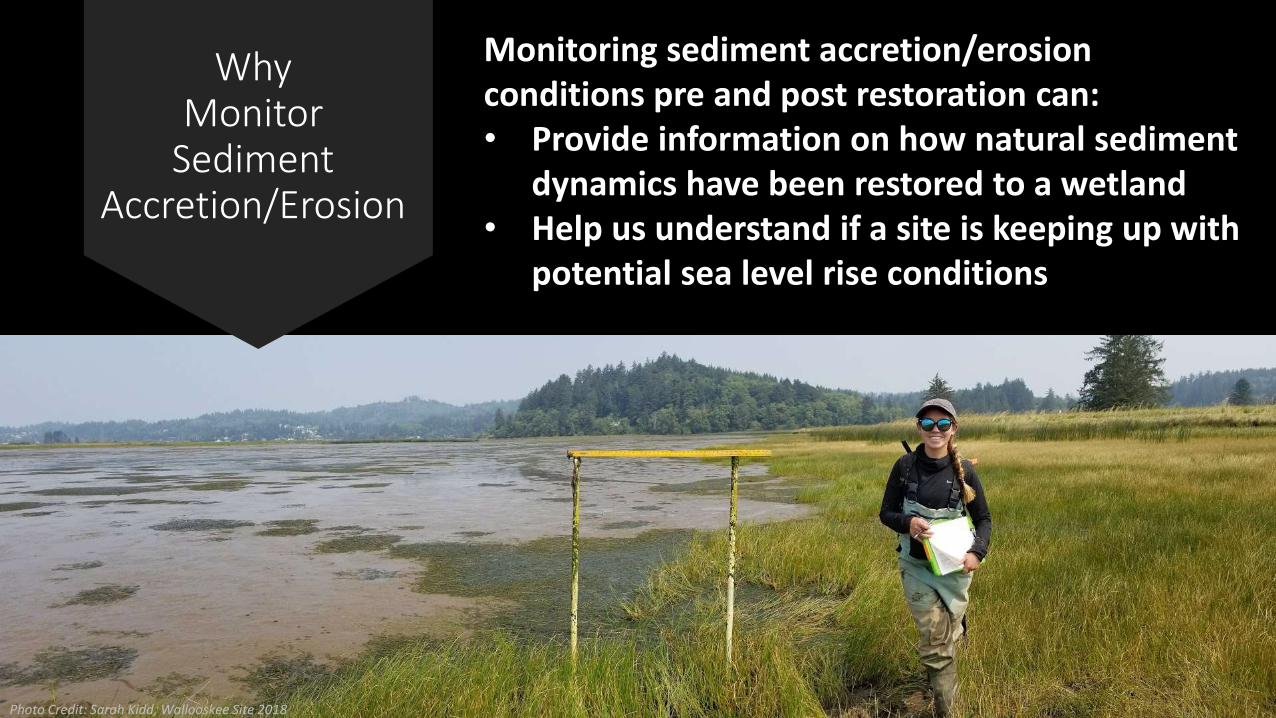
WhyMonitor
Sediment Accretion/Erosion
Monitoring sediment accretion/erosion conditions pre and post restoration can:• Provide information on how natural sediment
dynamics have been restored to a wetland• Help us understand if a site is keeping up with
potential sea level rise conditions
Photo Credit: Sarah Kidd, Wallooskee Site 2018

WhyMonitor Sediment Accretion/Erosion
• Existing data has shown that sediment accretion/erosion can be very dynamic.
• This variability indicates that to get generalizable results we need to increase the amount of data collected.
Taken from SM2 2018

WhyMonitor
Sediment Accretion/Erosion
What influences Sediment Accretion/Elevation within a Tidal Wetland Site?
Photo Credit: Sarah Kidd, Wallooskee 2019

What influences Sediment Accretion/Elevation within a Tidal Wetland Site?
• Topography
→ Elevation and Distance from Main Channel
• Hydrology
→ Frequency, Depth, Velocity of Flooding
• Vegetation and Soil
→ Vegetation Type, Cover, Soil Exposed, Soil Texture, Soil Compaction
• Disturbance
→ Storm Activity/High Flow, Animal Activity (Cattle, Elk, Deer, Rodents, Carp) – Exposing Soil etc.,
• Availability of sediment flowing in/out of site
WhyMonitor
Sediment Accretion/Erosion

Best PracticesSediment
BenchMonitoring
Number and Distribution of Sediment Accretion/Erosion Benches Across a Site
• Multiple Sed Benches Located Across SeveralElevation Gradients in Areas of Interest
• Pre-restoration use restoration plans to install where possible, post-restoration placement in areas heavily graded
Emergent
Aquatic/Mudflat
High Marsh
X 3 across area of interest, Which is 3 benches at each elevation = 9 benches total
Suggested Ideal Minimum Distribution of Sed Benches

Best PracticesSediment
BenchMonitoring
How to install

Best PracticesSediment
BenchMonitoring
How to install
1 Meter Apart, LEVEL ~75 cm tall, Shorter can make it difficult to find
Install on Level Ground
~75 cm or more into the ground
Materials:• 1 inch conduit pipe, 5 ft+ long• Level: 120+ cm long • 2 Meter Sticks or Bendy Rulers• Compass• Mallet• Design Plans• RTK/GPS Unit
Best PracticesSediment
BenchMonitoring
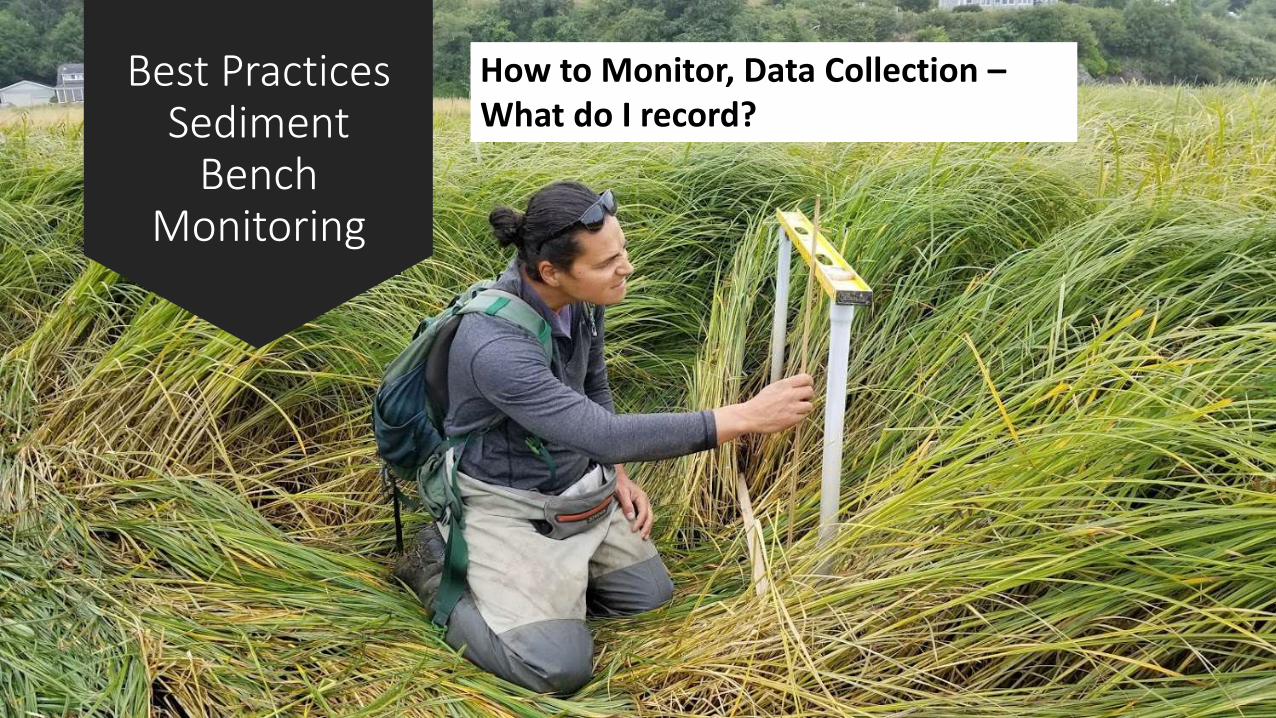
How to Monitor, Data Collection –What do I record?

Best PracticesSediment
BenchMonitoring
How to Monitor, Data Collection –What do I record?
• Bring your notes from the last time you came out to measure the sed bench
• Bring a buddy
• Accuracy and Precision comparable to SET if care is taken (Nolte et al. 2012)

Best PracticesSediment Bench
Monitoring
How to Monitor, Data Collection –What do I record?
North Pin:
N E S W 10 20 30 40 50 60 70 80 90 100 N E S W
South Pin:
N
E
S
W
• Start by measuring all 4 sides of each PVC Sediment Pin (bring a compass)
N
E
S
W

Best PracticesSediment Bench
Monitoring
How to Monitor, Data Collection –What do I record?
North Pin:
N E S W 10 20 30 40 50 60 70 80 90 100 N E S W
South Pin:
N
E
S
W
N
E
S
W
• Start by measuring all 4 sides of each PVC Sediment Pin (bring a compass)
• It can help to place a meter stick on the ground – to line up with the level

Best PracticesSediment Bench
Monitoring
How to Monitor, Data Collection –What do I record?
North Pin:
N E S W 10 20 30 40 50 60 70 80 90 100 N E S W
South Pin:
N
E
S
W
N
E
S
W
• Always measure from the ground to the top of the PVC – bottom of level (NOT to an arbitrarily place on the level etc).

Best PracticesSediment Bench
Monitoring
How to Monitor, Data Collection –What do I record?
North Pin:
N E S W 10 20 30 40 50 60 70 80 90 100 N E S W
South Pin:
N
E
S
W
N
E
S
W
• Always measure from the ground to the top of the PVC – bottom of level (NOT to an arbitrarily place on the level etc).

Best PracticesSediment Bench
Monitoring
How to Monitor, Data Collection –What do I record?
North Pin:
N E S W 10 20 30 40 50 60 70 80 90 100 N E S W
South Pin:
N
E
S
W
N
E
S
W
What is ground? ☺• When measuring in dense vegetation be
sure to move plants out of the way so the ruler measures from the top of the soil/organic matter layer to the top of the PVC
• When measuring in mud, don’t let ruler sink into the mud – always measure from the top of the mud to the top of the PVC
Best PracticesSediment Bench
Monitoring
How to Monitor, Data Collection –What do I record?
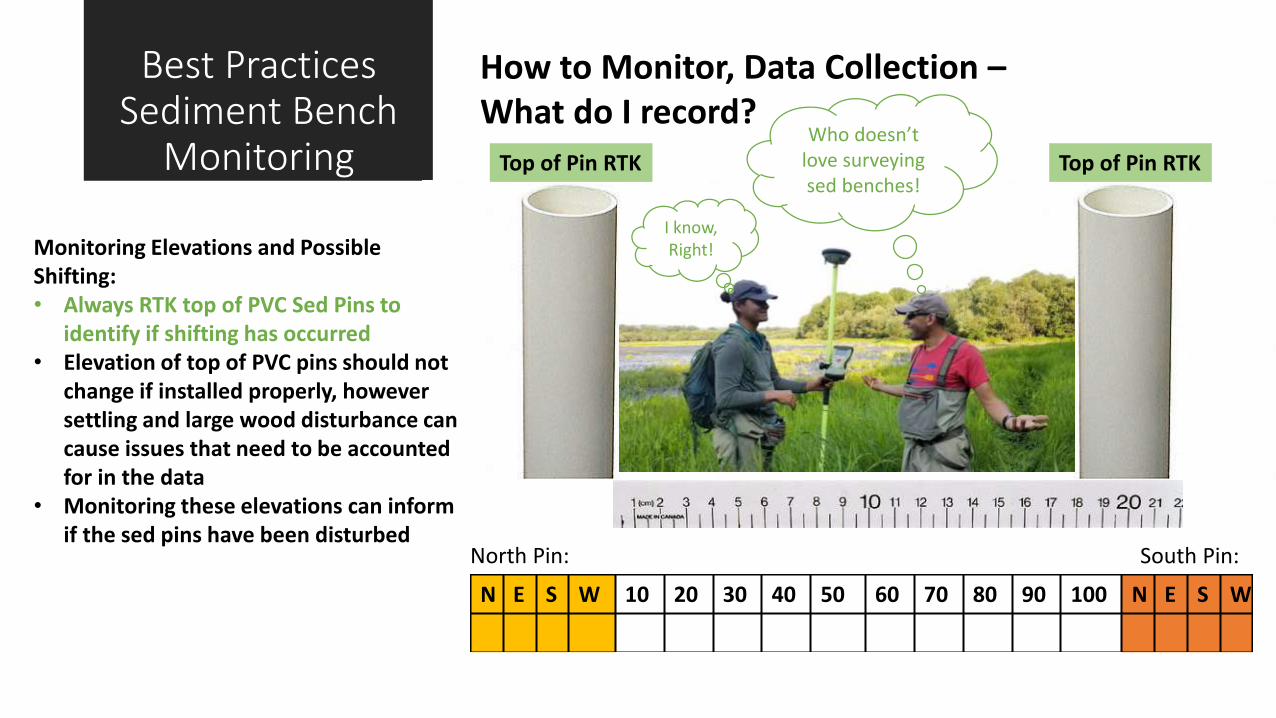
Monitoring Elevations and Possible Shifting:• Always RTK top of PVC Sed Pins to
identify if shifting has occurred• Elevation of top of PVC pins should not
change if installed properly, however settling and large wood disturbance can cause issues that need to be accounted for in the data
• Monitoring these elevations can inform if the sed pins have been disturbed
North Pin:
N E S W 10 20 30 40 50 60 70 80 90 100 N E S W
South Pin:
Top of Pin RTK Top of Pin RTKWho doesn’t
love surveying sed benches!
I know, Right!

Recommendations to Start Collecting
Additional Data
• Install Multiple Sed Benches Across an Elevation Gradient
• RTK Sed Bench PVC Elevations
• Note Vegetation Cover of Dominant Species
• Monitor Field Soil Parameters at Sed Bench
• Take Photo Point of Sediment Bench and Surrounding Area

Other Methods
• SET tables• Marker horizons• Sediment Plates• UAV – Surface Monitoring
Basic Overview Found Here:http://www.tidalmarshmonitoring.net/https://pubs.er.usgs.gov/
publication/70160049
Other methods for monitoring sedimentaccretion and erosion:
Detailed Review of Methods – Nolte et al. 2012http://www.vliz.be/imisdocs/publications/242783.pdf
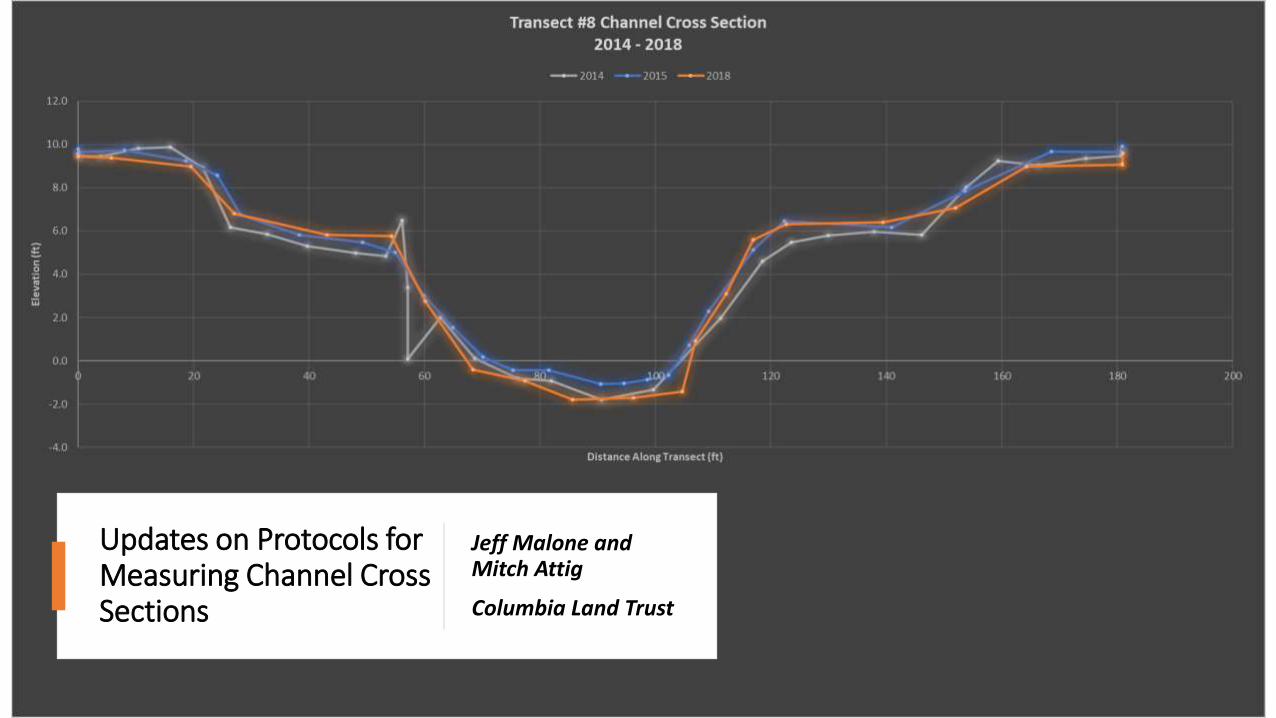
Updates on Protocols for Measuring Channel Cross Sections
Jeff Malone and Mitch Attig
Columbia Land Trust
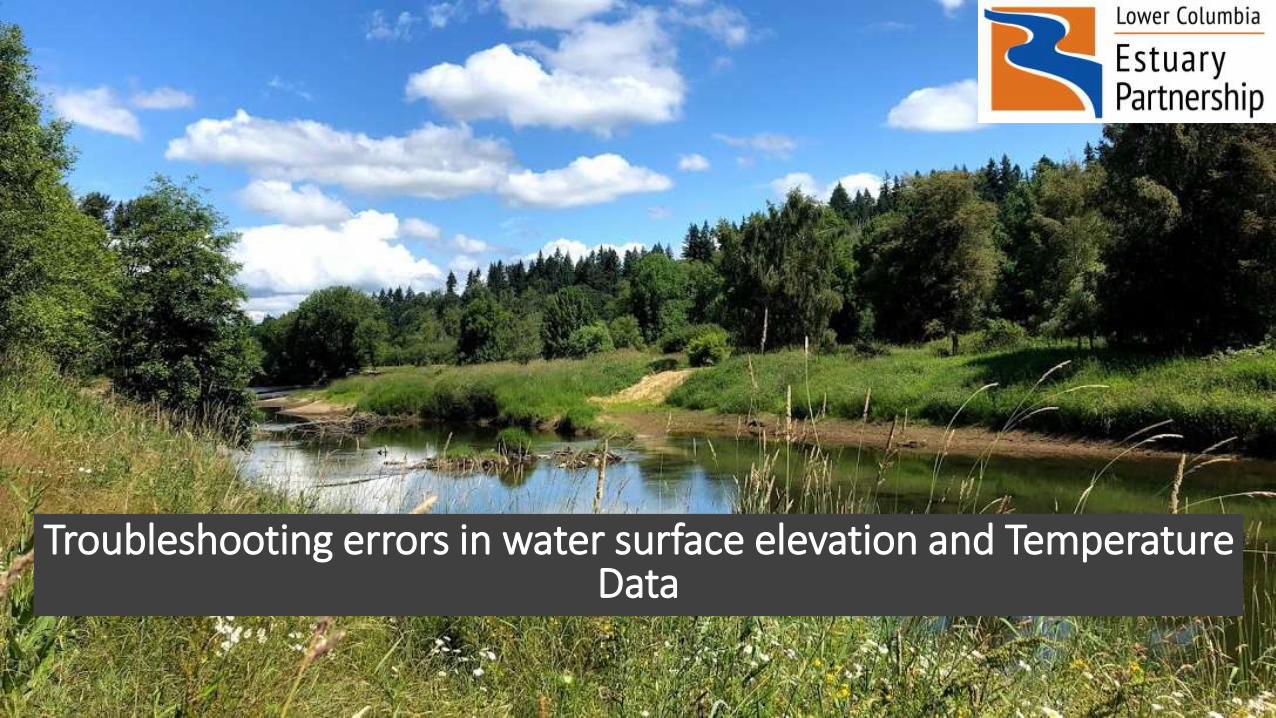
Troubleshooting errors in water surface elevation and Temperature Data
Overview

What are the problems?

0o C Bath:
Are these data any good? – Calibration Errors
❖Use a waterproof pump for best mixing
❖ Lay WSE sensors down flat, measure sensor depth
❖Sink temperature loggers with weights
❖Wait at least 10 – 20 minutes for loggers to stabilize
❖Measure Temperature of the bath for at least 75 – 90 minutes to get 10 consecutive minutes of the same temperature
NIST

Prior to using water pump

After using water pump

Are these data any good? – Data transfer Errors
❖Failing Loggers- Temperature shocks- Biofouling- False fails
❖Incorrect dates and times on files transferred onto the Shuttle

Field Measurements
So you got the data
Initial Hobo datafile

9828623
After applying Barometric compensation assistant

Data Processing Errors: Data Gaps
Data Gap

Data Processing Errors: Due to Freezing temperatures

Let’s reduce those errors!
❖Erase old data and always relaunch Hobo Shuttle
❖QA/QC of loggers during calibrations
❖Ensure loggers are set to the right logging intervals
❖Swap loggers every six months
❖Update hoboware pro regularly
❖Ensure accurate field measurements: Water level, Temperature and RTK data
❖Check deployed loggers and housing for algal growth and damages

Next Steps: Data Sharing – Creating a database
Create a user friendly Data Log!

Next Steps: Data Sharing – Creating user-friendly DETs

References
Continuous Water Level Data Collection and Management Using Onset HOBO® Data Loggers Natural Resource Report NPS/NCBN/NRR—2017/1370https://irma.nps.gov/DataStore/DownloadFile/563851
Oregon Plan for Salmon and Watersheds, Water Quality Monitoring Guidebook, Temperature Protocols Chapter 6:http://docs.streamnetlibrary.org/Protocols/021.pdf
Washington Department of Ecology Quality Assurance Monitoring Plan: Continuous Monitoring for Oxygen, Temperature, pH, and Conductivity in Statewide Rivers and Streamshttps://fortress.wa.gov/ecy/publications/summarypages/0903122.html
HOBOware User’s Guide: http://www.onsetcomp.com/support/manuals/12730-MANBHW-UG
HOBOware Pro Barometric Compensation Assistant User’s Guide: http://www.onsetcomp.com/files/manual_pdfs/Barometric-Compensation-AssistantUsers-Guide-10572.pdf
HOBO® U20 Water Level Logger Manual:http://www.onsetcomp.com/files/manual_pdfs/12315-F-MAN-U20.pdf
Specifications for HOBO® U20 Water Level Loggers:http://www.onsetcomp.com/files/datasheet/Onset%20HOBO%20U20%20Water%20Level%20Data%20Loggers.pdf
Specifications for HOBO® U20L Water Level Loggers:http://www.onsetcomp.com/files/datasheet/Onset-HOBO-U20L-Water-Level-DataLogger-Series.pdf
US Geological Survey. 2012. Water level continuous standard operating procedures. Unpublished protocols. USGS, Western Ecological Research Center, San Francisco Bay Estuary Field Station, Vallejo, CA. http://www.tidalmarshmonitoring.org/monitoring-methods-hydrology.php

SWGDiscussion
Input on other protocols
Use of remote sensing, e.g., drones for data collection
• Use of drones is specific to monitoring goals and available equipment and expertise of handler, so protocols need to be specific to these items and may not be practical. BUT are there a subset of metrics that we can standardize?
• Is this a topic of discussion for future SWG?
Topics for future SWG:
• Results from 5 years of AEM - what seems to be working, what might need “tweaking”, other lessons to share amongst partners
• Results from @ 20 years of restoration in lower Columbia - what seems to be working, what might need “tweaking”, other lessons to share amongst partners

UAV – Future Discussions
UAV best practices (short list) –
• Develop a flight plan and do a site visit prior to see if your plan matches with the detail that you need to collect
• Spend some time thinking about what type of data you are collecting and how much detail you need
• Have back-up SD cards and batteries (car chargers are good too if large area)
• Download all software updates prior to field day
• We have used a high degree of sidelap and frontlap (e.g. 80%/80%) with a lot of success
• In areas where there are high trees (e.g. riparian areas adjacent to a body of water) and you want detail along the riparian edge then you may need to collect additional detail. For instance, you may choose to add flying up the streambank if you need that detail on top of your grid
• Also, the edges of the project area are likely to not have the same level of detail (unless you extend flight plan beyond project area)
• Flying altitude- flying at 275- 300 ft. means that you might have to plan for more flight time but that you will also collect more visual details then flying at 400 ft.
• Areas with more topographic relief or shadows could require additional ground control points
• Location and amount of ground controls matter
• Time of day matters and shadows effect post-processing
• Flat light (cloudy days) are ‘mo better

Multispectral Drone Imagerywas combined with the Digital Elevation Model and Field Vegetation Survey Data to create an accurate Plant Community Map using R & ArcGIS, 0.25 m2 resolution
Drone Data Processing & Vegetation Survey

MCNA North Unit
N
0.2 miles0.1
2 2%
4.5 4%
4.9 4%
58.3 50%
44.8 39%
Open Water
Emergent Wapato, Aquatic Mix
High Marsh Mix Rushes, Sedges, Reed Canarygrass
Reed Canarygrass
Riparian Forest/Shrub Scrub
Drone Image - July 2018Classifications Acres % Cover
Riparian Forest
High Marsh Mix – Bidens
Reed Canarygrass