RE : SKYCITY ENTERTAINMENT GROUP LIMITED – SKC ANNUAL RESULT
109
15 August 2012 Company Announcements Office Australian Stock Exchange Exchange Centre, Level 6 20 Bridge Street Sydney NSW 2000 AUSTRALIA Dear Sir/Madam RE : SKYCITY ENTERTAINMENT GROUP LIMITED – SKC ANNUAL RESULT (FOR THE YEAR ENDED 30 JUNE 2012) We supply herewith the financial information as required by Listing Rule 4.3A together with a copy of the company’s FY12 Full Year Result presentation and the SKYCITY Entertainment Group Limited financial statements for the year ended 30 June 2012. Please find attached: 1. Appendix 4E (ASX Listing Rule 4.3A) detailing the Preliminary Announcement for the year ended 30 June 2012. 2. FY12 Full Year Result presentation for the year ended 30 June 2012. 3. Copy of Appendix 7 (as required by NZX Listing Rule 7.12.2) detailing the final distribution of NZ$0.08 cents per ordinary share to be paid on 5 October 2012 to those shareholders on the company’s share register as at 5.00pm on 28 September 2012. 4. Audited financial statements and notes for the year ended 30 June 2012. 5. Media releases. Yours faithfully James Burrell Chief Financial Officer
Transcript of RE : SKYCITY ENTERTAINMENT GROUP LIMITED – SKC ANNUAL RESULT

15 August 2012 Company Announcements Office Australian Stock Exchange Exchange Centre, Level 6 20 Bridge Street Sydney NSW 2000 AUSTRALIA Dear Sir/Madam RE : SKYCITY ENTERTAINMENT GROUP LIMITED – SKC
ANNUAL RESULT (FOR THE YEAR ENDED 30 JUNE 2012) We supply herewith the financial information as required by Listing Rule 4.3A together with a copy of the company’s FY12 Full Year Result presentation and the SKYCITY Entertainment Group Limited financial statements for the year ended 30 June 2012. Please find attached: 1. Appendix 4E (ASX Listing Rule 4.3A) detailing the Preliminary Announcement for
the year ended 30 June 2012. 2. FY12 Full Year Result presentation for the year ended 30 June 2012. 3. Copy of Appendix 7 (as required by NZX Listing Rule 7.12.2) detailing the final
distribution of NZ$0.08 cents per ordinary share to be paid on 5 October 2012 to those shareholders on the company’s share register as at 5.00pm on 28 September 2012.
4. Audited financial statements and notes for the year ended 30 June 2012. 5. Media releases. Yours faithfully James Burrell Chief Financial Officer

1
SKYCITY Entertainment Group Limited ASX Preliminary final report – 30 June 2012
Lodged with the ASX under Listing Rule 4.3A
Contents Results for Announcement to the Market 2 (Appendix 4E item 2) Other Appendix 4E Information 4 (Appendix 4E items 6 to 17)

2
SKYCITY Entertainment Group Limited Year ended 30 June 2012
(Previous corresponding period: Year ended 30 June 2011)
Results for Announcement to the Market
All figures are NZ$ unless otherwise stated Normalised $NZ’000 Normalised revenue including gaming GST from ordinary activities and including interest revenue
up 8.4% to 950,737
Normalised revenue from ordinary activities and including interest revenue
up 8.2% to 867,188
Normalised profit/(loss) from ordinary activities after tax attributable to members
up 8.0% to 141,413
Normalised net profit/(loss) for the period attributable to members up 8.0% to 141,413
Note: Normalised results adjust for non-recurring items and setting International Business win to theoretical win rate of 1.35%.
Reported $NZ’000 Reported revenue including gaming GST from ordinary activities and including interest revenue
up 6.1% to 941,180
Reported revenue from ordinary activities and including interest revenue (Appendix 4E item 2.1)
up 6.0% to 858,905
Reported profit/(loss) from ordinary activities after tax attributable to members (Appendix 4E item 2.2)
up 12.6% to 138,534
Reported net profit/(loss) for the period attributable to members (Appendix 4E item 2.3)
up 12.6% to 138,534

3
Dividends (Appendix 4E item 2.4)
Amount per security
Franked amount per security
Final dividend 8.00¢ 4.8 ¢
Interim dividend 9.00¢ 5.4 ¢
Record date for determining entitlements to the dividend (Appendix 4E item 2.5) Explanation of Revenue (Appendix 4E item 2.6) Reference should be made to the Company’s FY12 Result Presentation which provides detail and explanatory comment on operating and financial performance. Explanation of Profit/(loss) from ordinary activities after tax (Appendix 4E item 2.6) Reference should be made to the Company’s FY12 Result Presentation which provides detail and explanatory comment on operating and financial performance. Explanation of Net Profit/(loss) (Appendix 4E item 2.6) Reference should be made to the Company’s FY12 Result Presentation which provides detail and explanatory comment on operating and financial performance. Explanation of Dividends (Appendix 4E item 2.6 ) On 14 August 2012, the directors resolved to provide for a final dividend to be paid in respect of the year ended 30 June 2012. The 60% imputed/60% franked dividend of 8 cents per share will be paid on 5 October 2012 to all shareholders on the company's register at the close of business on 28 September 2012.
28 September 2012

4
SKYCITY Entertainment Group Limited
Supplementary Appendix 4E information Additional dividend information 1
Details of dividends declared or paid during or subsequent to the year ended 30 June 2012 are as follows:
(Appendix 4E item 6)
Record date Payment date Type Amount
per security
Total dividend
Franked amount
per security
Foreign sourced
distribution amount per
security 28 September 2012
5 October 2012
Final 8.00 cents
$46,157,000 4.8 cents
8.00 cents
22 March 2012
5 April 2012 Interim 9.00 cents
$51,915,000 5.4 cents
9.00 cents
30 September 2011
7 October 2011
Final 8.00 cents
$46,079,000 4.8 cents
8.00 cents
Dividend reinvestment plans (Appendix 4E item 7) The dividend reinvestment plan will not be available for the October 2012 dividend payment Retained Earnings (Appendix 4E item 8) 2012
$NZ’000 2011
$NZ’000 Retained earnings at the beginning of the financial year 41,150 17,397 Net profit attributable to members of SKYCITY Entertainment Group Limited
138,534 122,960
Dividends provided for or paid (97,994) (99,207) Retained profits at the end of the financial year 81,690 41,150 NTA Backing (Appendix 4E item 9) 2012 2011 Net tangible asset backing per ordinary share
69.1¢ 63.2¢
1 Dividends declared between the end of the financial year and the completion of this report that have not
been provided for in the annual accounts are to be included in this disclosure.

5
Controlled entities acquired or disposed of (Appendix 4E item 10) Acquired N/A Date control gained Contribution (before financing costs) to profit from ordinary activities after tax in current period, where material
Profit from ordinary activities after tax during the whole of the previous corresponding period, where material
Disposed of N/A Date control lost Contribution to profit from ordinary activities after tax in current period, where material.
Profit from ordinary activities after tax during the whole of the previous corresponding period, where material
Associates and Joint Venture entities (Appendix 4E item 11)
Name Ownership interest
Aggregate share of profits/(losses), where material
Contribution to net profit, where material
2012 %
2011 %
2012 $000
2011 $000
2012 $000
2011 $000
Christchurch Casinos Limited
33.3 33.3 5,447 5,976
Whilst SKYCITY has a 33.3% direct shareholding interest in Christchurch Casino Limited, the Company’s effective ownership holding in Christchurch Casino is 50.0%. Other significant information (Appendix 4E item 12) None

6
Commentary on results (Appendix 4E item 14) Earnings per share Earnings per share for the 2012 year were 24.0 cents per share (2011: 21.4 cents per share). Returns to shareholders There was no on-market share buyback programme in the current year.
Significant features of operating performance Results of segments The Group currently operates in the gaming / entertainment, hospitality and tourism sectors.

7
2012
SKYCITY AUCKLAND
REST OF NEW
ZEALAND SKYCITY
ADELAIDE SKYCITY DARWIN
INTER - NATIONAL BUSINESS
CORPORATE / GROUP TOTAL
$'000 $'000 $'000 $'000 $'000 $'000 $'000
Revenue from external customers and other income 433,648 53,929 182,043 140,021 43,817 - 853,458 Shares of net profits of associates - 5,447 - - - - 5,447 Less Expenses (228,335) (30,609) (137,182) (95,275) (35,294) (31,747) (558,442) Depreciation and amortisation (39,868) (5,284) (10,678) (11,358) - (5,582) (72,770) Segment profit/EBIT 165,445 23,483 34,183 33,388 8,523 (37,329) 227,693 Finance costs (48,861) Profit before income tax 178,832 Segment assets 720,271 136,039 269,973 382,648 - 207,335 1,716,266 Investment in associates - 75,266 - - - - 75,266 Net additions to non-current assets (other than financial assets and deferred tax) 91,805 5,295 9,749 42,320 - 4,940 154,109
2011
SKYCITY AUCKLAND
REST OF NEW
ZEALAND SKYCITY
ADELAIDE SKYCITY DARWIN
INTER - NATIONAL BUSINESS
CORPORATE / GROUP TOTAL
$'000 $'000 $'000 $'000 $'000 $'000 $'000
Revenue from external customers and other income 396,208 49,652 180,436 136,539 41,571 - 804,406 Shares of net profits of associates - 5,976 - - - - 5,976 Less Expenses (205,522) (28,343) (135,629) (91,840) (25,356) (29,416) (516,106) Impairment of Christchurch Casino - (15,000) - - - - (15,000) Depreciation and amortisation (35,089) (5,619) (10,976) (12,030) - (5,996) (69,710) Segment profit/EBIT 155,597 6,666 33,831 32,669 16,215 (35,412) 209,566 Finance costs (43,772) Profit before income tax 165,794 Segment assets 676,827 134,885 290,570 373,840 - 206,549 1,682,671 Investment in associates - 73,782 - - - - 73,782 Net additions to non-current assets (other than financial assets and deferred tax) 62,036 3,456 7,464 17,552 - 4,140 94,648

8
Trends in performance Refer previous comments on net profit. Other factors that affected results in the period or which are likely to affect results in the future
Foreign Accounting standards (Appendix 4E item 13) The company prepares its accounts pursuant to New Zealand International Financial Reporting Standards. Audit (Appendix 4E items 15 - 17) This report is based on accounts which have been audited. The audit report is provided with the accounts which accompany this preliminary final report.

Full Year Result Presentation Twelve month period ended 30 June 2012SKYCITY Twelve month period ended 30 June 2012SKYCITY
EntertainmentGroup Limited
15 August 2012
SKYCITY Result FY12
FY R l SFY12 Result Summary 2
FY12 Highlights 14g g
Strategic Growth Projects 29
Focus for FY13 36
Appendices 38
1
www.skycityentertainmentgroup.com

FY12 Result FY12 Result Summary
FY12 Result Highlights
FY12 FY11 Movement
$m $m $m %
Normalised Revenue (incl Gaming GST) 950 7 877 0 73 7 8 4%Normalised Revenue (incl Gaming GST) 950.7 877.0 73.7 8.4%
Normalised EBITDA 310.6 290.9 19.7 6.8%
Normalised NPAT 141.4 130.9 10.5 8.0%
Normalised EPS 24.5 cps 22.7 cps 1.8 cps 8.0%
Reported Revenue (incl Gaming GST) 941.1 887.1 54.0 6.1%
Reported EBITDA 300.5 294.3 6.2 2.1%
Reported NPAT 138.5 123.0 15.5 12.6%
d S 6 6Reported EPS 24.0 cps 21.4 cps 2.6 cps 12.6%
Dividend 17.0 cps 16.0 cps 1.0cps 6.3%
3
The difference between Normalised and Reported can be seen on page 40

FY12 Result Highlights
Strong result, with Normalised NPAT of $141.4m +8.0% on FY11
Group Normalised Revenue and EBITDA of $950.7m (+8.4%) and $310.6m (+6.8%) respectively
Rugby World Cup 2011 a one off boost to Revenue of $11 5m EBITDA of $6 5m and NPAT of $4 7m Rugby World Cup 2011 a one‐off boost to Revenue of $11.5m, EBITDA of $6.5m and NPAT of $4.7m
excluding RWC, FY12 Group Normalised Revenue $939.2m, up 7.1% on FY11
Reported NPAT $138.5m, up $15.5m (+12.6%), also a strong result for the Group
Momentum continues in core business Momentum continues in core business
Flagship Auckland Normalised Revenues of $527.4m, up $66.2m (+14.4%) (+12%, ex‐RWC)
Momentum continues following the opening of "Horizon", “Eight”, Diamond Room and Federal St F&B
Auckland Gaming Machines FY12 Revenue growth of 10% demonstrates success of private gaming areas Auckland Gaming Machines FY12 Revenue growth of 10%, demonstrates success of private gaming areas
Darwin returned to growth in 2H12 and outlook is positive for FY13 and beyond
Hamilton had a strong year and will benefit from further planned investment in hotel
i l i h i ll h International Business showing excellent growth
New “Horizon” VIP facilities in Auckland increased Normalised Revenues to $50.7m, up $24.7m (+95%)
Actual IB win rate of only 1.13% in FY12, lower than theoretical 1.35%
A ti i ti g good g o th f o D i i FY13 he e t o e "Ho i o " ite o e ed 3 A g t
4
Anticipating good growth from Darwin in FY13, where two new "Horizon" suites opened 3 August
FY12 Result Highlights
Strong balance sheet with Net Debt : EBITDA of 2.1 times and $340m committed, undrawn facilities
Repaid $250m USPP in March 2012 from existing bank facilities
No debt repayments due until 2H15. Ample headroom on banking covenantsp y 5 p g
In May 2012, Standard & Poor’s reaffirmed Investment Grade rating (BBB‐), Stable outlook
Strong cash generation along with current and future debt provide capacity to fund major expansions
Focused and prudent capital investmentocused a d p ude t cap ta est e t
In FY12, c.$165m was spent in capex across the Group, mostly comprising:
completion of the Auckland property capex on differentiated gaming and new F&B ($32m)
Darwin’s Lagoon Resort and VIP Gaming villas, which opened on 27th July ($32m)
Bally Gaming system implementation across Auckland and Adelaide ($10m) Bally Gaming system implementation across Auckland and Adelaide ($10m)
maintenance capex spend across the Group ($52m)
acquisition of land potentially for NZICC adjacent to Auckland site ($32m)
Interest, Tax and Depreciation, p
The average FY12 cost of funding of 7.15% improved in 2H12 once $250m USPP was replaced by bank
debt (2H12 average cost of funding 7.00%)
Depreciation increase due to the recent capital expenditure programme
A t t f %
5
Average tax rate of 25.3%

FY12 Group ResultNORMALISED Revenues and Earningsg
NormalisedFY12$m
FY11$m
Movement $m %
Revenue (including Gaming GST) 950.7 877.0 73.7 8.4%( g g )
Gaming GST
9
83.5 75.2 (8.3) (11.0%)
Revenue 867.2 801.8 65.4 8.2%
Expenses 556.6 510.9 (45.7) (8.9%)p 55 5 9 (45 7) ( 9 )
EBITDA 310.6 290.9 19.7 6.8%
Depreciation and Amortisation 72.4 68.5 (3.9) (5.7%)
8 8EBIT 238.2 222.4 15.8 7.1%
Interest Cost 48.4 45.4 (3.0) (6.6%)
Net Profit Before Tax 189.8 177.0 12.8 7.2%
Tax and Minority Interest 48.4 46.1 (2.3) (5.0%)
Normalised NPAT 141.4 130.9 10.5 8.0%
6
Revenue (including Gaming GST) is shown above to facilitate Australasian comparisons. It also facilitates period on period comparisons given the GST rate increase in New Zealand on 1 October 2010 from 12.5% to 15% Normalised NPAT adjusts for non‐recurring items and International Business (IB) at theoretical win rate of 1.35% versus actual 1.13% in FY12 (FY11: 1.72%)
FY12 Group ResultREPORTED Revenues and Earningsg
ReportedFY12$m
FY11$m
Movement $m %
Revenue (including Gaming GST) 941.1 887.1 54.0 6.1%
Gaming GST 82.2 76.7 (5.5) (7.2%)
Revenue 858.9 810.4 48.5 6.0%
Expenses 558.4 516.1 (42.3) (8.2%)p 55 5 ( 3) ( )
EBITDA 300.5 294.3 6.2 2.1%
Depreciation and Amortisation 72.8 69.7 (3.1) (4.4%)
EBIT 227.7 224.6 3.1 1.4%
Interest Cost 48.9 43.8 (5.1) (11.6%)
Net Profit Before Tax 178.8 180.8 (2.0) (1.1%)
Tax and Minority Interest 40.3 48.2 7.9 16.4%
Write Down of Christchurch ‐ (15.0) 15.0One‐Off Deferred Tax Adjustment ‐ 5.4 (5.4)
R t d NPAT 138 5 123 0 15 5 12 6%
7
Revenue (including Gaming GST) is shown above to facilitate Australasian comparisons. It also facilitates period on period comparisons given the GST rate increase in New Zealand on 1 October 2010 from 12.5% to 15% Normalised NPAT adjusts for non‐recurring items and International Business (IB) at theoretical win rate of 1.35% versus actual 1.13% in FY12 (FY11: 1.72%)
Reported NPAT 138.5 123.0 15.5 12.6%

FY12 Revenue Summary by Business Unit(incl Gaming GST)
FY12$m
FY11$m
Movement $m %
New Zealand Casinos
Auckland 527 4 461 2 66 2 14 4%Auckland 527.4 461.2 66.2 14.4%
Hamilton 52.1 47.9 4.2 8.8%
Christchurch 5.6 6.2 (0.6) (9.7%)
Queenstown, Other 8.7 8.4 0.3 3.6%
Total New Zealand 593.8 523.7 70.1 13.4%o 593 5 3 7 70 3 4
Australian Casinos
Adelaide (A$) 160.8 156.8 4.0 2.6%
Darwin (A$) 117.9 113.6 4.3 3.8%
Total Australia (A$) 278.7 270.4 8.3 3.1%
Total Australia (NZ$) 356.9 353.3 3.6 1.0%
Casino Revenues incl Normalised IB (incl Gaming GST) 950.7 877.0 73.7 8.4%
Adjust International Business to actual win rate (9.6) 10.1 (19.7)
Reported Revenue incl Actual IB (incl Gaming GST) 941.1 887.1 54.0 6.1%
8
Revenue (including Gaming GST) is shown above to facilitate Australasian comparisons. It also facilitates period on period comparisons given the GST rate change in New Zealand on 1 October 2010Normalised Revenue is adjusted for IB at theoretical win rate of 1.35%, versus actual 1.13% in FY12 (FY11: 1.72%)Average NZD/AUD cross‐rate during FY12 0.7813 and FY11 0.7668
FY12 EBITDA Summary by Business Unit
FY12$m
FY11$m
Movement $m %
New Zealand Casinos
Auckland 217.9 196.9 21.0 10.7%Auckland 217.9 196.9 21.0 10.7%
Hamilton 21.8 20.2 1.6 7.9%
Christchurch 5.6 6.2 (0.6) (9.7%)
Queenstown, Other 1.3 1.1 0.2 18.2%
Total New Zealand 246.6 224.4 22.2 9.9%
Australian Casinos
Adelaide (A$) 36.7 36.0 0.7 1.9%
Darwin (A$) 34.7 34.3 0.4 1.2%
l l ( )Total Australia (A$) 71.4 70.3 1.1 1.6%
Total Australia (NZ$) 91.4 91.6 (0.2) (0.2%)
Corporate Costs (27.4) (25.1) (2.3) (9.2%)
Normalised EBITDA 310 6 290 9 19 7 6 8%Normalised EBITDA 310.6 290.9 19.7 6.8%
Non‐recurring itemsInternational Business to actual win rate
(4.3)(5.8)
(4.3)7.7
0.0(13.5)
Reported EBITDA 300.5 294.3 6.2 2.1%
9
Normalised EBITDA is adjusted for non‐recurring items (NRI) and IB at theoretical Average NZD/AUD cross‐rate during FY12 0.7813 and FY11 0.7668

2H12 Result Highlights
Growth in 2H12, with Normalised EBITDA of $145.1m on 2H11 (+4.0%)
Group Normalised 2H12 Revenue and EBITDA of $461.7m (+7.4%) and $145.1m (+4.0%) respectively
Reported Revenues of $447.1m reflect a low hold of only 0.81% in IB in 2H12 (Revenue impact of ‐$15m)
Momentum continues in NZ, with 2H12 Normalised Revenue growth of $33.9m on 2H11 (+13.1%)
The capex investment in "Eight" and Diamond Room grew Auckland local gaming revenues by $7m (+4.5%)
disruption around Bally implementation and Premier Rewards re‐launch impacted 2H12
Federal Street outlets performed strongly, as Auckland 2H12 F&B Revenues increased $4.5m (+26%)
Following the capex on “Horizon” in Auckland, International Business from Asia to NZ has flourished
Auckland’s IB has shown excellent growth in 2H12, with Normalised Revenues of $32m, up $21m (+187%)g p ( )
The “Horizon” suites and gaming salons are proving highly popular with international players
Auckland IB Normalised Revenue has trebled in the last 3 years, from $16m (FY10) to $51m (FY12)
Macro economic challenges and weaker Australian currency negatively impacted Australian 2H12 results Macro economic challenges and weaker Australian currency negatively impacted Australian 2H12 results
Australian Normalised Revenue was up in A$ terms by 2%, but down in NZ$ by 1%, due to A$/NZ$
Adelaide was impacted by weaker consumer sentiment in 2H12, with A$ Normalised Revenue down 2%
Darwin returned to growth in 2H12, increasing A$ Normalised Revenue by $4m (+8%)
10
2H12 Revenue Summary by Business Unit(incl Gaming GST)
2H12$m
2H11$m
Movement $m %
New Zealand Casinos
Auckland 258 5 226 1 32 4 14 3%Auckland 258.5 226.1 32.4 14.3%
Hamilton 25.6 24.6 1.0 4.1%
Christchurch 3.1 2.9 0.2 6.9%
Queenstown, Other 4.6 4.3 0.3 7.0%
Total New Zealand 291.8 257.9 33.9 13.1%o 9 57 9 33 9 3
Australian Casinos
Adelaide (A$) 78.2 79.5 (1.3) (1.6%)
Darwin (A$) 54.3 50.1 4.2 8.4%
Total Australia (A$) 132.5 129.6 2.9 2.2%
Total Australia (NZ$) 169.9 172.0 (2.1) (1.2%)
Casino Revenues incl Normalised IB (incl Gaming GST) 461.7 429.9 31.8 7.4%
Adjust International Business to actual win rate (14.6) 9.5 (24.1)
Reported Revenue incl Actual IB (incl Gaming GST) 447.1 439.4 7.7 1.8%
11
Revenue (including Gaming GST) is shown above to facilitate Australasian comparisons. It also facilitates period on period comparisons given the GST rate change in New Zealand on 1 October 2010Normalised Revenue is adjusted for IB at theoretical win rate of 1.35% versus actual 2H12 of 0.81% (2H11: 2.08%)Average NZD/AUD cross‐rate during 2H12 0.7792 and 2H11 0.7541

2H12 EBITDA Summary by Business Unit
2H12$m
2H11$m
Movement $m %
New Zealand Casinos
Auckland 103.5 95.9 7.6 7.9%Auckland 103.5 95.9 7.6 7.9%
Hamilton 10.8 10.2 0.6 5.9%
Christchurch 3.1 2.9 0.2 6.9%
Queenstown, Other 0.8 0.7 0.1 14.3%
Total New Zealand 118.2 109.7 8.5 7.7%
Australian Casinos
Adelaide (A$) 17.5 19.0 (1.5) (7.9%)
Darwin (A$) 13.9 13.6 0.3 2.2%
l l ( ) ( ) ( )Total Australia (A$) 31.4 32.6 (1.2) (3.7%)
Total Australia (NZ$) 40.4 42.9 (2.5) (5.8%)
Corporate Costs (13.5) (13.1) (0.4) (3.1%)
Normalised EBITDA 145 1 139 5 5 6 4 0%Normalised EBITDA 145.1 139.5 5.6 4.0%
Non‐recurring itemsInternational Business to actual win rate
(3.5)(9.3)
(3.4)7.3
(0.1)(16.6)
Reported EBITDA 132.3 143.4 (11.1) (7.7%)
12
Normalised EBITDA is adjusted for non‐recurring items (NRI) and IB at theoretical Average NZD/AUD cross‐rate during 2H12 0.7792 and 2H11 0.7541
Full Year Dividend of 8.0 cents per share
Final dividend of 8.0 cents per share, taking full year dividend to 17.0 cents per share
Payout at the top end of policy range of 60% ‐ 70% of NPAT
60% imputed at the company’s 28% tax rate in New Zealand
60% franked for Australian purposes
Payment date 5 October 2012 (entitlement/record date 28 September 2012) Payment date 5 October 2012 (entitlement/record date 28 September 2012)
Final dividend represents an annual gross dividend yield of 5.9% based on the current share price
of $3.58
SKYCITY will not apply the Dividend Reinvestment Plan to the dividend SKYCITY will not apply the Dividend Reinvestment Plan to the dividend
13

FY12 HighlightsFY12 Highlights
SKYCITY Auckland FY12
Revenue, EBITDA and Margin
42.7% 41.3%
Revenues (inclusive of GST) up $66.2m or 14.4% on pcp
Gaming machines continues strong revenue growth,
+10.0%, reflecting our investment in new VIP rooms
$461.2m$527.4m
$196.9m $217.9m
FY12 local table games revenue showed growth of 2.7%
due largely to the opening of "Eight", local table
games drop increased by 10.6% in FY12
however, revenue was negatively impacted by hold
FY11 FY12Revenue EBITDA
, g y p y
of 19.1% (FY11 hold was 20.6%)
95% growth in IB revenue, due to opening of "Horizon"
gaming salons and suites in 1H12
Significant growth in non‐gaming (15.8%) driven by RWC
Revenue Growth by Type (v pcp)
10 0%
95.0% 15.8%14.4%
Significant growth in non gaming (15.8%) driven by RWC
hotel bookings in 1H12 and F&B revenues from new
outlets
Grand Hotel: revenue up 29%. Occupancy of 88%
SKYCITY Hotel: revenue up 27%. Occupancy of 94%10.0%
2.7%
Machines Tables -Local
IB Non Gaming
Total
p 7 p y 94
RWC 2011 Revenue and EBITDA of $10.7m and $6.0m,
mostly in hotels
The new ‘Bally’ gaming system launched in late Q4‐12, to
further improve the customer gaming experience
15
Gaming revenue figures as shown in the charts on this page are gaming win (inclusive GST). This facilitates Australasian comparisons. It also facilitates period on period comparisons given the GST rate change in New Zealand on 1 October 2010 Non gaming revenues are net of GST Total revenues as shown are gaming win plus non‐gaming revenues EBITDA margin is calculated as a % of gaming win (GST inclusive) plus non‐gaming revenue ‐ to facilitate Australasian and period on period comparisons
gfurther improve the customer gaming experience

NZ Restaurant of the Year – The Grill
16
Supreme Winner ‐ Depot
Metro MagazineMay 2012
DEPOTEATERY & OYSTER BAR
Cuisine MagazineAugust 2012
17

Federal St welcomes Nic Watt
18
New gaming openings in 2012
"Horizon" Suites "Horizon" VIP Gaming
19
"Eight" VIP Gaming LoungeDiamond Gaming Lounge
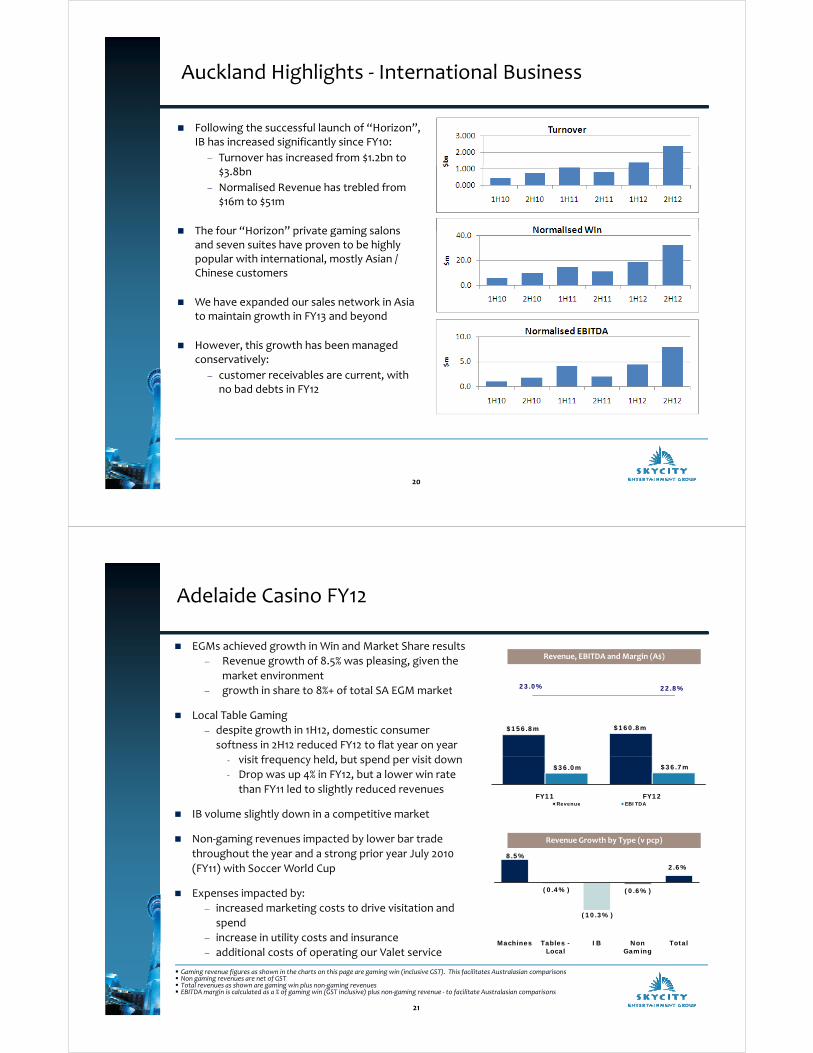
Auckland Highlights ‐ International Business
Following the successful launch of “Horizon”, IB has increased significantly since FY10:
Turnover has increased from $1.2bn to $3.8bn
Normalised Revenue has trebled from $16m to $51m
The four “Horizon” private gaming salons The four Horizon private gaming salons and seven suites have proven to be highly popular with international, mostly Asian / Chinese customers
We have expanded our sales network in Asia to maintain growth in FY13 and beyond
However, this growth has been managed conservatively:conservatively:
customer receivables are current, with no bad debts in FY12
20
Adelaide Casino FY12
Revenue, EBITDA and Margin (A$)
23.0% 22.8%
EGMs achieved growth in Win and Market Share results
Revenue growth of 8.5% was pleasing, given the
market environment
growth in share to 8%+ of total SA EGM market
$156.8m $160.8m
growth in share to 8%+ of total SA EGM market
Local Table Gaming
despite growth in 1H12, domestic consumer
softness in 2H12 reduced FY12 to flat year on year
i it f h ld b t d i it d$36.0m $36.7m
FY11 FY12Revenue EBITDA
‐ visit frequency held, but spend per visit down
‐ Drop was up 4% in FY12, but a lower win rate
than FY11 led to slightly reduced revenues
IB volume slightly down in a competitive market
Revenue Growth by Type (v pcp)
8.5%
2.6%
Non‐gaming revenues impacted by lower bar trade
throughout the year and a strong prior year July 2010
(FY11) with Soccer World Cup
(0.4%)
(10.3%)
(0.6%)
Machines Tables -Local
IB Non Gaming
Total
Expenses impacted by:
increased marketing costs to drive visitation and
spend
increase in utility costs and insurance
additional costs of operating our Valet service
21
Gaming revenue figures as shown in the charts on this page are gaming win (inclusive GST). This facilitates Australasian comparisons Non gaming revenues are net of GST Total revenues as shown are gaming win plus non‐gaming revenues EBITDA margin is calculated as a % of gaming win (GST inclusive) plus non‐gaming revenue ‐ to facilitate Australasian comparisons
Local Gaming additional costs of operating our Valet service

SKYCITY Darwin FY12
Revenue, EBITDA and Margin (A$)
30.2% 29.4%
Total FY12 Revenue up 3.8%, reflecting an improved
performance in 2H12
Gaming Machine revenues up 1.2% on FY11 with solid 2H12
revenues that eliminated the flat 1H12 result
$113.6m $117.9m
$34 3m $34.7m
revenues that eliminated the flat 1H12 result
new product and marketing promotions have
influenced the turnaround
A change in operating hours and the revitalisation of the
gaming floor layout has seen local Table Games revenue $34.3m $34.7m
FY11 FY12Revenue EBITDA
gaming floor layout has seen local Table Games revenue
grow 9.2% on FY11 (Revenue +3.7% including IB)
A record $2+m 10‐spot Keno jackpot has created a lot of
interest in the NT Keno product and dedicated marketing
efforts have helped increase Keno revenues 18.7% on FY11
Revenue Growth by Type (v pcp)
18.7%
3 8%
Non‐gaming revenues grew by 2.7% on FY11:
two restaurant refurbishments, revised menus,
increased offerings and new events helped drive F&B
Hotel revenues were consistent with FY11 despite the
i t t d t t t FY ith T i l R t 1.2%
3.7% 2.7%3.8%
Machines Tables Keno Non Gaming
Total
interrupted start to FY12 with Tropical Resort
construction works
Normalised EBITDA of $34.7m is up 1.2% on FY11 despite flat
local economy where community gaming is experiencing
difficulties
22
Gaming revenue figures as shown in the charts on this page are gaming win (inclusive GST). This facilitates Australasian comparisons Non gaming revenues are net of GST Total revenues as shown are gaming win plus non‐gaming revenues EBITDA margin is calculated as a % of gaming win (GST inclusive) plus non‐gaming revenue ‐ to facilitate Australasian comparisons
difficulties
Darwin Highlights – Lagoon Resort open
The exciting new Lagoon Resort, comprising 32
rooms, two international VIP Villas and gaming
salons, day spa, bar and restaurant has now
opened on time and on budget
This complements the existing 120 room hotel
and underpins SKYCITY Darwin’s position as the
leading integrated resort in Northern Australiag g
SKYCITY Darwin represents a significant
opportunity for growth, given the proximity to
gaming demand in South East Asia and we are
already seeing encouraging interest in the new already seeing encouraging interest in the new
facilities
The upside in Darwin’s economy from major
investments such as the $32 billion Inpex Ichthys
LNG project, gives us confidence that our
Darwin property offers attractive prospects
23

Darwin Highlights – Lagoon Resort open
Mindil Bay / Beach 32 Lagoon View Suites (over 2 levels) Day Spa (Endota)
VIP Villas and Gaming
Cove Restaurant and Bar
24
Cove Restaurant and Bar
SKYCITY Hamilton FY12
Revenue, EBITDA and Margin
42.2% 41.8%
Strong overall revenue growth of 8.8% in FY12, driven
by EGM performance and improvement in F&B
Hamilton’s ongoing successful growth is a product of Hamilton s ongoing successful growth is a product of
focused marketing, capital investment and
strengthening community relationships
Gaming machine revenue growth a particular
highlight up 13 9% Driven by new machines
$47.9m$52.1m
$20.2m $21.8m
Revenue Growth by Type (v pcp)
highlight, up 13.9%. Driven by new machines,
improved layout and main gaming floor
refurbishment
Table games drop improved 5% in FY12, but revenues
FY11 FY12Revenue EBITDA
Revenue Growth by Type (v pcp)
13.9%16.7%
8.8%
are down 6% due to a lower hold %
EBITDA up 8% on FY11, with consistent EBITDA margin
around 42%, showing good cost control
(5.9%)
(55.6%)
Machines Tables -Local
IB Non Gaming
Total
RWC 2011 Revenue and EBITDA of $0.8m and $0.5m
respectively
excluding RWC impact, underlying Revenue and
EBITDA growth still of 7.1% and 5.4% respectively
25
Gaming revenue figures as shown in the charts on this page are gaming win (inclusive GST). This facilitates Australasian comparisons. It also facilitates period on period comparisons given the GST rate change in New Zealand on 1 October 2010 Non gaming revenues are net of GST Total revenues as shown are gaming win plus non‐gaming revenues EBITDA margin is calculated as a % of gaming win (GST inclusive) plus non‐gaming revenue ‐ to facilitate Australasian and period on period comparisons

SKYCITY Queenstown & Christchurch Casino
Christchurch Casino
Our Christchurch Casino Joint Venture
with Skyline continues to be challenged
Queenstown Casino
Strong performance was shown in FY12, with
Revenue up 12% to $9m and EBITDA up 50% to with Skyline continues to be challenged
by a difficult operating environment
Following the recent release of the
Christchurch Central Recovery Plan, there
is now further clarity around the rebuild
Revenue up 12% to $9m and EBITDA up 50% to
$1.5m
Performance driven by strong gaming revenues
and effective cost management resulting in an
improved EBITDA margin for the yearis now further clarity around the rebuild
of the city, with the planned convention
centre and other civic buildings within
the proximity of the Casino
improved EBITDA margin for the year
There was increased visitation from Asian
groups who enjoy visiting the Queenstown area
Highest EBITDA since the opening of the
Queenstown CasinoQueenstown Casino
FY12 FY11%
Movement
Revenue (inc GST) $8.6m $7.7m 11.7%
FY12 FY11%
Movement
Contribution $5.6m $6.2m (9.7%) ( ) $ $7 7 7
EBITDA $1.5m $1.0m 50.0%
EBITDA % 17.4% 13.0%
$5 $ (9 7 )
26
Gaming revenue figures as shown in the charts on this page are gaming win (inclusive GST). This facilitates Australasian comparisons. It also facilitates period on period comparisons given the GST rate change in New Zealand on 1 October 2010 Non gaming revenues are net of GST Total revenues as shown are gaming win plus non‐gaming revenues EBITDA margin is calculated as a % of gaming win (GST inclusive) plus non‐gaming revenue ‐ to facilitate Australasian and period on period comparisons
Well Funded for Future Growth
Following repayment of $250m USPP debt in March 2012, net debt at 30 June 2012 is $659m
There is no debt maturing until 2H15
Current facilities offer a combination of flexible, lower cost bank debt, with longer term USPP
SKYCITY Capital Notes comprise $56m issued on the NZX and a further $94m in Treasury Stock
In May 2012, Standard & Poor’s reaffirmed our Investment Grade BBB‐ rating, Stable Outlook
Confident about our ability to fund future development projects:
J 2012 N t D bt N li d EBITDA f l 2 1 ti June 2012 Net Debt : Normalised EBITDA of only 2.1 times
$340m committed undrawn facilities (excl. $94m Treasury Stock), in addition to strong
operating cash flow
good relationships with our local lending banks and USPP providers
27

Capex, Depreciation, Interest, Tax
Capex
FY12 capex below, totalling $165m
FY13 project capex will include completing the
Depreciation: $72.4m, up $3.9m (5.7%)
FY12 depreciation increase of $3.9m reflects
recent significant capex spend, largely in 3 p j p p g
Bally roll‐out, completion of the Darwin Resort,
further development of the Auckland property
and the start of Hamilton hotel
FY13 maintenance capex expected to be broadly
Auckland
Debt & Interest: $48.4m, up $3.0m (6.6%)
Average debt balance during FY12 at $705m
with average cost of 7 15%3 p p y
consistent with FY12, c.$50mwith average cost of 7.15%
7.15% comprises 7.33% in 1H12 and 7.00% in
2H12, as USPP replaced with cheaper bank
financing
Capex Spend FY11 FY12
Completion of Auckland Projects $21m $32m
FY13 cost expected to be in line with 2H12
Tax: $48.1m, up $2.0m (4.3%)
Effective tax rate for FY12 at 25.3% after the
decrease in New Zealand corporate tax rate
Darwin Resort $4m $32m
Darwin Little Mindil $8m $0m
Other Development Capex $2m $7m
Bally $0m $10mdecrease in New Zealand corporate tax rate
effective 1 July 2011 for SKYCITY
FY13 tax rate projected to remain broadly
consistent with FY12
Land acquisition in Auckland $2m $32m
Maintenance Capex (net of disposals) $40m $52m
Total $77m $165m
28
Normalised
Strategic Growth P j tProjects

New Zealand International Convention Centre
SKYCITY remains focused upon successfully negotiating an outcome which would see it invest up
to $350 million to develop, deliver, own and operate an iconic International Convention Centre for
New Zealand, on a site directly adjacent to the Auckland property
In return, SKYCITY is seeking:
an early renewal of the Auckland casino licence beyond 2021
an increase in gaming product to meet demand and provide for future growth, and
changes to gaming regulations which would increase the efficiency and attractiveness of the changes to gaming regulations which would increase the efficiency and attractiveness of the
offering we are able to provide our customers
The Auditor‐General is presently undertaking a review of the Government’s expressions of interest
process, primarily focused upon an examination of the Government’s process for seeking and
i lassessing proposals
whilst this is more a matter for Government, SKYCITY is supporting the enquiry
following completion of the A‐G’s report (expected within ~ 1 to 2 months), we hope to re‐
engage with the Government and conclude these negotiations
In FY12, c. $30m has been invested acquiring a land bank opposite the main Auckland site
Shareholders should remain assured that the proposed transaction will only proceed on the basis
that an acceptable return on capital can be delivered from the total project
30
New Zealand International Convention Centre
Artists impression
31

Adelaide Redevelopment
SKYCITY is continuing its discussions with the South Australian Government‘s Casino Task Force
regarding the future taxation and regulatory framework for the Adelaide Casino
once this has been determined, SKYCITY can then decide how to best progress its plans for the
d l d f i f h Ad l id C iredevelopment and transformation of the Adelaide Casino
The potential redevelopment of the Adelaide Casino into a truly world class integrated entertainment
facility, set amidst a significantly redeveloped Torrens Riverbank precinct represents an outstanding
growth opportunity for both SKYCITY and for Adelaide
The entertainment facility is planned to feature a boutique 6 star hotel, underground car park,
signature restaurants, bars, a day spa, roof top pool lounge, expanded gaming, including
International and VIP gaming
The South Australian State Government re‐affirmed its commitment to its major infrastructure
development expenditure in the recent June 2012 State Budget
$40m Torrens footbridge: announced location, adjacent to SKYCITY Casino, on 5 July
$530m Adelaide Oval: demolition works complete. New stand construction underway (50,000
capacity)
$350m Convention centre expansion: Phase I well underway
32
Torrens Footbridge
Adelaide Casino
Artists impression of Torrens Footbridge
33

Adelaide Riverbank Development Concept
34
Hamilton Hotel
We have approved the development of a 4+ star
hotel with 135 rooms above our Hamilton
property
Artists impression
We anticipate the total cost to be around $35m
We believe the hotel development brings much
needed quality hotel accommodation to central
H ilHamilton
It will significantly improve the facilities that we
are able to offer to our existing and future
customers
The hotel will include 8 luxury duplex suites for
our premium customers, 16 large suites with river
frontage balconies, in addition to 111 standard
roomsrooms
The hotel plans also include a 5‐lane swimming
pool, sauna and gymnasium
35

Focus for FY13
Focus for FY13
New Zealand
To further capitalise on returns from the investments made in Auckland in FY12, particularly “Horizon” and "Eight"
T iti “F d l St t” th l di g t t d t t i t i t i A kl d To position “Federal Street” as the leading restaurant and entertainment precinct in Auckland, with the introduction of additional great restaurants
To optimise the benefits of the new Bally gaming system
Progress the development of the Hamilton Casino Hotel project
Ai t l d ti ti ith G t th NZICC d l t d i d Aim to conclude negotiations with Government on the NZICC development and expansion and regulatory reforms
Australia
To capitalise on returns from investments made at SKYCITY Darwinp
Aim to conclude negotiations with the SA Government and Casino Task Force regarding the tax and regulatory framework facilitating the transformation of the Adelaide Casino into a truly world‐class integrated entertainment and hotel complex
T di U d t Trading Update
The first six weeks have started well, with normalised revenues up more than 5% on the PCP
The comparative period will get more challenging, due to the RWC 2011 impact in FY12
We will provide a further trading update to shareholders at the General Meeting on Friday 19th
O b
37
October 2012

Appendix
Full Year Period Ended30 June 2012
Normalised P&L Summary by Business Unit
39
• Other NZ Operations includes Queenstown and other minor operations. Minority Interests relate to SKYCITY Queenstown• EBITDA margin is calculated as a % of GST‐inclusive gaming revenues and GST‐exclusive non‐gaming revenues to facilitate Australasian comparisons

Reported and Normalised Earnings
FY12 FY11Revenue
$mEBITDA
$mEBIT$m
NPAT$m
Revenue $m
EBITDA$m
EBIT$m
NPAT$m
Reported 941.1 300.5 227.7 138.5 887.1 294.3 224.6 123.0
Restructuring Costs 2.2 2.2 1.6 ‐ 2.5 2.5 1.7
Canterbury Earthquake Charity ‐ 1.0 1.0 0.7
One‐Off Costs for Capital Projects 0.4 0.7 1.2 0.8
Write‐down of Christchurch 15.0
Tax Adjustments (5.1) (5.4)
Other NRI 2.1 2.1 1.5 0.8 0.8 0.5
Total NRI 4 3 4 7 1 3 4 3 5 5 13 3Total NRI ‐ 4.3 4.7 1.3 ‐ 4.3 5.5 13.3
Adjusted for NRI 941.2 304.8 232.4 137.2 887.1 298.6 230.1 136.3
International Business at Theoretical 9.6 5.8 5.8 4.2 (10.1) (7.7) (7.7) (5.4)
Normalised 950.7 310.6 238.2 141.4 877.0 290.9 222.4 130.9
40
• Revenue includes GST inclusive gaming revenues and GST exclusive non‐gaming revenues• ‘Normalised’ (underlying) earnings eliminates non‐recurring items and adjusts international VIP commission business win rate to theoretical
FY12 Notes re Reported and Normalised Earnings
Other NRI includes one‐off costs associated with opening the new Auckland facilities,
launching Bally and Premier Rewards and other miscellaneous items
IB win rate at 1.13% for FY12. Adjustment to theoretical win rate of 1.35% increases IB
(normalised) EBITDA by $5.8m from $8.5m Reported to $14.3m Normalised
Tax adjustments relate to the release of deferred tax balances in Australia no longer j g
required
Gaming revenue figures reflect gaming win (inclusive of gaming GST). This facilitates
Australasian comparisons. It also facilitates period on period comparisons given the GST
h l d brate change in New Zealand on 1 October 2010
Non‐gaming revenues are net of GST
Total revenues are gaming win plus non‐gaming revenues Total revenues are gaming win plus non‐gaming revenues
EBITDA margin is calculated as a % of gaming win (GST inclusive) plus non‐gaming revenue ‐
to facilitate Australasian and period on period comparisons
41

SKYCITY Auckland FY12– including Normalised IB
FY12$m
FY11$m
Movement $m %
Revenues
Machines 226.8 206.2 20.6 10.0%
g
Tables – Local 119.9 116.7 3.2 2.7%
Tables – International (Normalised) 50.7 26.0 24.7 95.0%
Gross Gaming Revenue (incl GST) 397.4 348.9 48.5 13.9%
Food d Be e ge 45 1 36 3 8 8 24 2%Food and Beverage 45.1 36.3 8.8 24.2%
Hotels and Conventions 61.3 53.7 7.6 14.2%
Sky Tower, Parking, Other 23.6 22.3 1.3 5.8%
Non‐Gaming Revenue 130.0 112.3 17.7 15.8%
Total Revenue (incl gaming GST) 527.4 461.2 66.2 14.4%
Gaming GST 49.7 42.3 (7.4) (17.5%)
Total Revenue (excl gaming GST) 477.7 418.9 58.8 14.0%
Expenses 259.8 222.0 (37.8) (17.0%)p ( ) ( )
Normalised EBITDA including IB
EBITDA Margin
217.941.3%
196.942.7%
21.0 10.7%
Auckland IB to Actual win rate (7.3) 9.9 (17.2)
Reported EBITDA including IB 210.6 206.8 3.8 1.8%
42
Reported EBITDA including IB 210.6 206.8 3.8 1.8%
• EBITDA margin is calculated as a % of GST‐inclusive gaming revenues and GST‐exclusive non‐gaming revenues to facilitate Australasian comparisons
SKYCITY Auckland 2H12– including Normalised IB
2H12$m
2H11$m
Movement $m %
Revenues
Machines 108.9 105.2 3.7 3.5%
g
Machines 108.9 105.2 3.7 3.5%
Tables – Local 59.4 55.9 3.5 6.3%
Tables – International (Normalised) 32.1 11.2 20.9 186.6%
Gross Gaming Revenue (incl GST) 200.4 172.3 28.1 16.3%
F d d B %Food and Beverage 22.0 17.5 4.5 25.7%
Hotels and Conventions 24.4 24.9 (0.5) (2.0%)
Sky Tower, Parking, Other 11.7 11.4 0.3 2.6%
Non‐Gaming Revenue 58.1 53.8 4.3 8.0%
Total Revenue (incl gaming GST) 258.5 226.1 32.4 14.3%
Gaming GST 25.1 21.6 (3.5) (16.2%)
Total Revenue (excl gaming GST) 233.4 204.5 28.9 14.1%
Expenses 129.9 108.6 (21.3) (19.6%)p 9 9 ( 3) ( 9 )
Normalised EBITDA including IB
EBITDA Margin
103.540.0%
95.942.4%
7.6 7.9%
Auckland IB to Actual win rate (8.4) 9.2 (17.6)
Reported EBITDA including IB 95 1 105 1 (10 0) (9 5%)
43
Reported EBITDA including IB 95.1 105.1 (10.0) (9.5%)
• EBITDA margin is calculated as a % of GST‐inclusive gaming revenues and GST‐exclusive non‐gaming revenues to facilitate Australasian comparisons

SKYCITY Auckland 2H12
Revenue, EBITDA and Margin
42.4% 40.0%
2H12 Revenues up $32.4m (+14.3%) on 2H11
Gaming machines growth of 3.5% on a strong pcp. Bally
implementation, while successful, impacted visitation,
$226.1m$258.5m
$95.9m $103.5m
customer experience and availability of machines in Q4‐12
2H12 local table games revenue growth of 6.3%, on a drop
increase of 7.8%. Hold at c.19% was slightly lower than
pcp, driven by a movement in player game preference
2H11 2H12Revenue EBITDA
the new facilities in "Eight" for local premium
players has been a very successful growth driver in
FY12
"Horizon" suites and salons drove the International
Revenue Growth by Type (v pcp)
186.6%14.3%
Business revenue growth of 187% in 2H12, from $11m to
$32m
Solid 8% growth in non‐gaming driven by new F&B outlets
on Federal St and Hotels performing well in a softer
3.5%6.3%
8.0%
Machines Tables -Local
IB Non Gaming
Total
market (hotels continue to outperform competitor sets)
Lower EBITDA margin at 40% is due to change in business
mix (more IB and F&B revenues) and some additional
customer marketing investment in 2H12
44
Gaming revenue figures as shown in the charts on this page are gaming win (inclusive GST). This facilitates Australasian comparisons. It also facilitates period on period comparisons given the GST rate change in New Zealand on 1 October 2010 Non gaming revenues are net of GST Total revenues as shown are gaming win plus non‐gaming revenues EBITDA margin is calculated as a % of gaming win (GST inclusive) plus non‐gaming revenue ‐ to facilitate Australasian and period on period comparisons
NZICC – Expected Returns
The returns to SKYCITY from investing in the NZICC are anticipated to be derived from:
The contribution from operating the NZICC and parking
The on‐spend from the significant additional expected visitation
expect around 350k business event visitor days, plus additional visitation from concerts and
other major events which can be held at the NZICC
Improved accessibility via additional car parking and a pedestrian link way bridge
Incremental gaming cash flows from additional gaming product and regulatory reforms delivering
greater operating efficiencies
also allows for a more contemporary gaming product offering equivalent to competitors also allows for a more contemporary gaming product offering equivalent to competitors
An extension of the term of the Auckland Casino Licence beyond the current term
provides valuable certainty for a range of different stakeholders and ensures the sustainability
of our largest operationsg p
45

Significant Benefits for New Zealand
Significant Economic Benefits
Experts predict the NZICC will bring >180,000 business event delegates to Auckland,
generating over 350,000 delegate days per annum
This includes over 30,000 international visitors who wouldn’t come to New Zealand, but for
these events
The extra spending by these international visitors will be in excess of $90 million per annum
this equates to around $50m in value added to the New Zealand economy per annum –this equates to around $50m in value added to the New Zealand economy per annum
a Rugby World Cup every 2 years
Jobs and Training
Estimated 1,000 jobs during the construction phaseEstimated 1,000 jobs during the construction phase
Around 800 jobs once fully operational
Significant training and apprenticeships for young New Zealanders
Lucrative Business Events tourism
Spend more than average tourists
Stay longer than average tourists
46
SKYCITY Auckland – International Business
Table Games – International Business (IB) in Auckland
"Horizon", our new investment in private gaming salons and hotel suites for International VIP players, was
successfully opened in July 2011
Players have reacted extremely positively to the enhanced facilities. The enlarged area allow us to leverage
peak periods, such as Chinese New Year and other holidays, and host more players and groups more often
FY12 Turnover was $3.8bn, +95% on PCP. FY12 Actual win rate only 1.03%, lower than the theoretical 1.35%
l h l kl d b dl h l
FY12 FY11 FY10 Movement FY12 vs FY11
$ %Movement FY12 vs FY10
$ %
Turnover ($bn) 3.8 1.9 1.2 1.8 95% 2.6 207%
Actual win rate over the last 3‐years in Auckland is 1.34%, broadly at theoretical
($ ) 3 9 95 7
Normalised Hold % 1.35% 1.35% 1.35%
Normalised Win ($m) 50.7 26.0 16.5 24.7 95% 34.2 207%
Normalised EBITDA ($m) 12.5 6.2 2.9 6.3 102% 9.6 331%
Actual Hold % 1.03% 1.98% 1.19% (0.95 pts) (0.16 pts)
Actual Win ($m) 38.6 38.0 14.5 0.6 2% 24.1 166%
Actual EBITDA ($m) 5.2 16.1 1.3 (10.9) (68%) 3.9 300%
47

International Business ‐ Consolidated Result
FY12 FY11 Movement FY12 FY11NZ$m NZ$m NZ$m % Win % Win %
Turnover (NZ$b)Auckland 3.8 1.9 1.9 95.0% Other 0.6 0.9 (0.3) (22.1%)Total Actual Turnover 4.4 2.8 1.6 59.5%
Actual Revenue (incl Gaming GST)Auckland 38.6 38.0 0.6 1.6% 1.03% 1.98%Other 11.3 9.4 1.9 20.2% 1.67% 1.00%Total Actual Revenue 49.9 47.4 2.5 5.3% 1.13% 1.71%
Actual EBITDA Auckland 5.2 16.1 (10.9) (67.7%)Other 3.3 0.1 3.2 3,200.0%
( ) ( )Total Actual EBITDA 8.5 16.2 (7.7) (47.5%)
Normalised Revenue (incl Gaming GST)Auckland 50.7 26.0 24.7 95.0% 1.35% 1.35%Other 8.8 11.3 (2.5) (22.1%) 1.35% 1.35%Other 8.8 11.3 (2.5) (22.1%) 1.35% 1.35%Total Normalised Revenue 59.5 37.3 22.2 59.5% 1.35% 1.35%
Normalised EBITDA Auckland 12.5 6.2 6.3 101.6% Other 1.8 2.3 (0.5) (21.7%)Total Normalised EBITDA 14.3 8.5 5.8 68.2%
48
Total Normalised EBITDA 14.3 8.5 5.8 68.2%
The difference between Normalised and Reported can be seen on page 40
Adelaide Casino FY12– including Normalised Adelaide IB
FY12A$m
FY11A$m
Movement A$m %
Revenues
g
Machines 65.0 59.9 5.1 8.5%
Tables – Local 73.1 73.4 (0.3) (0.4%)
Tables – International (Normalised) 6.1 6.8 (0.7) (10.3%)
Gross Gaming Revenue (incl GST) 144 2 140 1 4 1 2 9%Gross Gaming Revenue (incl GST) 144.2 140.1 4.1 2.9%
Food and Beverage, Other 16.6 16.7 (0.1) (0.6%)
Total Revenue (incl gaming GST) 160.8 156.8 4.0 2.6%
Gaming GST 13.1 12.6 (0.5) (4.0%)
Total Revenue (excl gaming GST) 147.7 144.2 3.5 2.4%
Expenses 111.0 108.2 (2.8) (2.6%)
Normalised EBITDA
EBITDA Margin
36.7
22.8%
36.023.0%
0.7 1.9%
Adjust IB to Actual win rate 0.8 (1.6) 2.4
Reported EBITDA 37.5 34.4 3.1 9.0%
49
• EBITDA margin is calculated as a % of GST‐inclusive gaming revenues and GST‐exclusive non‐gaming revenues to facilitate Australasian comparisons

Adelaide Casino 2H12– including Normalised Adelaide IB
2H12A$m
2H11A$m
Movement A$m %
Revenues
g
Machines 32.5 30.0 2.5 8.3%
Tables – Local 34.7 37.9 (3.2) (8.4%)
Tables – International (Normalised) 3.3 3.9 (0.6) (15.4%)
Gross Gaming Revenue (incl GST) 70.5 71.8 (1.3) (1.8%)g ( ) 7 5 7 ( 3) ( )
Food and Beverage, Other 7.7 7.7 0.0 0.0%
Total Revenue (incl gaming GST) 78.2 79.5 (1.3) (1.6%)
Gaming GST 6.4 6.4 0.0 0.0%
Total Revenue (excl gaming GST) 71.8 73.1 (1.3) (1.8%)
Expenses 54.3 54.1 (0.2) (0.4%)
Normalised EBITDA
EBITDA Margin
17.5
22.4%
19.0
23.9%
(1.5) (7.9%)
Adjust IB to Actual win rate (0.5) (1.9) 1.4
Reported EBITDA 17.0 17.1 (0.1) (0.6%)
50
• EBITDA margin is calculated as a % of GST‐inclusive gaming revenues and GST‐exclusive non‐gaming revenues to facilitate Australasian comparisons
Adelaide Casino 2H12
Revenue, EBITDA and Margin (A$)
23.9% 22.4%
Visitation and revenue strengthened in May and June
across the board
Solid EGMs Win and Market Share growth
$79.5m $78.2m
$19.0m $17.5m
Solid EGMs Win and Market Share growth
Local Table Gaming
whilst table games drop volumes grew 5% in
2H12, hold of only 19% disappointed compared to
prior year resulting in a revenue decline $ $17.5m
2H11 2H12Revenue EBITDA
prior year, resulting in a revenue decline
Non‐Gaming revenue softer in challenging economic
environment for Restaurants & Bars in Adelaide
EBITDA was impacted by the decrease in Table
Revenue Growth by Type (v pcp)
8.3%
0.0%
p y
Gaming hold, lower visitation in Jan‐Apr and expense
growth impacted by:
increased marketing costs to drive visitation and
spend
(8.4%)
(15.4%)
(1.6%)
Machines Tables -Local
IB Non Gaming
Total
sharp increase in utility costs (electricity charges
in particular) and insurance
51
Gaming revenue figures as shown in the charts on this page are gaming win (inclusive GST). This facilitates Australasian comparisons Non gaming revenues are net of GST Total revenues as shown are gaming win plus non‐gaming revenues EBITDA margin is calculated as a % of gaming win (GST inclusive) plus non‐gaming revenue ‐ to facilitate Australasian comparisons

SKYCITY Darwin FY12– including Normalised Darwin IB
FY12A$m
FY11A$m
Movement A$m %
Revenues
M hi 6 %
g
Machines 60.2 59.5 0.7 1.2%
Tables – Local 16.6 15.2 1.4 9.2%
Tables – International (Normalised) 0.3 1.1 (0.8) (72.7%)
Keno 14.6 12.3 2.3 18.7%4 3 3 7
Gross Gaming Revenue (incl GST) 91.7 88.1 3.6 4.1%
Food and Beverage, Hotel, Other 26.2 25.5 0.7 2.7%
Total Revenue (incl gaming GST) 117.9 113.6 4.3 3.8%
Gaming GST 8.3 7.9 (0.4) (5.1%)
Total Revenue (excl gaming GST) 109.6 105.7 3.9 3.7%
Expenses 74.9 71.4 (3.5) (4.9%)
Normalised EBITDA 34 7 34 3 0 4 1 2%Normalised EBITDA
EBITDA Margin
34.7
29.4%
34.3
30.2%
0.4 1.2%
Adjust IB to Actual win rate 0.1 (0.9) 1.0
Reported EBITDA 34.8 33.4 1.4 4.2%
52
• EBITDA margin is calculated as a % of GST‐inclusive gaming revenues and GST‐exclusive non‐gaming revenues to facilitate Australasian comparisons
SKYCITY Darwin 2H12– including Normalised Darwin IB
2H12A$m
2H11A$m
Movement A$m %
Revenues
M hi 8 6 8 %
g
Machines 27.8 26.8 1.0 3.7%
Tables – Local 7.2 6.8 0.4 5.9%
Tables – International (Normalised) 0.3 0.1 0.2 200.0%
Keno 7.4 5.8 1.6 27.6%7 4 5 7
Gross Gaming Revenue (incl GST) 42.7 39.5 3.2 8.1%
Food and Beverage, Hotel, Other 11.6 10.6 1.0 9.4%
Total Revenue (incl gaming GST) 54.3 50.1 4.2 8.4%
Gaming GST 3.8 3.5 (0.3) (8.6%)
Total Revenue (excl gaming GST) 50.5 46.6 3.9 8.4%
Expenses 36.6 33.0 (3.6) (10.9%)
Normalised EBITDA 13 9 13 6 0 3 2 2%Normalised EBITDA
EBITDA Margin
13.9
25.6%
13.6
27.1%
0.3 2.2%
Adjust IB to Actual win rate (0.2) (0.2) 0.0
Reported EBITDA 13.7 13.4 0.3 2.2%
53
• EBITDA margin is calculated as a % of GST‐inclusive gaming revenues and GST‐exclusive non‐gaming revenues to facilitate Australasian comparisons

SKYCITY Darwin 2H12
Revenue, EBITDA and Margin (A$)
27.1% 25.6%
Overall revenue growth in 2H12 of 8.4% was very
encouraging and shows the momentum returning in Darwin
Gaming machines revenue up 3 7% from roll out of new Gaming machines revenue up 3.7%, from roll out of new
product and strategic marketing initiatives directed at key
player demographics
Local Table games revenue up 5.9%, capitalising on new
growth in 1H12
$50.1m $54.3m
$13.6m $13.9mgrowth in 1H12
Keno revenues grew by $1.6m (+27.6%) as the 10 spot
jackpot pool grew to over $2.2m
Non‐gaming revenues increased $1.0m in 2H12 due to the
2H11 2H12
Revenue EBITDA
Revenue Growth by Type (v pcp)
g g
completion of two restaurant refurbishments creating
increased visitation. Hotel room refurbishments also
brought additional rooms online for 2H12
Normalised EBITDA of $13.9m is up 2.2% on 2H11. Additional
27.6%
3 9 p
expenses were being incurred to bring new venue offerings
on line, as well as ramping up for Lagoon Resort
development opening. This includes a marketing and
promotion strategy positioning SKYCITY as Darwin’s vibrant
and exciting entertainment venue
3.7%
8.7% 9.4% 8.4%
Machines Tables Keno Non Gaming
Total
54
Gaming revenue figures as shown in the charts on this page are gaming win (inclusive GST). This facilitates Australasian comparisons Non gaming revenues are net of GST Total revenues as shown are gaming win plus non‐gaming revenues EBITDA margin is calculated as a % of gaming win (GST inclusive) plus non‐gaming revenue ‐ to facilitate Australasian comparisons
and exciting entertainment venue
SKYCITY Hamilton FY12– including Normalised Hamilton IB
FY12$m
FY11$m
Movement $m %
Revenues
g
Machines 33.7 29.6 4.1 13.9%
Tables – Local 9.6 10.2 (0.6) (5.9%)
Tables – International (Normalised) 0.4 0.9 (0.5) (55.6%)
Gross Gaming Revenue (incl GST) 43 7 40 7 3 0 7 4%Gross Gaming Revenue (incl GST) 43.7 40.7 3.0 7.4%
Food and Beverage, Other 8.4 7.2 1.2 16.7%
Total Revenue (incl gaming GST) 52.1 47.9 4.2 8.8%
Gaming GST 5.6 5.1 (0.5) (9.8%)
Total Revenue (excl gaming GST) 46.5 42.8 3.7 8.6%
Expenses 24.7 22.6 (2.1) (9.3%)
Normalised EBITDA
EBITDA Margin
21.8
41 8%
20.2
42 2%
1.6 7.9%
EBITDA Margin 41.8% 42.2%
Adjust IB to Actual win rate 0.3 1.2 (0.9)
Reported EBITDA 22.1 21.4 0.7 3.3%
55
• EBITDA margin is calculated as a % of GST‐inclusive gaming revenues and GST‐exclusive non‐gaming revenues to facilitate Australasian comparisons

SKYCITY Hamilton 2H12– including Normalised Hamilton IB
2H12$m
2H11$m
Movement $m %
Revenues
g
Machines 16.6 15.0 1.6 10.7%
Tables – Local 5.0 5.2 (0.2) (3.8%)
Tables – International (Normalised) 0.0 0.8 (0.8) (100.0%)
Gross Gaming Revenue (incl GST) 21.6 21.0 0.6 2.9%Gross Gaming Revenue (incl GST) 21.6 21.0 0.6 2.9%
Food and Beverage, Other 4.0 3.6 0.4 11.1%
Total Revenue (incl gaming GST) 25.6 24.6 1.0 4.1%
Gaming GST 2.7 2.8 (0.1) (3.6%)
Total Revenue (excl gaming GST) 22.9 21.8 1.1 5.0%
Expenses 12.1 11.6 (0.5) (4.3%)
Normalised EBITDA
EBITDA Margin
10.8
42.2%
10.2
41.5%
0.6 5.9%
Adjust IB to Actual win rate (0.2) 0.9 (1.1)
Reported EBITDA 10.6 11.1 (0.5) (4.5%)
56
• EBITDA margin is calculated as a % of GST‐inclusive gaming revenues and GST‐exclusive non‐gaming revenues to facilitate Australasian comparisons
SKYCITY Hamilton 2H12
Revenue, EBITDA and Margin
41.5%42.2%
Hamilton’s 2H12 growth on a strong pcp is a result of
successful main gaming floor initiatives combined
with a focus on improving customer experiences with a focus on improving customer experiences
across the property
Machine and non‐gaming revenues were both up in
2H12, offset by table games (hold % down on PY),
$24.6m $25.6m
$10.2m $10.8m
Revenue Growth by Type (v pcp)
delivering an overall revenue growth of 4.1%
Gaming machine revenue growth continued again in
2H12, up 10.7% on 2H11
2H11 2H12Revenue EBITDA
Revenue Growth by Type (v pcp)
10.7% 11.1%
4.1%
Non‐gaming revenues increase in 2H12 reflects an
improved range of dining and entertainment
offerings
(3.8%)
(100.0%)
Machines Tables -Local
IB Non Gaming
Total
Hamilton continues to perform profitably, with 2H12
EBITDA of $10.8m (+5.9%) and at an increased margin
57
Gaming revenue figures as shown in the charts on this page are gaming win (inclusive GST). This facilitates Australasian comparisons. It also facilitates period on period comparisons given the GST rate change in New Zealand on 1 October 2010 Non gaming revenues are net of GST Total revenues as shown are gaming win plus non‐gaming revenues EBITDA margin is calculated as a % of gaming win (GST inclusive) plus non‐gaming revenue ‐ to facilitate Australasian and period on period comparisons

Cash Flows
Consistent and reliable cash flows
SKYCITY continues to generate strong cash
flows
Cashflow summary FY12 FY11
Reported EBITDA 300.5 294.3
Tax paid (49.3) (62.5)
Working capital/other 10 5 (22 4)
cash flows from operating activities were
$262m and $209m in FY12 and FY11
respectively
C d $ 6
Working capital/other 10.5 (22.4)
Operating cash flow 261.7 209.4
Capex ‐ disposals 1.7 4.1
Capex ‐ maintenance (53.4) (44.0)
Capex ‐ development (113.0) (36.8)
N t C ( 6 ) ( 6 ) Capex spend $165m
capex includes completing the Auckland
projects ($32m), Auckland land purchases
($32m), continued development of the
Darwin Tropical Resort (A$25m) and Bally
Net Capex (164.7) (76.7)
Free cash flow 97.0 132.7
Dividends (93.3) (93.1)
Interest paid (49.0) (44.8)
Share purchases (7.2) (11.4) Darwin Tropical Resort (A$25m) and Bally
($10m). The balance broadly consists of
development and maintenance capex across
all sites1
Repayment of debt (264.5) (199.4)
New debt 241.3 238.8
Derivatives/other 12.5 (20.7)
Change in cash balance (63.2) 2.1
Opening cash balance 104.6 102.5
Working Capital/Other
these adjustments relate primarily to
movements in the underlying working capital
of the Group
Closing cash balance 41.4 104.6
58
1 Dollar amounts represent cash expenditure in FY12
Consolidated Balance SheetSKYCITY Entertainment Group Limited
EquityAs at 30/06/12
NZ$m
As at 30/06/11NZ$m
Movement
NZ$m
Share Capital 727.6 728.6 (1.0)
Retained profits 81.7 41.1 40.6
Equity
⁻ Movements in share capital relate to the employee long‐term incentive plan and the dividend reinvestment plan
⁻ Movement in retained profits records Reserves (1.9) 3.7 (5.6)
Minority interests 1.7 1.4 0.3
Total Equity 809.1 774.8 34.3
Current Assets
Cash and bank 41 4 104 6 (63 2)
Movement in retained profits records the current year’s net profit after tax less the FY11 final dividend and FY12 interim dividend
Reserves
⁻ The movement in foreign currency Cash and bank 41.4 104.6 (63.2)
Receivables and prepayments 27.0 30.9 (3.9)
Inventories 6.8 7.0 (0.2)
Tax prepayment 35.5 36.6 (1.1)
Derivative financial instruments 0.5 0.3 0.2
Total Current Assets 111.2 179.4 (68.2)
translation reserve reflects changes in the New Zealand dollar value of the company’s net Australian assets due to movements in the NZD/AUD exchange rate
⁻ The movement in the cash flow hedge
Non‐Current Assets
Property, plant and equipment 1,064.4 991.3 73.1
Intangible assets 410.7 410.4 0.3
Investments in associates 75.2 73.8 1.4
Tax prepayment 31.6 27.8 3.8
reserve represents fair value movements in SKYCITY’s interest rate and cross currency interest rate swaps that are part of cash flow hedging relationships
⁻ Minority interest of $1.7m is Skyline 3 3
Derivative financial instruments 23.1 ‐ 23.1
Total Non‐Current Assets 1,605.0 1,503.3 101.7
Total Assets 1,716.2 1,682.7 33.5
Enterprises’ 40% shareholding in Queenstown Casino
Current Assets
⁻ Cash and bank balances: $2.5m interest‐bearing deposits and $38.9m cash held in‐house/on‐property
59
in house/on property

Consolidated Balance Sheet (continued)
SKYCITY Entertainment Group Limited
As at 30/06/12NZ$m
As at 30/06/11NZ$m
MovementNZ$m
Total Assets (carried forward) 1,716.2 1,682.7 33.5
Current Liabilities
bl
Non‐Current Assets
⁻ $73.1m increase in Property, Plant and Equipment relates primarily to additions ("Horizon"/"Eight", Diamond Room, Fortuna B ff t F d l St t D i T i l R t Payables 107.2 110.9 3.7
Current tax liabilities 8.0 5.3 (2.7)
Interest bearing liabilities ‐ Current ‐ 247.3 247.3
Derivative financial instruments 0.6 10.1 9.5
Total Current Liabilities 115.8 373.6 257.8
Non‐Current Liabilities
Buffet, Federal Street, Darwin Tropical Resort, gaming machines and land purchases in Auckland), partially offset by depreciation and the impact of movement in the NZD/AUD exchange rate (‐$3.3m impact)
⁻ The increase in intangible assets is largely the B ll G i S l f ll ff
Interest bearing liabilities ‐ Term 604.9 350.2 (254.7)
Subordinated debt ‐ capital notes 56.4 56.4 ‐
Deferred tax liabilities 84.6 94.3 9.7
Derivative financial instruments 45.4 33.4 (12.0)
Total Non‐Current Liabilities 791.3 534.3 (257.0)
new Bally Gaming System, almost fully offset by the result of movements in the NZD/AUD exchange rate and amortisation
⁻ Investments in Associates comprise SKYCITY’s investment in Christchurch Casinos Limited (CCL) (effective ownership 50%). The balance
Total Liabilities 907.1 907.9 0.8
Net Assets 809.1 774.8 34.3
Net Debt (excluding cash in house)
Net Debt:EBITDA
658.8
2.1
598.2
2.0
(60.6)
of the investment in CCL is held via shareholder advances
Current and Non‐Current Liabilities
⁻ Derivative financial instruments represent the k l f
Net Debt:EBITDA 2.1 2.0
Net Position of Derivative Financial Instrumentsincluded in Balance Sheet
Assets/(Liabilities)(22.4) (43.2) 20.8
market value of interest rate swaps, cross currency interest rate swaps and forward foreign exchange contracts
⁻ At 30 June 2012 all interest bearing liabilities (US Private Placement debt and bank facility) are non‐current
60
Australian Dollar EarningsAdelaide and Darwin
FY12 NPAT result comparison to FY11 is impacted by NZD/AUD exchange rate
Average NZD/AUD cross‐rate during FY12 0.7813
Average NZD/AUD cross‐rate during FY11 0.7668
Restating FY11 prior period at 0.7813 to remove the FX differential would have the
following impact
FY11 Reported EBITDA (‐$1.6m)
FY11 Normalised EBITDA (‐$1.7m)
FY11 Reported NPAT (‐$0.6m)
FY11 Normalised NPAT (‐$0.7m)
61

Disclaimer
All information included in this presentation is provided as at 15 August 2012.
The presentation includes a number of forward‐looking statements. Forward looking statements, by their nature, involve inherent risks and uncertainties. Many of those risks and uncertainties are matters which are beyond SKYCITY’s control and could cause actual results to differ from those predicted. Variations could either be materially positive or materially negative.
This presentation has not taken into account any particular investor’s investment objectives or other circumstances. Investors are encouraged to make an independent assessment of SKYCITY.
62

APPENDIX 7 – NZSX Listing Rules
Number of pages including this one(Please provide any other relevant
NZSX Listing Rule 7.12.2. For rights, NZSX Listing Rules 7.10.9 and 7.10.10. details on additional pages)For change to allotment, NZSX Listing Rule 7.12.1, a separate advice is required.
Full nameof Issuer
Name of officer authorised to Authority for event,make this notice e.g. Directors' resolution
Contact phone Contact faxnumber number Date
Nature of event Bonus If ticked, Rights IssueTick as appropriate Issue state whether: Taxable / Non Taxable Conversion Interest Renouncable
Rights Issue Capital Call Dividend If ticked, state Fullnon-renouncable change whether: Interim Year Special DRP Applies
EXISTING securities affected by this If more than one security is affected by the event, use a separate form.
Description of the ISINclass of securities
If unknown, contact NZX
Details of securities issued pursuant to this event If more than one class of security is to be issued, use a separate form for each class.
Description of the ISINclass of securities
If unknown, contact NZX
Number of Securities to Minimum Ratio, e.gbe issued following event Entitlement 1 for 2 for
Conversion, Maturity, Call Treatment of FractionsPayable or Exercise Date
Tick if provide anpari passu OR explanation
Strike price per security for any issue in lieu or date of theStrike Price available. ranking
Monies Associated with Event Dividend payable, Call payable, Exercise price, Conversion price, Redemption price, Application money.
Source ofAmount per security Payment(does not include any excluded income)
Excluded income per security(only applicable to listed PIEs)
Supplementary Amount per securityCurrency dividend in dollars and cents
details -NZSX Listing Rule 7.12.7
Total monies
Taxation Amount per Security in Dollars and cents to six decimal places
In the case of a taxable bonus Resident Imputation Creditsissue state strike price Withholding Tax (Give details)
Foreign FWP CreditsWithholding Tax (Give details)
Timing (Refer Appendix 8 in the NZSX Listing Rules)
Record Date 5pm Application DateFor calculation of entitlements - Also, Call Payable, Dividend /
Interest Payable, Exercise Date,Conversion Date. In the caseof applications this must be thelast business day of the week.
Notice Date Allotment DateEntitlement letters, call notices, For the issue of new securities.conversion notices mailed Must be within 5 business days
of application closing date.
OFFICE USE ONLYEx Date:Commence Quoting Rights: Security Code:Cease Quoting Rights 5pm:Commence Quoting New Securities: Security Code:Cease Quoting Old Security 5pm:
28 September, 2012 5 October, 2012
$ $0.013893 $0.018667
$
NZ Dollars $0.008471
$46,156,667 Date Payable 5 October, 2012
Enter N/A if not applicable
NZSKCE0001S2
In dollars and cents
Profit$0.0800
(09) 363 6141 (09)363 6140 15 8 2012
Ordinary Shares
EMAIL: [email protected]
Notice of event affecting securities
SKYCITY Entertainment Group Limited
Peter Treacy Directors' resolution


PricewaterhouseCoopers, 188 Quay Street, Private Bag 92162, Auckland 1142, New ZealandT: +64 (9) 355 8000, F: +64 (9) 355 8001,
Independent Auditors’ Reportto the shareholders of
Report on the Financial StatementsWe have audited the financial statements ofCompany”) on pages 1 to 49statements, statements of comprehensive incomestatements of cash flows for the year then ended,include a summary of significantthe Company and the Group.30 June 2012 or from time to time during the financial year.
Directors’ Responsibility for the Financial StatementsThe Directors are responsible for the preparation ofwith generally accepted accounting practice in New Zealand and that give a true and fair view ofthe matters to which they relate and for such internal controls as the Directors determine arenecessary to enable the prepmisstatement, whether due to fraud or error.
Auditors’ ResponsibilityOur responsibility is to express an opinion on these financial statements based on our audit. Weconducted our audit in accordInternational Standards on Auditing. These standards require that we comply with relevantethical requirements and plan and perform the audit to obtain reasonable assurance aboutwhether the financial statements are free from material misstatement.
An audit involves performing procedures to obtain audit evidence about the amounts anddisclosures in the financial statements. The proceduresjudgement, including the assessment of the risks of material misstatement of the financialstatements, whether due to fraud or error. In making those risk assessments, the auditorconsider the internal controls relevant to thestatements that give a true and fair view of the matters to which they relateaudit procedures that are appropriate in the circumstances, but not for the purpose ofexpressing an opinion on the effectiveness of the Company andaudit also includes evaluating the appropriateness of accounting policies used and thereasonableness of accounting estimates, as well as evaluating the overall presentation of thefinancial statements.
We believe that the audit evidebasis for our audit opinion.
We have no relationship with,its subsidiaries other than in our capacities as auditorassurance and advisory services.of the Company and the Group.
PricewaterhouseCoopers, 188 Quay Street, Private Bag 92162, Auckland 1142, New ZealandT: +64 (9) 355 8000, F: +64 (9) 355 8001, www.pwc.com/nz
Independent Auditors’ Reportto the shareholders of SKYCITY Entertainment Group Limited
Report on the Financial Statementsfinancial statements of SKYCITY Entertainment Group Limited1 to 49, which comprise the balance sheets as at 30 June 2012
statements of comprehensive income, statements of changes in equityfor the year then ended, and the notes to the financial statements that
include a summary of significant accounting policies and other explanatory informationthe Company and the Group. The Group comprises the Company and the entities it controll
or from time to time during the financial year.
Directors’ Responsibility for the Financial StatementsThe Directors are responsible for the preparation of these financial statements in accordancewith generally accepted accounting practice in New Zealand and that give a true and fair view ofthe matters to which they relate and for such internal controls as the Directors determine arenecessary to enable the preparation of financial statements that are free from material
, whether due to fraud or error.
Auditors’ ResponsibilityOur responsibility is to express an opinion on these financial statements based on our audit. Weconducted our audit in accordance with International Standards on Auditing (New Zealand) andInternational Standards on Auditing. These standards require that we comply with relevantethical requirements and plan and perform the audit to obtain reasonable assurance about
inancial statements are free from material misstatement.
An audit involves performing procedures to obtain audit evidence about the amounts andfinancial statements. The procedures selected depend on the auditor
e assessment of the risks of material misstatement of the financialstatements, whether due to fraud or error. In making those risk assessments, the auditor
the internal controls relevant to the Company and the Group’s preparation of financialatements that give a true and fair view of the matters to which they relate,
audit procedures that are appropriate in the circumstances, but not for the purpose ofthe effectiveness of the Company and the Group’s
audit also includes evaluating the appropriateness of accounting policies used and thereasonableness of accounting estimates, as well as evaluating the overall presentation of the
We believe that the audit evidence we have obtained is sufficient and appropriate to provide abasis for our audit opinion.
We have no relationship with, or interests in, SKYCITY Entertainment Group Limitedan in our capacities as auditors and providers of accounting, taxservices. These services have not impaired our independence as auditorsGroup.
PricewaterhouseCoopers, 188 Quay Street, Private Bag 92162, Auckland 1142, New Zealand
Entertainment Group Limited (“the30 June 2012, the income
in equity andand the notes to the financial statements that
d other explanatory information for bothThe Group comprises the Company and the entities it controlled at
financial statements in accordancewith generally accepted accounting practice in New Zealand and that give a true and fair view ofthe matters to which they relate and for such internal controls as the Directors determine are
aration of financial statements that are free from material
Our responsibility is to express an opinion on these financial statements based on our audit. Weance with International Standards on Auditing (New Zealand) and
International Standards on Auditing. These standards require that we comply with relevantethical requirements and plan and perform the audit to obtain reasonable assurance about
An audit involves performing procedures to obtain audit evidence about the amounts andselected depend on the auditors’
e assessment of the risks of material misstatement of the financialstatements, whether due to fraud or error. In making those risk assessments, the auditors
’s preparation of financial, in order to design
audit procedures that are appropriate in the circumstances, but not for the purpose ofinternal control. An
audit also includes evaluating the appropriateness of accounting policies used and thereasonableness of accounting estimates, as well as evaluating the overall presentation of the
nce we have obtained is sufficient and appropriate to provide a
or interests in, SKYCITY Entertainment Group Limited or any ofproviders of accounting, tax, other
These services have not impaired our independence as auditors

Independent Auditors’ ReportSKYCITY Entertainment Group Limited
OpinionIn our opinion, the financial statements on pages
(i) comply with generally accepted accounting practice in New Zealand;
(ii) comply with International Financial Reporting Standards
(iii) give a true and fair view of the financial position of the Company and the Group asat 30 June 2012ended.
Report on Other Legal and Regulatory RequirementsWe also report in accordance with Sections 16(1)(d) and 16(1)(e) of the Financial Reporting Act1993. In relation to our audit of the
(i) we have obtained all the information and explanations that we have required; and
(ii) in our opinion, proper accounting records have been kept by the Company as far asappears from an examination of those records.
Restriction on Distribution or UseThis report is made solely to the205(1) of the Companies Act 1993. Our audit work has been undertaken so that we might stateto the Company’s shareholders those matters whicauditors’ report and for no other purpose. To the fullest extent permitted by law, we do notaccept or assume responsibshareholders, as a body, for
Chartered Accountants15 August 2012
Independent Auditors’ ReportSKYCITY Entertainment Group Limited
In our opinion, the financial statements on pages 1 to 49:
with generally accepted accounting practice in New Zealand;
comply with International Financial Reporting Standards; and
give a true and fair view of the financial position of the Company and the Group as30 June 2012, and their financial performance and cash flows
Report on Other Legal and Regulatory RequirementsWe also report in accordance with Sections 16(1)(d) and 16(1)(e) of the Financial Reporting Act
In relation to our audit of the financial statements for the year ended
we have obtained all the information and explanations that we have required; and
in our opinion, proper accounting records have been kept by the Company as far asappears from an examination of those records.
Distribution or Uses report is made solely to the Company’s shareholders, as a body, in accordance with Section
205(1) of the Companies Act 1993. Our audit work has been undertaken so that we might stateshareholders those matters which we are required to state to them in an
auditors’ report and for no other purpose. To the fullest extent permitted by law, we do notaccept or assume responsibility to anyone other than the Company and the
as a body, for our audit work, for this report or for the opinions we have formed.
with generally accepted accounting practice in New Zealand; and
give a true and fair view of the financial position of the Company and the Group asand cash flows for the year then
Report on Other Legal and Regulatory RequirementsWe also report in accordance with Sections 16(1)(d) and 16(1)(e) of the Financial Reporting Act
year ended 30 June 2012:
we have obtained all the information and explanations that we have required; and
in our opinion, proper accounting records have been kept by the Company as far as
shareholders, as a body, in accordance with Section205(1) of the Companies Act 1993. Our audit work has been undertaken so that we might state
h we are required to state to them in anauditors’ report and for no other purpose. To the fullest extent permitted by law, we do not
and the Company’sor for the opinions we have formed.
Auckland

-1-
SKYCITY Entertainment Group Limited Income statements
For the year ended 30 June 2012
Consolidated Parent 2012 2011 2012 2011
Notes $'000 $'000 $'000 $'000
Total receipts including GST 3 960,203 902,381 - - Less non-gaming GST 3 (26,398) (22,562) - - Gaming win plus non-gaming revenue 3 933,805 879,819 - - Less gaming GST 3 (82,275) (76,674) - - Revenue 3 851,530 803,145 - -
Other income 4 1,928 1,261 110,178 100,133 Shares of net profits of associates 5,447 5,976 - - Employee benefits expense (276,642) (260,676) (22,117) (18,458) Other expenses 5 (100,354) (92,623) (3,782) (6,391) Direct consumables (62,190) (52,607) - - Gaming taxes and levies (64,039) (61,275) - - Marketing and communications (49,909) (44,886) (441) (1,197) Directors' fees (1,034) (741) (1,034) (741) Depreciation and amortisation expense 5 (72,770) (69,710) (5,561) (5,958) Restructuring costs 5 (4,274) (3,298) (2,093) - Finance costs - net 6 (48,861) (43,772) (4,171) (3,908) Impairment of Christchurch Casino 15 - (15,000) - - Profit before income tax 178,832 165,794 70,979 63,480
Tax expense pre 2010 Government Budget changes 7 (39,962) (48,226) - - Profit for the year before tax expense relating to 2010 Government Budget changes 138,870 117,568 70,979 63,480 Tax expense relating to 2010 Government Budget changes - 5,435 - - Profit for the year 138,870 123,003 70,979
63,480
Income tax expense (39,962) (42,791) - -
Attributable to:
Profit attributable to shareholders of the company 138,534 122,960 70,979 63,480 Non controlling interest 24 336 43 -
- 138,870 123,003 70,979 63,480
Cents Cents
Earnings per share for profit attributable to the shareholders of the company: Basic earnings per share 8 24.0 21.4 Diluted earnings per share 8 23.8 20.9
The above income statements should be read in conjunction with the accompanying notes.
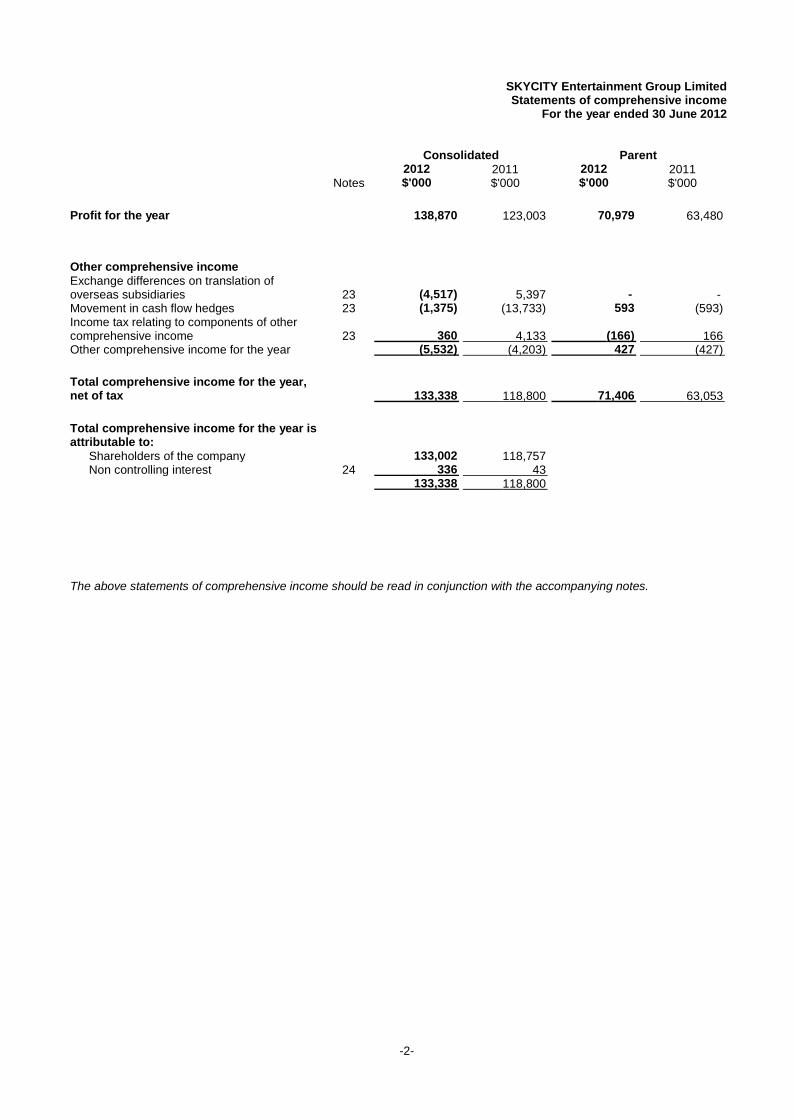
-2-
SKYCITY Entertainment Group Limited Statements of comprehensive income
For the year ended 30 June 2012
Consolidated Parent 2012 2011 2012 2011
Notes $'000 $'000 $'000 $'000
Profit for the year 138,870 123,003 70,979 63,480
Other comprehensive income
Exchange differences on translation of overseas subsidiaries 23 (4,517) 5,397 - - Movement in cash flow hedges 23 (1,375) (13,733) 593 (593) Income tax relating to components of other comprehensive income 23 360 4,133 (166) Other comprehensive income for the year
166 (5,532) (4,203) 427
Total comprehensive income for the year, net of tax
(427)
133,338 118,800 71,406
Total comprehensive income for the year is attributable to:
63,053
Shareholders of the company 133,002 118,757 Non controlling interest 24 336 43
133,338
118,800
The above statements of comprehensive income should be read in conjunction with the accompanying notes.

-3-
SKYCITY Entertainment Group Limited Balance sheets
As at 30 June 2012
Consolidated Parent 2012 2011 2012 2011
Notes $'000 $'000 $'000 $'000
ASSETS Current assets Cash and bank balances 9 41,400 104,577 1 1 Receivables and prepayments 10 26,974 30,900 153,629 87,376 Inventories 6,876 6,970 - - Tax prepayment 11 35,503 36,637 - - Derivative financial instruments 12 480 272 - Total current assets
- 111,233 179,356 153,630
Non-current assets
87,377
Tax prepayment 11 31,550 27,789 - - Property, plant and equipment 13 1,064,418 991,331 7,532 7,054 Investment in subsidiaries 30 - - 618,775 618,775 Intangible assets 14 410,645 410,412 10,031 10,696 Investments in associates 15 75,266 73,782 - - Derivative financial instruments 12 23,154 - - Total non-current assets
- 1,605,033 1,503,314 636,338
Total assets
636,525
1,716,266 1,682,670 789,968
LIABILITIES
723,902
Current liabilities Payables 16 107,186 110,851 344,768 250,997 Interest bearing liabilities 17 - 247,267 - - Current tax liabilities 11 7,972 5,349 - - Derivative financial instruments 12 664 10,102 - Total current liabilities
113 115,822 373,569 344,768
Non-current liabilities
251,110
Interest bearing liabilities 18 604,902 350,202 - - Subordinated debt - capital notes 19 56,414 56,400 56,414 56,400 Deferred tax liabilities 20 84,571 94,290 - - Derivative financial instruments 12 45,415 33,393 - Total non-current liabilities
- 791,302 534,285 56,414
Total liabilities
56,400
907,124 907,854 401,182
Net assets
307,510
809,142 774,816 388,786
EQUITY
416,392
Share capital 22 727,598 728,616 727,598 728,616 Reserves 23(a) (1,850) 3,682 - (427) Retained profits/(losses) 23(b) 81,690 41,150 (338,812) Parent entity interest
(311,797) 807,438 773,448 388,786
Non controlling interest
416,392
24 1,704 1,368 -
Total equity
-
809,142 774,816 388,786
The above balance sheets should be read in conjunction with the accompanying notes.
416,392

-4-
SKYCITY Entertainment Group Limited Statements of changes in equity For the year ended 30 June 2012
Consolidated Share
capital Hedging reserves
Foreign currency
translation reserve
Retained losses / profits
Minority interest
Total equity
Notes $'000 $'000 $'000 $'000 $'000 $'000
Balance as at 1 July 2010 732,910 (2,740) 10,625 17,397 1,325
Total comprehensive income/(expense)
759,517
- (9,600) 5,397 122,960 43 118,800
Dividends 25 - - - (99,207) - (99,207) Shares issued under dividend reinvestment plan 22 6,101 - - - - 6,101 Share rights issued for employee services 22 1,047 - - - - 1,047 Net purchase of treasury shares 22 (11,442) - - - - Balance as at 30 June 2011
(11,442)
728,616 (12,340) 16,022 41,150 1,368
Balance as at 1 July 2011
774,816
728,616 (12,340) 16,022 41,150 1,368
774,816
Total comprehensive income/(expense) - (1,015) (4,517) 138,534 336 133,338
Dividends 25 - - - (97,994) - (97,994) Shares issued under dividend reinvestment plan 22 4,736 - - - - 4,736 Share rights issued for employee services 22 1,426 - - - - 1,426 Net purchase of treasury shares 22 (7,180) - - - - Balance as at 30 June 2012
(7,180)
727,598 (13,355) 11,505 81,690 1,704 809,142

SKYCITY Entertainment Group Limited Statements of changes in equity For the year ended 30 June 2012
(continued)
-5-
Parent Share capital
Hedging reserves
Retained losses
Total equity
Notes $'000 $'000 $'000 $'000
Balance as at 1 July 2010
732,910 - (276,070)
Total comprehensive income/(expense)
456,840
- (427) 63,480 63,053
Shares issued under dividend reinvestment plan 22 6,101 - - 6,101 Dividends 25 - - (99,207) (99,207) Share rights issued for employee services 22 1,047 - - 1,047 Net purchase of treasury shares 22 (11,442) - - Balance as at 30 June 2011
(11,442)
728,616 (427) (311,797)
Balance as at 1 July 2011
416,392
728,616 (427) (311,797)
Total comprehensive income/(expense)
416,392
- 427 70,979 71,406
Shares issued under dividend reinvestment plan 22 4,736 - - 4,736 Dividends 25 - - (97,994) (97,994) Share rights issued for employee services 22 1,426 - - 1,426 Net purchase of treasury shares 22 (7,180) - -
(7,180) (1,018) - (97,994)
Balance as at 30 June 2012
(99,012)
727,598 - (338,812)
The above statements of changes in equity should be read in conjunction with the accompanying notes.
388,786

-6-
SKYCITY Entertainment Group Limited Statements of cash flows
For the year ended 30 June 2012
Consolidated Parent 2012 2011 2012 2011
Notes $'000 $'000 $'000 $'000
Cash flows from operating activities Receipts from customers 854,348 795,231 - - Payments to suppliers and employees (490,574) (469,413) (25,785)
(26,204)
363,774 325,818 (25,785)
Dividends received
(26,204)
3,968 747 - - Interest received 167 192 - - Gaming tax paid (56,841) (54,896) - - Income taxes paid (49,325) (62,496) - Net cash inflow / (outflow) from operating activities
-
33 261,743 209,365 (25,785)
Cash flows from investing activities
(26,204)
Purchase of/proceeds from property, plant and equipment (153,689) (74,822) - - Payments for intangible assets (11,008) (1,893) - - Loan repayment from Christchurch Hotels Limited 1,110 194 - - Dividend from subsidiaries - - 110,178 Net cash inflow / (outflow) from investing activities
100,133
(163,587) (76,521) 110,178
Cash flows from financing activities
100,133
Cash flows associated with derivatives 12 11,283 (20,884) - - Repayment of borrowings (264,450) (362,359) - - New borrowings 241,314 401,799 - 9,408 Advances from subsidiaries 29 - - 19,700 25,547 Net purchase of treasury shares 22 (7,180) (11,442) (7,180) (11,442) Dividends paid to company shareholders (93,258) (93,106) (93,258) (93,106) Interest paid (49,042) (44,781) (3,655) Net cash (outflows) from financing activities
(4,336) (161,333) (130,773) (84,393)
Net increase / (decrease) in cash and bank balances
(73,929)
(63,177) 2,071 - - Cash and bank balances at the beginning of the year 104,577 102,506 1 Cash and cash equivalents at end of year
1 9 41,400 104,577 1
The above statements of cash flows should be read in conjunction with the accompanying notes.
1

SKYCITY Entertainment Group Limited Notes to the Financial Statements
30 June 2012
-7-
1 GENERAL INFORMATION SKYCITY Entertainment Group Limited (SKYCITY or the company and its subsidiaries or the Group) operates in the gaming/entertainment, hotel and convention, hospitality, recreation, and tourism sectors. The Group has operations in New Zealand and Australia.
SKYCITY is a limited liability company incorporated and domiciled in New Zealand. The address of its registered office is Federal House, 86 Federal Street, Auckland. The company is dual-listed on the New Zealand and Australian stock exchanges.
These financial statements have been approved for issue by the board of directors on 15 August 2012.
2 SUMMARY OF SIGNIFICANT ACCOUNTING POLICIES These general purpose financial statements for the year ended 30 June 2012 have been prepared in accordance with New Zealand generally accepted accounting practice (NZ GAAP). They comply with New Zealand equivalents to International Financial Reporting Standards (NZ IFRS) and other applicable New Zealand Financial Reporting Standards.
(a) Basis of Preparation
The principal accounting policies adopted in the preparation of this financial report are set out below. These policies have been consistently applied to all the periods presented, unless otherwise stated.
Compliance with IFRS
The separate and consolidated financial statements of SKYCITY also comply with International Financial Reporting Standards (IFRS).
Entities Reporting
The consolidated financial statements incorporate the assets and liabilities of all subsidiaries of the Group as at 30 June 2012 and the results of all subsidiaries and associates for the year then ended.
The financial statements of the 'Parent' are for the company as a separate legal entity.
The Parent company and the Group are designated as profit-oriented entities for financial reporting purposes.
The Parent company has a negative net working capital balance. The Parent's subsidiaries will continue to support it as required.
The Group has a small negative working capital balance. The Group has significant available undrawn banking facilities totalling $340 million as at 30 June 2012 (refer to note 18) and has the ability to fully pay all debts as they fall due.
Statutory Base
SKYCITY is a company registered under the New Zealand Companies Act 1993 and is an issuer in terms of the Securities Act 1978 (New Zealand).
These financial statements have been prepared in accordance with the requirements of the Financial Reporting Act 1993 (New Zealand) and the Companies Act 1993 (New Zealand).
Measurement Basis
These financial statements have been prepared under the historical cost convention, as modified by the revaluation financial assets and liabilities (including derivative instruments) at fair value through profit or loss.
Critical Accounting Estimates and Judgements
The preparation of financial statements requires the use of certain critical accounting estimates. It also requires the company to exercise its judgement in the process of applying the Group's accounting policies. Estimates are used in the following areas: impairment testing of goodwill, indefinite life casino licences and assessing the probability of utilisation of unused tax losses.
The Group tests annually whether goodwill and indefinite licences have suffered any impairment, in accordance with the accounting policy stated in note 2(i). The recoverable amounts of cash-generating units have been determined based on value in use calculations. These calculations require the use of estimates (refer note 14).
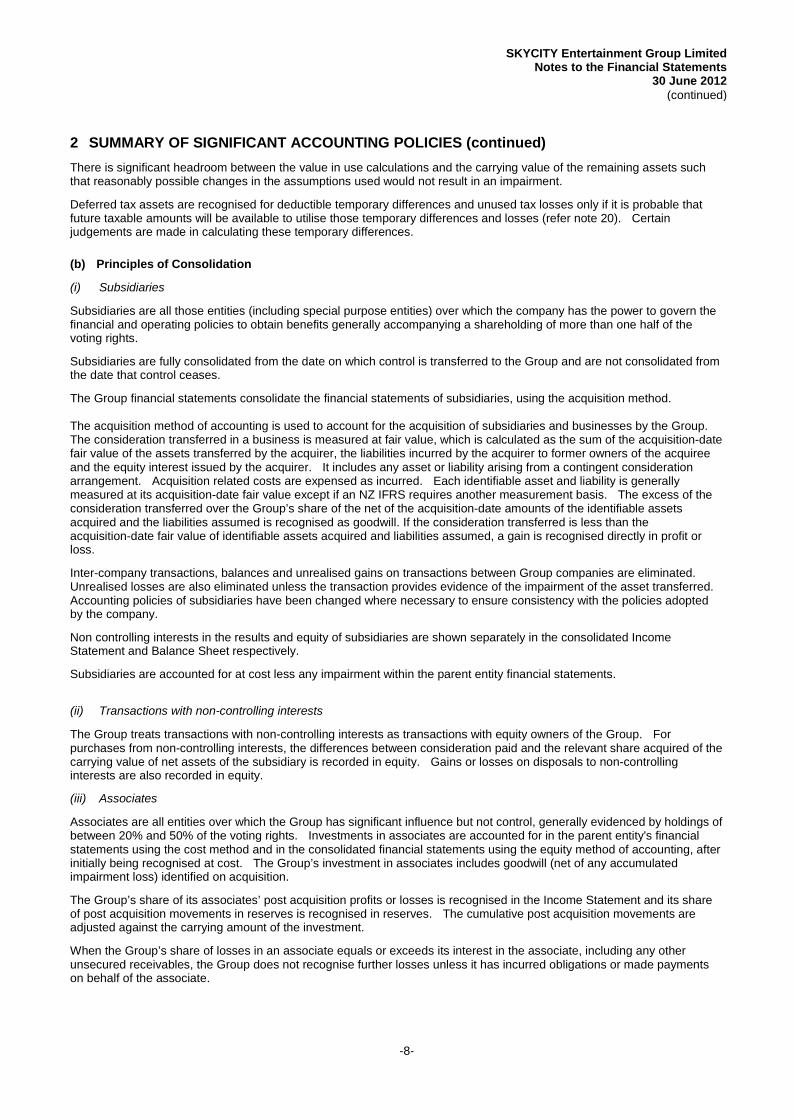
SKYCITY Entertainment Group Limited Notes to the Financial Statements
30 June 2012 (continued)
2 SUMMARY OF SIGNIFICANT ACCOUNTING POLICIES (continued)
-8-
There is significant headroom between the value in use calculations and the carrying value of the remaining assets such that reasonably possible changes in the assumptions used would not result in an impairment.
Deferred tax assets are recognised for deductible temporary differences and unused tax losses only if it is probable that future taxable amounts will be available to utilise those temporary differences and losses (refer note 20). Certain judgements are made in calculating these temporary differences.
(b) Principles of Consolidation
(i) Subsidiaries
Subsidiaries are all those entities (including special purpose entities) over which the company has the power to govern the financial and operating policies to obtain benefits generally accompanying a shareholding of more than one half of the voting rights.
Subsidiaries are fully consolidated from the date on which control is transferred to the Group and are not consolidated from the date that control ceases.
The Group financial statements consolidate the financial statements of subsidiaries, using the acquisition method. The acquisition method of accounting is used to account for the acquisition of subsidiaries and businesses by the Group. The consideration transferred in a business is measured at fair value, which is calculated as the sum of the acquisition-date fair value of the assets transferred by the acquirer, the liabilities incurred by the acquirer to former owners of the acquiree and the equity interest issued by the acquirer. It includes any asset or liability arising from a contingent consideration arrangement. Acquisition related costs are expensed as incurred. Each identifiable asset and liability is generally measured at its acquisition-date fair value except if an NZ IFRS requires another measurement basis. The excess of the consideration transferred over the Group’s share of the net of the acquisition-date amounts of the identifiable assets acquired and the liabilities assumed is recognised as goodwill. If the consideration transferred is less than the acquisition-date fair value of identifiable assets acquired and liabilities assumed, a gain is recognised directly in profit or loss.
Inter-company transactions, balances and unrealised gains on transactions between Group companies are eliminated. Unrealised losses are also eliminated unless the transaction provides evidence of the impairment of the asset transferred. Accounting policies of subsidiaries have been changed where necessary to ensure consistency with the policies adopted by the company.
Non controlling interests in the results and equity of subsidiaries are shown separately in the consolidated Income Statement and Balance Sheet respectively.
Subsidiaries are accounted for at cost less any impairment within the parent entity financial statements.
(ii) Transactions with non-controlling interests
The Group treats transactions with non-controlling interests as transactions with equity owners of the Group. For purchases from non-controlling interests, the differences between consideration paid and the relevant share acquired of the carrying value of net assets of the subsidiary is recorded in equity. Gains or losses on disposals to non-controlling interests are also recorded in equity.
(iii) Associates
Associates are all entities over which the Group has significant influence but not control, generally evidenced by holdings of between 20% and 50% of the voting rights. Investments in associates are accounted for in the parent entity's financial statements using the cost method and in the consolidated financial statements using the equity method of accounting, after initially being recognised at cost. The Group’s investment in associates includes goodwill (net of any accumulated impairment loss) identified on acquisition.
The Group’s share of its associates’ post acquisition profits or losses is recognised in the Income Statement and its share of post acquisition movements in reserves is recognised in reserves. The cumulative post acquisition movements are adjusted against the carrying amount of the investment.
When the Group’s share of losses in an associate equals or exceeds its interest in the associate, including any other unsecured receivables, the Group does not recognise further losses unless it has incurred obligations or made payments on behalf of the associate.

SKYCITY Entertainment Group Limited Notes to the Financial Statements
30 June 2012 (continued)
2 SUMMARY OF SIGNIFICANT ACCOUNTING POLICIES (continued)
-9-
Unrealised gains on transactions between the Group and its associates are eliminated to the extent of the Group’s interest in the associates. Unrealised losses are also eliminated unless the transaction provides evidence of an impairment of the asset transferred. Accounting policies of associates have been changed where necessary to ensure consistency with the policies adopted by the Group.
(c) Segment Reporting
Operating segments are reported in a manner consistent with the internal reporting provided to the chief operation decision maker. The chief operating decision maker has been identified as the Chief Executive Officer/Managing Director.
(d) Foreign Currency Translation
(i) Functional and Presentation Currency
Items included in the financial statements of each of the company's operations are measured using the currency of the primary economic environment in which the entity operates (‘functional currency’). The consolidated and parent financial statements are presented in New Zealand dollars, which is the company's functional and the Group's presentation currency.
(ii) Transactions and Balances
Foreign currency transactions are translated into the functional currency using the exchange rates prevailing at the dates of the transactions. Foreign exchange gains and losses resulting from the settlement of such transactions and from the translation at year end exchange rates of monetary assets and liabilities denominated in foreign currencies are recognised in the Income Statement, except when deferred in equity as qualifying cash flow hedges and qualifying net investment hedges.
Translation differences on non-monetary items, such as equities held at fair value through profit or loss, are reported as part of the fair value gain or loss. Translation differences on non-monetary items, such as equities classified as available for sale financial assets, are included in the fair value reserve in equity.
(iii) Foreign Operations
The results and financial position of foreign entities (none of which has the currency of a hyperinflationary economy) that have a functional currency different from the presentation currency are translated into the presentation currency below:
• assets and liabilities for each Balance Sheet presented are translated at the closing rate at the date of that balance sheet;
• income and expenses for each Income Statement are translated at average exchange rates; and
• all resulting exchange differences are recognised as a separate component of equity.
Exchange differences arising from the translation of any net investment in foreign entities, and of borrowings and other currency instruments designated as hedges of such investments, are taken to shareholders’ equity.
Goodwill and fair value adjustments arising on the acquisition of a foreign operation are treated as assets and liabilities of the foreign operation and translated at the closing rate.
(e) Revenue Recognition
Revenue is recognised as summarised below.
(i) Operating Revenue
Operating revenues include casino, hotel, food and beverage, convention centre, tower admissions and other revenues. Gaming revenues represent the net gaming win to the casino from gaming activities, being the difference between amounts wagered and amounts won by casino patrons.
Revenues exclude the retail value of rooms, food, beverage and other promotional allowances provided on a complimentary basis to customers.
(ii) Interest Income
Interest income is recognised on a time proportion basis using the effective interest method.

SKYCITY Entertainment Group Limited Notes to the Financial Statements
30 June 2012 (continued)
2 SUMMARY OF SIGNIFICANT ACCOUNTING POLICIES (continued)
-10-
(iii) Dividend Income
Dividend income is recognised when the right to receive payment is established.
(iv) Loyalty Programme
A portion of revenue is allocated to the loyalty points scheme and is recognised when customers redeem their loyalty points.
(f) Income Tax
The income tax expense for the period is the tax payable on the current period’s taxable income, based on the income tax rate for each jurisdiction. This is then adjusted by changes in deferred tax assets and liabilities attributable to temporary differences between the tax bases of assets and liabilities and their carrying amounts in the financial statements and changes in unused tax losses.
Deferred tax assets and liabilities are recognised for temporary differences at the tax rates expected to apply when the assets are recovered or liabilities are settled, based on those tax rates which are enacted or substantively enacted for each jurisdiction. The relevant tax rates are applied to the cumulative amounts of deductible and taxable temporary differences to measure the deferred tax asset or liability. An exception is made for certain temporary differences arising from the initial recognition of an asset or a liability. No deferred tax asset or liability is recognised in relation to these temporary differences if they arose in a transaction, other than a business combination, that at the time of the transaction did not affect either accounting profit or taxable profit or loss.
Deferred tax assets are recognised for deductible temporary differences and unused tax losses only if it is probable that future taxable amounts will be available to utilise those temporary differences and losses.
Deferred tax liabilities and assets are not recognised for temporary differences between the carrying amount and tax bases of investments in foreign operations where the company is able to control the timing of the reversal of the temporary differences and it is probable that the differences will not reverse in the foreseeable future.
Current and deferred tax balances attributable to amounts recognised directly in equity are also recognised directly in equity.
(g) Goods and Services Tax (GST)
The Income Statement, Cash Flow Statement and Statement of Changes in Equity have been prepared so that all components are stated exclusive of GST. All items in the Balance Sheet are stated net of GST, with the exception of receivables and payables, which include GST invoiced.
(h) Leases
(i) The Group is the Lessee
Leases in which a significant portion of the risks and rewards of ownership are retained by the lessor are classified as operating leases. Payments made under operating leases (net of any incentives received from the lessor) are charged to the Income Statement on a straight-line basis over the period of the lease.
(ii) The Group is the Lessor
Assets leased to third parties under operating leases are included in property, plant and equipment in the Balance Sheet. They are depreciated over their expected useful lives on a basis consistent with similar owned property, plant and equipment. Rental income (net of any incentives given to lessees) is recognised on a straight-line basis over the lease term.
(i) Impairment of Non-Current Assets
Goodwill and Intangible Assets that have an indefinite useful life are not subject to amortisation and are tested annually for impairment. Assets that are subject to depreciation or amortisation (property, plant and equipment and intangibles that have a finite useful life) are reviewed for impairment whenever events or changes in circumstances indicate that the carrying amount exceeds its recoverable amount. An impairment loss is recognised for the amount by which the asset’s carrying amount exceeds its recoverable amount. The recoverable amount is the higher of an asset’s fair value less costs to sell and value in use. For the purposes of assessing impairment, assets are grouped at the lowest levels for which there are separately identifiable cash flows (cash generating units).

SKYCITY Entertainment Group Limited Notes to the Financial Statements
30 June 2012 (continued)
2 SUMMARY OF SIGNIFICANT ACCOUNTING POLICIES (continued)
-11-
(j) Cash and Bank Balances
Cash and bank balances include cash on hand, deposits held at call with financial institutions, other short-term, highly liquid investments with original maturities of three months or less that are readily convertible to known amounts of cash and which are subject to an insignificant risk of changes in value, and bank overdrafts. Bank overdrafts are shown within borrowings in current liabilities on the Balance Sheet.
(k) Trade Receivables
Trade receivables are recognised initially at fair value and subsequently measured at amortised cost, less provision for doubtful debts.
Collectibility of trade receivables is reviewed on an ongoing basis. Debts which are known to be uncollectible are written off. A provision for doubtful debts is established when there is objective evidence that the Group will not be able to collect all amounts due according to the original terms of those receivables.
(l) Inventories
Inventories, all of which are finished goods, are stated at the lower of cost and net realisable value determined on a first in, first out basis.
(m) Investments and Other Financial Assets
The Group classifies its investments in the following categories: financial assets at fair value through profit or loss and loans and receivables. The classification depends on the purpose for which the investments were acquired. The company determines the classification of its investments at initial recognition and re-evaluates this designation at each reporting date.
Investments are initially recognised at fair value plus transactions costs for all financial assets not carried at fair value through profit or loss. Financial assets carried at fair value through profit or loss are initially recognised at fair value, and transaction costs are expensed in the income statement. Financial assets are derecognised when the rights to receive cash flows from the investments have expired or have been transferred and the Group has transferred substantially all risks and rewards of ownership.
(i) Financial Assets at Fair Value Through Profit or Loss
This category has two sub-categories: financial assets classified as held for trading and financial assets designated as at fair value through profit or loss on initial recognition. A financial asset is classified as held for trading if acquired principally for the purpose of selling in the short term. Derivatives are also classified as held for trading unless they are designated as hedges. The Group does not hold any assets that are designated as at fair value on initial recognition. Financial assets at fair value through profit or loss are classified as current assets if they are either held for trading or are expected to be realised within 12 months of the balance sheet date.
(ii) Loans and Receivables
Loans and receivables are non-derivative financial assets with fixed or determinable payments that are not quoted in an active market. They arise when the Group provides money, goods or services directly to a debtor with no intention of selling the receivable. They are included in current assets, except for those with maturities greater than 12 months after the balance sheet date which are classified as non-current assets. Loans and receivables are included in receivables in the Balance Sheet.
(n) Derivatives
Derivatives are initially recognised at fair value on the date a derivative contract is entered into and are subsequently remeasured to their fair value. The method of recognising the resulting gain or loss depends on whether the derivative is designated as a hedging instrument and, if so, the nature of the item being hedged. The Group designates certain derivatives as either hedges of the fair value of recognised assets or liabilities or a firm commitment (fair value hedges) or hedges of exposures to variability in cash flows associated with recognised assets or liabilities or highly probable forecast transactions (cash flow hedges).

SKYCITY Entertainment Group Limited Notes to the Financial Statements
30 June 2012 (continued)
2 SUMMARY OF SIGNIFICANT ACCOUNTING POLICIES (continued)
-12-
At the inception of the transaction, SKYCITY documents the relationship between hedging instruments and hedged items, as well as its risk management objective and strategy for undertaking various hedge transactions. The Group also documents its assessment, both at hedge inception and on an ongoing basis, of whether the derivatives that are used in hedging transactions have been and will continue to be highly effective in offsetting changes in fair values or cash flows of hedged items.
(i) Fair Value Hedge
Changes in the fair value of derivatives that are designated and qualify as fair value hedges are recognised in the Income Statement together with any changes in the fair value of the hedged asset or liability that are attributable to the hedged risk.
(ii) Cash Flow Hedge
The effective portion of changes in the fair value of derivatives that are designated and qualify as cash flow hedges is recognised in equity in the hedging reserve. The gain or loss relating to the ineffective portion is recognised immediately in the Income Statement.
Amounts accumulated in equity are recycled in the Income Statement in the periods when the hedged item will affect profit or loss (for instance when the forecast sale that is hedged takes place). However, when the forecast transaction that is hedged results in the recognition of a non-financial asset (for example, inventory) or a non-financial liability, the gains and losses previously deferred in equity are transferred from equity and included in the measurement of the initial cost or carrying amount of the asset or liability.
When a hedging instrument expires or is sold or terminated, or when a hedge no longer meets the criteria for hedge accounting, any cumulative gain or loss existing in equity at that time remains in equity and is recognised in the Income Statement when the forecast transaction is ultimately recognised in the Income Statement. When a forecast transaction is no longer expected to occur, the cumulative gain or loss that was reported in equity is transferred to the Income Statement.
(iii) Derivatives that do not qualify for Hedge Accounting
Changes in the fair value of any derivative instrument that does not qualify for hedge accounting are recognised in the Income Statement.
(o) Property, Plant and Equipment
Property, plant and equipment is stated at historical cost less depreciation. Historical cost includes expenditure that is directly attributable to the acquisition of the items. Cost may also include transfers from equity of any gains/losses on qualifying cash flow hedges of foreign currency purchases of property, plant and equipment.
Subsequent costs are included in the asset’s carrying amount or recognised as a separate asset, as appropriate, only when it is probable that future economic benefits associated with the item will flow to the Group and the cost of the item can be measured reliably. All other repairs and maintenance are charged to the Income Statement during the financial period in which they are incurred.
Land is not depreciated. Depreciation on other assets is calculated using the straight line method to allocate their cost, net of their residual values, over their estimated useful lives, as below:
- Buildings and fit-out 5-75 years - Plant and equipment 2-75 years - Motor vehicles 3 years - Fixtures and fittings 3-20 years
Assets’ residual values and useful lives are reviewed, and adjusted if appropriate, at each balance sheet date.
An asset’s carrying amount is written down immediately to its recoverable amount if the asset’s carrying amount is greater than its estimated recoverable amount (note 2(i)).
Gains and losses on disposals are determined by comparing proceeds with carrying amount.

SKYCITY Entertainment Group Limited Notes to the Financial Statements
30 June 2012 (continued)
2 SUMMARY OF SIGNIFICANT ACCOUNTING POLICIES (continued)
-13-
(p) Intangible Assets
(i) Goodwill
Goodwill represents the excess of the cost of an acquisition over the fair value of the Group’s share of the net identifiable assets of the acquired business/associate at the date of acquisition. Goodwill on acquisitions of businesses is included in intangible assets. Goodwill on acquisitions of associates is included in investments in associates. Goodwill is tested for impairment annually or more frequently if events or changes in circumstances indicate that it might be impaired, and is carried at cost less accumulated impairment losses. Gains and losses on the disposal of an entity include the carrying amount of goodwill relating to the entity sold.
Goodwill is allocated to cash generating units for the purpose of impairment testing.
(ii) Casino Licences
The casino licences that have a finite useful life are carried at cost less accumulated amortisation. Amortisation of these casino licences is calculated on a straight line basis so as to expense the cost of the licences over their legal life.
The casino licences that have been determined to have an indefinite useful life are not amortised but rather are tested for impairment annually or more frequently if events or changes in circumstances indicate that they might be impaired, and are carried at cost less accumulated impairment losses.
(iii) Acquired Software
Acquired computer software licences are capitalised on the basis of the costs incurred to acquire and bring to use the specific software. These costs are amortised over their estimated useful lives (three to seven years).
(q) Payables
Payables are stated at fair value or estimated liability where accrued.
(r) Borrowings
Borrowings, including capital notes and the Group's Adjustable Coupon Exchangeable Securities (SKYCITY ACES - now redeemed), are initially recognised at fair value, net of transaction costs incurred. Borrowings are subsequently measured at amortised cost unless part of an effective hedging relationship. Any difference between the proceeds (net of transaction costs) and the redemption amount is recognised in the Income Statement over the period of the borrowings using the effective interest method.
Borrowings are classified as current liabilities unless the Group has an unconditional right to defer settlement of the liability for at least 12 months after the balance sheet date.
(s) Borrowing Costs
Borrowing costs are expensed, except for costs incurred for the construction of any qualifying asset which are capitalised during the period of time that is required to complete and prepare the asset for its intended use or sale.

SKYCITY Entertainment Group Limited Notes to the Financial Statements
30 June 2012 (continued)
2 SUMMARY OF SIGNIFICANT ACCOUNTING POLICIES (continued)
-14-
(t) Employee Benefits
(i) Wages, Salaries and Annual Leave
Liabilities for wages and salaries, including non-monetary benefits and annual leave expected to be settled within 12 months of the reporting date, are recognised in other payables in respect of employees' services up to the reporting date and are measured at the amounts expected to be paid when the liabilities are settled.
(ii) Share-Based Payments
SKYCITY operates an equity settled, share-based compensation plan. The fair value of the employee services received in exchange for the grant of the share rights or shares is recognised as an expense. The total amount to be expensed over the vesting period is determined by reference to the fair value of the share rights or shares granted, excluding the impact of any non-market vesting conditions (for example, profitability and sales growth targets). Non-market vesting conditions are included in assumptions about the number of share rights or shares that are expected to be distributed. At each balance sheet date, the entity revises its estimates of the number of shares expected to be distributed. It recognises the impact of the revision of original estimates, if any, in the Income Statement, and a corresponding adjustment to equity over the remaining vesting period.
(u) Share Capital
Ordinary shares are classified as equity.
Incremental costs directly attributable to the issue of new shares are shown in equity as a deduction, net of tax, from the proceeds.
Where any Group company purchases the company’s equity share capital, the consideration paid, including any directly attributable incremental costs (net of income taxes), is deducted from equity attributable to the company’s equity holders.
(v) Dividends
Provision is made for the amount of any dividend declared on or before the end of the financial year but not distributed at balance date.
(w) Earnings Per Share
(i) Basic Earnings Per Share Basic earnings per share is calculated by dividing the profit attributable to equity holders of the company by the weighted average number of ordinary shares outstanding during the financial year, adjusted for bonus elements in ordinary shares issued during the year.
(ii) Diluted Earnings Per Share Diluted earnings per share adjusts the figures used in the determination of basic earnings per share to take into account the after income tax effect of interest and other financing costs associated with dilutive potential ordinary shares and the weighted average number of shares assumed to have been issued for no consideration in relation to dilutive potential ordinary shares.
(x) Statement of Cash Flows
Cash flows associated with derivatives that are part of a hedging relationship are off-set against cash flows associated with the hedged item.
(y) Standards, amendments and interpretations to existing standards that are not yet effective
Certain new standards, amendments and interpretations to existing standards have been published that are mandatory for the Group’s accounting periods beginning on or after 1 July 2012 or later periods, but which the Group has not early adopted. The significant items are:

SKYCITY Entertainment Group Limited Notes to the Financial Statements
30 June 2012 (continued)
2 SUMMARY OF SIGNIFICANT ACCOUNTING POLICIES (continued)
-15-
• NZ IFRS 9, Financial Instruments (effective from annual periods beginning on or after 1 January 2015). This standard replaces the parts of IAS 39 Financial Instruments: Recognition and Measurement that relates to the classification and measurement of financial instruments. All financial assets are required to be classified into two measurement categories: at fair value and at amortised cost. The determination is based on the entity’s business model for managing the financial assets and the contractual cash flow characteristics of the financial asset. For financial liabilities, the standard retains most of the IAS 39 requirements. An additional presentational requirement has been added for liabilities designated at fair value through profit and loss. Where the fair value option is taken, the part of a fair value change due to an entity's own credit risk is recorded in other comprehensive income. This standard is not expected to significantly impact the Group.
• NZ IFRS 13, Fair value measurement (effective from annual periods beginning on or after 1 January 2013). NZ IFRS 13 replaces the fair value measurement guidance contained in individual NZ IFRSs with a single source of fair value measurement guidance. It defines fair value, establishes a framework for measuring fair value and sets out disclosure requirements for fair value measurements. It explains how to measure fair value when it is required or permitted by other NZ IFRSs. It does not introduce new requirements to measure assets or liabilities at fair value, nor does it eliminate the practicability exceptions to fair value measurements that currently exist in certain standards. This standard is not expected to significantly impact the Group.
(z) New Accounting Standards Adopted in the Year
There have been no significant changes in accounting policies during the current year. Accounting policies have been applied on a basis consistent with prior year.

SKYCITY Entertainment Group Limited Notes to the Financial Statements
30 June 2012 (continued)
-16-
3 REVENUE Consolidated Parent 2012 2011 2012 2011
$'000 $'000 $'000 $'000
Total receipts including GST 960,203 902,381 - - Less non-gaming GST (26,398) (22,562) - Gaming win plus non-gaming revenue
- 933,805 879,819 - -
Less gaming GST (82,275) (76,674) - Total revenue
- 851,530 803,145 -
Gaming
-
658,713 628,051 - - Non-gaming 192,817 175,094 - Total revenue
- 851,530 803,145 -
-
Non-gaming revenue includes revenues from hotels, food and beverage, convention centre, car parking, property rentals, Sky Tower, and other non-gaming activities.
Included within consolidated gaming revenue is revenue relating to loyalty action points of $11,621,000 (30 June 2011: $10,486,000).
Included within consolidated non-gaming revenue is revenue relating to loyalty action points of $266,000 (30 June 2011: $306,000).
Gaming win represents the gross cash inflows associated with gaming activities. “Total receipts including GST” and “Gaming win plus non-gaming revenue” do not represent revenue as defined by NZ IAS 18 Revenue. The Group has decided to disclose these amounts as they give shareholders and interested parties a better appreciation for the scope of the Group’s gaming activities and is consistent with industry practice adopted by casino operations in Australia.
4 OTHER INCOME
Net gain on disposal of property, plant and equipment 1,756 1,065 - - Interest income - Christchurch Hotels Limited 167 192 - - Dividend income 5 4 - - Dividends from wholly-owned entities - - 110,178
100,133 1,928 1,261 110,178
5 EXPENSES
100,133
Profit before income tax includes the following specific expenses:
Depreciation Buildings 24,777 24,198 - - Plant and equipment 34,215 31,402 2,593 2,125 Fixtures and fittings 7,366 6,834 - - Motor vehicles 400 404 - Total depreciation
- 66,758 62,838 2,593 2,125

SKYCITY Entertainment Group Limited Notes to the Financial Statements
30 June 2012 (continued)
5 EXPENSES (continued) Consolidated Parent 2012 2011 2012 2011
$'000 $'000 $'000 $'000
-17-
Amortisation Casino licences (Adelaide) 2,682 2,736 - - Computer software 3,330 4,136 2,968 Total amortisation
3,833 6,012 6,872 2,968
Total depreciation and amortisation
3,833
72,770 69,710 5,561
Other expenses includes:
5,958
Utilities, insurance and rates 21,683 19,616 99 106 Community Trust donations 3,143 3,185 - - Minimum lease payments relating to operating
leases 4,535 4,408 - - Other property expenses 16,045 15,302 - - Other items (including International commissions) 54,905 50,031 3,683 6,285 Provision for bad and doubtful debts 43 81 -
- 100,354 92,623 3,782
6,391
Restructuring costs Redundancy and other staff payments 2,581 2,471 2,093 - Other restructuring costs 1,693 827 -
- 4,274 3,298 2,093
Auditors' fees
-
During the year the following fees were paid or are payable for services provided by the auditor of the parent entity, its related practices and non-related audit firms.
(a) Assurance services
Audit services PricewaterhouseCoopers Audit of Group financial statements 418 400 418 400 Audit of subsidiary financial statements 92 94 - - Half year review 84 80 84 Total remuneration for audit services
80 594 574 502
Other assurance services provided by
480
PricewaterhouseCoopers Accounting advice and assistance 85 75 85 75 Systems assurance 75 - - -
Tax compliance services 91 73 40 Total remuneration for other assurance services
45 251 148 125
Total remuneration for assurance services
120
845 722 627
(b) Other services
600
PricewaterhouseCoopers
Taxation and other advisory services 266 318 169 Total remuneration for taxation services
168 266 318 169
Total fees paid or payable to auditors
168
1,111 1,040 796 768

SKYCITY Entertainment Group Limited Notes to the Financial Statements
30 June 2012 (continued)
5 EXPENSES (continued)
-18-
The Group employs PricewaterhouseCoopers on assignments additional to their statutory audit duties where PricewaterhouseCoopers’ expertise and experience with the Group are important and auditor independence is not impaired. These assignments are principally tax advice. For other work, the company's External Audit Independence Policy requires that advisers other than PricewaterhouseCoopers are engaged, unless otherwise approved by the Board's Audit and Risk Committee.
6 FINANCE COSTS - NET Consolidated Parent 2012 2011 2012 2011
$'000 $'000 $'000 $'000
Finance costs Interest and finance charges 53,167 50,280 4,171 3,908 Exchange gains (582) (2,105) - - Interest income (3,724) (2,783) - - Gain on funding reorganisation (note 18) - (1,620) -
Total finance costs -
48,861 43,772 4,171 3,908
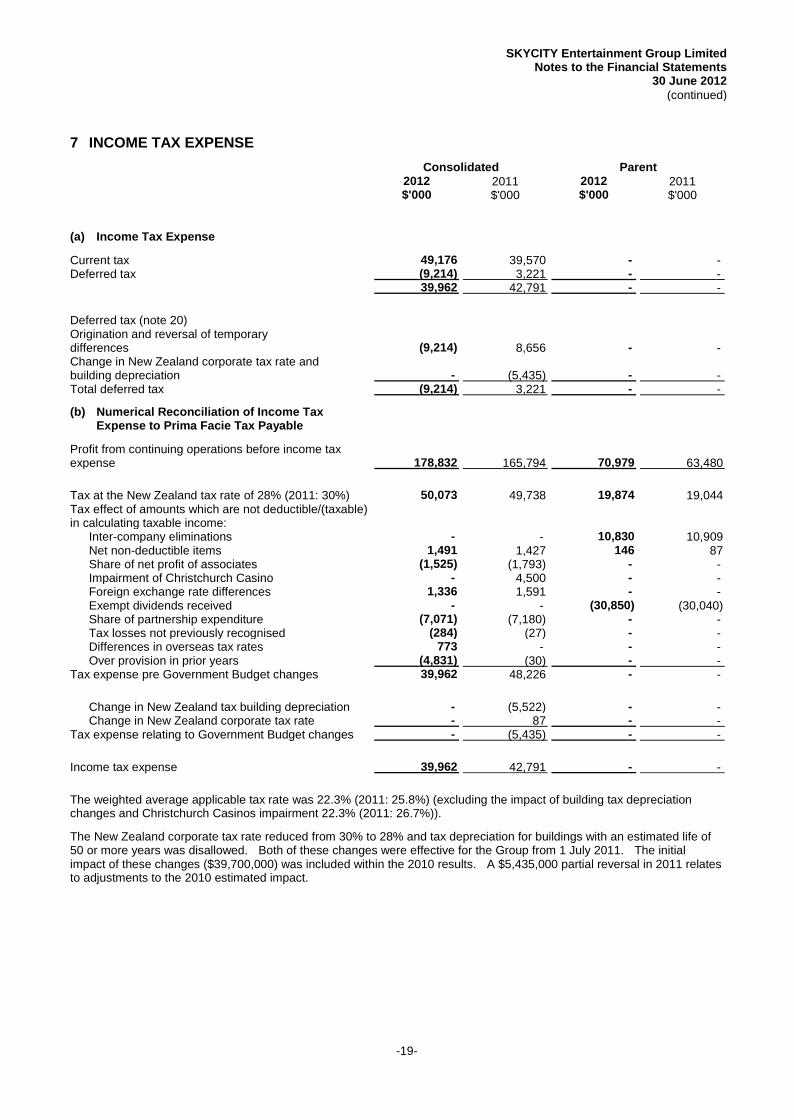
SKYCITY Entertainment Group Limited Notes to the Financial Statements
30 June 2012 (continued)
-19-
7 INCOME TAX EXPENSE Consolidated Parent 2012 2011 2012 2011
$'000 $'000 $'000 $'000
(a) Income Tax Expense
Current tax 49,176 39,570 - - Deferred tax (9,214) 3,221 -
- 39,962 42,791 -
Deferred tax (note 20)
-
Origination and reversal of temporary differences (9,214) 8,656 - - Change in New Zealand corporate tax rate and building depreciation - (5,435) - - Total deferred tax (9,214) 3,221 - -
(b) Numerical Reconciliation of Income Tax Expense to Prima Facie Tax Payable
Profit from continuing operations before income tax expense 178,832 165,794 70,979
Tax at the New Zealand tax rate of 28% (2011: 30%)
63,480
50,073 49,738 19,874 19,044 Tax effect of amounts which are not deductible/(taxable) in calculating taxable income:
Inter-company eliminations - - 10,830 10,909 Net non-deductible items 1,491 1,427 146 87 Share of net profit of associates (1,525) (1,793) - - Impairment of Christchurch Casino - 4,500 - - Foreign exchange rate differences 1,336 1,591 - - Exempt dividends received - - (30,850) (30,040) Share of partnership expenditure (7,071) (7,180) - - Tax losses not previously recognised (284) (27) - - Differences in overseas tax rates 773 - - - Over provision in prior years (4,831) (30) -
Tax expense pre Government Budget changes -
39,962 48,226 - -
Change in New Zealand tax building depreciation - (5,522) - - Change in New Zealand corporate tax rate - 87 -
Tax expense relating to Government Budget changes -
- (5,435) -
Income tax expense
-
39,962 42,791 -
The weighted average applicable tax rate was 22.3% (2011: 25.8%) (excluding the impact of building tax depreciation changes and Christchurch Casinos impairment 22.3% (2011: 26.7%)).
-
The New Zealand corporate tax rate reduced from 30% to 28% and tax depreciation for buildings with an estimated life of 50 or more years was disallowed. Both of these changes were effective for the Group from 1 July 2011. The initial impact of these changes ($39,700,000) was included within the 2010 results. A $5,435,000 partial reversal in 2011 relates to adjustments to the 2010 estimated impact.

SKYCITY Entertainment Group Limited Notes to the Financial Statements
30 June 2012 (continued)
-20-
8 EARNINGS PER SHARE Consolidated 2012 2011
Cents Cents
Basic earnings per share
Profit for the year before tax expense relating to Government Budget changes and Christchurch Casino impairment 24.0 23.0 Profit attributable to the ordinary equity holders of the company 24.0 21.4
Diluted earnings per share
Profit attributable to the ordinary equity holders of the company 23.8 20.9
(a) Reconciliations of Earnings used in calculating Earnings Per Share
Consolidated 2012 2011
$'000 $'000
Basic earnings per share Profit from continuing operations 138,870 123,003 Profit attributable to minority interests (336) (43) Profit attributable to the ordinary equity holders of the company used in calculating basic earnings per share 138,534 122,960
Diluted earnings per share Profit attributable to the ordinary equity holders of the company used in calculating basic earnings per share 138,534 122,960 Interest savings on capital notes 4,160 3,837 Interest savings on SKYCITY ACES - 4,476 Tax on the above (1,165) (2,494) Profit attributable to the ordinary equity holders of the company used in calculating diluted earnings per share 141,529 128,779
(b) Weighted Average number of shares used as the denominator
2012 2011
Number Number
Weighted average number of ordinary shares used as the denominator in calculating basic earnings per share 576,958,340 575,574,000 Adjustments for calculation of diluted earnings per share:
SKYCITY ACES - 25,622,391 Capital notes 16,592,208 14,501,611
Weighted average number of ordinary shares and potential ordinary shares used as the denominator in calculating diluted earnings per share 593,550,548 615,698,002

SKYCITY Entertainment Group Limited Notes to the Financial Statements
30 June 2012 (continued)
8 EARNINGS PER SHARE (continued)
-21-
(c) Information concerning the classification of Securities
(i) SKYCITY ACES The SKYCITY ACES were considered to be potential ordinary shares in 2011 and were therefore included in the determination of diluted earnings per share.
(ii) Capital Notes Capital notes are considered to be potential ordinary shares and are therefore included in the determination of diluted earnings per share from their date of issue. The capital notes have not been included in the determination of basic earnings per share. Details relating to the capital notes are set out in note 19.
9 CASH AND BANK BALANCES Consolidated Parent 2012 2011 2012 2011
$'000 $'000 $'000 $'000
Cash at bank 2,538 55,690 1 1 Cash in house 38,862 48,887 -
- 41,400 104,577 1
10 RECEIVABLES AND PREPAYMENTS
1
Consolidated Parent 2012 2011 2012 2011
$'000 $'000 $'000 $'000
Trade receivables 13,551 9,285 - - Advance to Christchurch Hotels Limited (note 29) 5,125 6,235 - - Sundry receivables 4,864 11,244 227 112 Prepayments 3,434 4,136 1,193 2,041 Amounts due from subsidiaries (note 30) - - 152,209
85,223 26,974 30,900 153,629
There are no significant receivables past due date or impaired.
87,376
11 NET TAX RECEIVABLES Consolidated Parent 2012 2011 2012 2011
$'000 $'000 $'000 $'000
Tax prepayment - current 35,503 36,637 - - Tax prepayment - non current 31,550 27,789 - - Current tax liabilities (7,972) (5,349) -
- 59,081 59,077 -
Tax is typically paid in advance in New Zealand to ensure the Group has positive imputation credits as at 31 March of each year.
-

SKYCITY Entertainment Group Limited Notes to the Financial Statements
30 June 2012 (continued)
-22-
12 DERIVATIVE FINANCIAL INSTRUMENTS Fair value Notional principal 2012 2011 2012 2011
$'000 $'000 $'000 $'000
Current assets Forward foreign currency contracts 480 272 50,576 Total current derivative financial instrument assets
6,911 480 272 50,576
Cross-currency interest rate swaps - cash flow hedges
6,911
23,154 - 258,548 Total non-current derivative financial instrument assets
- 23,154 - 258,548
Current liabilities
-
Cross-currency interest rate swap - cash flow hedges* 519 4,981 31,876 83,227 Forward foreign currency contracts 145 113 13,018 5,785 Cross-currency interest rate swaps - fair value hedges* - 1,998 - 19,492 Interest rate swaps - cash flow hedges - 3,010 - Total current derivative financial instrument liabilities
97,000 664 10,102 44,894
Non-current liabilities
205,504
Interest rate swaps - cash flow hedges 42,877 14,514 396,705 399,184 Cross-currency interest rate swaps - cash flow hedges * 2,538 18,879 59,751 Total non-current derivative financial instrument liabilities
300,906
45,415 33,393 456,456
During the year, $3,927,289 of losses (2011: $3,545,228 gains) on hedged items were offset in the Income Statement by $4,153,420 of gains (2011: $3,739,485 losses) on derivatives in fair value hedging relationships.
700,090
There is no cash flow hedge ineffectiveness in either the current or prior year.
* The comparative period fair value amounts are net of collateral payments made of $11,283,153. When the fair value of the cross-currency interest rate swaps exceeds certain levels, a payment is received from (if the CCIRS is an asset) or made to (if the CCIRS is a liability) the counter-party. The collateral payment outstanding at 30 June 2011 was repaid during the current year, there are no collateral payments outstanding at 30 June 2012.
The parent has no derivatives at 30 June 2012 (2011: fair value of negative $113,000).

SKYCITY Entertainment Group Limited Notes to the Financial Statements
30 June 2012 (continued)
-23-
13 PROPERTY, PLANT AND EQUIPMENT
CONSOLIDATED Land Buildings and fitout
Plant and equipment
Fixtures and
fittings Motor
vehicles
Capital work in
progress Total
$'000 $'000 $'000 $'000 $'000 $'000 $'000
At 30 June 2010 Cost 179,986 809,872 361,350 103,794 2,243 16,755 1,474,000 Accumulated depreciation - (176,884) (272,223) (70,455) (1,259) - Net book value
(520,821) 179,986 632,988 89,127 33,339 984 16,755
Movements in the year ended 30 June 2011
953,179
Opening net book value 179,986 632,988 89,127 33,339 984 16,755 953,179 Exchange differences 959 8,185 1,893 317 28 652 12,034 Net additions/transfers (992) 9,418 28,395 1,389 217 50,529 88,956 Depreciation charge - (24,198) (31,402) (6,834) (404) - Closing net book value
(62,838) 179,953 626,393 88,013 28,211 825 67,936
At 30 June 2011
991,331
Cost 179,953 826,639 390,080 102,810 2,520 67,936 1,569,938 Accumulated depreciation - (200,246) (302,067) (74,599) (1,695) - Net book value
(578,607) 179,953 626,393 88,013 28,211 825 67,936
Movements in the year ended 30 June 2012
991,331
Opening net book value 179,953 626,393 88,013 28,211 825 67,936 991,331 Exchange differences (255) (2,165) (493) (78) (7) (258) (3,256) Net additions/transfers 10,226 45,337 47,916 13,433 329 25,860 143,101 Depreciation charge - (24,777) (34,215) (7,366) (400) - Closing net book value
(66,758) 189,924 644,788 101,221 34,200 747 93,538
At 30 June 2012
1,064,418
Cost 189,924 864,635 350,639 98,191 2,697 93,538 1,599,624 Accumulated depreciation - (219,847) (249,418) (63,991) (1,950) - Net book value
(535,206) 189,924 644,788 101,221 34,200 747 93,538 1,064,418

SKYCITY Entertainment Group Limited Notes to the Financial Statements
30 June 2012 (continued)
13 PROPERTY, PLANT AND EQUIPMENT (continued)
-24-
PARENT COMPANY Plant and equipment
Capital work in progress Total
$'000 $'000 $'000
At 30 June 2010 Cost 28,171 2,655 30,826 Accumulated depreciation (23,564) - Net book value
(23,564) 4,607 2,655
Movements in the year ended 30 June 2011
7,262
Opening net book value 4,607 2,655 7,262 Net additions/transfers 3,839 (1,922) 1,917 Depreciation charge (2,125) - Closing net book value
(2,125) 6,321 733
At 30 June 2011
7,054
Cost 32,011 733 32,744 Accumulated depreciation (25,690) - Net book value
(25,690) 6,321 733
Movements in the year ended 30 June 2012
7,054
Opening net book value 6,321 733 7,054 Net additions/transfers 2,023 1,048 3,071 Depreciation charge (2,593) - Closing net book value
(2,593) 5,751 1,781
At 30 June 2012
7,532
Cost 27,496 1,781 29,277 Accumulated depreciation (21,745) - Net book value
(21,745) 5,751 1,781
Borrowing costs of $2,129,123 have been capitalised in the current year relating to the Auckland and Adelaide capital projects and Darwin resort (2011: $346,722) using the Group's weighted average cost of debt.
7,532
A memorandum of encumbrance is registered against the title of land for the Auckland casino in favour of Auckland City Council. Auckland City Council requires prior written consent before any transfer, assignment or disposition of the land. The intent of the covenant is to protect the Council's rights under the resource consent, relating to the provision of the bus terminus, public car park and the provision of public footpaths around the complex.
A further encumbrance records the Council's interest in relation to the sub-soil areas under Federal and Hobson Streets used by SKYCITY as car parking and a vehicle tunnel. The encumbrance is to notify any transferee of the Council's interest as lessor of the sub-soil areas.
The SKYCITY Hamilton site is subject to the normal rights that the Crown reserves in respect of minerals and mining in relation to the sub-soil areas. The land title is subject to Section 27B of the State Owned Enterprises Act 1986 which does not provide for the owner of the land to be heard in relation to any recommendations of the Waitangi Tribunal for the resumption of the land. At balance date the company was not aware of any matters pertaining to the land under the State Owned Enterprises Act 1986. Drainage rights have been granted over parts of the land appurtenant to Lot 2 Plan 5.23789 (CT22C/1428). There is also a right of way granted over part of Lot 1 and part of Lot 2 DP580554.

SKYCITY Entertainment Group Limited Notes to the Financial Statements
30 June 2012 (continued)
-25-
14 INTANGIBLE ASSETS
CONSOLIDATED Goodwill Casino
Licences Computer software Total
$'000 $'000 $'000 $'000
At 30 June 2010 Cost 151,949 261,318 58,153 471,420 Accumulated amortisation - (29,468) (44,726) Net book amount
(74,194) 151,949 231,850 13,427
Movements in the year ended 30 June 2011
397,226
Opening net book amount 151,949 231,850 13,427 397,226 Exchange differences 6,048 12,101 16 18,165 Additions - - 1,893 1,893 Amortisation charge - (2,736) (4,136) Closing net book amount
(6,872) 157,997 241,215 11,200
At 30 June 2011
410,412
Cost 157,997 274,924 60,234 493,155 Accumulated amortisation - (33,709) (49,034) Net book amount
(82,743) 157,997 241,215 11,200
Movements in the year ended 30 June 2012
410,412
Opening net book amount 157,997 241,215 11,200 410,412 Exchange differences (1,605) (3,156) (3) (4,764) Additions - - 11,009 11,009 Amortisation charge - (2,682) (3,330) Closing net book amount
(6,012) 156,392 235,377 18,876
At 30 June 2012
410,645
Cost 156,392 271,314 60,027 487,733 Accumulated amortisation - (35,937) (41,151) Net book amount
(77,088) 156,392 235,377 18,876
410,645
Casino Licence Contract Term
Darwin The casino and associated operations are carried out by SKYCITY Darwin under a casino licence/operator agreement (the Casino Operator's Agreement) with the Northern Territory Government. The current licence term was extended in 2011 and now expires on 30 June 2031. The Casino Operator's Agreement is subject to extension for a further 5 years once its period to maturity reaches 15 years. These licence extensions apply on a continuing five year basis so that, subject to certain criteria being met, the licence period is never less than 15 years.
Adelaide The casino and associated operations are carried out by SKYCITY Adelaide under a casino licence (the Approved Licensing Agreement ("ALA")) dated October 1999 (as amended). The expiry date of the ALA is June 2085. The term of the ALA can be renewed for a further fixed term pursuant to section 9 of the Casino Act 1997 (SA). The carrying value of the Adelaide licence is amortised over the life of the agreement.
Auckland SKYCITY Auckland Limited holds a Casino Premises Licence for the Auckland premises. The Casino Premises Licence is for an initial 25 year term from 2 February 1996. The licence can be renewed for further periods of 15 years pursuant to s138 of the Gaming Act 2003 (NZ). As the licence was initially granted to the company for nil consideration there is no associated carrying value.
Hamilton SKYCITY Hamilton Limited holds a Casino Premises Licence for the Hamilton premises. The Casino Premises Licence is for an initial 25 year term from 19 September 2002. The licence can be renewed for further periods of 15 years pursuant to s138 of the Gaming Act 2003 (NZ). As the licence was initially granted to the company for nil consideration there is no associated carrying value.

SKYCITY Entertainment Group Limited Notes to the Financial Statements
30 June 2012 (continued)
14 INTANGIBLE ASSETS (continued)
-26-
PARENT COMPANY Computer software Total
$'000 $'000
At 30 June 2010 Cost 50,813 50,813 Accumulated amortisation (37,760) Net book amount
(37,760) 13,053
Movements in the year ended 30 June 2011
13,053
Opening net book amount 13,053 13,053 Additions 1,476 1,476 Amortisation charge (3,833) Closing net book amount
(3,833) 10,696
At 30 June 2011
10,696
Cost 52,289 52,289 Accumulated amortisation (41,593) Net book amount
(41,593) 10,696
Movements in the year ended 30 June 2012
10,696
Opening net book amount 10,696 10,696 Additions 2,303 2,303 Amortisation charge (2,968) Closing net book amount
(2,968) 10,031
At 30 June 2012
10,031
Cost 45,583 45,583 Accumulated amortisation (35,552) Net book amount
(35,552) 10,031
(a) Impairment Tests for Intangibles with Indefinite Lives
10,031
Goodwill and licences with indefinite lives are allocated to the Group’s cash-generating units (CGU's) identified below.
2012 SKYCITY Hamilton *
SKYCITY Darwin
Total
$'000 $'000 $'000
Goodwill 35,786 120,606 156,392 Casino Licence - 40,459
40,459 35,786 161,065
2011
196,851
Goodwill 35,786 122,211 157,997 Casino Licence - 40,997
40,997 35,786 163,208
The recoverable amount of a CGU is determined based on value in use calculations. These calculations use cash flow projections approved by directors covering a three year period. The growth rate does not exceed the long term average growth rate for the business in which the CGU operates. There is a surplus between the carrying values of indefinite life assets and value in use calculations.
198,994
* SKYCITY Hamilton is included within the "Rest of New Zealand" segment in note 27.

SKYCITY Entertainment Group Limited Notes to the Financial Statements
30 June 2012 (continued)
14 INTANGIBLE ASSETS (continued)
-27-
(b) Key Assumptions used for Value in Use Calculations of Cash Generating Units
EBITDA
margin Growth rate Discount rate
2012 2011 2012 2011 2012 2011
% % % % % %
SKYCITY Hamilton 41.8 42.6 2.0 2.0 10.0 10.0 SKYCITY Darwin 29.4 30.5 4.7 3.0 10.0 10.0 These assumptions are consistent with past experience adjusted for economic indicators. The discount rates are post-tax and reflect specific risks relating to the relevant operating segment.
The company does not expect a reasonably possible change in key assumptions would reduce recoverable amount below carrying amount.
15 INVESTMENTS IN ASSOCIATES
Carrying Amounts
Information relating to associates is set out below.
Name of company Principal activities
Ownership interest
Consolidated Parent
2012 2011 2012 2011 2012 2011
% % $'000 $'000 $'000 $'000
Christchurch Casinos Limited Group Casino operator 50.0 50.0 75,266 73,782 -
-
75,266 73,782 -
Christchurch Casinos Limited Group (CCL) is incorporated in New Zealand and has a 31 March balance date.
-
Following the Canterbury earthquakes in the prior year, a value in use impairment test was completed on the Group's investment in Christchurch Casinos resulting in a $15 million impairment. The underlying assumptions used included an initial drop in earnings, returning to 2010 levels by 2014, a discount rate of 10% (post tax) and a terminal growth rate of 2.3%.
No adjustment has been made to the impairment charge in the current year. Increasing the underlying assumed growth rate by 5% would result in a $4.8 million reduction or increase in the current carrying value.

SKYCITY Entertainment Group Limited Notes to the Financial Statements
30 June 2012 (continued)
15 INVESTMENTS IN ASSOCIATES (continued)
-28-
(a) Movements in carrying amounts Consolidated
2012 2011
$'000 $'000
Balance at the beginning of the year 73,782 83,549 Share of profits after income tax 5,447 5,976 Dividends received/receivable (3,963) (743) Impairment - Balance at 30 June
(15,000) 75,266
(b) Impairment losses recognised in profit or loss
73,782
Impairment losses in associates accounted for using the equity method in the income statement -
15,000 -
(c) Summarised financial information of associates
15,000
Group's share of: Assets Liabilities Revenues Profit
$'000 $'000 $'000 $'000
2012 Christchurch Casinos Limited Group 14,428 1,982 18,570
4,200 14,428 1,982 18,570
2011
4,200
Christchurch Casinos Limited Group 14,852 1,691 14,867
3,269 14,852 1,691 14,867
The above are based on SKYCITY's direct equity interest in Christchurch Casinos Limited of 33.3% (2011: 33.3%).
3,269
16 PAYABLES Consolidated Parent 2012 2011 2012 2011
$'000 $'000 $'000 $'000
Trade payables 18,034 31,044 - - Deferred income 3,520 3,097 - - Accrued expenses 42,144 39,805 7,025 5,480 Employee benefits 43,488 36,905 - - Amounts due to subsidiaries (note 30) - - 337,743
245,517 107,186 110,851 344,768 250,997

SKYCITY Entertainment Group Limited Notes to the Financial Statements
30 June 2012 (continued)
-29-
17 CURRENT LIABILITIES - INTEREST BEARING LIABILITIES
Consolidated Parent 2012 2011 2012 2011
$'000 $'000 $'000 $'000
Unsecured United States Private Placement (USPP) - 247,267 - Total unsecured current interest bearing borrowings
-
- 247,267 -
Fair value disclosures
-
Details of the fair value of interest bearing liabilities for the Group are set out in note 18.
18 NON-CURRENT LIABILITIES - INTEREST BEARING LIABILITIES Consolidated Parent 2012 2011 2012 2011
$'000 $'000 $'000 $'000
Refer to (note 17) for details of current portions of these liabilities.
Unsecured United States Private Placement (USPP) 365,848 350,202 - - Syndicated bank facility 240,627 - - - Deferred funding expenses (1,573) - - Total unsecured non-current interest bearing borrowings
- 604,902 350,202 -
In 2011 a gain of $1,620,000 resulted from a reorganisation of funding structures and refinancing of SKYCITY ACES with USPP.
-
(a) United States Private Placement (USPP)
On 15 March 2005 SKYCITY borrowed NZ$96,571,000, A$74,900,000 and US$274,500,000 with maturities between 2012 and 2020 from private investors (primarily US based) on an unsecured basis. The USPP fixed rate US dollar borrowings have been converted to New Zealand dollar floating rate borrowings by use of cross currency interest rate swaps to eliminate foreign exchange exposure within the Income Statement.
In March 2011, additional US$175,000,000 of USPP debt was raised, US$100,000,000 with 10 year maturity and US$75,000,000 with 7 years.
In March 2012 USPP borrowings of US$85,000,000, A$74,900,000 and NZ$47,275,000 matured and were repaid.
Other movements in the USPP from 30 June 2011 relate to foreign exchange movements.
The offsetting value of the cross currency interest rate swaps are included within derivative financial instruments in note 12.
(b) Syndicated Bank Facility
At 30 June 2012, SKYCITY had in place a NZ$485,000,000 revolving credit (2011: NZ$400,000,000) and Australian $75,000,000 term (2011: nil) facility on an unsecured, negative pledge basis in two tranches of NZ$200,000,000 each maturing January 2015 and June 2016, and two tranches maturing March 2019 of NZ$85,000,000 and Australian $75,000,000 . The funding syndicate is comprised of ANZ National Bank Limited, Bank of New Zealand Limited, Commonwealth Bank of Australia and Westpac New Zealand Limited.
The facility is a revolving credit facility with the exception of the Australian $75,000,000 tranche which is a term loan.

SKYCITY Entertainment Group Limited Notes to the Financial Statements
30 June 2012 (continued)
18 NON-CURRENT LIABILITIES - INTEREST BEARING LIABILITIES (continued)
-30-
(c) Fair values
Fair value of long term fixed rate USPP debt is estimated at $341 million (2011: $424 million) compared to a carrying value of $317 million (2011: $404 million). Fair value has been calculated based on the present value of future principal and interest cash flows, using market interest rates and credit margins at balance date.
The carrying value of floating rate debt approximates its fair value.
19 SUBORDINATED DEBT - CAPITAL NOTES Consolidated Parent 2012 2011 2012 2011
$'000 $'000 $'000 $'000
Balance at the beginning of the year 56,451 47,043 56,451 47,043 Issued/(matured) during the year - 9,408 - 9,408
Balance at the end of the year 56,451 56,451 56,451
Deferred expense
56,451
37 51 37
Net capital notes at the end of the year
51
56,414 56,400 56,414
In May 2010, the capital notes were renewed for a new term of five years to 15 May 2015. The notes were reissued on the same terms and conditions except at a lower interest rate of 7.25% (previously 8.0%).
56,400
In October 2010, 9,408,000 capital notes were sold from treasury stock.
Prior to the next election date (15 May 2015), the company will notify holders of the proportion of their capital notes it will redeem (if any) and, if applicable, the new conditions (including as to interest rate, interest dates, new election date, and other modifications to the existing conditions) that will apply to the capital notes from the election date. Holders may then choose either to retain some or all of their capital notes on the new terms, and/or to convert some or all of their capital notes into SKYCITY ordinary shares. The company may elect to redeem or purchase some or all of the capital notes that holders have elected to convert, at an amount equal to the principal amount plus any accrued but unpaid interest.
If capital notes are converted, holders will receive ordinary shares equal in value to the aggregate of the principal amount of the notes plus any accrued but unpaid interest. The value of the shares is determined on the basis of 95% of the weighted average sale price of a SKYCITY ordinary share on the New Zealand stock exchange during the 15 trading days prior to the election dates.
The capital notes do not carry voting rights. Capital noteholders are not entitled to any distributions made by SKYCITY in respect of its ordinary shares prior to the conversion date of the capital notes and do not participate in any change in value of SKYCITY's issued shares.
As at 30 June 2012, there were 150,000,000 (2011: 150,000,000) capital notes on issue, of which 93,549,000 (2011: 93,549,000) are held as treasury stock by the company.
The capital notes are listed on the NZX. As at 30 June 2012 the closing price was $1.0425 per $1 note (2011: $1.0182). The capital notes are carried at amortised cost.

SKYCITY Entertainment Group Limited Notes to the Financial Statements
30 June 2012 (continued)
-31-
20 DEFERRED TAX LIABILITIES
Consolidated Parent 2012 2011 2012 2011
$'000 $'000 $'000 $'000
The balance comprises temporary differences attributable to:
Prepayments and receivables 529 47 - - Provision and accruals (14,174) (9,799) - - Depreciation 97,622 96,231 - - Foreign exchange differences 6,903 14,378 - - Tax losses (1,486) (2,263) - - Other 605 613 - - Cash flow hedges (5,428) (4,917) - Net deferred tax liabilities
- 84,571 94,290 -
Movements:
-
Balance at the beginning of the year 94,290 95,347 - - (Credited)/charged to the Income Statement (note 7) (9,214) 8,656 - - Debited to equity reserves (360) (4,133) - - Change in New Zealand corporate tax rate and building depreciation (note 7) - (5,435) - - Foreign exchange differences (145) (145) - Closing balance at 30 June
- 84,571 94,290 -
-
Within 12 months (15,512) (8,979) - - In excess of 12 months 100,083 103,269 -
- 84,571 94,290 -
The Group has not recognised deferred tax assets of $1.3 million (2011: $1.6 million) in respect of losses that can be carried forward against future taxable income.
-

SKYCITY Entertainment Group Limited Notes to the Financial Statements
30 June 2012 (continued)
-32-
21 IMPUTATION CREDITS (New Zealand) Consolidated 2012 2011
$'000 $'000
Balance at the beginning of the year (7,708) (6,260) Tax payments, net of refunds 26,284 32,327 Credits attached to dividends paid (18,069) (33,797) Credits attached to dividends received 1,672 Balance at end of year
22 2,179
Imputation credits available directly and indirectly to shareholders of the parent company, through:
(7,708)
Parent company 2,179 (7,708) Subsidiaries - Balance at end of year
- 2,179
As required by relevant tax legislation, the imputation credit account had a credit balance as at 31 March 2012.
(7,708)
22 SHARE CAPITAL 2012 2011 2012 2011
Shares Shares $'000 $'000
Opening balance of ordinary shares issued 576,958,340 575,114,687 728,616 732,910 Share rights issued for employee services - - 1,426 1,047 Employee share entitlements issued 674,251 275,034 - - Treasury shares issued (2,092,762) (275,034) - - Net purchase of treasury shares - - (7,180) (11,442) Shares issued under dividend reinvestment plan 1,418,511 1,843,653 4,736
6,101
576,958,340 576,958,340 727,598
All ordinary shares rank equally with one vote attached to each fully-paid ordinary share.
728,616
Included within the number of shares is treasury shares 4,517,313 (2011: 4,351,766) held by the company. The movement in treasury shares during the year related to the issuance of shares under the employee incentive plans and purchases of shares by an external trustee as part of the new executive long term incentive plan (refer note 28). Treasury shares may be used to issue shares under the company's employee incentive plans or upon the exercise of share rights/options.

SKYCITY Entertainment Group Limited Notes to the Financial Statements
30 June 2012 (continued)
-33-
23 RESERVES AND RETAINED PROFITS/(LOSSES) Consolidated Parent 2012 2011 2012 2011
$'000 $'000 $'000 $'000
(a) Reserves
Hedging reserve - cash flow hedges (13,355) (12,340) - (427) Foreign currency translation reserve 11,505 16,022 -
- (1,850) 3,682 -
(427)
Consolidated Parent 2012 2011 2012 2011
$'000 $'000 $'000 $'000
Hedging reserve - cash flow hedges Balance at the beginning of the year (12,340) (2,740) (427) - Revaluation 16,635 (77,025) - (593) Transfer to net profit (18,010) 63,292 593 - Deferred tax 360 4,133 (166) Balance 30 June
166 (13,355) (12,340) -
(427)
Consolidated Parent 2012 2011 2012 2011
$'000 $'000 $'000 $'000
Foreign currency translation reserve Balance at the beginning of the year 16,022 10,625 - - Exchange difference on translation of overseas subsidiaries (4,517) 5,397 - Balance 30 June
- 11,505 16,022 -
(i) Hedging Reserve - Cash Flow Hedges
-
The hedging reserve is used to record gains or losses on a hedging instrument in a cash flow hedge that are recognised directly in equity, as described in note 2(n). Amounts are recognised in the Income Statement when the associated hedged transaction affects the Income Statement.
(ii) Foreign Currency Translation Reserve
Exchange differences arising on translation of foreign controlled entities are taken to the foreign currency translation reserve, as described in note 2(d). The reserve is recognised in the Income Statement when the net investment is disposed of.
(b) Retained Profit/(Losses)
Movements in retained profits were as follows:
Consolidated Parent 2012 2011 2012 2011
$'000 $'000 $'000 $'000
Balance at the beginning of the year 41,150 17,397 (311,797) (276,070) Profit attributable to shareholders of the company 138,534 122,960 70,979 63,480 Dividends (97,994) (99,207) (97,994) Balance at the end of the year
(99,207) 81,690 41,150 (338,812) (311,797)

SKYCITY Entertainment Group Limited Notes to the Financial Statements
30 June 2012 (continued)
-34-
24 NON CONTROLLING INTEREST Consolidated 2012 2011
$'000 $'000
Balance at the beginning of the year 1,368 1,325 Share of surpluses/(deficit) of subsidiaries 336 Balance at the end of the year
43 1,704
The non controlling interest relates to the 40% of Queenstown Casinos Limited which is not owned by SKYCITY.
1,368
25 DIVIDENDS
Consolidated Parent 2012 2011 2012 2011
$'000 $'000 $'000 $'000
Prior year final dividend 46,079 53,198 46,079 53,198 Current year interim dividend 51,915 46,009 51,915 Total dividends provided for or paid
46,009 97,994 99,207 97,994
99,207
Prior year final dividend (per share) 8.00¢ 9.25¢ 8.00¢ 9.25¢ Current year interim dividend (per share) 9.00¢ 8.00¢ 9.00¢ 8.00¢ On 14 August 2012, the directors resolved to declare a final dividend of 8 cents per share in respect of the year ended 30 June 2012 (refer to note 34 for further details).

SKYCITY Entertainment Group Limited Notes to the Financial Statements
30 June 2012 (continued)
-35-
26 FINANCIAL RISK MANAGEMENT The Group’s activities expose it to a variety of financial risks: market risks (interest rate, currency and electricity price), liquidity risk, and credit risk. The Group’s overall risk management programme recognises the nature of these risks and seeks to minimise potential adverse effects on the Group’s financial performance. The Group uses derivative financial instruments to hedge certain risk exposures.
Risk management is carried out by a central treasury department under a formal Treasury Policy approved annually by the board of directors. Treasury policy sets out written principles for overall risk management, as well as policies covering specific areas such as foreign exchange risk, interest rate risk, credit risk, use of derivative financial instruments and non-derivative financial instruments, and investment of excess funds. The Treasury Policy sets conservative limits for allowable risk exposures which are formally reviewed at least annually.
(a) Market Risk
(i) Currency Risk The Group operates internationally and is exposed to currency risk, primarily with respect to Australian and US dollars. Exposure to the Australian dollar arises from the Group’s net investment in its Australian operations. Exposure to the US dollar arises from funding denominated in that currency.
The Group utilises natural hedges wherever possible (i.e. Australian dollar funding is used to partially hedge the net investment in Australian operations) with forward foreign exchange contracts used to manage any significant residual risk to the Income Statement.
The Group’s exposure to the US dollar (refer to US dollar US Private Placement debt detailed in notes 17 and 18) has been fully hedged by way of cross-currency interest rate swaps (CCIRS), hedging US dollar exposure on both principal and interest. The CCIRS correspond in amount and maturity to the US dollar borrowings with no residual US dollar exposure.
Movement in exchange rates will have very limited impact on the parent accounts as there are minimal currency exposures in that entity.
(ii) Interest Rate Risk The Group’s interest rate exposures arise from long-term borrowings.
Interest rate swaps (IRS) and CCIRS are utilised to modify the interest repricing profile of the Group’s debt to match the profile required by Treasury Policy. All IRS and CCIRS are in designated hedging relationships that are highly effective.
As the Group has no significant interest-bearing assets, the Group’s revenue is substantially independent of changes in market interest rates.
The following table sets out the Group’s exposure to interest rate risk, including the contractual repricing dates and the effective weighted average interest rate.
Principal - Interest Rate Repricing 2012 1 year or
less 1-2 years 2-3 years 3-4 years 4-5 years Over 5
years Total
% $'000 $'000 $'000 $'000 $'000 $'000 $'000
Cash and deposits 2.50 2,538 - - - - - 2,538 Advance to Christchurch Hotels 2.90 5,125 - - - - - 5,125 Bank facility 4.99 (240,627) - - - - - (240,627) US Private Placement 5.06 (49,296) - (59,751) - (34,325) (222,476) (365,848) Capital notes (NZ) 7.25 - - (56,451) - - - (56,451) IRS/CCIRS* 80,153 (31,876) (4,599) (35,500) (3,675) (4,503)
- (202,107) (31,876) (120,801) (35,500) (38,000) (226,979)
Weighted average debt interest rate
(655,263)
6.97%

SKYCITY Entertainment Group Limited Notes to the Financial Statements
30 June 2012 (continued)
26 FINANCIAL RISK MANAGEMENT (continued)
-36-
Principal - Interest Rate Repricing 2011 1 year or
less 1-2 years 2-3 years 3-4 years 4-5 years Over 5
years Total
% $'000 $'000 $'000 $'000 $'000 $'000 $'000
Cash and deposits 2.50 55,690 - - - - - 55,690 Advance to Christchurch Hotels 2.68 6,235 - - - - - 6,235 US Private Placement 4.82 (296,563) - - (56,798) - (244,108) (597,469) Capital notes (NZ) 7.25 - - - (56,451) - - (56,451) IRS/CCIRS * 98,278 (32,300) - (7,552) (35,840) (22,586)
- (136,360) (32,300) - (120,801) (35,840) (266,694)
Weighted average debt interest rate
(591,995)
7.36%
* Interest rate swaps and cross-currency interest rate swaps, notional principal amounts.
For both 2012 and 2011 capital notes are the only interest-bearing debt within the parent entity. The parent had no derivatives as at 30 June 2012 (2011: forward foreign exchange contract with fair value of negative $113,000).
(iii) Summarised sensitivity analysis The following table summarises the sensitivity of the Group’s financial assets and financial liabilities to interest rate risk and foreign exchange risk. The sensitivity analysis considers reasonably possible changes in each risk with all other variables held constant, taking into account all underlying exposures and related hedges at the reporting date. The impact calculated is based on a full year impact of each change. Sensitivities have been selected based on the current level of interest rates and exchange rates, volatility observed on an historical basis and market expectations for future movements.
Consolidated Interest rate risk Foreign exchange risk -100bps +100bps -5% +5%
30 June 2012 Profit Equity Profit Equity Profit Equity Profit Equity
$'000 $'000 $'000 $'000 $'000 $'000 $'000 $'000
NZD/AUD movements - - - - 78 17,951 (86) (16,241) NZ interest rate movement 1,331 (8,634) (1,331) 8,274 - - - - Australian interest rate movement 246 (7,325) (246) 6,816 - - - - Total increase/ (decrease) 1,577 (15,959) (1,577) 15,090 78 17,951 (86) (16,241)
Interest rate risk Foreign exchange risk
-100bps +100bps -5% +5% 30 June 2011 Profit Equity Profit Equity Profit Equity Profit Equity
$'000 $'000 $'000 $'000 $'000 $'000 $'000 $'000
NZD/AUD movements - - - - 558 10,030 (505) (9,075) NZ interest rate movement 645 (10,207) (645) 9,685 - - - - Australian interest rate movement 80 (7,086) (80) 6,586 - - - - Total increase/ (decrease) 725 (17,293) (725) 16,271 558 10,030 (505) (9,075)

SKYCITY Entertainment Group Limited Notes to the Financial Statements
30 June 2012 (continued)
26 FINANCIAL RISK MANAGEMENT (continued)
-37-
(b) Credit risk
Credit risk is the risk of financial loss to the Group if a customer or counterparty to a financial instrument fails to meet its financial obligations. SKYCITY is largely a cash-based business and its material credit risks arise mainly from financial instruments utilised in funding and International Business play.
Financial instruments (other than International Business discussed below) that potentially create a credit exposure can only be entered into with counterparties that are explicitly approved by the board. Maximum credit limits for each of these parties are approved on the basis of long-term credit rating (Standard and Poor’s or Moody’s). A minimum long-term rating of A+ (S&P) or A1 (Moody’s) is required to approve individual counterparties.
The maximum credit risk of any financial instrument at any time is the fair value where that instrument is an asset. All derivatives are carried at fair value in the balance sheet. Trade receivables are presented net of an allowance for estimated doubtful receivables.
International players are managed in accordance with accepted industry practise. Settlement risk associated with international players is minimised through credit checking and a formal review and approval process.
There are no significant concentrations of credit risk in the Group.
(c) Liquidity risk
Liquidity risk management implies maintaining sufficient cash and the availability of funding through an adequate amount of unutilised committed credit facilities. The Group manages liquidity risk by continuously monitoring forecast and actual cash flows and maintaining flexibility in funding by keeping committed credit lines available with a variety of counterparties and maturities.
Maturities of Committed Funding Facilities
The tables below analyse the Group’s maturity profile of committed funding. The bank facility revolving credit tranches of NZ$485 million (2011: NZ$400 million) were drawn down by NZ$145,000,000 as at 30 June 2012 (2011: nil drawn down). The bank facility term tranche of A$75 million was fully drawn.
Consolidated - At 30 June 2012 Less than 6 months
6 - 12 months
Between 1 and 2 years
Between 2 and 3 years
Between 3 and 5 years
Over 5 years Total facility
$'000 $'000 $'000 $'000 $'000 $'000 $'000
Bank facility - - - 200,000 200,000 180,627 580,627 Capital notes - - - 56,451 - - 56,451 US Private Placement - - - 87,920 34,325 243,603 Total debt facilities
365,848 - - - 344,371 234,325 424,230
Payables
1,002,926
60,178 - - - - - 60,178 Total drawn debt - - - 289,371 34,325 339,230 662,926 Future contracted interest on drawn debt 15,350 14,576 29,152 27,342 40,715 42,495 169,630 Future contracted interest on CCIRS/IRS 5,997 5,878 11,621 10,849 16,331 17,399 68,075
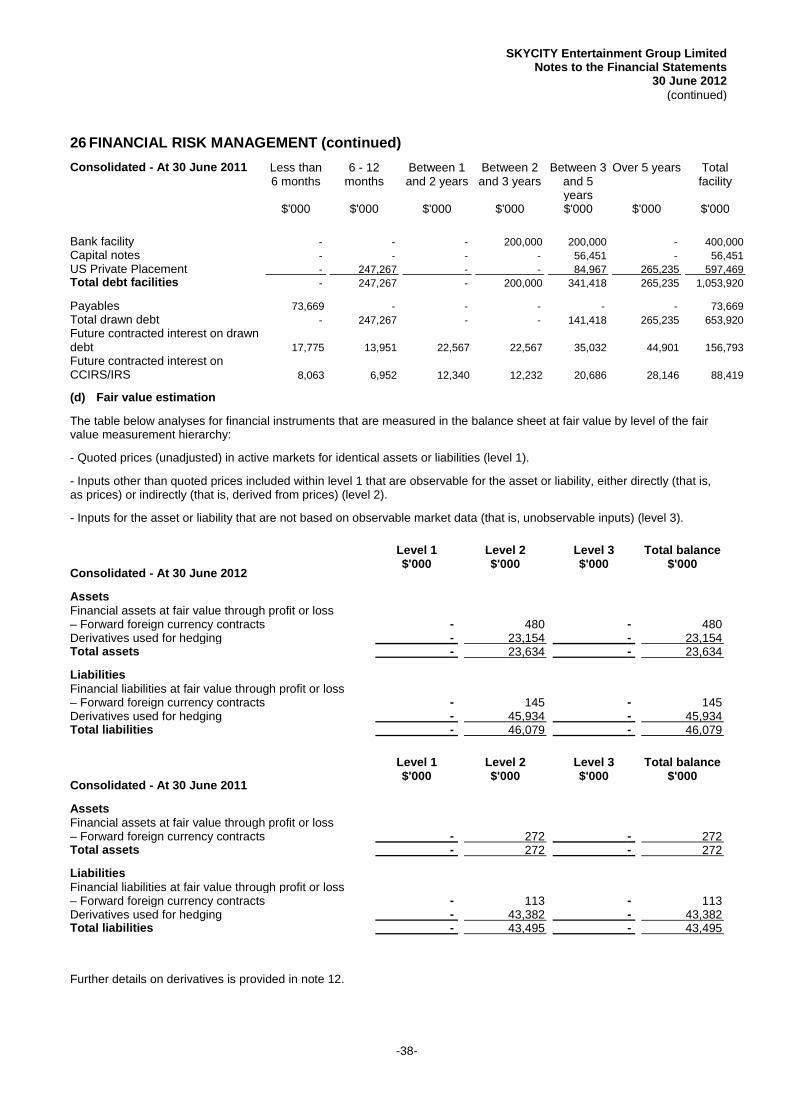
SKYCITY Entertainment Group Limited Notes to the Financial Statements
30 June 2012 (continued)
26 FINANCIAL RISK MANAGEMENT (continued)
-38-
Consolidated - At 30 June 2011 Less than 6 months
6 - 12 months
Between 1 and 2 years
Between 2 and 3 years
Between 3 and 5 years
Over 5 years Total facility
$'000 $'000 $'000 $'000 $'000 $'000 $'000
Bank facility - - - 200,000 200,000 - 400,000 Capital notes - - - - 56,451 - 56,451 US Private Placement - 247,267 - - 84,967 265,235 Total debt facilities
597,469 - 247,267 - 200,000 341,418 265,235 1,053,920
Payables 73,669 - - - - - 73,669 Total drawn debt - 247,267 - - 141,418 265,235 653,920 Future contracted interest on drawn debt 17,775 13,951 22,567 22,567 35,032 44,901 156,793 Future contracted interest on CCIRS/IRS 8,063 6,952 12,340 12,232 20,686 28,146 88,419
(d) Fair value estimation
The table below analyses for financial instruments that are measured in the balance sheet at fair value by level of the fair value measurement hierarchy:
- Quoted prices (unadjusted) in active markets for identical assets or liabilities (level 1).
- Inputs other than quoted prices included within level 1 that are observable for the asset or liability, either directly (that is, as prices) or indirectly (that is, derived from prices) (level 2).
- Inputs for the asset or liability that are not based on observable market data (that is, unobservable inputs) (level 3).
Level 1 Level 2 Level 3 Total balance
Consolidated - At 30 June 2012 $'000 $'000 $'000 $'000
Assets Financial assets at fair value through profit or loss – Forward foreign currency contracts - 480 - 480 Derivatives used for hedging - 23,154 - Total assets
23,154 - 23,634 -
Liabilities
23,634
Financial liabilities at fair value through profit or loss – Forward foreign currency contracts - 145 - 145 Derivatives used for hedging - 45,934 - Total liabilities
45,934 - 46,079 -
46,079
Level 1 Level 2 Level 3 Total balance
Consolidated - At 30 June 2011 $'000 $'000 $'000 $'000
Assets Financial assets at fair value through profit or loss – Forward foreign currency contracts - 272 - Total assets
272 - 272 -
Liabilities
272
Financial liabilities at fair value through profit or loss – Forward foreign currency contracts - 113 - 113 Derivatives used for hedging - 43,382 - Total liabilities
43,382 - 43,495 -
43,495
Further details on derivatives is provided in note 12.

SKYCITY Entertainment Group Limited Notes to the Financial Statements
30 June 2012 (continued)
26 FINANCIAL RISK MANAGEMENT (continued)
-39-
The fair value of financial instruments that are not traded in an active market (for example, over-the-counter derivatives) is determined by using valuation techniques. These valuation techniques maximise the use of observable market data where it is available and rely as little as possible on entity specific estimates. If all significant inputs required to fair value an instrument are observable, the instrument is included in level 2.
Specific valuation techniques used to value financial instruments include:
- The fair value of interest rate swaps is calculated as the present value of the estimated future cash flows based on observable yield curves.
- The fair value of forward foreign exchange contracts is determined using forward exchange rates at the balance sheet date, with the resulting value discounted back to present value
- Other techniques, such as discounted cash flow analyses, are used to determine fair value for the remaining financial instruments.
At year end the parent company has no derivatives (2011: $113,000 liability).
(e) Financial instruments by category
Loans and
Receivables
Assets / (Liabilities) at fair value through the
Income Statement
Derivatives used for Hedging
Liabilities at Amortised
Cost
$'000 $'000 $'000 $'000
Consolidated
At 30 June 2012 Cash and bank balances 41,400 - - - Trade receivables 13,551 - - - Advance to Christchurch Hotels Limited 5,125 - - - Sundry receivables 4,864 - - - Derivative financial instruments (net) - 335 (22,780) - Interest-bearing liabilities - - - (604,902) Capital notes - - - (56,414) Payables - - -
(60,178) 64,940 335 (22,780)
(721,494)
At 30 June 2011 Cash and bank balances 104,577 - - - Trade receivables 9,288 - - - Advance to Christchurch Hotels Limited 6,235 - - - Sundry receivables 11,244 - - - Derivative financial instruments (net) - 159 (43,382) - Interest-bearing liabilities - - - (597,469) Capital notes - - - (56,400) Payables - - -
(70,849) 131,344 159 (43,382) (724,718)

SKYCITY Entertainment Group Limited Notes to the Financial Statements
30 June 2012 (continued)
26 Financial risk management (continued)
-40-
(f) Capital Risk Management
The Group’s objectives when managing capital are to safeguard its ability to continue as a going concern and to maximise returns for shareholders and benefits for other stakeholders over the long term.
In order to optimise its capital structure, the Group manages actual and forecast operational cash flows, capital expenditure and equity distributions.
The Group primarily manages capital on the basis of gearing ratios measured on the basis of net debt to EBITDA (Earnings before Interest, Tax, Depreciation and Amortisation) and interest coverage (EBITDA relative to net interest cost).
The primary ratios were as follows at 30 June
2012 2011
Gearing ratio 2.1 x 2.0 x Interest coverage 6.3 x 6.2 x
These types of ratios are consistent with the financial covenants in the Group’s various funding facilities. Actual gearing as at 30 June 2012 was within covenant limits on funding facilities.
Although the New Zealand capital notes include the right for SKYCITY to convert them to equity they are treated as debt for capital management and financial reporting purposes.
The Group does not have any externally-imposed capital requirements.

SKYCITY Entertainment Group Limited Notes to the Financial Statements
30 June 2012 (continued)
-41-
27 SEGMENT INFORMATION Management has determined the operating segments based on the reports reviewed by the Chief Executive Officer/Managing Director that are used to assess performance and allocate resources.
The Group is organised into the following main operating segments:
SKYCITY Auckland SKYCITY Auckland includes casino operations, hotels and convention, food and beverage, carparking and Sky Tower and a number of other related activities.
Rest of New Zealand Rest of New Zealand includes the Group's interest in SKYCITY Hamilton, SKYCITY Queenstown Casino and Christchurch Casino.
SKYCITY Adelaide SKYCITY Adelaide includes casino operations and food and beverage.
SKYCITY Darwin SKYCITY Darwin includes casino operations, food and beverage and hotel.
International Business International Business includes commission and complimentary play. The international business segment is made up of customers sourced mainly from Asia, and the rest of the world. The revenue is generated at SKYCITY’s Auckland, Darwin, Adelaide and Queenstown locations.
Corporate / Group
Head office functions including legal and regulatory, group finance, human resources and information technology, the Chief Executive's office and directors.

SKYCITY Entertainment Group Limited Notes to the Financial Statements
30 June 2012 (continued)
27 SEGMENT INFORMATION (continued)
-42-
2012
SKYCITY AUCKLAND
REST OF NEW
ZEALAND SKYCITY
ADELAIDE SKYCITY DARWIN
INTER - NATIONAL BUSINESS
CORPORATE / GROUP TOTAL
$'000 $'000 $'000 $'000 $'000 $'000 $'000
Revenue from external customers and other income 433,648 53,929 182,043 140,021 43,817 - 853,458 Shares of net profits of associates - 5,447 - - - - 5,447 Less Expenses (228,335) (30,609) (137,182) (95,275) (35,294) (31,747) (558,442) Depreciation and amortisation (39,868) (5,284) (10,678) (11,358) - (5,582) Segment profit/EBIT
(72,770) 165,445 23,483 34,183 33,388 8,523 227,693 (37,329)
Finance costs Profit before income tax
(48,861)
Segment assets
178,832
720,271 136,039 269,973 382,648 - 207,335 Investment in associates
1,716,266 - 75,266 - - - -
Net additions to non-current assets (other than financial assets and deferred tax)
75,266
91,805 5,295 9,749 42,320 - 4,940
154,109
2011 SKYCITY
AUCKLAND
REST OF NEW
ZEALAND SKYCITY
ADELAIDE SKYCITY DARWIN
INTER - NATIONAL BUSINESS
CORPORATE / GROUP TOTAL
$'000 $'000 $'000 $'000 $'000 $'000 $'000
Revenue from external customers and other income 396,208 49,652 180,436 136,539 41,571 - 804,406 Shares of net profits of associates - 5,976 - - - - 5,976 Less Expenses (205,522) (28,343) (135,629) (91,840) (25,356) (29,416) (516,106) Impairment of Christchurch Casino - (15,000) - - - - (15,000) Depreciation and amortisation (35,089) (5,619) (10,976) (12,030) - (5,996) Segment profit/EBIT
(69,710) 155,597 6,666 33,831 32,669 16,215 209,566 (35,412)
Finance costs Profit before income tax
(43,772)
Segment assets
165,794
676,827 134,885 290,570 373,840 - 206,549 Investment in associates
1,682,671 - 73,782 - - - -
Net additions to non-current assets (other than financial assets and deferred tax)
73,782
62,036 3,456 7,464 17,552 - 4,140
94,648

SKYCITY Entertainment Group Limited Notes to the Financial Statements
30 June 2012 (continued)
27 SEGMENT INFORMATION (continued)
-43-
Breakdown of the revenue from all services is as follows:
Consolidated Parent 2012 2011 2012 2011 $'000 $'000 $'000 $'000
Revenue - products and services Local gaming 615,246 586,480 - - International business 43,817 41,571 - - Non gaming 192,467 175,094 - Total revenue
- 851,530 803,145 -
-
Revenue - geographic New Zealand 520,081 479,958 - - Australia 331,449 323,187 - Total revenue
- 851,530 803,145 -
-
Non-current asset additions - geographic New Zealand 102,040 69,632 - - Australia 52,069 25,016 - Total non-current asset additions
- 154,109 94,648 -
Non-current assets excluding financial instruments - geographic
-
New Zealand 947,867 910,978 - - Australia 634,012 611,927 - Total non-current assets excluding financial instruments
-
1,581,879 1,522,905 -
-

SKYCITY Entertainment Group Limited Notes to the Financial Statements
30 June 2012 (continued)
-44-
28 SHARE-BASED PAYMENTS Executive Share Rights Plan 2005
The Executive Share Rights Plan (Rights Plan) was approved by directors in December 2004 and commenced on 1 July 2005. Share rights issued under the Rights Plan are exercisable after the third anniversary of their date of issue provided the terms and conditions of the Plan are met, and lapse if not exercised within five years. The exercise price of the share rights is the base exercise price adjusted for the company's estimated cost of equity and dividends/distributions between the issue date and the exercise date of the rights.
Chief Executive Officer Long Term Incentive Plan 2008
The Chief Executive Officer Long Term Incentive Plan (CEO LTI) was approved by shareholders at the 31 October 2008 Annual Meeting. Share rights are granted under the CEO LTI and (if exercisable) may be exercised at no cost. If exercised each share right corresponds to one fully paid ordinary share in the company. Share rights only become exercisable when performance hurdles set by the board of directors are met.
491,132 rights were issued in the year ended 30 June 2009 of which 152,251 (2011: 275,034) have converted to shares in the current year.
Executive Long Term Incentive Plan 2008
The Executive Long Term Incentive Plan (Executive LTI) was approved by directors in December 2008. Share rights are granted under the Executive LTI and (if exercisable) may be exercised at no cost. If exercised each share right corresponds to one fully paid ordinary share in the company. Share rights only become exercisable when performance hurdles set by the board of directors are met.
Chief Executive Officer and Executive Long Term Incentive Plan 2009
During 2010, the Group implemented a new long term incentive plan for a limited number of senior executives (including the Chief Executive Officer). This plan replaced the share based Chief Executive Officer Long Term Incentive Plan 2008 and the Executive Long Term Incentive Plan 2008.
Under the new plan, executives purchase SKYCITY shares funded by an interest free loan from the Group. The shares purchased by the executives are held by a trustee company with executives entitled to exercise the voting rights attached to the shares and receive dividends, the proceeds of which are used to repay the interest free loan.
At the end of the restricted period (3 to 4 years), the Group will pay a bonus to each executive to the extent their performance targets have been met which is sufficient to repay the initial interest free loan associated with the shares which vest. The shares upon which performance targets have been met will then fully vest to the executives. The loan owing on shares upon which performance targets have not been met (the forfeited shares) will be novated from the executives to the trustee company and will be fully repaid by the transfer of the forfeited shares. Performance targets relate to total shareholder return.
At 30 June 2012 the interest free loan on the CEO Long Term Incentive Plan is $5,582,817 (2011: $5,846,428) and on the Executive Long Term Incentive Plan total $6,996,545 (2011: $5,300,645).

SKYCITY Entertainment Group Limited Notes to the Financial Statements
30 June 2012 (continued)
28 SHARE-BASED PAYMENTS (continued)
-45-
Movements in the number of share rights outstanding are as follows:
Grant Date Expiry date
Exercise price
Balance at start of the
year
Granted during the
year
Exercised / converted during the
year
Expired during the
year
Balance at end of the
year
Exercisable at end of the
year Number Number Number Number Number Number
Consolidated and parent - 2012 04/09/06 04/09/11 333,000 - - (333,000) - - 01/03/08 01/03/12 216,098 - (152,251) (63,847) - - 01/07/08 01/07/12 600,000 - (522,000) - 78,000 78,000 02/09/09 02/09/13 902,425 - - - 902,425 - 31/08/10 31/08/14 1,216,195 - - (50,250) 1,165,945 - 02/03/11 02/03/15 1,544,291 - - (150,000) 1,394,291 - 31/08/11 31/08/15 - 790,200 - (30,000) 760,200 Total
- 4,812,009 790,200 (674,251) (627,097) 4,300,861
Consolidated and parent - 2011
78,000
05/09/05 05/09/10 $4.81 231,000 - - (231,000) - - 04/09/06 04/09/11 $5.15 333,000 - - - 333,000 333,000 01/03/08 01/03/12 491,132 - (275,034) - 216,098 216,098 01/07/08 01/07/12 600,000 - - - 600,000 - 02/09/09 02/09/13 960,175 - - (57,750) 902,425 - 31/08/10 31/08/14 - 1,266,445 - (50,250) 1,216,195 - 02/03/11 02/03/15 - 1,544,291 - - 1,544,291 Total
- 2,615,307 2,810,736 (275,034) (339,000) 4,812,009
Exercise price
549,098
The rights granted from 2008 onwards do not have an exercise price.
The weighted average remaining contractual life of options and rights outstanding at the end of the period was 2.26 years (2011: 2.55 years).
Fair value of share rights granted The assessed fair value at grant date of the rights granted 31 August 2011 is $1.17 (31 August 2010 is 96.0 cents). The valuation inputs for the rights granted 31 August 2011 included:
(a) rights are granted for no consideration
(b) exercise price: nil (2011: nil)
(c) grant date: 31 August 2011 (2011: 31 August 2010)
(d) expiry date: 31 August 2015 (2011: 31 August 2014)
(e) share price at valuation date $3.42 (2011: $2.87)
The expected price volatility is derived by analysing the historic volatility over a recent historical period similar to the term of the right.

SKYCITY Entertainment Group Limited Notes to the Financial Statements
30 June 2012 (continued)
28 SHARE-BASED PAYMENTS (continued)
-46-
The assessed fair value at grant date of the rights granted 2 March 2011 is $1.11. The valuation inputs for the rights granted 2 March 2011 included:
(a) rights are granted for no consideration
(b) exercise price: nil
(c) grant date: 2 March 2011
(d) expiry date: 2 March 2015
(e) share price at valuation date: $3.34
The expected price volatility is derived by analysing the historic volatility over a recent historical period similar to the term of the right.
Expenses arising from Share-Based Payment Transactions
Total expenses arising from share-based payment transactions recognised during the period as part of employee benefit expense were as below.
Consolidated Parent 2012 2011 2012 2011
$'000 $'000 $'000 $'000
Rights issued under Share Rights Plans 1,426 1,047 1,426
1,047 1,426 1,047 1,426
29 RELATED PARTY TRANSACTIONS
1,047
There are no bad or doubtful debts associated with any related party of the Group or parent entity (2011: nil).
(a) Key Management and Personnel Compensation
Key management compensation for the years ended 30 June 2012 and 2011 is set out below. The key management personnel are all the directors of the company, the Chief Executive Officer and the direct reports to the Chief Executive Officer.
Short-term
benefits Share-based
payments Total $'000 $'000 $'000
2012 10,532 1,192 11,724
2011 8,242 835 9,077
(b) Other transactions with key management personnel or entities related to them
Information on transactions with key management personnel or entities related to them, other than compensation, are set out below.
Certain directors have relevant interests in a number of companies with which SKYCITY has transactions in the normal course of business. A number of SKYCITY directors are also non-executive directors of other companies. Any transactions undertaken with these entities have been entered into on an arms-length commercial basis.
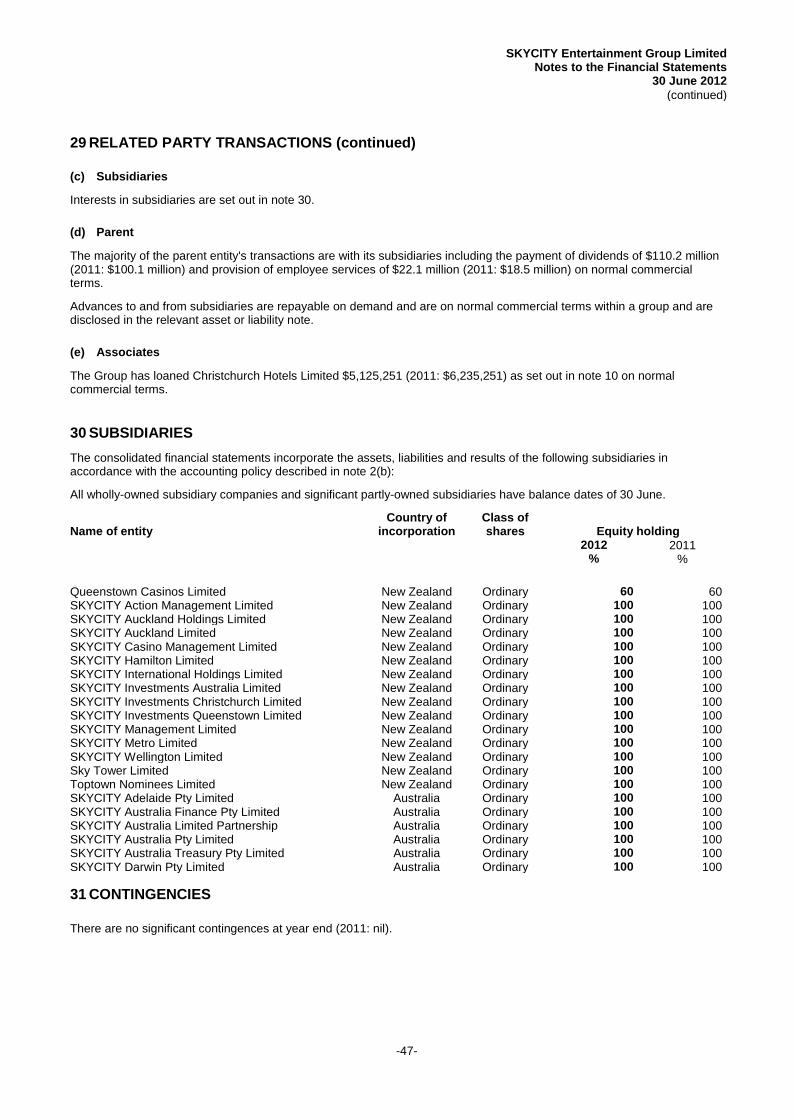
SKYCITY Entertainment Group Limited Notes to the Financial Statements
30 June 2012 (continued)
29 RELATED PARTY TRANSACTIONS (continued)
-47-
(c) Subsidiaries
Interests in subsidiaries are set out in note 30.
(d) Parent
The majority of the parent entity's transactions are with its subsidiaries including the payment of dividends of $110.2 million (2011: $100.1 million) and provision of employee services of $22.1 million (2011: $18.5 million) on normal commercial terms.
Advances to and from subsidiaries are repayable on demand and are on normal commercial terms within a group and are disclosed in the relevant asset or liability note.
(e) Associates
The Group has loaned Christchurch Hotels Limited $5,125,251 (2011: $6,235,251) as set out in note 10 on normal commercial terms.
30 SUBSIDIARIES The consolidated financial statements incorporate the assets, liabilities and results of the following subsidiaries in accordance with the accounting policy described in note 2(b):
All wholly-owned subsidiary companies and significant partly-owned subsidiaries have balance dates of 30 June.
Name of entity Country of
incorporation Class of shares Equity holding
2012 2011
% %
Queenstown Casinos Limited New Zealand Ordinary 60 60 SKYCITY Action Management Limited New Zealand Ordinary 100 100 SKYCITY Auckland Holdings Limited New Zealand Ordinary 100 100 SKYCITY Auckland Limited New Zealand Ordinary 100 100 SKYCITY Casino Management Limited New Zealand Ordinary 100 100 SKYCITY Hamilton Limited New Zealand Ordinary 100 100 SKYCITY International Holdings Limited New Zealand Ordinary 100 100 SKYCITY Investments Australia Limited New Zealand Ordinary 100 100 SKYCITY Investments Christchurch Limited New Zealand Ordinary 100 100 SKYCITY Investments Queenstown Limited New Zealand Ordinary 100 100 SKYCITY Management Limited New Zealand Ordinary 100 100 SKYCITY Metro Limited New Zealand Ordinary 100 100 SKYCITY Wellington Limited New Zealand Ordinary 100 100 Sky Tower Limited New Zealand Ordinary 100 100 Toptown Nominees Limited New Zealand Ordinary 100 100 SKYCITY Adelaide Pty Limited Australia Ordinary 100 100 SKYCITY Australia Finance Pty Limited Australia Ordinary 100 100 SKYCITY Australia Limited Partnership Australia Ordinary 100 100 SKYCITY Australia Pty Limited Australia Ordinary 100 100 SKYCITY Australia Treasury Pty Limited Australia Ordinary 100 100 SKYCITY Darwin Pty Limited Australia Ordinary 100 100
31 CONTINGENCIES
There are no significant contingences at year end (2011: nil).

SKYCITY Entertainment Group Limited Notes to the Financial Statements
30 June 2012 (continued)
-48-
32 COMMITMENTS
Capital Commitments
Capital expenditure contracted for at the reporting date but not recognised as liabilities is as set out below.
Consolidated Parent 2012 2011 2012 2011
$'000 $'000 $'000 $'000
Property, plant and equipment 27,268 59,695 - -
Operating Lease Commitments The Group leases various offices and other premises under non-cancellable operating leases. These leases have varying terms, escalation clauses and renewal rights. On renewal, the terms of the leases are renegotiated.
Consolidated Parent 2012 2011 2012 2011
$'000 $'000 $'000 $'000
Commitments for minimum lease payments in relation to non-cancellable operating leases are payable as follows: Within one year 6,974 5,482 - - Later than one year but not later than five years 18,074 13,419 - - Later than five years 322,136 318,673 - Commitments not recognised in the financial statements
- 347,184 337,574 -
The above operating lease summary includes a large number of leases, the most significant of which are:
-
SKYCITY Auckland - Hobson and Federal Streets sub soil lease. This lease is for a period of 999 years from 31 January 1996 with rent reviews every five years.
SKYCITY Adelaide - Casino building lease. The initial lease term is until 3 March 2025 with 3 further rights of renewal for 20 years each and annual rent reviews.

SKYCITY Entertainment Group Limited Notes to the Financial Statements
30 June 2012 (continued)
-49-
33 RECONCILIATION OF PROFIT AFTER INCOME TAX TO NET CASH INFLOW FROM OPERATING ACTIVITIES
Consolidated Parent 2012 2011 2012 2011
$'000 $'000 $'000 $'000
Profit for the year 138,534 122,960 70,979 63,480 Non-controlling interest 336 43 - - Depreciation and amortisation 72,770 69,710 5,561 5,958 Finance costs net 48,861 43,772 4,149 3,908 Current period employee share entitlement - - - - Current period share options expense 1,426 1,047 1,426 1,047 Gain on sale of fixed assets (1,756) (1,065) - - Dividend from subsidiary - - (110,178) (100,133) Impairment of Christchurch Casino - 15,000 - - Share of profits of associates not received as dividends (1,484) (5,233) - - Change in operating assets and liabilities
Decrease/(increase) in receivables and prepayments 3,928 (7,720) (66,253) 7,621 Decrease/(increase) in inventories 94 192 - - (Decrease)/increase in payables and accruals (3,666) 9,052 91,708 20,779 (Decrease)/increase in deferred tax liability (9,719) (1,057) - - (Increase) in tax receivable (4) (22,781) - -
Capital items included in working capital movements 12,423 (14,555) - - Subsidiary funding transactions - - (23,177) Net cash inflow from operating activities
(28,864) 261,743 209,365 (25,785)
34 EVENTS OCCURRING AFTER THE BALANCE SHEET DATE
(26,204)
Dividend
On 15 August 2012, the directors resolved to provide for a final dividend to be paid in respect of the year ended 30 June 2012. The partially (60%) imputed, partially franked (60%) dividend of 8 cents per share will be paid on 5 October 2012 to all shareholders on the company's register at the close of business on 28 September 2012.

MEDIA RELEASE 15 August 2012
Growth in International, Capital investment in Auckland
and RWC delivers Strong Result for SKYCITY
SKYCITY Entertainment Group (NZX:SKC) today announced its results for the full year
ended 30 June 2012, delivering a strong result, with Normalised Net Profit after Tax of
$141.4m, up 8.0% and Reported Net Profit after Tax of $138.5m up 12.6%.
Highlights of the 12 months ended 30 June 2012
Net Profit after Tax $141.4m, up 8.0%
Group Revenues $950.7m, up 8.4%
Auckland Revenues $527.4m, up 14.4%
Strong Growth in Auckland International Business Revenues $50.7m, up 95%
Group EBITDA $310.6m, up 6.8%
$50m investment in Auckland delivering solid returns and underpinning good growth
New Darwin Lagoon Resort opens with acclaim and positive outlook
Normalised Earnings per share 24.5cps, up 1.8 cps (up 8%)
Final dividend of 8 cents per share announced (full year dividend 17 cents per share)
Note: All above figures as “normalised”.
SKYCITY Chief Executive Officer, Nigel Morrison says he is pleased with the full year result,
particularly the growth in the core Auckland business, International Business, Hamilton and
the return to growth of Darwin.
“The 2012 Financial Year is a strong result for SKYCITY, with normalised revenues of
$950.7m, up $73.7 million (+8.4%). Normalised NPAT and EPS both increased by 8.0%
over last year.
“Our flagship Auckland property, with normalised revenues of $527.4m, delivered revenue
growth of $66.2m (+14.4%), with growth across all segments of the business, of which we
attribute $10.7m to the Rugby World Cup. This encouraging Auckland result is underpinned
by the strong opening of “Horizon”, our new international gaming suites and salons and
“EIGHT” our new VIP table games precinct, together with the other capital enhancements
completed in September last year. There is no doubt the outstanding success of our new

2
Federal Street award-winning restaurants “The Grill” by Sean Connelly and “Depot”, by Al
Brown has been a highlight of the year. Our revenues in Auckland grew by 14% in the
second half, from $226m to $259m with 65% of the growth (some $20m) coming from our
international business and with our food and beverage revenues growing by 25% in the
second half.
“Delivering $50.7m in international revenues in Auckland, up from $26.0m (up 95%) last
year, shows the positive impact of our new “Horizon” suites and gaming salons, which
opened in July 2011, with the momentum strengthening in the second half. Our
international business in Auckland has trebled since FY10. The international gaming clientele
who visit us from China, Hong Kong, Singapore, Thailand and Malaysia bring valuable
export income to Auckland and New Zealand. They visit attractions around Auckland,
Rotorua and Queenstown, demonstrating the further potential of New Zealand as an
international tourist destination to high-spending Chinese and South East Asian tourists.”
“The success of “Depot” by Al Brown and “The Grill” by Sean Connelly and the many awards
and recognition they have both received, has been overwhelming and a tribute to the vision
of these two great chefs. We will shortly be announcing our plans for the opening of new a
Japanese Robata styled restaurant in Federal St with award winning international NZ Chef
Nic Watt of Roca and Zuma fame. We hope that the Auckland Council will in the near term
approve our investment of $10 million into Federal Street so we can get on and transform it
into one of the great pedestrian / alfresco streetscapes in Auckland”.
“It is disappointing that we have not yet been able to conclude our negotiations with the NZ
Government regarding the development of the New Zealand International Convention
Centre, the process most recently stalling, while the Auditor-General reviews the Expression
of Interest process undertaken by the Ministry of Economic Development. Our expectation is
that the AG’s report will be completed in 1 to 2 months, following which we would hope to
re-engage with the Government and conclude these negotiations. In good faith and to
facilitate a development of the scale demanded by the Government, we have acquired
additional land adjacent to our Hobson St site, costing some $30 million. We remain
committed to the development of the New Zealand International Convention Centre in
Auckland, a much needed tourism infrastructure development for Auckland and New
Zealand, providing the ultimate terms of the transaction remain acceptable to SKYCITY”.
“In Darwin, our 5 star luxury lagoon resort development together with our new “Horizon”
gaming salons and villas have just opened to much acclaim. We are very excited about the
potential of having an international class VIP offering in Darwin for the first time, being so
close to key Asian cities. Our Darwin property returned to growth in the second half, with
revenues up 8%, with a bright future underpinned by the sound economic outlook for that

3
region and the significant new infrastructure projects there, including the $32 billion Inpex
LNG project”.
“Economic conditions have been challenging in South Australia in the second half. Never-the
–less, we remain committed to achieving our expansion and redevelopment aspirations for
the Adelaide Casino. We aim to transform it into a truly world-class integrated
entertainment facility, featuring a boutique 6 star hotel, expanded gaming facilities,
including “Horizon” International gaming suites and salons, signature restaurants and bars,
a spa and roof top pool lounge and large underground parking facility. This development will
complement the tourism and recreational infrastructure investments being undertaken by
the South Australian Government in the Riverbank precinct, with the expansion of the
convention centre and the transformation of the Adelaide Oval. We are continuing to work
closely with the South Australian Casino Task Force regarding the future taxation and
regulatory framework for the Adelaide Casino. The outcome of these discussions, which we
hope will transpire in this calendar year, will allow us to finalise our plans for transforming
the Adelaide Casino”.
“Our Hamilton business grew strongly over the year, with revenues and EBTIDA up 9% and
8% respectively, underpinned by the strength of the Waikato economy. As a result of our
confidence in the growth of the Waikato, we have approved the development of a $35
million, 135 room, 4+ star hotel to be constructed above our existing property in Hamilton.
“Our Christchurch Casino Joint Venture with Skyline continues to be challenged by a difficult
operating environment. Following the recent release of the Christchurch Central Recovery
Plan there is now further clarity around the rebuild of the city, with the planned convention
centre and other civic buildings within the proximity of the casino.
“With our strong balance sheet and reliable cash flows from our core operations, we are
confident that, should both our planned Adelaide and Auckland major development projects
come to fruition, we will be able to finance these without calling on shareholders.”
“With the sound results for the full year we are pleased to declare a final dividend of 8.0
cps, taking the full year dividend to 17.0 cps, up 1.0 cps (+6.3%) on prior year”.
“The first six weeks of this financial year have been pleasing with normalised revenues up
more than 5% on the same period last year, although we recognise the comparative for the
first half FY13, will be some what challenging, given the revenues from the RWC in the first
half last year”.
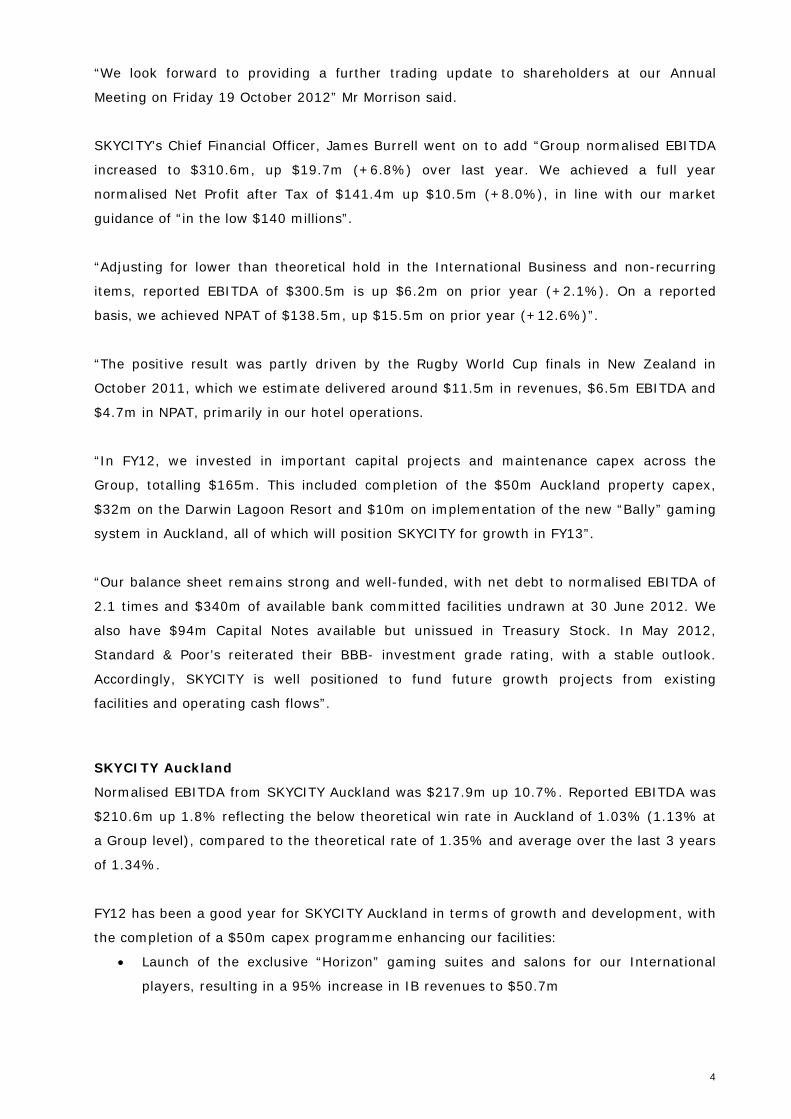
4
“We look forward to providing a further trading update to shareholders at our Annual
Meeting on Friday 19 October 2012” Mr Morrison said.
SKYCITY’s Chief Financial Officer, James Burrell went on to add “Group normalised EBITDA
increased to $310.6m, up $19.7m (+6.8%) over last year. We achieved a full year
normalised Net Profit after Tax of $141.4m up $10.5m (+8.0%), in line with our market
guidance of “in the low $140 millions”.
“Adjusting for lower than theoretical hold in the International Business and non-recurring
items, reported EBITDA of $300.5m is up $6.2m on prior year (+2.1%). On a reported
basis, we achieved NPAT of $138.5m, up $15.5m on prior year (+12.6%)”.
“The positive result was partly driven by the Rugby World Cup finals in New Zealand in
October 2011, which we estimate delivered around $11.5m in revenues, $6.5m EBITDA and
$4.7m in NPAT, primarily in our hotel operations.
“In FY12, we invested in important capital projects and maintenance capex across the
Group, totalling $165m. This included completion of the $50m Auckland property capex,
$32m on the Darwin Lagoon Resort and $10m on implementation of the new “Bally” gaming
system in Auckland, all of which will position SKYCITY for growth in FY13”.
“Our balance sheet remains strong and well-funded, with net debt to normalised EBITDA of
2.1 times and $340m of available bank committed facilities undrawn at 30 June 2012. We
also have $94m Capital Notes available but unissued in Treasury Stock. In May 2012,
Standard & Poor’s reiterated their BBB- investment grade rating, with a stable outlook.
Accordingly, SKYCITY is well positioned to fund future growth projects from existing
facilities and operating cash flows”.
SKYCITY Auckland
Normalised EBITDA from SKYCITY Auckland was $217.9m up 10.7%. Reported EBITDA was
$210.6m up 1.8% reflecting the below theoretical win rate in Auckland of 1.03% (1.13% at
a Group level), compared to the theoretical rate of 1.35% and average over the last 3 years
of 1.34%.
FY12 has been a good year for SKYCITY Auckland in terms of growth and development, with
the completion of a $50m capex programme enhancing our facilities:
• Launch of the exclusive “Horizon” gaming suites and salons for our International
players, resulting in a 95% increase in IB revenues to $50.7m

5
• Opening the high-end entertainment area “Eight” for our premium tier table players,
growing table volume by 10.6% and revenue by 2.7% in FY12 to $119.9m (albeit
reflecting a lower hold rate in FY12)
• Completion of the new gaming machine room for our Diamond gaming tier, which
supported the 10% revenue growth
• Opening the award winning restaurants “The Grill by Sean Connelly” and “Depot” by
Al Brown, cementing Federal Street as a leading culinary destination in New Zealand,
helping F&B revenue grow by 24.2% in FY12 to $45.1m
The 2011 Rugby World Cup created a solid start to the year, although the impact was less
significant than expected, delivering approximately $10.7m revenue and $6m EBITDA to our
Auckland property, mostly in our hotels business.
FY12 normalised revenues at our flagship Auckland property were $527.4m, up $66.2m
(+14.4%) from $461.2m in FY11. Normalised EBITDA of $217.9m grew by $21.0m
(+10.7%) from $196.9m in FY11. EBITDA margin has softened slightly from 42.7% to
41.3%, attributable to the increasing proportion of international business.
Excluding RWC, our Auckland business still showed strong underlying growth trends, with
revenue up by 12.0% and EBITDA up 7.6% on FY11.
We successfully launched a new customer loyalty programme, Premier Rewards, as well as
a new customer and gaming management system, Bally Gaming System. Whilst these
caused some interruption to growth in the fourth quarter of the year, both initiatives are
now fully functioning and are improving our approach to customer loyalty, marketing and
segmentation. We expect to see the benefits of these initiatives in FY13.
2012 was an award winning year for SKYCITY Auckland. The Grill won 2012 Cuisine
Magazine’s “New Zealand Restaurant of the Year” and “Best New Restaurant”. Depot won
“Restaurant of the Year”, “Best New Restaurant” and “Best Bistro” in the 2012 Metro
Awards in New Zealand. Both confirm SKYCITY’s position as Auckland’s leading
entertainment precinct. In addition, Peter Gordon’s Dine continues to feature as one of New
Zealand’s best restaurants and Peter as one of New Zealand’s most recognised chefs.
Adelaide Casino
Despite a strong first half in Adelaide, the challenging economic conditions in South
Australia put some pressure on consumer spending in 2H12, softening full year revenue
growth to A$4.0m (+2.6%) to A$160.8m. FY12 normalised EBITDA was A$36.7m, up
A$0.7m (+1.9%) on FY11. Gaming machines revenues grew consistently over the year at
around 8%, while table games revenues were flat, albeit drop (volumes) was up 4% with a

6
slightly softer win percentage. Adelaide’s EBITDA margin continues to hold up well at
22.8%.
SKYCITY Darwin
After several years of softness and a flat performance in 1H12, Darwin has now started to
show sustained signs of growth. Full year FY12 revenues of A$117.9m are up A$4.3m
(+3.8%) on FY11 and EBITDA is up 1.2% to $34.7m.
Encouragingly, 2H12 had revenue growth of 8.4% to $54.3m, showing improvements
across all segments of the business. Silk Air’s business class flights direct from Singapore
have commenced and are starting to increase visitation to the property. Work on the $32
billion Inpex Ichthys LNG project has not yet had any significant impact on Darwin’s
revenues, but this is expected by calendar year end.
In July 2012, we opened Darwin’s only luxury 5-star beachfront resort. This resort
complements our existing 120 bedroom hotel and features:
• 32 suites, around a 3 million litre heated swimming lagoon pool, with swim-up bar,
• 2 deluxe “Horizon” villas of approx 100 sqm, with adjoining private gaming salons for
International VIP gaming customers,
• 30m white sandy beach, Endota day spa, “Cove” restaurant and bar
The resort is attracting Australian domestic tourists (early bookings indicate strong
interest), corporate incentives / retreats and affluent Asian gaming clients. It opened with
100% occupancy and forward bookings indicate occupancy rates of 80% over at least the
coming months.
The new facilities in SKYCITY Darwin and the much improved macroeconomic outlook bode
well for Darwin’s domestic growth. In addition, Darwin’s proximity to Asia for attracting high
end players and the new Horizon VIP suites and salons, provide our Darwin property the
opportunity to really compete in the International VIP market for the first time.
SKYCITY Hamilton
Our Hamilton property continues to perform well, with revenues of $52.1 million up $4.2m
(+8.8%) on FY11. Of this, we estimate revenue of circa $0.8 million is due to Rugby World
Cup. Excluding RWC, underlying revenue growth remains strong at circa 7.1% on FY11.
Hamilton FY12 EBITDA of $21.8m is a good result, showing growth of $1.6m (+7.9%) on
FY11. Excluding RWC EBITDA of c.$0.5m, EBITDA still grew by 5.5% in FY12, a pleasing
outcome.

7
Nigel Morrison, CEO of SKYCITY commented, “We are pleased to announce that plans will be
finalised shortly for a 4+ star hotel development, with 135 rooms above our Hamilton
property. The hotel will include 8 luxury duplex suites for our premium customers and 16
large suites with river frontage balconies, in addition to 111 standard rooms. The hotel
plans also include a 5-lane swimming pool, sauna and gymnasium. We anticipate the total
cost to be around $35m.
“Our Hamilton property goes from strength to strength, as does the broader Hamilton and
Waikato economy. We support investment into the Hamilton growth story and believe this
development brings much needed quality hotel accommodation to central Hamilton. It will
significantly improve the facilities that we are able to offer to our existing and future
customers.
ENDS
For more information please contact:
Media
Mr Brodie Stewart
Analysts and Investors
Corporate Communications +64 9 363 7126 +64 2138 9150 [email protected]
Mr Aaron Morrison GM Business Development and Investor Relations +64 9 363 6205 [email protected]

Media Release 15 August 2012
SKYCITY Group announces strong results
Exciting potential to transform Adelaide property SKYCITY Entertainment Group today announced a strong normalised result for the 12
months ended 30 June 2012, with Normalised Net Profit After Tax (NPAT) growth of
8.0% to $141.4m.
SKYCITY Chief Executive Officer Nigel Morrison says he is pleased with the full year
Group result, particularly the growth in the core Auckland business and International
Business.
“SKYCITY Group had strong result for the 2012 Financial Year, with normalised revenues
of $950.7m, up $73.7 million (+8.4%). Normalised NPAT and Earnings Per Share both
increased by 8.0% over the last year,” Mr Morrison said.
“Our Adelaide result for the F12 year was satisfactory given the challenging consumer
environment. Total revenues increased modestly by 2.6% from A$156.8m to A$160.8m,
with normalised EBITDA of A$36.7m, up A$0.7m (+1.9%) on FY11.”
Mr Morrison said SKYCITY remained committed to achieving its expansion and
redevelopment aspirations for the Adelaide property.
“SKYCITY’s fastest growing business is its VIP business from Asia, and primarily from
China. This business has trebled in size over the last 3 years in our Auckland property to
over $50m in revenue, following the recent investment to create new world class
facilities dedicated to this market.
“Our vision is to transform the Adelaide Casino into a truly world class integrated
entertainment complex, featuring a range of high end facilities which are expected by
Asian and Chinese tourists. Adelaide already has a great platform for Asian tourism, with
its range of world class golf courses, wineries, events and great food, and a redeveloped
Adelaide property would complete this high end tourism experience.

“Our exciting plans for the redeveloped property feature the creation of a boutique 6 star
hotel, expanded gaming facilities including luxurious VIP gaming suites and salons, a
range of leading signature restaurants and bars, a spa and roof top pool lounge and a
large underground parking facility.
“We estimate that the redevelopment would create demand for up to 500 jobs during
construction, and around 1,000 additional jobs for young South Australians once
operational. This development would underpin the other significant investments in the
Riverbank precinct.
“We continue to work closely with the South Australian Casino Task Force regarding the
future taxation and regulatory framework for the Adelaide Casino. The outcome of these
discussions, which is hoped for this calendar year, will allow us to finalise our plans for
transforming the Adelaide Casino,” Mr Morrison said.
Adelaide Casino General Manager David Christian said that the future for Adelaide is
extremely promising with the State Government committed to large scale infrastructure
spending in the Riverbank Precinct of around $1 billion.
“This includes the expanded Convention Center, redeveloped Adelaide Oval and new
pedestrian foot bridge over the Torrens, and development of the Riverbank Precinct into
a truly vibrant entertainment hub for the city.
“Coupled with the Government’s vision of creating a vibrant capital city, this provides the
opportunity for the Adelaide Casino to develop into a world-class tourism facility that will
support and strengthen this vision,” Mr Christian said
ENDS
For more information please contact:
SKYCITY Adelaide
David Christian
SKYCITY Corporate
GM Adelaide Casino +61 8 8218 4159
Aaron Morrison GM Business Development and Investor Relations +64 9363 6205

Media Release 15 August 2012
SKYCITY announces strong results
Darwin returns to growth with positive outlook following opening major development
SKYCITY Entertainment Group today announced a strong normalised result for the 12
months ended 30 June 2012, with Normalised Net Profit After Tax (NPAT) growth of
8.0% to $141.4m.
SKYCITY Chief Executive Officer Nigel Morrison says he is pleased with the full year
Group result, particularly the growth in the core Auckland business, International
Business and SKYCITY Darwin.
“SKYCITY Group had a strong result for the 2012 Financial Year, with normalised
revenues of $950.7m, up $73.7 million (+8.4%). Normalised NPAT and Earnings Per
Share both increased by 8.0% over the last year,” Mr Morrison said.
“Encouragingly, Darwin had revenue growth in 2H12 of 8.4% to $54.3m, after a flat first
half, showing improvements across all segments of the business in what has been a
challenging environment for discretionary consumer spending in the Northern Territory.
"We are extremely excited by the outlook for our Darwin property. We recently opened
Darwin’s first luxury lagoon beachfront resort. Our development complements our
existing five star 120 bedroom hotel and features 32 deluxe suites situated around a 3
million litre heated swimming lagoon pool featuring a swim up bar and 30m white sandy
beach.
“The new development also features two luxurious villas with adjoining private gaming
salons for International high roller VIP gaming customers, and represents an extension
of our successful “Horizon” VIP brand.
“Our International VIP business is the fastest growing segment of our business and we
are extremely excited by the opportunity for SKYCITY Darwin to capture it's fair share of

this growing regional market, given the new world class facilities and Darwin's proximity
to Asia.
We are already starting to see strong demand from Asian gaming customers and Silk
Air’s business class flights direct from Singapore are already starting to increase
visitation to the property"
“The resort is attracting strong interest from Australian domestic tourists, from both the
leisure and corporate incentive and retreats markets. It opened with 100% occupancy
and forward bookings indicate occupancy rates of 80% over at least the coming
months,” Mr Morrison said.
SKYCITY Darwin General Manager Brad Morgan said that the new lagoon resort
development and arrival of the new “Horizon” gaming salons and villas, which are the
only of their kind in the Northern Territory, has further cemented Darwin’s position as
Northern Australia's leading gaming and entertainment destination.
”The launch of our new development has received positive acclaim from our local,
interstate and international visitors. I am extremely proud of the SKYCITY Darwin team
who have delivered a truly world class development which will help showcase Darwin to
the rest of the world.
“I look forward to working closely with Tourism NT and the NT Convention Bureau to
ensure the new products increase the positive perception of Darwin in the domestic and
international marketplaces.
“The investment is a positive injection into Darwin’s economy which looks set to shine
with recent infrastructure ventures including the $32billion Inpex LNG project and the
impending arrival of additional US defense personnel. The much improved
macroeconomic outlook provides opportunity for SKYCITY Darwin to consider a number
of future development plans which will support further growth within the marketplace,”
Mr Morgan said.
ENDS For more information please contact:
Ms Megan Thompson Marketing Manager – SKYCITY Darwin +61 8 89403 8846 [email protected] For corporate inquiries please contact

Media Release 15 August 2012
SKYCITY announces strong annual results
Plans to invest $35m in Hamilton Hotel development SKYCITY Entertainment Group today announced the next stage of its SKYCITY Hamilton
development as the company reported a strong normalised result for the 12 months
ended 30 June 2012, with Normalised Net Profit after Tax (“NPAT”) growth of 8.0% to
$141.4m.
SKYCITY Chief Executive Officer Nigel Morrison says he is pleased with the full year
Group result, particularly the growth in the core Auckland business, International
Business and SKYCITY Hamilton.
“SKYCITY Group had strong result for the 2012 Financial Year, with normalised revenues
of $950.7m, up $73.7 million (+8.4%). Normalised NPAT and Earnings Per Share both
increased by 8.0% over the last year,” Mr Morrison said.
The hotel will include 8 luxury duplex suites for our premium customers, 16 large suites
with river frontage balconies, in addition to 111 standard rooms. The hotel plans also
include a 5-lane swimming pool, and a sauna and gymnasium.
“We have a lot of confidence in the growth of the Waikato region and we are pleased to
announce that plans will be finalised shortly for the $35m development of a 4+ star hotel
with 135 rooms above our Hamilton property,” Mr Morrison said.
“Our Hamilton property goes from strength to strength. We support investment in to the
Hamilton City growth story and believe the hotel development brings much needed
quality hotel accommodation to central Hamilton. It will significantly improve the
facilities that we are able to offer to our existing and future customers,” Hamilton Casino
General Manager Arthur Pitcher said.
Hamilton City Mayor Julie Hardaker said: "We are delighted to see SKYCITY continuing to
support and invest in Hamilton. The city does need more of these high-quality hotels and
I think this is complementary and positive news for the city".

“Our Hamilton business continued to grow in FY12, with revenue of $52.1m, up 8.8%
and EBTIDA of $21.8m, up 7.9%, showing the strength of our product offering in the
Waikato region,” SKYCITY Chief Financial Officer James Burrell said.
Hotel Information SKYCITY Hamilton recently received a renewed resource consent for a 3 story hotel
located above the existing SKYCITY Hamilton Casino in the Centre of Hamilton’s Golden
Mile, part of the vibrant entertainment hub of Hamilton.
Its location on the banks of the Waikato River gives it outstanding views and offers the
tranquility of riverside walks.
The 4+ star hotel will offer:
- 135 rooms, including 8 luxury duplex suites and 16 large suites with river
frontage balconies
- a grand atrium featuring an exquisite water feature incorporating the distinct
location and river culture
- a pool complex, gym and sauna room.
We anticipate introducing new and exciting restaurants and bar concepts in the near
term to complement this new development.
A key feature of the development will be to retain the existing historically significant
geodesic dome. This will be tastefully achieved and will blend in well with the hotel.
ENDS
For more information please contact:
Mr Arthur Pitcher SKYCITY Hamilton
GM SKYCITY Hamilton +64 7 834 4902 For corporate inquiries please contact Brodie Stewart Publicity Executive +64 9 363 7126 [email protected]

Media Release 15 August 2012
SKYCITY announces strong annual results
Queenstown Casino contributes to overall result SKYCITY Entertainment Group today announced a strong normalised result for the 12
months ended 30 June 2012, with Normalised Net Profit after Tax (NPAT) growth of
8.0% to $141.4m, including a positive result for SKYCITY Queenstown Casino.
SKYCITY Chief Executive Officer Nigel Morrison says he is pleased with the full year
Group result.
SKYCITY Group had a strong result for the 2012 Financial Year, with normalised
revenues of $950.7m, up $73.7 million (+8.4%). Normalised NPAT and Earnings Per
Share both increased by 8.0% over the last year,” Mr Morrison said.
“SKYCITY Queenstown’s good performance in FY12 saw revenue increase 12% to $9m.
This is one of the best results since the casino opened,” Mr Morrison said.
SKYCITY Queenstown Casino General Manager Michelle Baillie said Queenstown’s result
was driven by strong gaming revenues and effective cost management.
“We had a strong second half of the year with increased visitation from Asian groups
who enjoy coming to Queenstown. This also increased the per customer gaming spend.
“We look forward to continuing to grow the business in the upcoming year.
ENDS
For more information please contact:
Michelle Baillie SKYCITY Queenstown
GM SKYCITY Queenstown +64 3 441 0401 For corporate inquiries please contact Brodie Stewart Publicity Executive +64 9 363 7126 [email protected]