
Re-presentations of Art Collections - Information ...vgg/publications/2014/Chung14/chung14.pdf ·...
16
Re-presentations of Art Collections Joon Son Chung 1 , Relja Arandjelovi´ c 1 , Giles Bergel 2 , Alexandra Franklin 3 , and Andrew Zisserman 1 1 Department of Engineering Science, University of Oxford, United Kingdom 2 Faculty of English Language and Literature, University of Oxford, United Kingdom 3 Bodleian Libraries, University of Oxford, United Kingdom Abstract. The objective of this paper is to show how modern computer vision methods can be used to aid the art or book historian in analysing large digital art collections. We make three contributions: first, we show that simple document pro- cessing methods in combination with accurate instance based retrieval methods can be used to automatically obtain all the illustrations from a collection of illustrated documents. Second, we show that image level descriptors can be used to automatically cluster collections of images based on their categories, and thereby represent a collection by its se- mantic content. Third, we show that instance matching can be used to identify illustrations from the same source, e.g. printed from the same woodblock, and thereby represent a collection in a manner suitable for temporal analysis of the printing process. These contributions are demonstrated on a collection of illustrated En- glish Ballad sheets. 1 Introduction Art and book historians now have huge digital collections available for study [6, 7]. This offers an opportunity and a problem: subtle comparisons can potentially be carried out over far more data than was ever possible before, however, the manual analysis methods that have traditionally been used are simply inade- quate for collections of this scale (or would take many years of effort by an art historian). In this paper we show that standard computer vision methods are, fairly effortlessly, able to re-present images in art collections in a way that are suitable for manual analysis and to some extent, can automate some of this analysis. We consider two canonical problems: semantic clustering – re-presenting the data in clusters that are semantically related. This enables art historians to carry out longitudinal studies on how the depiction of a particular concept has changed over time; and instance clustering – re-presenting the data as clusters of exact copies. Analysis of exact copies is of interest in dating and time ordering collections. We exemplify these two representations using a dataset of images of broadside ballad sheets [11]. These are cheap printed sheets containing lyrics of popular
Transcript of Re-presentations of Art Collections - Information ...vgg/publications/2014/Chung14/chung14.pdf ·...

Re-presentations of Art Collections
Joon Son Chung1, Relja Arandjelovic1, Giles Bergel2,Alexandra Franklin3, and Andrew Zisserman1
1 Department of Engineering Science, University of Oxford, United Kingdom2 Faculty of English Language and Literature, University of Oxford, United Kingdom
3 Bodleian Libraries, University of Oxford, United Kingdom
Abstract. The objective of this paper is to show how modern computervision methods can be used to aid the art or book historian in analysinglarge digital art collections.We make three contributions: first, we show that simple document pro-cessing methods in combination with accurate instance based retrievalmethods can be used to automatically obtain all the illustrations froma collection of illustrated documents. Second, we show that image leveldescriptors can be used to automatically cluster collections of imagesbased on their categories, and thereby represent a collection by its se-mantic content. Third, we show that instance matching can be used toidentify illustrations from the same source, e.g. printed from the samewoodblock, and thereby represent a collection in a manner suitable fortemporal analysis of the printing process.These contributions are demonstrated on a collection of illustrated En-glish Ballad sheets.
1 Introduction
Art and book historians now have huge digital collections available for study [6,7]. This offers an opportunity and a problem: subtle comparisons can potentiallybe carried out over far more data than was ever possible before, however, themanual analysis methods that have traditionally been used are simply inade-quate for collections of this scale (or would take many years of effort by an arthistorian).
In this paper we show that standard computer vision methods are, fairlyeffortlessly, able to re-present images in art collections in a way that are suitablefor manual analysis and to some extent, can automate some of this analysis.We consider two canonical problems: semantic clustering – re-presenting thedata in clusters that are semantically related. This enables art historians tocarry out longitudinal studies on how the depiction of a particular concept haschanged over time; and instance clustering – re-presenting the data as clusters ofexact copies. Analysis of exact copies is of interest in dating and time orderingcollections.
We exemplify these two representations using a dataset of images of broadsideballad sheets [11]. These are cheap printed sheets containing lyrics of popular

2 J. S. Chung, R. Arandjelovic, G. Bergel, A. Franklin, and A. Zisserman
(a) (b) (c) (d)
Fig. 1: Woodcut illustrations. The pair of illustrations on the left appear tobe the same at first sight, but are printed from two different woodblocks. Thepair on the right are printed from the same block, but there are small differencesdue to wear and tear.
songs (ballads), and woodblock printed illustrations. The sheets were printedfrom the sixteenth until the early twentieth centuries. The dataset, describedin section 2, contains around 900 ballad sheets with many different ‘concepts’illustrated (such as ‘the devil’ or ‘death’ or ‘eating and drinking’). There areidentical copies (printed from the same woodblock), near but not exact copiesof woodblocks (so near but not exact illustrations, but semantically related) inwhich the differences in the features and the shapes of the illustrations are verysubtle, and also different depictions of the same concept.
The task of matching the woodblocks presents many challenges – the largequantity of woodblocks and illustrations makes them very difficult to organiseby hand, and a pair of illustrations such as Figures 1a and 1b that look identicalto all but the most trained eye may in fact be from a close copy of a woodblock.Comparing illustrations from the same woodblock is no easier – small damages tothe woodblock, such as a wormhole in Figure 1d that is not present in Figure 1c,are again not obvious to the eye. Such differences may be identified under closeinspection when the set consists of a few images, but the task becomes completelyinfeasible in a set of thousands.
Paper outline: Section 3 describes how woodblock illustration regions can bedetermined automatically by first removing areas of text, based on their char-acteristic patterns, and then refined and verified by matching and comparingto regions of similar illustrations on other ballad sheets. Section 4 describes thesemantic clustering where compact descriptors such as VLAD and GIST areutilised to compute similarities between the illustrations, and thereby clusterthem into semantically similar groupings. Within each cluster of semanticallysimilar images, further analysis based on exact instance matching (SIFT andspatial verification) is performed to find illustrations that come from the samewoodblock (section 5). A number of features are generated from the differencebetween the images, and a Support Vector Machine (SVM) is trained to distin-
Re-presentations of Art Collections 3
guish prints from the same block from those from a copy. Finally, differencesexist even between prints from the same woodblock, many of which are the re-sult of damage to the block. These visual damage cues can be used to find atemporal ordering of the sheets.
1.1 Related work
The evolution and temporal ordering of illustrations is of great interest to arthistorians and bibliographers [3]. Monroy et al. [22] suggests that differences inthe local image features can be used to visualise the temporal order in which theimages were produced – e.g. the more times an illustration is copied, the moredetails that might differ from the original. Furthermore, Monroy et al. [21] notesthat even closely traced copies of an artwork contain geometric distortions, andsuggests grouping of deformations to reveal details about the process of copyingthe artwork.
For woodcuts, Hedges [13] discusses the correlation between wormholes inthe centuries-old printed art and the history of the prints. The wormholes takea distinctive shape – small and round holes, around 1.4 to 2.3 mm in diameter –hence they are easily identifiable as the cues of relative age. The wormholes arenot the only cues that can be used to order the illustrations. Hedges [12] givesuseful insights into the cues one might use to order the woodcut illustrations.
There has been previous work on using instance (specific object) matchingmethods for Ballad images. In Bergel et al. [4] an image matching tool wasdeveloped to provide immediate matches of regions of interest within a collectionof Ballad images. This used the standard bag of visual words method of [1, 25].The paper only considered matching though, and there was no investigation ofautomated clustering, which is the goal of this submission.
2 The Ballads dataset
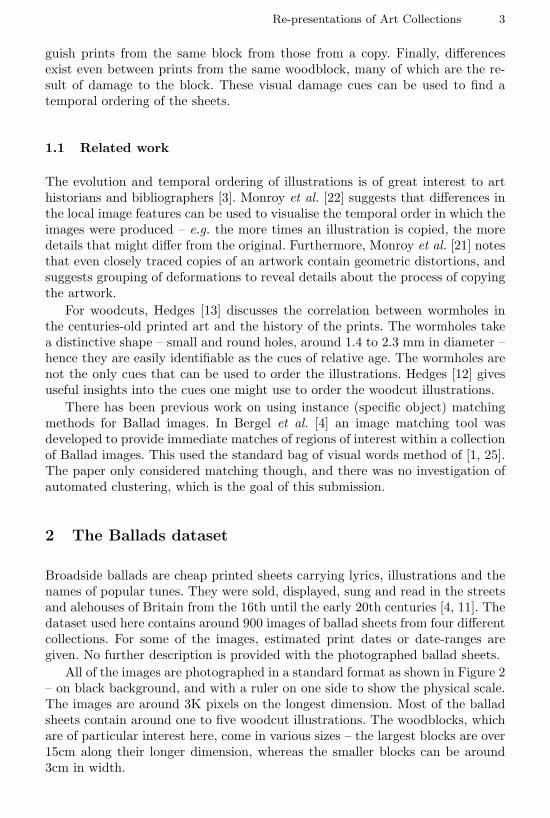
Broadside ballads are cheap printed sheets carrying lyrics, illustrations and thenames of popular tunes. They were sold, displayed, sung and read in the streetsand alehouses of Britain from the 16th until the early 20th centuries [4, 11]. Thedataset used here contains around 900 images of ballad sheets from four differentcollections. For some of the images, estimated print dates or date-ranges aregiven. No further description is provided with the photographed ballad sheets.
All of the images are photographed in a standard format as shown in Figure 2– on black background, and with a ruler on one side to show the physical scale.The images are around 3K pixels on the longest dimension. Most of the balladsheets contain around one to five woodcut illustrations. The woodblocks, whichare of particular interest here, come in various sizes – the largest blocks are over15cm along their longer dimension, whereas the smaller blocks can be around3cm in width.

4 J. S. Chung, R. Arandjelovic, G. Bergel, A. Franklin, and A. Zisserman
Fig. 2: Photographs of broadside ballad sheets
3 Automatic cropping of illustrations
In this section we outline the method of identifying and cropping candidateobjects (woodblock illustrations) from images of the ballad sheets. There are twostages, first putative regions are obtained from areas that are not text on thesheet, second instance matching with other copies of the woodblock print withthe collection is used to refine the regions and separate connected neighbouringobjects into individual prints from different woodblocks.
3.1 Identifying text areas and candidate picture regions
The main objects that appear in the broadside ballad sheets are text and pic-tures (woodblock illustrations). The vertical spacing of text is fairly regular –approximately 4 to 6 millimetres (8 to 12 pixels). As a result, if a horizontalsum of intensity values is taken over an area of text, it is possible to observe aregular pattern of intensities, as shown in Figure 3.
If a Fourier transform is taken over this signal, a sharp and distinctive peakis found at a frequency of around 0.1 (unit: per pixel), such as in the exampleshown in Figure 3a. However over any other area which does not contain text, nosuch peak is observed (Figure 3b). The process is repeated across the page witha moving window, and all areas showing a strong peak at such frequency aredisregarded. Having removed the text, it is possible to search over the remaining

Re-presentations of Art Collections 5
(a) An area of text – a distinctive peak is observed
(b) An area of image – no distinctive peak is observed
Fig. 3: Fourier transform of horizontal sum
(a) Regions of text (b) Text removed from thebinary image
(c) Bounding boxes de-tected
Fig. 4: Text detection and removal, and candidate bounding boxes.
area for candidate objects, given the known geometric constraints (for example,the illustrations must be greater than 3 cm in width and cannot lie on the pagemargin). The process is illustrated in figure 4.
Evaluation over a random set of 200 sheets shows good performance, withprecision and recall of 98.5% and 99.1% respectively. There are examples wheretwo neighbouring illustrations are erroneously proposed as one due to the illus-trations being very close together. This is not considered an error at this point,and the problem is addressed in the following section.
3.2 Separation of connected neighbouring objects
At this point, some illustrations that are in very close proximity (typically withina few pixels of each other) are often highlighted as one connected component.In this section we resolve this problem using a local implementation of the stan-dard BoW retrieval system [25] by searching over all putative regions. (For the
6 J. S. Chung, R. Arandjelovic, G. Bergel, A. Franklin, and A. Zisserman
(a) ImageMatch query from a sin-gle image
(b) ImageMatch query from multiple images
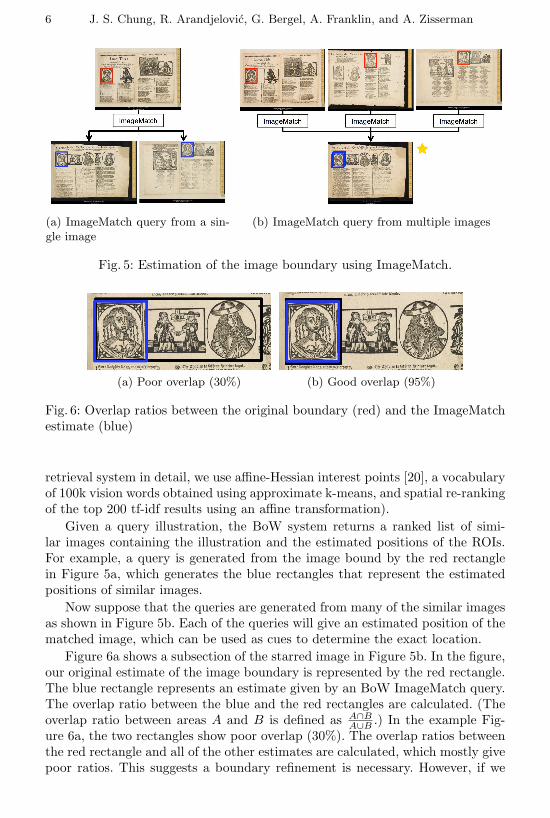
Fig. 5: Estimation of the image boundary using ImageMatch.
(a) Poor overlap (30%) (b) Good overlap (95%)
Fig. 6: Overlap ratios between the original boundary (red) and the ImageMatchestimate (blue)
retrieval system in detail, we use affine-Hessian interest points [20], a vocabularyof 100k vision words obtained using approximate k-means, and spatial re-rankingof the top 200 tf-idf results using an affine transformation).
Given a query illustration, the BoW system returns a ranked list of simi-lar images containing the illustration and the estimated positions of the ROIs.For example, a query is generated from the image bound by the red rectanglein Figure 5a, which generates the blue rectangles that represent the estimatedpositions of similar images.
Now suppose that the queries are generated from many of the similar imagesas shown in Figure 5b. Each of the queries will give an estimated position of thematched image, which can be used as cues to determine the exact location.
Figure 6a shows a subsection of the starred image in Figure 5b. In the figure,our original estimate of the image boundary is represented by the red rectangle.The blue rectangle represents an estimate given by an BoW ImageMatch query.The overlap ratio between the blue and the red rectangles are calculated. (Theoverlap ratio between areas A and B is defined as A∩B
A∪B.) In the example Fig-
ure 6a, the two rectangles show poor overlap (30%). The overlap ratios betweenthe red rectangle and all of the other estimates are calculated, which mostly givepoor ratios. This suggests a boundary refinement is necessary. However, if we

Re-presentations of Art Collections 7
Fig. 7: Separation of neighbouring illustrations. Blue boxes show all poten-tial boundaries generated using ImageMatch. Green boxes show final separationof the illustrations.
suppose that the original image boundary is as shown in Figure 6b, the over-lap ratio between the red rectangle and the BoW ImageMatch estimates wouldmostly show good overlap, which indicates that the original boundary is likelyto be accurate.
The queries are generated from all of the illustrations detected in section 3.1,and the returned coordinates that overlap the ROI in question are noted aspotential boundaries (Figure 7). This information is then used to cluster theboundaries of illustrations within the original candidate. First, the centre (x andy) and the size (height h and width w) of all blue boxes are calculated. Then, theboxes whose x and y values are furthest from the median are iteratively deleteduntil the standard deviation of the remaining boxes are within the threshold.The same is repeated for w and h values of the boxes that are not rejected in theprevious step. The mean of the remaining boxes are taken as the new boundary.Where the resultant boundary does not cover most of the initial object (over80%), the process is repeated using the remaining, unused ROIs, until the processreturns no more estimates that do not overlap the new objects.
The green rectangles in Figure 7 show the final cropping result on the exampleimage used throughout this chapter. On a test set of 200 pages, the methodproved to be reliable for all examples where the new boundary is defined byaveraging three or more BoW ImageMatch returns. As this process relies onmajority voting on the cropping data from Section 3.1, it is necessary that alarge majority of the illustrations are already correctly cropped as in the exampleFigure 7.
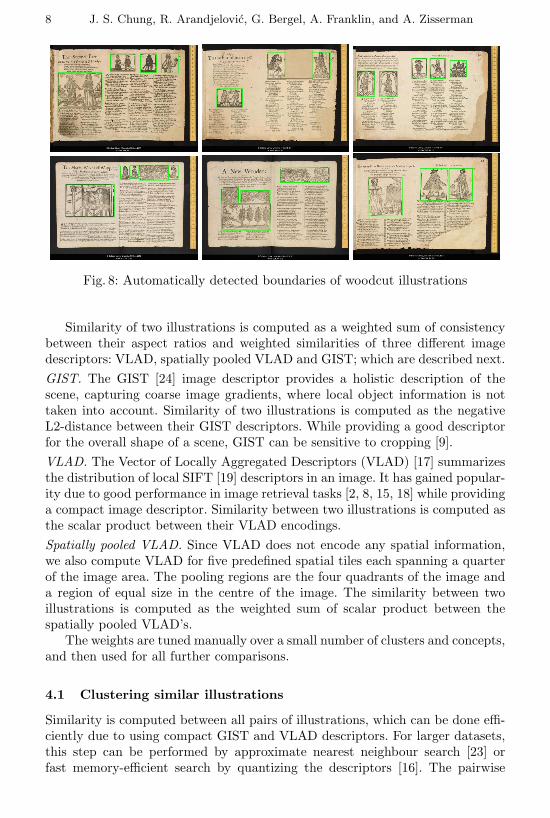
From the full set of 900 broadside ballad sheets, around 2,600 individualillustrations are detected and cropped. Selected results are shown in Figure 8.
4 Semantically similar illustrations
Having identified the woodblock illustrations in section 3, the main objectiveof this section is to automatically find and cluster the illustrations that aresemantically similar to each other. Note, to avoid confusion, we are not tryingto assign illustrations to manually curated classes defined by cataloguers, suchas the Iconclass [14] system.
8 J. S. Chung, R. Arandjelovic, G. Bergel, A. Franklin, and A. Zisserman
Fig. 8: Automatically detected boundaries of woodcut illustrations
Similarity of two illustrations is computed as a weighted sum of consistencybetween their aspect ratios and weighted similarities of three different imagedescriptors: VLAD, spatially pooled VLAD and GIST; which are described next.
GIST. The GIST [24] image descriptor provides a holistic description of thescene, capturing coarse image gradients, where local object information is nottaken into account. Similarity of two illustrations is computed as the negativeL2-distance between their GIST descriptors. While providing a good descriptorfor the overall shape of a scene, GIST can be sensitive to cropping [9].
VLAD. The Vector of Locally Aggregated Descriptors (VLAD) [17] summarizesthe distribution of local SIFT [19] descriptors in an image. It has gained popular-ity due to good performance in image retrieval tasks [2, 8, 15, 18] while providinga compact image descriptor. Similarity between two illustrations is computed asthe scalar product between their VLAD encodings.
Spatially pooled VLAD. Since VLAD does not encode any spatial information,we also compute VLAD for five predefined spatial tiles each spanning a quarterof the image area. The pooling regions are the four quadrants of the image anda region of equal size in the centre of the image. The similarity between twoillustrations is computed as the weighted sum of scalar product between thespatially pooled VLAD’s.
The weights are tuned manually over a small number of clusters and concepts,and then used for all further comparisons.
4.1 Clustering similar illustrations
Similarity is computed between all pairs of illustrations, which can be done effi-ciently due to using compact GIST and VLAD descriptors. For larger datasets,this step can be performed by approximate nearest neighbour search [23] orfast memory-efficient search by quantizing the descriptors [16]. The pairwise

Re-presentations of Art Collections 9
!
Fig. 9: Semantically similar images automatically detected and clustered
similarities are thresholded and a graph is formed such that nodes correspondto illustrations and undirected edges connect nodes of sufficient semantic sim-ilarity. Clustering is then performed by extracting connected components fromthe similarity graph. We then refine clusters with large intra-cluster variabilityto alleviate cases where a weak erroneous link between two different clusterscauses undersegmentation. The refinement is performed by identifying clusterswith large variance of intra-cluster similarities, and removing edges by enforcinga stricter similarity threshold, followed by recomputation of connected compo-nents. Some of the automatically obtained clusters are shown in figure 9.
5 Identifying illustrations printed from the same
woodblock
The objective of this section is to automatically identify prints generated fromthe same woodblock. This is of particular interest to cataloguers and art his-torians as tracking the use of a woodblock provides insights into the origin ofthe printed material, such as the identity of the printer, the place of printing,

10 J. S. Chung, R. Arandjelovic, G. Bergel, A. Franklin, and A. Zisserman
(a) Query image (b) Same (c) Similar
(d) Query image (e) Same (f) Similar
Fig. 10: Same vs similar pairs. In each row, the first two illustrations areprinted from the same woodblock. The last illustration appears to be very sim-ilar, but comes from a different woodblock that is a copy of the original block.
or the sale or loan of a woodblock providing information about relationshipsbetween printers. Moreover, examining the changes in the condition of a wood-block, such as the development of wormholes, allows for automatic dating of thesheets [12, 13].
Section 4 described a method for mining clusters containing similar illustra-tions, here we concentrate on finer clustering to only group illustrations printedfrom the same woodblock. Therefore, we examine all pairs of illustrations in asemantic cluster to determine if they come from the same woodblock. This is achallenging task as it was common practice to closely copy woodblocks thereforegiving rise to sets of very similar illustrations (figure 10).
A linear SVM is trained to distinguish between a pair of same (i.e. printedfrom the same woodblock) and similar (i.e. printed from a similar and likelycopied woodblock) illustrations, using features which assess geometric consis-tency of the illustrations. The use of geometry is motivated by the observationthat, even though two similar illustrations look quite well aligned, it is unlikelythat they are related with a very accurate global rigid transformation as a re-sult of the geometrical errors accumulated during the copying process [22]. Thegeometry-based features are discussed next.
An affine transformation which aligns one illustration with the other is auto-matically estimated by forming a set of putative correspondences by matchingSIFT [19] descriptors using the second nearest neighbour test [19], and findingthe affine transformation which explains the largest number of the putative cor-

Re-presentations of Art Collections 11
(a) Inliers in a same pair (b) Inliers in a similar pair
Fig. 11: Spatial distribution of inliers. Lines connect SIFT descriptors con-sistent with an affine transformation. The blue rectangles show the boundingboxes of spatially consistent descriptors.
(a) I1,2 (Same) (b) I2,1 (Same) (c) I1,2 (Similar) (d) I2,1 (Similar)
Fig. 12: Difference images for illustrations from same and similar woodblocks
respondences using RANSAC [10]. Features which help determine the qualityof the affine transformation are: i) the number of putative SIFT-based matches(np); ii) the ratio of number of matches spatially consistent with the best affinetransformation, ns, and np (ns/np); and iii) the density of matches (ns dividedby illustration size).
We also observe that the spatial distribution of spatially consistent featuresis informative (figure 11) – a same pair has features matching across the entireillustration, while a similar pair often has only locally consistent matches. Thespatial spread is measured as the proportion of the illustration area covered bythe bounding box of spatially matched features. The bounding box is computedas the smallest axis aligned rectangle which contains the central 90% of features;this procedure ensures robustness by eliminating spurious matches which couldaffect the bounding box estimation.
Finally, we also include two features which capture fine level differences be-tween the two illustrations. Let I1 and I2 be a pair of illustrations such that I2is automatically registered to I1 using the aforementioned affine transformation,and both are binarized to 1 and 0 to indicate pixels which contain and don’t

12 J. S. Chung, R. Arandjelovic, G. Bergel, A. Franklin, and A. Zisserman
Table 1: Performance of same vs similar classification.Precision Recall Precision Recall
ImageMatch 78% 80% 69% 90%RANSAC statistics 98% 80% 95% 90%Our method 100% 80% 100% 90%
contain ink, respectively. From these, one can compute binary difference imagesIi,j which indicate pixels where image Ii contains ink and image Ij does not. Ascan be seen from figure 12, the difference images I1,2 and I2,1 can help discrimi-nate between same and similar pairs of illustrations. This is because for a samepair, in an ideal scenario, an Ii,j image will be completely empty (figure 12b)signifying that j was printed after i as all ink in Ij is present in Ii, i.e. ink couldhave only disappeared from Ii to Ij corresponding to potential damages to thewoodblock (the disappeared ink is visible in image Ij,i, figure 12a). On the otherhand, similar (not same) pairs have much less sparse Ii,j ’s (figures 12c and 12d).
Let |Ii,j | denote the number of ones in the difference image Ii,j , and withoutloss of generality let I2,1 be the sparser image (i.e. |I2,1| ≤ |I1,2|). The twofeatures which summarize the above observations are pmin = |I2,1|/A and pmax =|I1,2|/A, where A is the illustration area. Therefore, pmin is close to zero for samepairs (figure 12b) and large for similar pairs (figure 12d), while pmax also containsuseful information as it should be smaller for same pairs compared to similarones (figure 12a vs 12c). In practice, we first perform image opening with a smallradius on images Ii,j in order to remove the differences in the thickness of linescaused by varying amounts of ink on the woodblock.
To summarize, six features are used for classification into same versus similarillustration pairs – three capturing the counts and relative counts of putative andspatially consistent descriptor matches, one measuring the spatial distribution ofspatially consistent matches, and two capturing pixel-wise differences in inking.
5.1 Evaluation procedure and results
Benchmark dataset. To evaluate the classification accuracy of the proposedmethod, we have manually labelled a random sample of 150 pairs of illustra-tions obtained from clusters in section 4, such that there is a roughly equalnumber of same vs similar pairs. This set was divided into 50% for training, 25%for validation and 25% for testing.
Baselines. We compare the proposed approach with two baselines. The first isa classifier based purely on the number of spatially verified matches obtainedfrom ImageMatch (section 3.2), namely a pair of illustrations is deemed to be asame match if the number of matches in ImageMatch is larger than a threshold.The second is an SVM classifier trained only on the first three features of ourmethod which capture the RANSAC-based statistics, i.e. np, ns/np, and densityof ns.

Re-presentations of Art Collections 13
Fig. 13: Clustering example. For the running example images our methodfinds two clusters, shown one per row.
Results. Table 1 shows the results of our method compared to the two baselines.It can be seen that ImageMatch is not as good as the other two methods as itonly uses match count as a feature, as well as due to quantizing descriptors intovisual words. The RANSAC statistics performs quite well, but our method whichuses all six features significantly outperforms it, simultaneously achieving higherrecall and precision, namely, our method gets 100% precision at 90% recall whileRANSAC statistics achieves 98% precision at 80% recall, and only 95% precisionand 90% recall.
We pick the operating point which achieves maximal recall for 100% precision(recall at this point is 90%) and cluster together illustrations which are deemedto be same matches. The final results on the running example are shown infigure 13, while figure 14 shows some further examples.
5.2 Application: Temporal ordering of the illustrations
The likely printer of a sheet can be identified if his identity is known for a sheetwhich shares an illustration belonging to the same cluster. In similar ways, onecan also determine the place of printing or relationships between printers [5].
One interesting application is to automatically date a sheet – two sheetswhich contain an illustration printed from the same woodblock can be orderedtemporally by examining fine-level changes in the impressions. This applicationis beyond the scope of this paper, but we give a brief sketch of the method. Forexample, from figures 12a and 12b, it is evident that illustration I2 contains lessink that I1 (as I2,1, figure 12b, is empty) due to degradations of the woodblock(locations of which are apparent in I1,2, figure 12a). Therefore, in this example itcan be concluded that I2 has been printed later than I1. Using such automaticallydiscovered temporal constraints1, it is easy to order many sheets in terms of their
1 Actually we have a more robust method than simply measuring the amount of inkdifference in Ii,j , but it is beyond the scope of this paper

14 J. S. Chung, R. Arandjelovic, G. Bergel, A. Franklin, and A. Zisserman
Fig. 14: Illustrations from the same woodblock automatically detected and clus-tered
printing time. As dates of certain sheets are known, the temporal ordering canhelp narrow down the printing date of other sheets. Using this logic, it waspossible to automatically assign dates or date-ranges to over 70 ballad sheetswhose print dates were previously unknown.
6 Discussion
The three contributions of this paper: automatic cropping of illustrations, se-mantic clustering, and exact clustering (with applications to temporal ordering)have general applicability. For example, the cropping method could be applied toany collection that mixes text and repeated illustrations. The two types of clus-tering can be applied to any collection with some commonality in illustrations,e.g. those printed from woodblocks, such as medieval incunabula (e.g. ‘The Bookof Hours’), or collections with illustrations printed using engravings or lithog-raphy. All of these cases have the three aspects of illustrations from the samesource, near copies and different depictions of concepts.
Acknowledgements. We are grateful for financial support from ERC grantVisRec no. 228180.
Re-presentations of Art Collections 15
References
[1] Arandjelovic, R., Zisserman, A.: Three things everyone should know to im-prove object retrieval. In: Proc. CVPR (2012)
[2] Arandjelovic, R., Zisserman, A.: All about VLAD. In: Proc. CVPR (2013)[3] Barrow, T.: From ‘The Easter Wedding’ to ‘The Frantick Lover’: The re-
peated woodcut and its shifting roles. Studies in Ephemera: Text and Imagein Eighteenth-Century Print (2013)
[4] Bergel, G., Franklin, A., Heaney, M., Arandjelovic, R., Zisserman, A.,Funke, D.: Content-based image-recognition on printed broadside ballads:The Bodleian libraries’ ImageMatch tool. In: IFLA World Library and In-formation Congress (2013)
[5] Blayney, P.: The Stationers’ Company and the Printers of London, 1501-1557 (2013)
[6] British Library on Flickr: http://www.flickr.com/photos/britishlibrary/[7] British Printed Images to 1700: A digital library of prints and book illustra-
tions from early modern Britain. http://www.bpi1700.org.uk/index.html/[8] Delhumeau, J., Gosselin, P.H., Jegou, H., Perez, P.: Revisiting the VLAD
image representation. In: Proc. ACMM (2013)[9] Douze, M., Jegou, H., Sandhawalia, H., Amsaleg, L., Schmid, C.: Evaluation
of GIST descriptors for web-scale image search. In: Proc. CIVR (2009)[10] Fischler, M.A., Bolles, R.C.: Random sample consensus: A paradigm for
model fitting with applications to image analysis and automated cartogra-phy. Comm. ACM 24(6), 381–395 (1981)
[11] Franklin, A.: The art of illustration in Bodleian Broadside Ballads before1820. Bodleian Library Record 17(5) (2002)
[12] Hedges, B.: A method for dating early books and prints using image anal-ysis. In: The Royal Society (2006)
[13] Hedges, B.: Wormholes record species history in space and time. Biologyletters 9(1), 20120926 (2013)
[14] Iconclass: http://www.iconclass.nl/[15] Jegou, H., Chum, O.: Negative evidences and co-occurrences in image re-
trieval: the benefit of PCA and whitening. In: Proc. ECCV (2012)[16] Jegou, H., Douze, M., Schmid, C.: Product quantization for nearest neighbor
search. IEEE PAMI (2011)[17] Jegou, H., Douze, M., Schmid, C., Perez, P.: Aggregating local descriptors
into a compact image representation. In: Proc. CVPR (2010)[18] Jegou, H., Perronnin, F., Douze, M., Sanchez, J., Perez, P., Schmid, C.: Ag-
gregating local images descriptors into compact codes. IEEE PAMI (2012)[19] Lowe, D.: Distinctive image features from scale-invariant keypoints. IJCV
60(2), 91–110 (2004)[20] Mikolajczyk, K., Schmid, C.: Scale & affine invariant interest point detec-
tors. IJCV 1(60), 63–86 (2004)[21] Monroy, A., Bell, P., Ommer, B.: Shaping art with art: Morphological anal-
ysis for investigating artistic reproductions. In: Proceedings of the Interna-tional Conference on Multimedia (2012)

16 J. S. Chung, R. Arandjelovic, G. Bergel, A. Franklin, and A. Zisserman
[22] Monroy, A., Carqu, B., Ommer, B.: Reconstructing the drawing processof reproductions from medieval images. In: Macq, B., Schelkens, P. (eds.)ICIP. pp. 2917–2920. IEEE (2011)
[23] Muja, M., Lowe, D.G.: Fast approximate nearest neighbors with automaticalgorithmic configuration. In: Proc. VISAPP (2009)
[24] Oliva, A., Torralba, A.: Modeling the shape of the scene: a holistic repre-sentation of the spatial envelope. IJCV (2001)
[25] Philbin, J., Chum, O., Isard, M., Sivic, J., Zisserman, A.: Object retrievalwith large vocabularies and fast spatial matching. In: Proc. CVPR (2007)


