Re-Evaluation of Approved Sealers Applications on...
27
Research Penetrating Sealers Evaluation on Portland Cement Concrete with Supplemental Cementitious Materials Principle Investigators Lieska Halsey Assistant Concrete Engineer Bob Seger Research Chemist II Investigation Collaborators Wally Heyen NDOR-PCC Engineer
Transcript of Re-Evaluation of Approved Sealers Applications on...

Research
Penetrating Sealers Evaluation on Portland Cement Concrete with Supplemental
Cementitious Materials
Principle Investigators
Lieska Halsey Assistant Concrete Engineer
Bob Seger Research Chemist II
Investigation Collaborators
Wally Heyen NDOR-PCC Engineer

1 | P a g e
Contents Tables ............................................................................................................................................................ 2
Figures .......................................................................................................................................................... 2
Acknowledgments ......................................................................................................................................... 3
Abstract ......................................................................................................................................................... 4
Background ................................................................................................................................................... 5
Objectives...................................................................................................................................................... 5
Testing Plan .................................................................................................................................................. 5
Products ........................................................................................................................................................ 6
Lab Evaluation .............................................................................................................................................. 6
Drying Time ................................................................................................................................................ 6
Laboratory Drying Time .......................................................................................................................... 8
Laboratory Reapplication Drying Time ................................................................................................... 9
Field Evaluation ........................................................................................................................................... 10
Field Drying Time.................................................................................................................................. 11
Skid Resistance ....................................................................................................................................... 12
Wet Sealer Testing ............................................................................................................................... 14
Wet Testing ........................................................................................................................................... 16
Depth of Penetration ................................................................................................................................ 17
Field Depth of Penetration .................................................................................................................... 19
Field Dye Testing Follow-up ................................................................................................................. 20
Wet & Dry Testing................................................................................................................................. 22
Conclusions ................................................................................................................................................. 24
Implementation ............................................................................................................................................ 25
Future Evaluations ...................................................................................................................................... 26
References .................................................................................................................................................. 26

2 | P a g e
Tables
Table 1 Testing Plan ..................................................................................................................................... 5 Table 2 Sealers on the APL .......................................................................................................................... 6 Table 3 Sealers Not on the APL ................................................................................................................... 6 Table 4 Sealer Field Order .......................................................................................................................... 10 Table 5 Skid Resistance Test Runs ............................................................................................................ 12 Table 6 Wet & Dry Testing Results after 3 months ..................................................................................... 23
Figures Figure 1 Concrete Blocks for Laboratory Testing ......................................................................................... 7 Figure 2 Handheld Sprayer for Sealer Application to Blocks ........................................................................ 7 Figure 3 Cold Chamber for Laboratory Testing ............................................................................................ 7 Figure 4 Hot Chamber for Laboratory Testing .............................................................................................. 7 Figure 5 Contrast of a Wet & Dry Concrete Block ........................................................................................ 8 Figure 6 Results of the Laboratory Application Drying Time ........................................................................ 8 Figure 7 Results of the Laboratory Reapplication Drying Time .................................................................... 9 Figure 8 Relationship between the Drying times of the Initial Application and the Reapplication ................ 9 Figure 9 Field Testing Location ................................................................................................................... 10 Figure 10 Sealer Application with Handheld Sprayers ............................................................................... 10 Figure 11 Results of the Field Application Drying Time .............................................................................. 11 Figure 12 Relationship between the Laboratory and Field Drying Time ..................................................... 11 Figure 13 Determining of Skid Resistance with a locked wheel skid tester ................................................ 13 Figure 14 Control and Wet Sealer Dry Test ................................................................................................ 14 Figure 15 Control and Wet Sealer - Dry Skid Resistance Test................................................................... 14 Figure 16 Control and Sealer Dry Test ....................................................................................................... 15 Figure 17 Control and Dry Sealer - Dry Skid Resistance Test ................................................................... 15 Figure 18 Control and Dry Sealer - Wet Test .............................................................................................. 16 Figure 19 Control and Dry Sealer- Wet Skid Resistance Test .................................................................... 16 Figure 20 Contrast of a Deep and Shallow Water Repulsive Layer ........................................................... 18 Figure 21 Depth of Penetration in Hot Chamber Laboratory Blocks........................................................... 18 Figure 22 Contrast of a Good and Poor Depth of Pentration in a Split Core by the Visual Method ........... 19 Figure 23 Depth of Penetration in Field Cores............................................................................................ 19 Figure 24 Contrast of a Protected and Unprotected Split Core by the Dye Method ................................... 20 Figure 25 Contrast of a Protected and Unprotected Core Surface by the Dye Method ............................. 20 Figure 26 Depth of Penetration in the Laboratory Blocks and Field Cores ................................................ 21 Figure 27 Drying Time and Depth of Penetration in Field Cores ................................................................ 21 Figure 28 Sealer Application to Concrete Cores Using a Handheld Sprayer ............................................. 22 Figure 29 Untreated Control Core After the Wet & Dry Test ...................................................................... 22 Figure 30 Sealer Treated Core After the Wet & Dry Test ........................................................................... 22

3 | P a g e
Acknowledgments
The research team would like to thank Dallas Hayes, NDOR Maintenance, for his input and concerns about sealer application practices that allowed the research team to design this investigation.
Thanks to Wally Heyen for his guidance and recommendations for the research project.
The research team thanks Joshua Borzekofski and Richard Edwards for applying the penetrating sealers at the Wahoo Bypass.
Thanks to Jeremy Weigel for operating the locked wheel skid tester on multiple days.
Thanks to Tim Krason and his team for making, treating and splitting the concrete blocks for the laboratory testing, as well as splitting the cores for the field-testing. Thanks to Tom Gernert, Joshua Borzekofski, and Chris Albers for their help during the application of sealers to the concrete blocks.
Thanks to the coring crew for collecting cores from the Wahoo Bypass.
Thanks to Jasmine Dondlinger for providing the research team use of the Chemistry laboratory and materials during dye testing of the field cores.
Thanks to Wahoo Maintenance personnel for providing a safe working environment at the Wahoo Bypass by redirecting traffic and providing advanced warning of the work in progress.
The research team would like to extend their appreciation to all suppliers participating in this research investigation and for their contributions of materials used in this investigation.
4 | P a g e
Abstract
The Approved Product List (APL) is a list of products that are prequalified for use on Nebraska Department of Roads Construction and Maintenance projects. Products included in this list are required to meet certain specifications before they are accepted. This investigation concerns penetrating sealers for pavements and structures, which are liquid products that penetrate into hardened concrete pavements forming a water-repelling barrier. This barrier prevents the deleterious effects associated with the ingress of water and waterborne contaminates.
As a follow-up to the investigation “Field Performance of Sealers for Portland Cement Concrete Pavements (PCCP),” this investigation looks to address concerns regarding the application and acceptance of concrete sealers. The first concern was the drying time for sealers, and how temperature, humidity, and the addition of supplemental cementitious materials (SCM) may affect it. The second concern was the slickness of the concrete surface following the application of a sealer. The third concern was to re-evaluate the approved sealers and the process for approving sealers for the APL.
The objective of this investigation was to evaluate the effects of humidity, temperature, and SCMs on the drying time of penetrating sealers for pavements, evaluate the effects sealer application has on skid resistance, and to re-evaluate sealer acceptability for the APL.
This investigation measured drying time in laboratory environmental chambers that varied humidity and temperature, and in a field setting on an SCM containing pavement. Laboratory testing found that humidity and temperature had minimal effects on sealer drying time, while drying time field-testing of SCM containing pavements found an increase in drying time.
Evaluations of the skid resistance of sealer-treated pavements found that there were no long-term negative effects, but there was a significant reduction if the sealer had not dried. it was concluded that sealers that had drying times faster than one hour would be acceptable for state forces, and sealers with drying times slower than one hour would only be acceptable if the lanes to be treated were closed from traffic until the sealer was dry.
The research completed the re-evaluation of sealers for the APL on concrete cores from sealer-treated test sections. Depth-of-penetration analysis found that sealers should be required to have a depth of penetration greater than 1/16
th of an inch. Wet & Dry testing of cores completely treated with sealers
found that after three months, the untreated control core showed cracking due to ASR, while most treated cores did not showed any sign of deterioration due to cracking. Sealers added to the APL should not show any cracking after three months by this same method.
Sealers will be required to have a depth of penetration greater than 1/16th of an inch, no cracking of
treated cores after three months in the NDOR Wet & Dry test, and the drying time assessed as fast or slow drying.
5 | P a g e
Background
The Approved Product List (APL) is a list of products that are prequalified for use on Nebraska Department of Roads Construction and Maintenance projects. Products included in this list are required to meet certain specifications before they are accepted. This investigation concerns penetrating sealers for pavements, which are liquid products that penetrate into hardened concrete pavements forming a water-repelling barrier. This barrier prevents the deleterious effects associated with the ingress of water and waterborne contaminates.
As a follow-up to the investigation “Field Performance of Sealers for Portland Cement Concrete Pavements (PCCP),” this investigation looks to address concerns regarding the application and acceptance of concrete sealers. The first concern was the drying time for sealers, and how temperature, humidity, and the addition of supplemental cementitious materials (SCM) may affect it. The second concern was about the slickness of pavement following the application of a sealer. The third concern was to re-evaluate the approved sealers and the process for approving sealers to the APL.
Objectives
The objective of this investigation was to evaluate the effects of humidity, temperature, and SCMs on the drying time of penetrating sealers for pavements, evaluate the effects sealer application has on skid resistance, and to re-evaluate sealer acceptability for the APL.
Testing Plan
To meet the objectives of this investigation, the Department completed the following tests:
Table 1 Testing Plan
Location Test Description
Laboratory Drying Time
The research team treated the surfaces of concrete blocks with sealers. The drying time was measured in a high temperature/ low humidity chamber and in a low temperature/ high humidity chamber.
Field Drying Time The research team measured the drying time of sealer-treated pavement sections.
Field Skid Resistance The Department tested the sealers to evaluate the skid resistance of a pavement after the pavement was treated with sealers. The skid resistance was measured in accordance with ASTM E 274-06.
Laboratory Depth of Penetration The research team measured the depth of penetration of concrete blocks treated with penetrating sealer.
Field Depth of Penetration The research team collected cores from the sealer-treated pavement sections, and then split the cores to see the depth of penetration.

6 | P a g e
Products
There are five sealers currently on the APL and six sealers that are currently not on the APL, shown in Tables 2 and Table 3.
Table 2 Sealers on the APL
Product Active Ingredient Percent
Sealer 1 Silane 100%
Sealer 2 Alkyltrialkoxysilane 40%
Sealer 3 Silane 100%
Sealer 4 Alkyltrialkoxysilane 100%
Sealer 5 Isobutyltrialkoxysilane >50%
Table 3 Sealers not on the APL
Product Active Ingredient Percent
Sealer 6 Alkyltrialkoxysilane >40%
Sealer 7 Alkyltrialkoxysilane >40%
Sealer 8 Alkyltrialkoxysilane 100%
Sealer 9 Isobutylalkoxysilane 100%
Sealer 10 Silane NA
Sealer 11 Hygroscopic Crystals NA
Lab Evaluation
Drying Time
To address the first concern about the duration of drying time for sealers, and how it may be affected by temperature, humidity, and the addition of supplemental cementitious materials (SCM), three testing phases were completed.
The first phase was in a laboratory setting with 28-day-old premade concrete blocks that were treated with the sealers, placed into two temperature-and-humidity-controlled chambers, then timed as to how long it would take each sealer to dry. Maintaining one of the chambers at low temperature/high humidity and the other at high temperature/low humidity would determine whether temperature and humidity have a significant effect on drying time.
The team hypothesized that the low temperature and high humidity would be the figurative “worst case scenario” for sealer application because temperature is directly related to evaporation and diffusion, while humidity is directly related to the water saturation of the concrete, which would repel the sealer. The thinking was that water saturated blocks would prevent penetration of sealer into the concrete. The team hypothesized that the high temperature and low humidity would be the figurative “best case scenario” for the opposite reasons previously listed.
The low temperature and high humidity chamber would be similar to an application on a spring morning and the high temperature and low humidity chamber would be similar to a summer afternoon.
The results of the laboratory drying time testing were used to determine the sealer application order of the field-test sections. This allowed sufficient time for the sealer to be applied and dried within the same day; sealers were applied in order of slowest to fastest drying.
The second phase was a reapplication of the same sealers to the same blocks to measure the drying time to see if the drying time changed due to being previously sealed.

7 | P a g e
Concrete Blocks
Concrete blocks were made for the laboratory testing using typical 47B concrete mix design. Each block was 6x12 inches on the surface. All of the blocks cured for 14 days then dried for 14 days. Due to complications, testing was unable to begin for a month after the block dried. The blocks that were treated are shown in Figure 1.
Figure 1 Concrete Blocks for
Laboratory Testing
Sealer Application
The sealers were applied to the concrete block surfaces using a handheld sprayer. All sealers were applied at the minimum application rate, according to each manufacturer’s specifications. Between each application, the sprayer was cleaned with 100% ethanol to remove any residual sealer left in the reservoir or nozzle. The handheld sprayer used is shown in Figure 2.
Figure 2 Handheld Sprayer for Sealer Application to Blocks
Environmental Chambers
Two chambers were used to create two extreme environmental conditions for the laboratory testing of blocks. The chambers have the capability of maintaining set temperatures and humidity. The first chamber was set to 50°F with 90% humidity, referred to as the “Cold Chamber” shown in Figure 3. The second chamber was set to 90°F with 50% humidity, referred to as the “Hot Chamber” shown in Figure 4.
Figure 3 Cold Chamber for Laboratory Testing
Figure 4 Hot Chamber for Laboratory Testing

8 | P a g e
Laboratory Drying Time
Each sealer was applied to two concrete blocks. A block of each sealer was then placed into a cold and a hot environmental chamber. The blocks were observed to determine the length of time it would take the surfaces to dry. Dryness was assessed every 15 minutes by pressing white matte printer paper to the surfaces of the block without liquid pick up. There was an insufficient number of blocks for testing; as a result, Sealer 11 was not tested for drying time in the laboratory.
During testing, it was observed that the wet and dry surfaces were visually different. This can be seen by the contrast of the wet and dry concrete block of Sealer 5 shown in Figure 5. The results of the drying-time testing are shown in Figure 6.
Figure 5 Contrast of a Wet and Dry Concrete Block
Figure 6 Results of the Laboratory Application Drying Time
This test found that all blocks were dry in less than three hours regardless of the humidity or temperature. This test also found that the blocks in the cold chamber had drying times shorter than or equal to the drying times of the blocks in the hot chamber. This was unexpected and opposite of the initial hypotheses of worst and best case scenarios. The research team had a number of proposed reasons as to why the cold chamber blocks dried faster, but since the differences in drying times were minimal for most of the sealers it was not explored further.
The sealers that dried quickly, in an hour or less, were Sealers 3, 4, 5, 6, 7, 9, and 10. The sealers that dried slowly, in two hours or more, were Sealers 1, 2, and 8.
1. The sealed blocks consistently dried faster in the cold chamber than the hot chamber for each sealer treatment.
2. The difference in drying time was small for most of the sealers, leading to the conclusion that temperature and humidity have minimal effects on drying time.
0.0
1.0
2.0
3.0
4.0
Sealer1
Sealer2
Sealer3
Sealer4
Sealer5
Sealer6
Sealer7
Sealer8
Sealer9
Sealer10
Ho
urs
Drying Time of the Reapplication in the Cold Chamber
Drying Time of the Reapplication in the Hot Chamber

9 | P a g e
Laboratory Reapplication Drying Time
As an additional analysis, drying time was tested a second time on the same blocks. The purpose of this reapplication was to assess if previous applications of sealers would hinder the drying time of future applications of sealers. The concern was that past sealers would prevent the penetration of future sealers.
For this test, one-half of each core from the first drying-time test had the same sealer applied at the same rate. Each block was then placed into the same chamber and the drying time was measured again. The results can be viewed in Figure 7.
Figure 7 Results of the Laboratory Reapplication Drying Time
A comparison of the laboratory drying-time tests is shown in Figure 8. All the results together provided three relationships of note.
Figure 8 Relationship between the Drying Times of the Initial Application and the Reapplication
1. The drying times in the cold chamber were less than the corresponding application in the hot chamber.
2. The drying times for the initial application were greater than the corresponding reapplication chamber.
3. There were only small differences in drying times between the initial application and reapplication, leading to the conclusion that the reapplication of a sealer was not hindered by previous applications of the same sealer.
0.0
0.5
1.0
1.5
2.0
2.5
3.0
3.5
4.0
Sealer 1 Sealer 2 Sealer 3 Sealer 4 Sealer 5 Sealer 6 Sealer 7 Sealer 8 Sealer 9 Sealer 10
Ho
urs
Drying Time of the Reapplication in the Cold ChamberDrying Time of the Reapplication in the Hot Chamber
0
1
2
3
4
Sealer1
Sealer2
Sealer3
Sealer4
Sealer5
Sealer6
Sealer7
Sealer8
Sealer9
Sealer10
Ho
urs
Drying Time of the Initial Application in the Cold ChamberDrying Time of the Initial Application in the Hot ChamberDrying Time of the Reapplication in the Cold Chamber

10 | P a g e
Field Evaluation
Sealer Application Field Order The laboratory drying time testing was of significant importance in that the results were needed to determine the order in which the sealers should be applied in the field. It was important that the application and testing of skid resistance be completed within a one-day period. By applying the slowest drying sealers first, there would be sufficient time for the sealers to dry. The order of sealer application is shown in Table 4.
All field-testing was completed in one day to minimize the duration of lane closures of the test sections and the reallocation of employees and resources. It was also important in reducing variables between test sections.
Table 4 Sealer Field Order
Sealer Order
Sealer 2 1 Sealer 1 2 Sealer 8 3 Sealer 7 4 Sealer 5 5 Sealer 4 6 Sealer 3 7 Sealer 10 8 Sealer 6 9 Sealer 9 10 Sealer 11 11
Location
For the field investigation it was decided that testing would be completed near Wahoo, NE on US 77-US 92 (Co Rd M), shown in Figure 9. This location was chosen because it was recently completed, is multilane and the concrete contained SCMs.
Being recently completed meant that the concrete should be in good condition and without significant variables that an older highway may have, such as oil and cracks.
Having multiple lanes allowed the research team to close the outside lane without disrupting traffic significantly.
Containing SCMs was the most important of the criteria as this was required to address the third concern of this investigation: whether SCM-containing cement reduces sealer penetration.
Throughout the day of Monday, September 16, 2016, the sealers were applied to test sections on US 77. The test sections started south of the intersection of US 77 and Hwy 17 and ended north of the intersection of US 77 and Hwy 92.
Figure 9 Field Testing Location
(Google, 2016)
Sealer Application
There were 11 sealed sections total, one for each sealer. Section lengths were 10 panels (150 ft). In order to meet the specified section length with the small quantity of sealer the department had, all sealers were applied to the inside half of the outside lane travelling west and south bound. Five untreated panels separated each section.
The temperature in the morning was around 70°F and increased to 80°F by noon. The humidity in the morning was around 90% and decreased to 60% by noon. The temperature of the concrete surface was 40˚ F or higher during application.
Sealers were applied with handheld sprayers at the minimum application rate recommended by each manufacturer. The application can be seen in Figure 10.
Figure 10 Sealer Application with Handheld
Sprayers
11 | P a g e
Field Drying Time
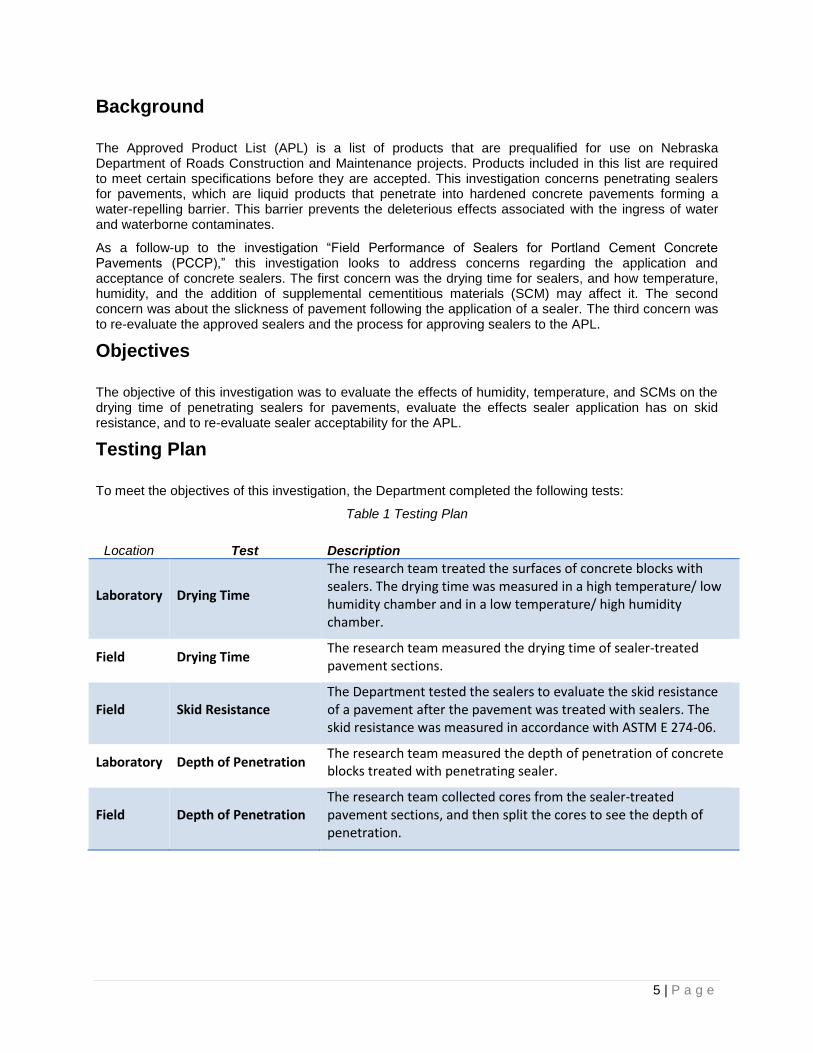
As each sealer was applied, the drying time was recorded. Dryness was assessed the same as it was done for the laboratory blocks by the pressing of white matte printer paper with no pick up. The dryness of each application was also easily observed visually; the drying time results are shown in Figure 11.
Figure 11 Results of the Field Application Drying Time
The drying time for the sealers varied greatly. Sealers 4, 5, 6, 7, 9, and 11 dried quickly, in an hour or less. Sealers 1, 3, 8 and 10 dried slowly, in two hours or more. Sealer 1 was still somewhat wet even after 7 hours.
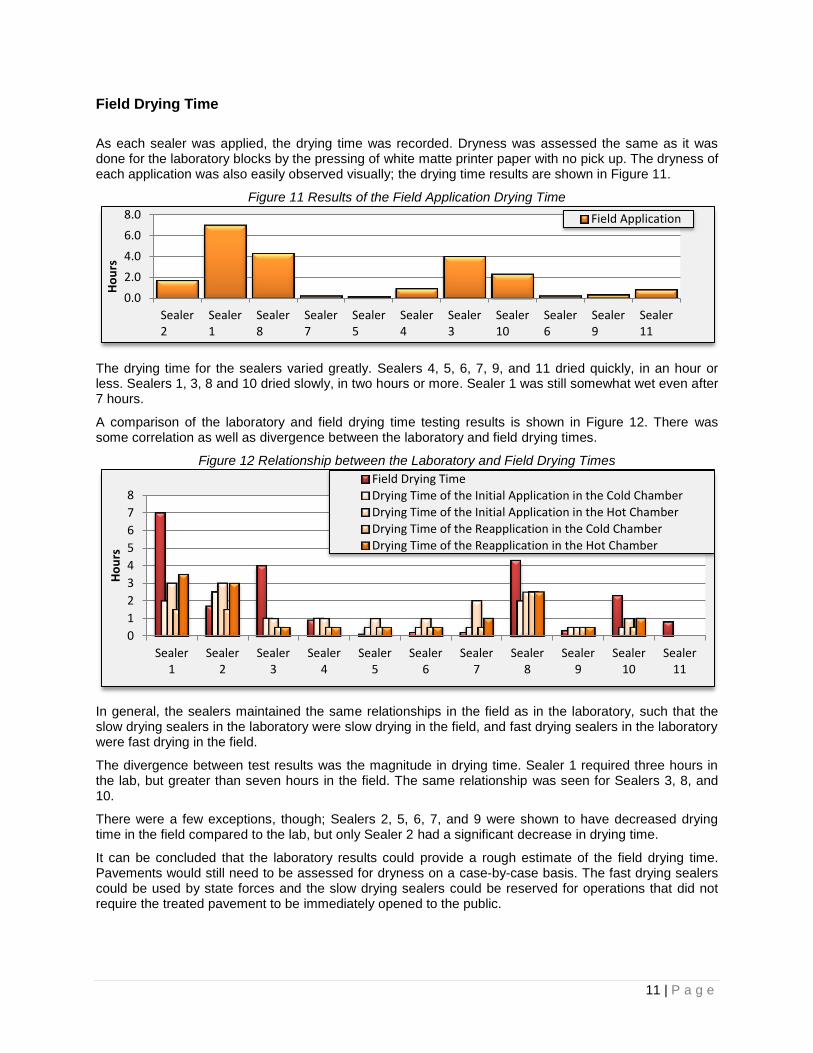
A comparison of the laboratory and field drying time testing results is shown in Figure 12. There was some correlation as well as divergence between the laboratory and field drying times.
Figure 12 Relationship between the Laboratory and Field Drying Times
In general, the sealers maintained the same relationships in the field as in the laboratory, such that the slow drying sealers in the laboratory were slow drying in the field, and fast drying sealers in the laboratory were fast drying in the field.
The divergence between test results was the magnitude in drying time. Sealer 1 required three hours in the lab, but greater than seven hours in the field. The same relationship was seen for Sealers 3, 8, and 10.
There were a few exceptions, though; Sealers 2, 5, 6, 7, and 9 were shown to have decreased drying time in the field compared to the lab, but only Sealer 2 had a significant decrease in drying time.
It can be concluded that the laboratory results could provide a rough estimate of the field drying time. Pavements would still need to be assessed for dryness on a case-by-case basis. The fast drying sealers could be used by state forces and the slow drying sealers could be reserved for operations that did not require the treated pavement to be immediately opened to the public.
0.0
2.0
4.0
6.0
8.0
Sealer2
Sealer1
Sealer8
Sealer7
Sealer5
Sealer4
Sealer3
Sealer10
Sealer6
Sealer9
Sealer11
Ho
urs
Field Application
0
1
2
3
4
5
6
7
8
Sealer1
Sealer2
Sealer3
Sealer4
Sealer5
Sealer6
Sealer7
Sealer8
Sealer9
Sealer10
Sealer11
Ho
urs
Field Drying Time
Drying Time of the Initial Application in the Cold Chamber
Drying Time of the Initial Application in the Hot Chamber
Drying Time of the Reapplication in the Cold Chamber
Drying Time of the Reapplication in the Hot Chamber

12 | P a g e
Skid Resistance
The second concern is the low coefficient of friction of a pavement following the application of a sealer; the research team measured the skid resistance of pavement with where sealers were applied.
The idea was to apply the sealers to concrete sections and then immediately measure the skid resistance using a locked-wheel skid tester. By measuring the skid resistance immediately after application the research team could determine whether the skid resistance was reduced enough to be a concern.
The locked-wheel skid tester measures skid resistance and is measured as a skid number (SN) value, with zero being no resistance and resistance increasing directly with the increase in skid number. NDOR skid resistance tests are conducted with a ribbed tire. For this investigation, a skid number of 32 will be the baseline skid number to assess whether the roadway texture has been negatively imparted.
To have a better understanding about how sealers affect skid resistance, the research also included some additional measurements of the test sections under differing conditions. For the locked-wheel skid tester there is the option to do the test dry or wet. For a dry measurement, the test was completed without applying water to the pavement surface in front of the locking tire as a lubricant. For a wet measurement, the test was completed by applying water to the pavement surface in front of the locking tire as a lubricant. Typically, the wet pavements have the lowest skid resistance.
The research team decided that there were three scenarios where the skid resistance of the pavement could be negatively impacted by sealer application:
1. The reduction in skid resistance after sealer application when the pavement is dry.
2. The reduction in skid resistance after sealer application when the pavement is wet.
3. The reduction in skid resistance when there is wet sealer on the pavement.
To account for these three scenarios the research team measured the skid resistance for each test section under the six conditions shown in Table 5.
Table 5 Skid Resistance Test Runs
Test Order
Condition of Pavement with/without Sealer
Lubricant Description
1 Control Dry Resistance of dry pavement before sealer application.
2 Control Wet Resistance of wet pavement before sealer application.
3 Wet Dry Resistance of pavement immediately after sealer application.
4 Dry Dry Resistance of dry pavement after the sealer application dried.
5 Dry Wet Resistance of wet pavement after the sealer application dried.
6 Dry Wet Resistance of wet pavement one week after sealer application.
13 | P a g e
Skid Resistance Measurement
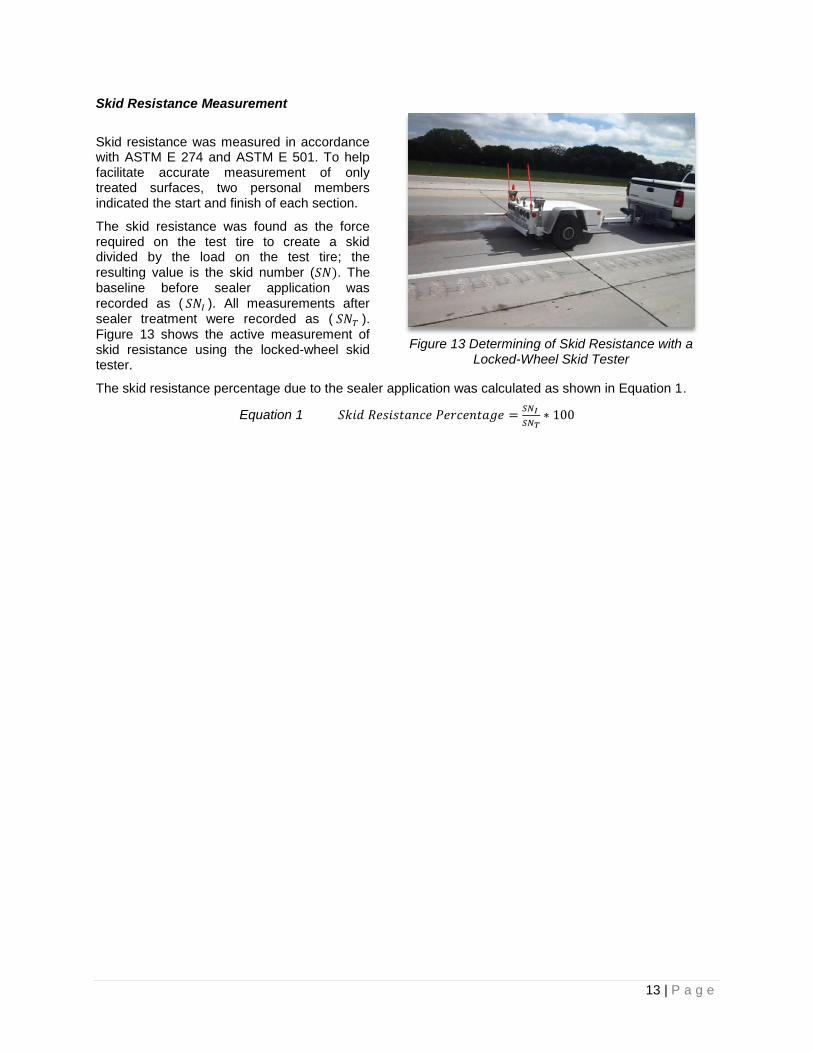
Skid resistance was measured in accordance with ASTM E 274 and ASTM E 501. To help facilitate accurate measurement of only treated surfaces, two personal members indicated the start and finish of each section.
The skid resistance was found as the force required on the test tire to create a skid divided by the load on the test tire; the resulting value is the skid number (𝑆𝑁). The baseline before sealer application was recorded as ( 𝑆𝑁𝐼 ). All measurements after sealer treatment were recorded as ( 𝑆𝑁𝑇 ). Figure 13 shows the active measurement of skid resistance using the locked-wheel skid tester.
Figure 13 Determining of Skid Resistance with a
Locked-Wheel Skid Tester
The skid resistance percentage due to the sealer application was calculated as shown in Equation 1.
Equation 1 𝑆𝑘𝑖𝑑 𝑅𝑒𝑠𝑖𝑠𝑡𝑎𝑛𝑐𝑒 𝑃𝑒𝑟𝑐𝑒𝑛𝑡𝑎𝑔𝑒 =𝑆𝑁𝐼
𝑆𝑁𝑇∗ 100

14 | P a g e
Wet Sealer Testing
To see if skid resistance was reduced when there is wet sealer on the pavement, the research team tested without water immediately after the sealer was applied. The control section was conducted with a wet locked-wheel skid test prior to the application of the sealers. The results are shown in Figure 14.
Figure 14 Control and Wet Sealer Dry Test
The SN results of the “Control Wet Test” varied from 51 to 44. The SN results of the “Wet Sealer Dry Test” varied from 76 to 27.
Sealers 5, 6, 7, 9, and 11 had SN values well above the control values; these sealers also dried quickly, which leads the team to believe that the highest values are probably due to the sealer being mostly dry by the time testing was completed.
Sealers 1, 4, 8, and 10 had SN values below the baseline SN value of 32. Below 32 there can be an increased risk for a skid. These sealers were also slow-drying sealers. There appears to be a strong correlation between drying time and skid resistance immediately after application. The skid resistance percentage is shown in Figure 15.
Figure 15 Control and Wet Sealer - Dry Skid Resistance Test
Highlighted in red are the sealers that had significant reductions in skid resistance: Sealers 1, 3, 4, 8, and 10.
01020304050607080
Sealer2
Sealer1
Sealer8
Sealer7
Sealer5
Sealer4
Sealer3
Sealer10
Sealer6
Sealer9
Sealer11
Skid
Nu
mb
er
ControlWet Test
Wet SealerDry Test
0.00%
50.00%
100.00%
150.00%
200.00%
Sealer2
Sealer1
Sealer8
Sealer7
Sealer5
Sealer4
Sealer3
Sealer10
Sealer6
Sealer9
Sealer11
Skid
Nu
mb
er

15 | P a g e
Dry Testing
Dry-skid resistance results were measured for each test section by not applying water during the skid, the control values were collected prior to sealer application. The comparison test values were collected after sealer application when the sealer had fully dried and is shown in Figure 16.
Figure 16 Control and Sealer Dry Test
The control skid results varied from SN 85 to 70. The results of the “wet” skid resistance testing results varied in SN from 85 to 75. All values were well above SN value of 32. The skid resistance percentage is shown in Figure 17.
Figure 17 Control and Dry Sealer - Dry Skid Resistance Test
Under dry conditions, there was no significant reduction in skid resistance between treated and untreated pavements. The percent change in skid resistance remained near 100% for all sections.
It is, therefore, safe to conclude that the skid resistance is not reduced by sealer application when the pavement is dry.
60
65
70
75
80
85
90
Sealer2
Sealer1
Sealer8
Sealer7
Sealer5
Sealer4
Sealer3
Sealer10
Sealer6
Sealer9
Sealer11
Skid
Nu
mb
er
ControlDry Test
Dry SealerDry Test
0%
20%
40%
60%
80%
100%
120%
140%
Sealer2
Sealer1
Sealer8
Sealer7
Sealer5
Sealer4
Sealer3
Sealer10
Sealer6
Sealer9
Sealer11
PercentDifference

16 | P a g e
Wet Testing Skid resistance was measured for each test section by using the water during the skid. The control values were collected before sealer application. The test values were collected after sealer application when the sealer had fully dried. The results are shown in Figure 18.
Figure 18 Control and Dry Sealer - Wet Test
The results of the “Control Wet Test” varied in SN from 51 to 44. The results of the “Dry Sealer Wet Test” varied in SN from 50 to 31. The results of the “Follow Up Wet Test” varied in SN from 53 to 40. All values were above a SN value of 32.
The value of 31 for Sealer 11 was the only one for concern, but the SN increased back up to 40 one week later, so this seemed to be either an experimental variance or an artifact of Sealer 11 itself. The skid resistance percentage is shown in Figure 19.
Figure 19 Control and Dry Sealer- Wet Skid Resistance Test
Under wet conditions, there was no significant reduction in skid resistance one week after the sealer application. However, there was some significant reduction in skid resistance the same day of testing. Sealers 1 and 11 had SN values at 72% and 75%, highlighted in red in Figure 19. Sealer 1 can probably be explained as being due to the sealer not being fully dry that day of testing, while Sealer 11 can probably be explained as being due to the nature of the active ingredient. Sealer 11 uses hygroscopic crystals to prevent the ingress of water; it is speculated that this may have caused the reduction in SN.
Since all test sections had SN values one week after application similar to the control values, the team concludes that the skid resistance is not reduced by sealer application.
0
10
20
30
40
50
60
Sealer2
Sealer1
Sealer8
Sealer7
Sealer5
Sealer4
Sealer3
Sealer10
Sealer6
Sealer9
Sealer11
Skid
Nu
mb
er
ControlWet Test
Dry SealerWet Test
Follow UpWet Test
0.00%
20.00%
40.00%
60.00%
80.00%
100.00%
120.00%
Sealer2
Sealer1
Sealer8
Sealer7
Sealer5
Sealer4
Sealer3
Sealer10
Sealer6
Sealer9
Sealer11
Skid
Nu
mb
er
Dry SealerWet Test
Follow UpWet Test
17 | P a g e
Depth of Penetration The sealers penetrate into the concrete and form a water-repelling barrier. A concrete core or block can be split vertically and the depth of the water-repelling barrier can be assessed. In general, the depth of the water-repelling layer corresponds to the longevity of the sealer application.
To address the third concern about how the sealers penetration would be affected if the concrete contained supplemental cementitious materials (SCM), the research team measured the penetration depth of the sealer in concrete cores collected from the test section after the skid resistance testing. Since the concrete from that location contained SCMs, the concrete cores collected would be indicative of how SCMs affect sealer penetration.
For additional information, the depth of sealer penetration was also measured in the concrete block from the drying time testing.
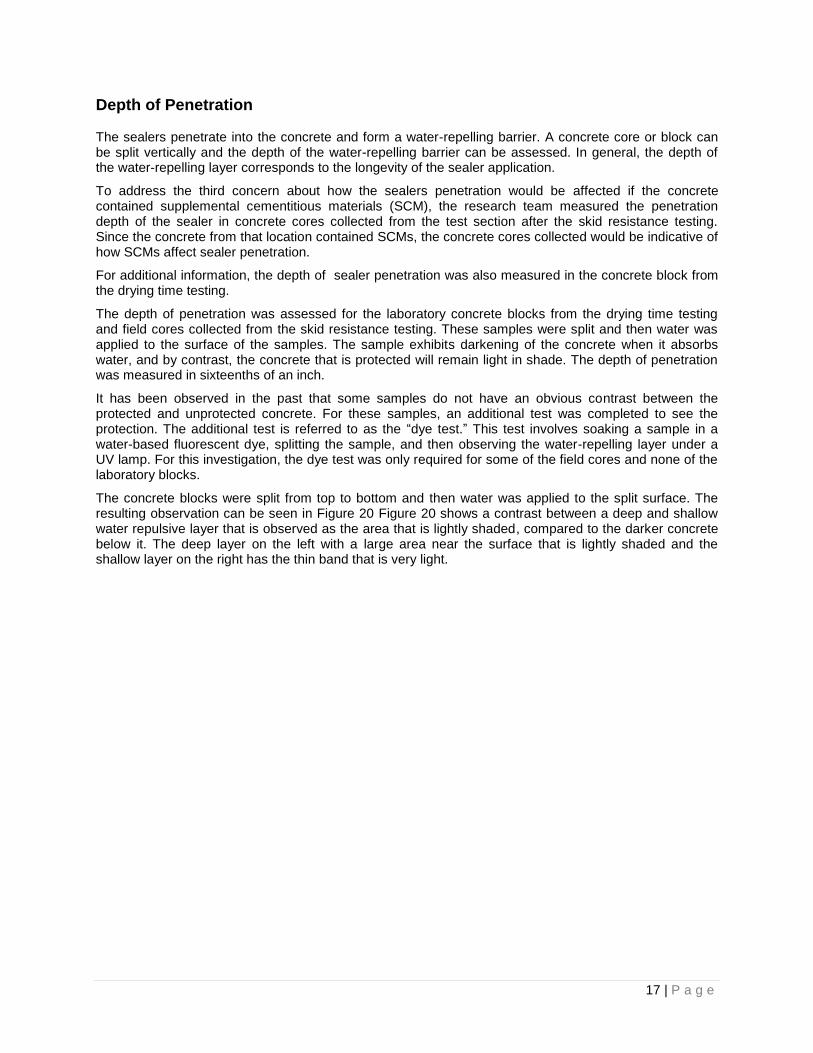
The depth of penetration was assessed for the laboratory concrete blocks from the drying time testing and field cores collected from the skid resistance testing. These samples were split and then water was applied to the surface of the samples. The sample exhibits darkening of the concrete when it absorbs water, and by contrast, the concrete that is protected will remain light in shade. The depth of penetration was measured in sixteenths of an inch.
It has been observed in the past that some samples do not have an obvious contrast between the protected and unprotected concrete. For these samples, an additional test was completed to see the protection. The additional test is referred to as the “dye test.” This test involves soaking a sample in a water-based fluorescent dye, splitting the sample, and then observing the water-repelling layer under a UV lamp. For this investigation, the dye test was only required for some of the field cores and none of the laboratory blocks.
The concrete blocks were split from top to bottom and then water was applied to the split surface. The resulting observation can be seen in Figure 20 Figure 20 shows a contrast between a deep and shallow water repulsive layer that is observed as the area that is lightly shaded, compared to the darker concrete below it. The deep layer on the left with a large area near the surface that is lightly shaded and the shallow layer on the right has the thin band that is very light.

18 | P a g e
Figure 20 Contrast of a Deep and Shallow Water Repulsive Layer
Examination of the laboratory blocks found that all of them had an obvious layer at the surface of the concrete that prevented the penetration of water. The depths of penetration in the hot chamber blocks can be seen in Figure 21. Only the results of the hot chamber block are shown because the cold chamber laboratory blocks tested had penetration depths similar to the hot chamber.
Figure 21 Depth of Penetration in Hot Chamber Laboratory Blocks
This test found that Sealers 1 and 2 were the only ones to have a depth of penetration greater that 1/16th
of an inch.
Dye testing was not necessary for the laboratory blocks, as the sealer protection was visible to the naked eye for all of the sealers tested.
0/16
1/16
2/16
3/16
4/16
Sealer1
Sealer2
Sealer3
Sealer4
Sealer5
Sealer6
Sealer7
Sealer8
Sealer9
Sealer10
Inch
es

19 | P a g e
Field Depth of Penetration Concrete cores were collected from each sealer treatment at the Wahoo Bypass one week after application. The purpose was to examine the depth of penetration in concrete containing SCM and compare the results with the laboratory blocks.
To measure the depth of penetration, the concrete cores were split from the surface down, then water was applied to the split surface. The depth of penetration was then measured as the depth-of-water-repelling layer near the surface of the core.
A contrast between a good and poor depth of penetration can be seen in Figure 22. The good depth of penetration can be seen in the image on the left, while the poor depth of penetration can be seen in the image on the right.
Figure 22 Contrast of a Good and Poor Depth of Penetration in a Split Core by the Visual Method
The results of the depth of penetration in the field core can be seen in Figure 23 below.
Figure 23 Depth of Penetration in Field Cores
Cores from Sealers 1, 5, 4, 3, and 10 were found to have sealer penetration depths greater than 1/16th of
an inch, while Sealers 2, 8, 7, 6, 9, and 11 had sealer penetration depth less than or equal to 1/16th of an
inch.
0/16
1/16
2/16
3/16
4/16
5/16
6/16
7/16
Sealer2
Sealer1
Sealer8
Sealer7
Sealer5
Sealer4
Sealer3
Sealer10
Sealer6
Sealer9
Sealer11
Inch
es
Depth of Penetration in Field Cores Sealers outlined in red had depths less than or equal to 1/16th.

20 | P a g e
Field Dye Testing Follow-up It has been observed in the past that some samples do not have an obvious contrast between the protected and unprotected concrete. For these samples, an additional test was completed to see the protection. The additional test is referred to as the “dye test.” This test involves soaking a sample in a water-based fluorescent dye, splitting the sample, and then observing the water-repelling layer under a UV lamp. For this investigation, the dye test was only required for some of the field cores and none of the laboratory blocks.
Some of the cores from the water application to field cores did not show a water-repelling layer adequately, either a very narrow band, or an inconsistent repelling depth. As a follow-up, five sealers had a dye test method completed. The method involves soaking the cores in a water based fluorescent dye for four days, drying, splitting, and viewing under an ultraviolet light. By using a water-based dye, the areas of concrete that are not protected by the sealer can be highlighted. Figure 24 contrasts cores without and with sealer protection.
Figure 24 Contrast of a Protected and Unprotected Split Core by the Dye Method
The image on the left shows a core that did not prevent the ingress of the water-based dye while the image on the right shows a core that prevented the ingress of the water-based dye at the surface (bottom) of the core.
The dye method found that all five of the sealers tested did show a layer of protection provided by the sealer. Sealers 5, 8, 9, and 10 also protected the surface of the core, while Sealer 11 did not. This was attributed to the differences in sealer technologies, as Sealers 5, 8, 9, and 10 are silane-based and Sealer 11 uses hygroscopic crystals. This contrast can be seen below in Figure 25.
Figure 25 Contrast of a Protected and Unprotected Core Surface by the Dye Method
The core surface in the left image of Figure 25 is protected by the sealer as it is seen to be mostly blue, reflecting the UV light. The core surface in the right image of Figure 25 is not protected by the sealer as it is seen to be mostly yellow, showing the UV light being absorbed by the dye fluorescing yellow.
1. All cores tested showed a protective layer. 2. All cores tested, except Sealer 11, hindered the attachment of the dye to the core surface. 3. The Control core showed no prevention of dye ingress.
Bottom
Top
21 | P a g e
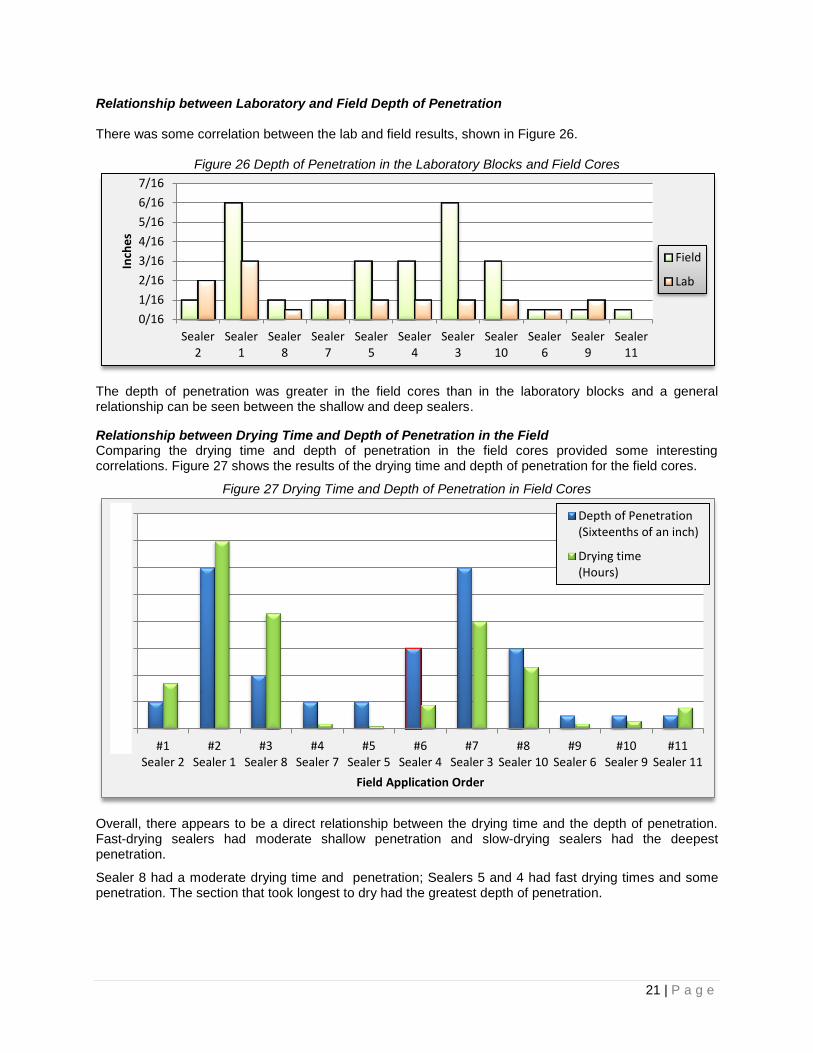
Relationship between Laboratory and Field Depth of Penetration There was some correlation between the lab and field results, shown in Figure 26.
Figure 26 Depth of Penetration in the Laboratory Blocks and Field Cores
The depth of penetration was greater in the field cores than in the laboratory blocks and a general relationship can be seen between the shallow and deep sealers.
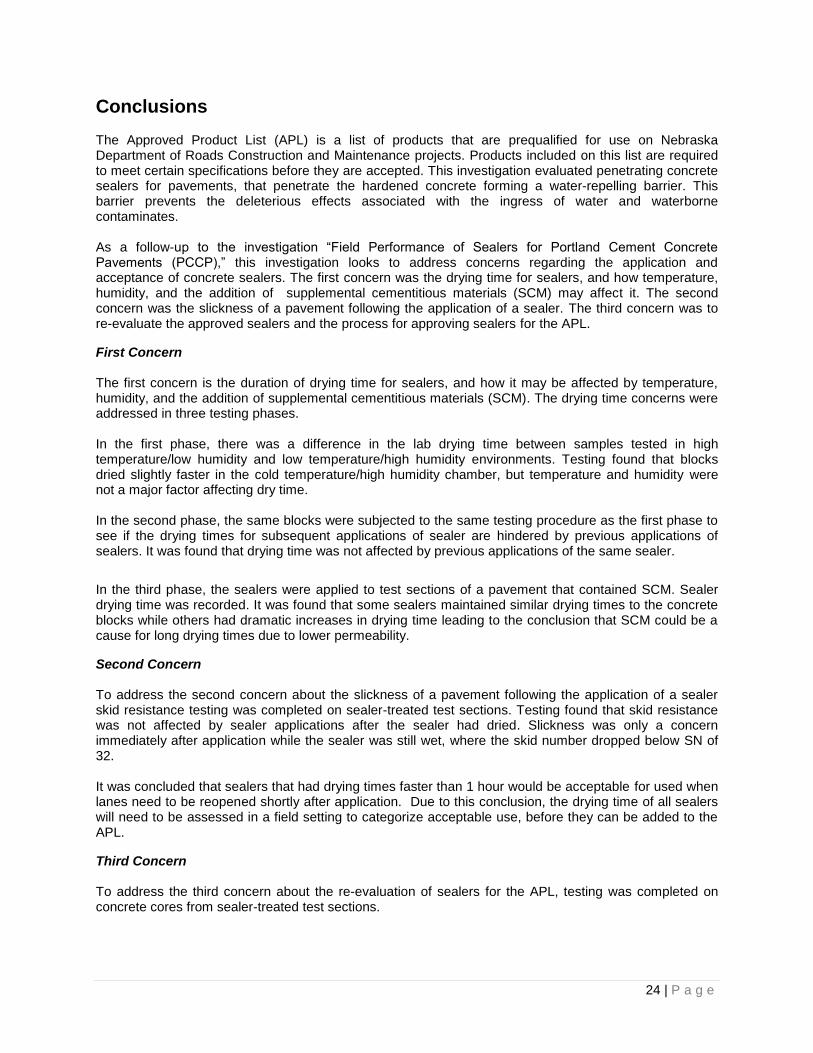
Relationship between Drying Time and Depth of Penetration in the Field Comparing the drying time and depth of penetration in the field cores provided some interesting correlations. Figure 27 shows the results of the drying time and depth of penetration for the field cores.
Figure 27 Drying Time and Depth of Penetration in Field Cores
Overall, there appears to be a direct relationship between the drying time and the depth of penetration. Fast-drying sealers had moderate shallow penetration and slow-drying sealers had the deepest penetration.
Sealer 8 had a moderate drying time and penetration; Sealers 5 and 4 had fast drying times and some penetration. The section that took longest to dry had the greatest depth of penetration.
0/16
1/16
2/16
3/16
4/16
5/16
6/16
7/16
Sealer2
Sealer1
Sealer8
Sealer7
Sealer5
Sealer4
Sealer3
Sealer10
Sealer6
Sealer9
Sealer11
Inch
es
Field
Lab
0
1
2
3
4
5
6
7
8
#1Sealer 2
#2Sealer 1
#3Sealer 8
#4Sealer 7
#5Sealer 5
#6Sealer 4
#7Sealer 3
#8Sealer 10
#9Sealer 6
#10Sealer 9
#11Sealer 11
Field Application Order
Depth of Penetration(Sixteenths of an inch)
Drying time(Hours)

22 | P a g e
Wet & Dry Testing
The research team also investigated the ability of the sealers to protect against aggregate reactivity. Aggregate reactivity is the most variable component for alkali-silica reaction (ASR) in Nebraska. ASR produces a gel that expands by absorbing water, causing fissures and cracks.
The research team wanted to see if the deleterious effects of ASR might be reduced if water is prevented from reaching the gel. The plan was to apply each sealer to the entire surface of an ASR susceptible concrete core, and then expose the cores to moisture according to the NDOR Wet & Dry test. The ASR deleterious effects would be considered reduced if the sealed cores showed less cracking than an untreated control core.
The NDOR Wet & Dry test evaluates the behavior of a mix under heating and cooling environments. It indicates the amount of deterioration that may occur in the field, due to the reactivity of the aggregate.
Twelve ASR susceptible cores were collected from a project. Eleven cores were treated with sealers and one core was untreated as a control. The cores were 4” in diameter and 12” in depth.
Except for the untreated control core 12, each core had sealer applied to the entire surface with a handheld sprayer, as shown in Figure 28. Initially, the research team tried to meet the minimum recommended coverage on the core for Sealer 1. Due to the round shape of the core, the sealer would run off after slightly greater than half of the minimum recommended coverage had been applied. To maintain consistency among cores, the sealers were applied at half of the minimum recommended coverage.
Figure 28 Sealer Application to Concrete Cores
Using a Handheld Sprayer
The cores were allowed to dry for 24 hours, and then placed into the “wet and dry” chamber. The wet and dry apparatus consisted of a test chamber in which test specimens were placed and subjected to total submergence in water for a period of 8 hours and dried in heated air for 16 hours. The chamber temperature
is maintained at around 70°F during the wetting cycle and around 120°F during the drying cycle. The cores
cycled for 84 days.
At the end of the 84-day period, the cores were removed from the chamber and examined for cracks.
The results of this investigation were promising. The untreated control core in Figure 29 shows lots of cracks and dark-shaded lines indicative of small cracks associated with ASR. The sealed core in Figure 30 shows little-to-no cracking, even though the aggregate is reactive. This means that the sealer minimized the deleterious effects of ASR. The results are shown in Table 6.
Figure 29 Untreated Control Core After the Wet and Dry
Test
Figure 30 Sealer Treated Core After the Wet and
Dry Test

23 | P a g e
Review of all the cores found that Sealers 2,1,8,4,3,10, and 9 did not show any cracking or moisture penetration.
Sealers 7, 5, 6, and 11 had some small cracks observed. In all cases, cracks observed due to the deleterious effects of ASR were less in the treated cores in comparision with the untreated control core.
In the future, the research team believes that this test method will be a useful tool to evaluate a sealer. The research team recommends that a sealer will be considered acceptable if there is no cracking after 3 months in the Wet & Dry test.
Table 6 Wet & Drying Testing Results after 3 months
Sealer Application Field application Order
Core Observation Cracking Description
Sealer 2 No cracks Sealer 1 No cracks Sealer 8 No cracks Sealer 7 Small cracks Sealer 5 Small cracks appearing in the middle Sealer 4 No cracks Sealer 3 No cracks Sealer 10 No cracks Sealer 6 Small cracks Sealer 9 No cracks Sealer 11 Small cracks throughout Control Lots of small cracks throughout
24 | P a g e
Conclusions The Approved Product List (APL) is a list of products that are prequalified for use on Nebraska Department of Roads Construction and Maintenance projects. Products included on this list are required to meet certain specifications before they are accepted. This investigation evaluated penetrating concrete sealers for pavements, that penetrate the hardened concrete forming a water-repelling barrier. This barrier prevents the deleterious effects associated with the ingress of water and waterborne contaminates. As a follow-up to the investigation “Field Performance of Sealers for Portland Cement Concrete Pavements (PCCP),” this investigation looks to address concerns regarding the application and acceptance of concrete sealers. The first concern was the drying time for sealers, and how temperature, humidity, and the addition of supplemental cementitious materials (SCM) may affect it. The second concern was the slickness of a pavement following the application of a sealer. The third concern was to re-evaluate the approved sealers and the process for approving sealers for the APL.
First Concern The first concern is the duration of drying time for sealers, and how it may be affected by temperature, humidity, and the addition of supplemental cementitious materials (SCM). The drying time concerns were addressed in three testing phases. In the first phase, there was a difference in the lab drying time between samples tested in high temperature/low humidity and low temperature/high humidity environments. Testing found that blocks dried slightly faster in the cold temperature/high humidity chamber, but temperature and humidity were not a major factor affecting dry time. In the second phase, the same blocks were subjected to the same testing procedure as the first phase to see if the drying times for subsequent applications of sealer are hindered by previous applications of sealers. It was found that drying time was not affected by previous applications of the same sealer.
In the third phase, the sealers were applied to test sections of a pavement that contained SCM. Sealer drying time was recorded. It was found that some sealers maintained similar drying times to the concrete blocks while others had dramatic increases in drying time leading to the conclusion that SCM could be a cause for long drying times due to lower permeability.
Second Concern To address the second concern about the slickness of a pavement following the application of a sealer skid resistance testing was completed on sealer-treated test sections. Testing found that skid resistance was not affected by sealer applications after the sealer had dried. Slickness was only a concern immediately after application while the sealer was still wet, where the skid number dropped below SN of 32. It was concluded that sealers that had drying times faster than 1 hour would be acceptable for used when lanes need to be reopened shortly after application. Due to this conclusion, the drying time of all sealers will need to be assessed in a field setting to categorize acceptable use, before they can be added to the APL.
Third Concern To address the third concern about the re-evaluation of sealers for the APL, testing was completed on concrete cores from sealer-treated test sections.

25 | P a g e
The depth of penetration analysis found that sealers had depths of penetration from less than 1/16th to
3/8th of an inch. Observation of the water-repelling layer found that the better performing sealers had
penetration depths greater than 1/16th of an inch, leading to the conclusion that sealers would be required
to have a depth of penetration greater than 1/16th of an inch to be added to the APL.
The laboratory depth of penetration ranged from slightly less than 1/16th of an inch to
3/8th of an inch.
All of the sealers were visually observed in the split laboratory blocks.
The field depth of penetration ranged from slightly less than 1/16th of an inch to 3/8
th of an
inch.
Five sealers were found to have inconsistent penetration in the split field cores, requiring the dye test.
All five of the sealers tested by the dye test were found to prevent the ingress of the water- based dye.
In general, the depth of penetration in the laboratory was similar to the depth of penetration in the field.
Cores sampled from a project with known ASR was 100% treated with sealers and were subjected to Wet & Dry testing.
Seven of the eleven sealers had no cracking after 3 months in the Wet & Dry chamber.
After the completion of this research project, the following are the requirements for a penetrating sealer to be on the APL.
Sealers are to have a depth of penetration greater than 1/16th of an inch.
Sealer-treated concrete cores susceptible to ASR should show no cracking for up to 3 months under Wet & Dry testing.
The drying time is to be measured for each sealer to assess if it will be acceptable for contract projects or state forces (maintenance) only.
Skid Resistance testing will be performed.
Implementation For sealers to be added to the APL they are required to meet the following performance criteria.
Sealers shall be received prior to July for approval. After which, a control core and a core for each sealer will be collected from a field location that is susceptible to ASR. The ASR susceptible cores will then be treated with sealer at the minimum recommended coverage and placed in the Wet & Dry chamber for 3 months. Cores treated with sealers that show no cracking after 3 months will be acceptable for approval.
Skid resistance testing and drying time measurements will be evaluated to categorize the sealers for the APL. Sealers with shorter drying times may be acceptable for state forces (maintenance). Sealers with longer drying times may be acceptable for contract-let projects.
Cores will be taken one week after the application of sealers for the field-test sections. The cores will then be split and examined for depth of penetration. Sealers with a depth of penetration greater than 1/16 of an inch may be acceptable for approval.

26 | P a g e
Future Evaluations The Department will revisit the Wahoo Bypass to assess if there is a difference between the drying times of the initial sealer applications compared to a future reapplication. The concern being if a pavement was previously sealed, a reapplication would be hindered by the first application. This could effectively reduce the drying time and penetration of the reapplication of the sealer. The lab testing of blocks during this investigation found that there was no issue, but the department may verify the re-application in a field setting. Current manufacturer recommendations suggest that the penetrating sealer last for 4 years, after which requiring a reapplication. Previous NDOR research, “Field Performance of Sealers for Portland Cement Concrete Pavements (PCCP)” found that the sealers were still effective beyond 4 years. In addition, Research by Oklahoma DOT found that Silane sealers remained effective for up to 12 years, but the harsher winter weather conditions of Nebraska may result in a reduced sealer life. Future evaluation comparing longevity to penetration depth will be performed.
References
Chamberlain, D. A. (2004). A Procedure for Verifying Pavix CCC100 Concrete Impregnation by Core Examination. London: City University.
Google. (2016). Map data 2016 Google Imagery 2016, DigitalGlobe, Landsat, U.S. Geological Survey, USDA Farm Service Agency. Retrieved September 20, 2016, from https://www.google.com/maps/@41.2279033,-96.6358967,15z/data=!3m1!1e3
Halsey, L., & Seger, B. (2016). Additional methods for sealer penetration observation. Nebraska Department of Roads, Materials and Research, Lincoln.
Heyen, W., & Halsey, L. (2016). Field performance of sealers for portland cement concrete pavements. Nebraska Department of Roads, Materials & Research, Lincoln. Retrieved from http://roads.nebraska.gov/media/5508/2015-field-performance-of-sealers-for-portland-cement-concrete-pavements.pdf