Ground Penetrating Radar Evaluation of New Pavement · PDF fileGround Penetrating Radar...
20
February 2015 Ken Maser Adam Carmichael WA-RD 839.1 Office of Research & Library Services WSDOT Research Report Ground Penetrating Radar Evaluation of New Pavement Density
Transcript of Ground Penetrating Radar Evaluation of New Pavement · PDF fileGround Penetrating Radar...

February 2015Ken Maser Adam Carmichael
WA-RD 839.1
Office of Research & Library Services
WSDOT Research Report
Ground Penetrating Radar Evaluation of New Pavement Density
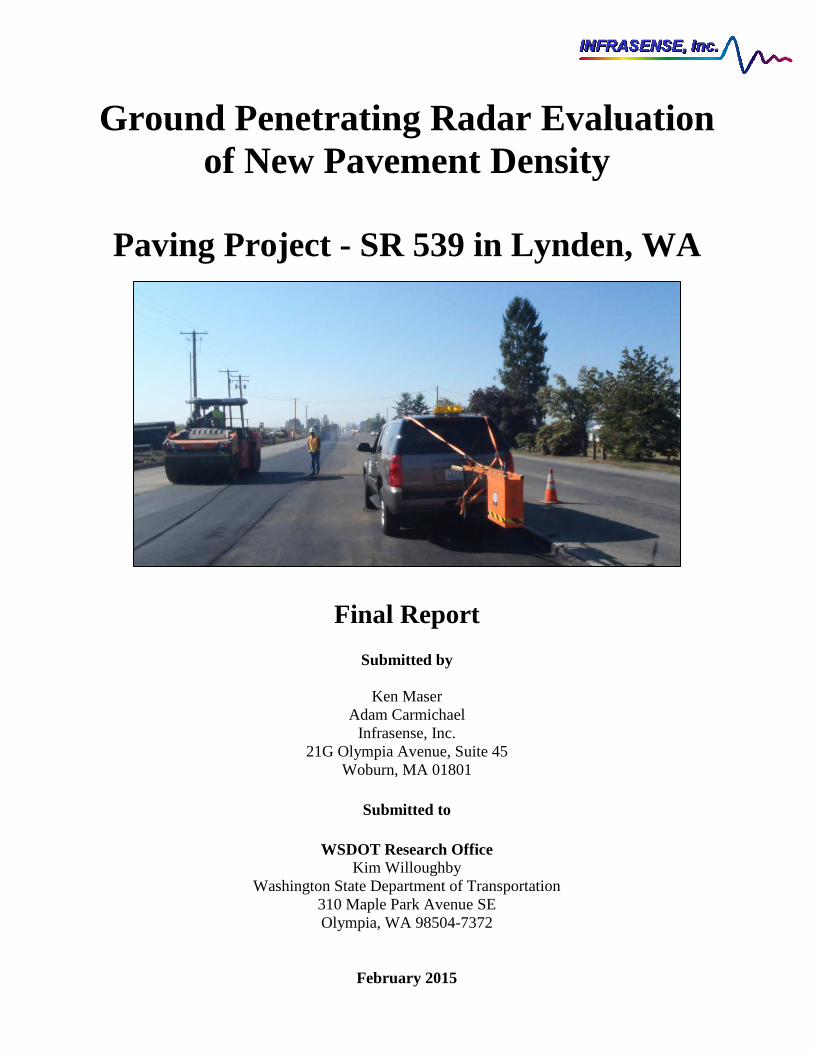
Ground Penetrating Radar Evaluation of New Pavement Density
Paving Project - SR 539 in Lynden, WA
Final Report
Submitted by
Ken Maser Adam Carmichael
Infrasense, Inc. 21G Olympia Avenue, Suite 45
Woburn, MA 01801
Submitted to
WSDOT Research Office Kim Willoughby
Washington State Department of Transportation 310 Maple Park Avenue SE Olympia, WA 98504-7372
February 2015

INFRASENSE, INC GPR DENSITY EVALUATION FEBRUARY 13, 2015 C14-006 SR 539 IN LYNDEN, WA PAGE 2

INFRASENSE, INC GPR DENSITY EVALUATION FEBRUARY 13, 2015 C14-006 SR 539 IN LYNDEN, WA PAGE 3
DISCLAIMER
The contents of this report reflect the views of the authors, who are responsible for the facts and
the accuracy of the data presented herein. The contents do not necessarily reflect the official
views or policies of the Washington State Department of Transportation or the Federal Highway
Administration. This report does not constitute a standard, specification, or regulation.

INFRASENSE, INC GPR DENSITY EVALUATION FEBRUARY 13, 2015 C14-006 SR 539 IN LYNDEN, WA PAGE 4
1. REPORT NO. 2. GOVERNMENT ACCESSION NO. 3. RECIPIENTS CATALOG NO
WA-RD 839.1
4. TITLE AND SUBTITLE 5. REPORT DATE
Ground Penetrating Radar Evaluation of New Pavement Density
February 2015
6. PERFORMING ORGANIZATION CODE
7. AUTHOR(S) 8. PERFORMING ORGANIZATION REPORT NO.
Ken Maser and Adam Carmichael
9. PERFORMING ORGANIZATION NAME AND ADDRESS 10. WORK UNIT NO.
Infrasense, Inc. 21G Olympia Avenue, Suite 45 Woburn, MA 01801
11. CONTRACT OR GRANT NO.
12. CO-SPONSORING AGENCY NAME AND ADDRESS 13. TYPE OF REPORT AND PERIOD COVERED
Washington State Department of Transportation Research Office Research Manager: Kim Willoughby 360.705.7978 PO Box 47372 Olympia, WA 98504-7372
Research 14. SPONSORING AGENCY CODE
15. SUPPLEMENTARY NOTES
This study was conducted in cooperation with the U.S. Department of Transportation, Federal Highway Administration. 16. ABSTRACT
The objective of this project was to map pavement surface density variations using dielectric measurements from ground penetrating radar (GPR). The work was carried out as part of an Asphalt Intelligent Compaction demonstration project on SR 539 in Lynden, WA. This demonstration was part of a larger WSDOT project entitled, "Lynden-Aldergrove Port of Entry Improvements." The research found that comparing the GPR dielectrics and core air void data showed no significant correlation. It was speculated this lack of correlation could be due to a density gradient within the 4-inch asphalt depth, and the fact that the GPR equipment only captures the properties of the top 1-1.5 inches. By focusing on the thinnest asphalt sections, the correlation was significantly improved, with an R2 of 0.77.
17. KEY WORDS 18. DISTRIBUTION STATEMENT
GPR, dielectric, pavement density, air voids, asphalt
19. SECURITY CLASSIF. (of this report) 20. SECURITY CLASSIF. (of this page) 21. NO. OF PAGES 22. PRICE
None None

INFRASENSE, INC GPR DENSITY EVALUATION FEBRUARY 13, 2015 C14-006 SR 539 IN LYNDEN, WA PAGE 5
1. Objective The objective of this project was to map pavement surface density variations using dielectric measurements from ground penetrating radar (GPR). The work was carried out as part of an Asphalt Intelligent Compaction demonstration project on SR 539 in Lynden, WA. This demonstration was part of a larger WSDOT project entitled, "Lynden-Aldergrove Port of Entry Improvements" (F.A. Project No. CBI-0539(015)). The GPR testing was carried out on the west-most and middle newly paved lanes between project station 23+00 on the north end and station 6+00 on the south end. The testing took place shortly after each lane of the section was paved. GPR was one of several test methods implemented concurrently. Other testing included nuclear density gauge (NG), light weight deflectometer (LWD), falling weight deflectometer (FWD), and coring for lab density. The following sections describe the basic principles for GPR density measurements, the equipment and data collection for this project, the dielectric results obtained, and the correlation of dielectrics with core densities. 2. GPR Measurement of Pavement Density: General Principles and Previous Work Ground Penetrating Radar (GPR) systems using a "horn" antenna have the capability of measuring a physical property of the pavement surface layer referred to as the "dielectric constant". This capability exists because the horn antenna launches the radar wave into the air above the pavement, and the first reflection received by the antenna is that from the top of the pavement. By measuring the amplitude of this reflection, and comparing to that from a metal plate, the dielectric constant can be calculated. Until recently, the primary use of the dielectric constant was for calculating the GPR velocity in the pavement layers for the purpose of determining layer thickness. More recently, however, the dielectric constant itself has shown to be a useful measure of density for newly placed pavement. The dielectric constant of an asphalt concrete depends on the dielectric constant of its constituents and their volume fraction. Therefore, aggregate type and volumetric proportion has the biggest impact on dielectric, and the volume of air has a lesser impact. However, in new construction projects where the aggregate type and volumetric proportion are typically uniform, the primary variation in dielectric constant comes from variations in the volume of air. Thus, the dielectric constant can provide an indication of the variation in air void and density. As part of NCHRP 10-65, thickness/density studies were conducted on newly placed asphalt pavements for six projects located in Alabama, Minnesota, and Texas (Von Quintus, et al. 2006). These projects involved collecting multiple passes of GPR data on each newly paved section, calculating the dielectric constant at each measurement point, and calibrating the dielectric values using laboratory measured air void data at selected locations. Results of this study showed

INFRASENSE, INC GPR DENSITY EVALUATION FEBRUARY 13, 2015 C14-006 SR 539 IN LYNDEN, WA PAGE 6
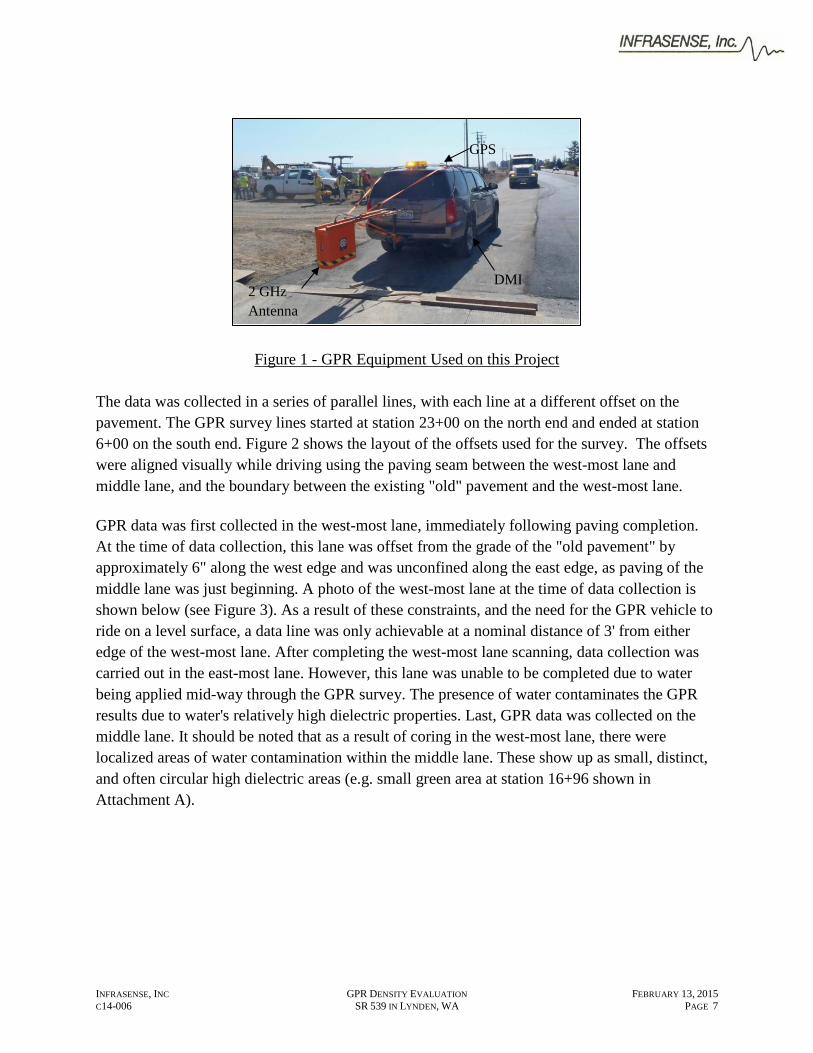
that, even without calibration to density, the dielectric values themselves can reveal density deficiencies. Extensive research was also completed in Finland (Saarenketo and Roimela, 1998) which verified the ability to measure asphalt air void content with GPR. The “air voids GPR” values were obtained from GPR-based dielectric measurements using a small number of cores for calibration. The results showed a very strong correlation between the GPR-based air void measurements and the laboratory measurements (R2 = 0.92). Based on these results, the GPR method is now an accepted standard for asphalt quality control in Finland. More recently in the US, GPR density evaluation studies have been carried out by the Florida and Minnesota DOT's. In the FDOT study, five different project sections on SR20 were selected, with test sections ranging in length from 1000 to 7000 feet (Popik et. al., 2010). In each section, the GPR dielectric data was mapped on-site and used to locate pavement core locations. The pavement cores were extracted by the FDOT State Materials Office (SMO), and tested for Bulk Specific Gravities. The GPR dielectric constant values were correlated to the laboratory test results from each section, and the correlation coefficients varied from 0.79 to as high as 0.98. Better correlations were found when the coring operation was completed shortly after the GPR surveying. A combined correlation factor of 0.80 was determined using the data from all four sections. Equivalent studies were carried out on two other road sections—SR23 and SR222, with similar correlations between the GPR and the laboratory density measurements. Recently, a SHRP2 study was carried out involving the use of GPR for measuring uniformity of new HMA layers (Sebesta et. al., 2013). The focus of this study was on quality control, attempting to implement GPR measurements directly behind the paving machine. The actual measurements in this project, however, were made after paving similar to those discussed in the studies discussed above. Correlations between GPR dielectrics and core densities were presented for three pavement sections, with reported R2 values ranging from 0.76 to 0.82. Additionally, over the past year, CalTrans and NHDOT have used GPR to supplement the Intelligent Compaction evaluation program. 3. Equipment and Data Collection The data collection took place on August 26th between 9:30 a.m. and 3 p.m. PST. Weather conditions were sunny, with temperatures reaching into the upper 80's ºF. The GPR scanning was carried out using a vehicle mounted GSSI SIR-20 GPR system and a 2.0 GHz Model 4105 horn antenna. The equipment is shown in Figure 1. The setup included a high resolution distance measuring instrument (DMI) to accurately assign distance to each GPR scan of the survey, as well as a differentially corrected GPS system for further assurance of spatial accuracy. Data was collected at low speed (5-10 mph) to ensure the safety of testing and paving personnel.
INFRASENSE, INC GPR DENSITY EVALUATION FEBRUARY 13, 2015 C14-006 SR 539 IN LYNDEN, WA PAGE 7
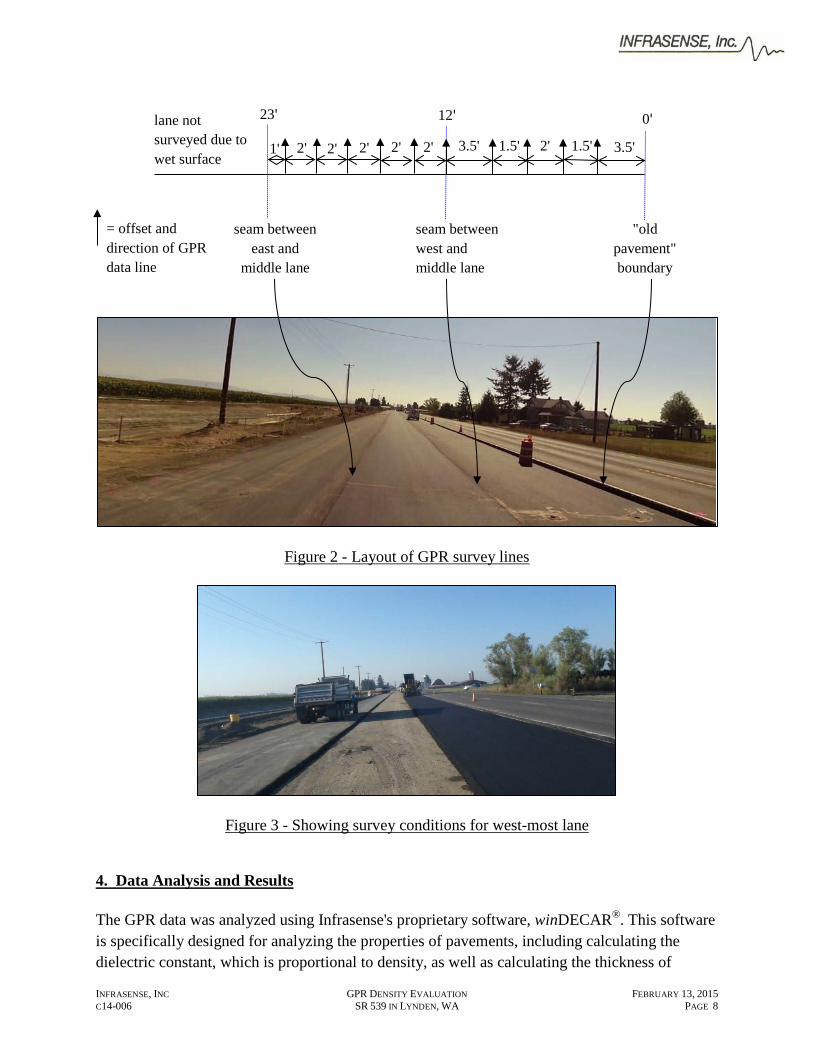
Figure 1 - GPR Equipment Used on this Project The data was collected in a series of parallel lines, with each line at a different offset on the pavement. The GPR survey lines started at station 23+00 on the north end and ended at station 6+00 on the south end. Figure 2 shows the layout of the offsets used for the survey. The offsets were aligned visually while driving using the paving seam between the west-most lane and middle lane, and the boundary between the existing "old" pavement and the west-most lane. GPR data was first collected in the west-most lane, immediately following paving completion. At the time of data collection, this lane was offset from the grade of the "old pavement" by approximately 6" along the west edge and was unconfined along the east edge, as paving of the middle lane was just beginning. A photo of the west-most lane at the time of data collection is shown below (see Figure 3). As a result of these constraints, and the need for the GPR vehicle to ride on a level surface, a data line was only achievable at a nominal distance of 3' from either edge of the west-most lane. After completing the west-most lane scanning, data collection was carried out in the east-most lane. However, this lane was unable to be completed due to water being applied mid-way through the GPR survey. The presence of water contaminates the GPR results due to water's relatively high dielectric properties. Last, GPR data was collected on the middle lane. It should be noted that as a result of coring in the west-most lane, there were localized areas of water contamination within the middle lane. These show up as small, distinct, and often circular high dielectric areas (e.g. small green area at station 16+96 shown in Attachment A).
2 GHz Antenna
DMI
GPS
INFRASENSE, INC GPR DENSITY EVALUATION FEBRUARY 13, 2015 C14-006 SR 539 IN LYNDEN, WA PAGE 8
Figure 2 - Layout of GPR survey lines
Figure 3 - Showing survey conditions for west-most lane
4. Data Analysis and Results The GPR data was analyzed using Infrasense's proprietary software, winDECAR®. This software is specifically designed for analyzing the properties of pavements, including calculating the dielectric constant, which is proportional to density, as well as calculating the thickness of
1.5'
"old pavement" boundary
seam between west and middle lane
seam between east and
middle lane
= offset and direction of GPR data line
12' 0' lane not surveyed due to wet surface
3.5' 2' 1.5' 3.5' 2' 2' 2' 2' 2' 1'
23'

INFRASENSE, INC GPR DENSITY EVALUATION FEBRUARY 13, 2015 C14-006 SR 539 IN LYNDEN, WA PAGE 9
4.5
5 5.5
6 6.5
7
Dielectric Scale
= Core #
= paving seam
pavement layers. The pavement dielectric and thickness analyses were carried out using the following steps:
(1) Selection or "picking" of the bottom of the asphalt. (2) Identification of the beginning and the end of the pavement section in each radar file,
and check of the radar distance measurement against the known length. (3) Defining the offset of each GPR file. (4) Computation of asphalt dielectric and thickness. (5) Mapping the results.
Figure 4 - Sample of GPR "raw" data (offset 7' east of "old pavement" boundary)
A sample GPR data file is shown above, with both the reflections at the top and bottom of the pavement annotated. The dielectric values are calculated using the amplitude (strength) of the top or surface of the pavement, whereas the thickness of the pavement uses the bottom reflection. The complete contour plot of dielectric values for this project is shown in Attachment B. A sample from that plot is shown in Figure 5 below.
Figure 5 -- Sample from the Dielectric Contour Plot
1L
1R
2L
2R
3L
3R
4L
4R
20+00 19+00 18+
250 300 350 400 450 500Distance from Station 23+00 (ft)
Station
0
10
20
Ose
t o
O
d t
(t)
top of asphalt
200' depth (in)
0" -
2" -
4" -
6" -
bottom of asphalt

INFRASENSE, INC GPR DENSITY EVALUATION FEBRUARY 13, 2015 C14-006 SR 539 IN LYNDEN, WA PAGE 10
To further illustrate variations in density and thickness, histograms of the dielectrics and density are shown in Figure 6. The horizontal axis represents the dielectric or thickness value range and the vertical scale shows the percent of the data found in that range.
Figure 6 - Distributions of Asphalt Dielectric and Thickness
0.0%
5.0%
10.0%
15.0%
20.0%
25.0%Pe
rcen
t
Dielectric
0
0.02
0.04
0.06
0.08
0.1
0.12
0.14
0.16
0.18
0.2
Bin 3
3.1
3.2
3.3
3.4
3.5
3.6
3.7
3.8
3.9 4
4.1
4.2
4.3
4.4
4.5
4.6
Perc
ent
Thickness (in.)
Mean = 6.0
Mean = 3.7 inches
(a)
(b)

INFRASENSE, INC GPR DENSITY EVALUATION FEBRUARY 13, 2015 C14-006 SR 539 IN LYNDEN, WA PAGE 11
The sample in Figure 5 shows the key features of the dielectric contour plot. The color range has been set up so that red represents low dielectric values, green represents high dielectric values, and yellow represents values in between. The range of values in the color scale is consistent with the histogram shown in Figure 6(a). The sample shows, for example, that in this region the area between offsets 12 and 23 has generally lower dielectrics than the lane in which the testing took place (offsets 0-12). 5. Correlation of GPR Dielectric to Core Densities Cores were taken in the left and right wheelpaths (offsets 3 and 9) every 50 feet, beginning at station 20+00, and air void and thickness measurements were provided based on the core samples. The GPR dielectric data was evaluated at the core locations and correlated with the air void measurements, and the results appear in the plot below. The raw data for this analysis is shown in Attachment A. In Figure 7, there appears to be no correlation between the lab air void results and the GPR dielectrics.
Figure 7 - Lab Air Voids vs. GPR Dielectrics
In considering this result, the following points came to light:
• The lab air voids represent the average of the full pavement thickness (~ 4 inches) • the GPR equipment only samples the top 1.0 - 1.5 " of pavement • previous projects in which GPR was correlated with density and air voids involved
testing of the final wearing surface, which was typically 1.5 - 2.0 inches. Based on field observations, it was suggested that there might be a density gradient in the pavement, and that correlation might improve in areas where the asphalt is thinner. Using the core thickness data, the air void vs. dielectric data was sorted by thickness, and the correlation
R² = 0.0107
55.5
66.5
77.5
88.5
99.510
5.3 5.5 5.7 5.9 6.1 6.3 6.5
Air
Voi
d %
GPR Dielectric
INFRASENSE, INC GPR DENSITY EVALUATION FEBRUARY 13, 2015 C14-006 SR 539 IN LYNDEN, WA PAGE 12
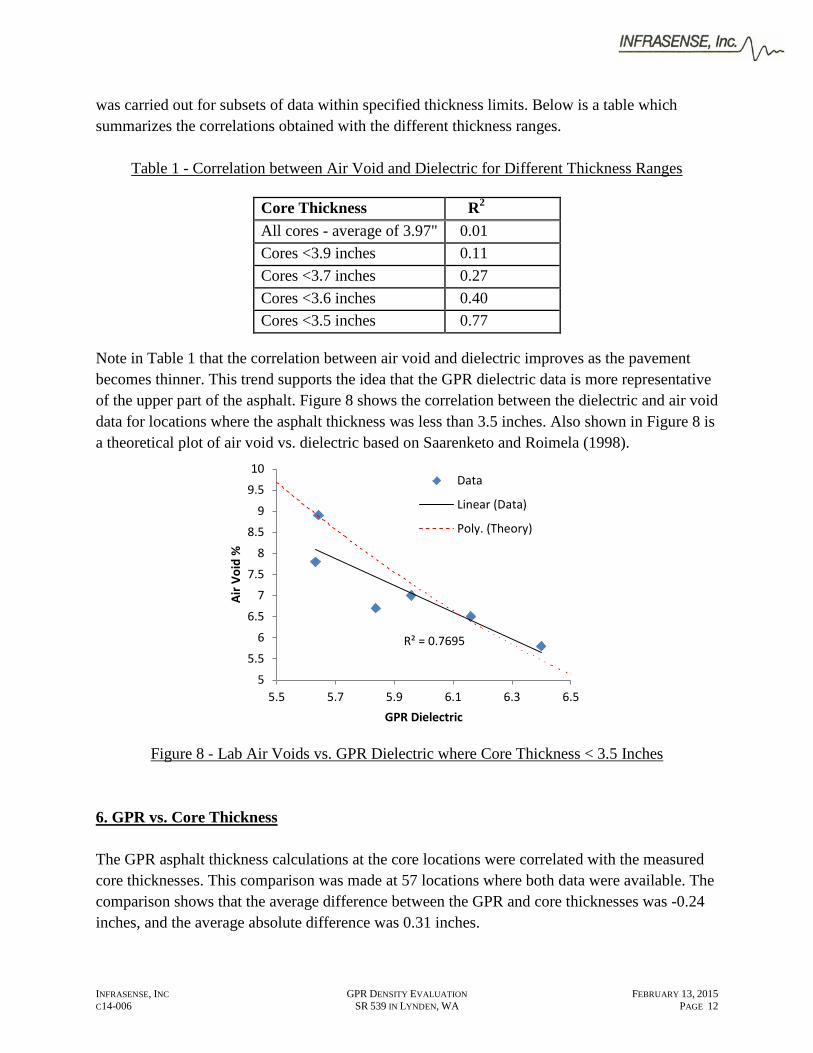
was carried out for subsets of data within specified thickness limits. Below is a table which summarizes the correlations obtained with the different thickness ranges.
Table 1 - Correlation between Air Void and Dielectric for Different Thickness Ranges
Note in Table 1 that the correlation between air void and dielectric improves as the pavement becomes thinner. This trend supports the idea that the GPR dielectric data is more representative of the upper part of the asphalt. Figure 8 shows the correlation between the dielectric and air void data for locations where the asphalt thickness was less than 3.5 inches. Also shown in Figure 8 is a theoretical plot of air void vs. dielectric based on Saarenketo and Roimela (1998).
Figure 8 - Lab Air Voids vs. GPR Dielectric where Core Thickness < 3.5 Inches
6. GPR vs. Core Thickness The GPR asphalt thickness calculations at the core locations were correlated with the measured core thicknesses. This comparison was made at 57 locations where both data were available. The comparison shows that the average difference between the GPR and core thicknesses was -0.24 inches, and the average absolute difference was 0.31 inches.
R² = 0.7695
5
5.5
6
6.5
7
7.5
8
8.5
9
9.5
10
5.5 5.7 5.9 6.1 6.3 6.5
Air V
oid
%
GPR Dielectric
Data
Linear (Data)
Poly. (Theory)
Core Thickness R2 All cores - average of 3.97" 0.01 Cores <3.9 inches 0.11 Cores <3.7 inches 0.27 Cores <3.6 inches 0.40 Cores <3.5 inches 0.77

INFRASENSE, INC GPR DENSITY EVALUATION FEBRUARY 13, 2015 C14-006 SR 539 IN LYNDEN, WA PAGE 13
7. Discussion 7.1 Influence of GPR Equipment A 2 GHz horn antenna was utilized in this project because this is equipment that is available to most agencies and has been most frequently used in prior density studies. The high frequency of this antenna limits the sampling depth of the surface reflection to no more than the top 1.0 - 1.5 inches of asphalt. Most prior projects referenced in this report have been on relatively thin overlays (1.5 - 2.0 inches) and have led to good correlations between GPR surface dielectric and asphalt density. For typical WSDOT overlay thicknesses of 1.8 inches, this equipment should work well. The lack of correlation in the current project appears to be due to a combination of thicker pavement and apparent density gradients that made the top 1.0 - 1.5 inch not representative of the full thickness. Lower frequency 1.0 GHz horn antennas exist which can sample deeper. However, these are no longer manufactured in the US due to FCC restrictions. There are also lower frequency "ground coupled" antennas that are available, but because of their direct contact with the pavement, it is not possible to calculate the dielectric constant directly from the GPR data. The horn antenna is unique in that it provides the reflection between air and asphalt, and the dielectric is calculated from that reflection. Note that the footprint of the horn antenna is about 9 inches wide. With data passes spaced laterally at 2 feet, there are clearly strips of pavement that are not directly covered by the survey. In the analysis, the data is interpolated between the survey lines to obtain a complete contour plot. It is reasonable to assume that, unless there are abrupt local changes in density, that this interpolation procedure provides a reasonable representation of the spatial variation in dielectric (and surface density). 7.2 - Relationship between Dielectric and Density There are a number of theoretical relationships for converting dielectric to density (see Saarenketo and Roimela , 1998, Sebesta and Scullion, 2003, Von Quintas et. al., 2006). However, in the range in which we are working, the relationship is fairly linear, and it is reasonable to use linear calibration to the core densities. 8. Summary and Conclusions GPR has been utilized by various agencies as a means to map the density variations in asphalt pavement, and researchers have documented the correlation between GPR dielectric and asphalt density and air void. In this SR 539 intelligent compaction demonstration project, both the dielectric and thickness of 1700 foot length of newly constructed 4-inch thick base course have

INFRASENSE, INC GPR DENSITY EVALUATION FEBRUARY 13, 2015 C14-006 SR 539 IN LYNDEN, WA PAGE 14
been evaluated using vehicle-mounted air-coupled GPR equipment. The dielectric and thickness variations have been presented as plan area contour maps, shown in Attachment B. Comparison of the GPR dielectrics and core air void data (see Attachment A) showed no significant correlation. It was speculated this lack of correlation could be due to a density gradient within the 4-inch asphalt depth, and the fact that the GPR equipment only captures the properties of the top 1-1.5 inches. By focusing on the thinnest asphalt sections, the correlation was significantly improved, with an R2 of 0.77. Comparison of the GPR vs. core thickness shows an average difference of -0.24 inches, and an average absolute difference of 0.31 inches. The results confirm that the ability of the GPR method to detect density using the surface reflection from the 2.0 GHz horn antenna equipment is limited to the top (1-1.5 inches) of pavement, and to thicker pavements only if the density is uniform with depth.
8. References
Popik, M., Hyungski, L., Aho, B., Maser, K.R., and Holzschuher, C. Using Ground Penetrating Radar for Asphalt Density Measurements, Transportation Research Board, 89th Annual Meeting, Paper No. 10-2266, Washington, DC, (January 2010).
Saarenketo, T., and Roimela, P. Ground Penetrating Radar Technique in Asphalt Pavement Density Quality Control. Proceedings of the 7th International Conference on Ground Penetrating Radar, Lawrence, KS, pp. 461-466, (May 27-30, 1998).
Sebesta, S. and Scullion, T. Application of Infrared Imaging and Ground-Penetrating Radar for Detecting Segregation in Hot-Mix Asphalt Overlays. Paper No. 03-3406 Transportation Research Board, 82nd Annual Meeting, Washington, DC, (January 12-16, 2003).
Von Quintus, H., Rao, C., Minchen, E., Maser, K.R., Nazarian, S., and Prowell, B. Nondestructive Testing Technology for Quality Control and Acceptance of Flexible Pavement Construction. Final Report, Project 10-65, prepared for the National Cooperative Highway Research Program, National Research Council, Washington, DC, (2006).
"Ground Penetrating Radar Evaluation of New Pavement Density - Paving Project 24864 in Lee, NH" Report submitted by Infrasense, Inc. to the New Hampshire Department of Transportation, October, 2013.
"Ground Penetrating Radar Evaluation of New Pavement Density - Intelligent Compaction Demonstration on I-80, Solano, CA" Report submitted by Infrasense, Inc. to the University of California, Davis Dept. of Civil Engineering, December, 2013

INFRASENSE, INC GPR DENSITY EVALUATION FEBRUARY 13, 2015 C14-006 SR 539 IN LYNDEN, WA PAGE 15
Attachment A Air Void, Dielectric, and Core Data
Core ID Station
(ft.)
Offset from original
pavement (ft.)
Air Void from Cores
(%)
Dielectric from GPR
Core Thickness
(in)
GPR Thickness
(in.) 1L 2000 9 6.7 5.4 3.60 3.8 1R 2000 3 7.8 6.6 4.32 3.8 2L 1950 9 6.4 6.1 3.72 3.9 2R 1950 3 8.7 6.2 4.56 3.8 3L 1900 9 5.7 5.8 3.72 3.7 3R 1900 3 7.1 6.3 4.56 4.4 4L 1850 9 6.5 6.2 3.48 3.5 4R 1850 3 6.9 6.6 4.08 3.7 5L 1800 9 6.0 6.2 3.60 3.7 5R 1800 3 6.6 6.3 3.84 3.8 6L 1750 9 7.0 6.1 3.60 3.8 6R 1750 3 7.4 6.2 3.96 3.7 7L 1700 9 7.0 6.0 3.48 3.5 7R 1700 3 6.7 6.5 4.08 3.7 8L 1650 9 6.6 6.4 3.84 3.6 8R 1650 3 7.2 6.7 3.96 3.8 9L 1600 9 6.5 5.9 3.84 3.9 9R 1600 3 7.2 6.2 4.08 3.9 10L 1550 9 6.6 6.1 3.60 3.6 10R 1550 3 7.8 6.1 4.32 3.6 11L 1500 9 7.8 5.3 3.60 3.7 11R 1500 3 7.0 6.2 4.20 3.7 12L 1450 9 7.8 6.0 3.60 3.5 12R 1450 3 8.8 6.2 4.32 3.7 13L 1400 9 6.7 5.8 3.48 3.5 13R 1400 3 9.0 6.1 3.96 3.6 14L 1350 9 7.8 5.6 3.48 3.9 14R 1350 3 7.1 6.3 4.44 3.7 15L 1300 9 8.9 5.6 3.48 3.7 15R 1300 3 8.0 6.2 4.20 3.7 16L 1250 9 6.4 6.1 3.72 3.6 16R 1250 3 9.0 6.0 4.20 3.8 17L 1200 9 7.3 5.8 3.72 3.6 17R 1200 3 8.9 5.9 4.44 3.9 18L 1150 9 7.8 5.5 3.60 3.4 18R 1150 3 8.2 6.0 4.32 3.7 19L 1100 9 7.4 5.7 3.72 3.3 19R 1100 3 7.1 6.1 4.08 3.5

INFRASENSE, INC GPR DENSITY EVALUATION FEBRUARY 13, 2015 C14-006 SR 539 IN LYNDEN, WA PAGE 16
Core ID
Station (ft.)
Offset from original
pavement (ft.)
Air Void from Cores
(%)
Dielectric from GPR
Core Thickness
(in)
GPR Thickness
(in.) 20L 1050 9 6.9 6.4 3.60 3.6 20R 1050 3 8.9 6.5 3.84 3.6 21L 1000 9 6.9 5.6 3.72 3.8 21R 1000 3 7.7 6.0 4.2 4.1 22L 950 9 6.2 6.4 3.72 3.8 22R 950 3 7.8 6.4 4.32 3.7 23L 900 9 6.5 6.2 3.72 3.8 23R 900 3 7.2 6.4 4.32 3.7 24L 850 9 6.3 6.1 4.08 4.2 24R 850 3 9.4 6.2 4.32 3.8 25L 800 9 6.2 7.0 3.84 3.7 25R 800 3 8.6 6.1 4.80 4.0 26L 750 9 7.5 6.4 3.72 3.6 26R 750 3 8.5 6.0 4.44 4.1 27L 700 9 7.1 5.7 3.72 3.8 27R 700 3 8.9 6.2 5.28 3.9 28L 650 9 5.8 6.4 3.48 3.4 28R 650 3 6.9 6.2 4.08 3.7 29R 600 3 9.2 6.3 4.56 3.7

INFRASENSE, INC GPR DENSITY EVALUATION NOVEMBER 20, 2013 C14-006 SR 539 IN LYNDEN, WA PAGE 14
Attachment B
Asphalt Dielectric and Thickness Maps

1L
1R
2L
2R
3L
3R
4L
4R
+00 22+00 21+00 20+00 19+00 18+
0 50 100 150 200 250 300 350 400 450 500
Distance from Station 23+00 (ft)
Station
0
10
20O
set
o
Od
t (t
)
+00 22+00 21+00 20+00 19+00 18+
0 50 100 150 200 250 300 350 400 450 500
Distance from Station 23+00 (ft)
Station
0
10
20O
set
o
Od
t (t
)