RCED-93-171 Airline Competition: Higher Fares and Less ...archive.gao.gov/t2pbat5/149695.pdf ·...
48
GAO * United States General Accounting Office Report to the Chairman and Ranking Minority Member, Committee on Commerce, Science, and Transportation, U.S. Senate July 1993 AIRLINE COMPETITION Higher Fares and Less Competition Continue at Concentrated Airports GAORCED-93-171
Transcript of RCED-93-171 Airline Competition: Higher Fares and Less ...archive.gao.gov/t2pbat5/149695.pdf ·...

GAO *
United States General Accounting Office
Report to the Chairman and Ranking Minority Member, Committee on Commerce, Science, and Transportation, U.S. Senate
July 1993 AIRLINE COMPETITION
Higher Fares and Less Competition Continue at Concentrated Airports
GAORCED-93-171


GAO United States General Accounting Offxce Washihgton, D.C. 20648
Resources, Community, and Economic Development Division
B-238198
July 15,1993
The Honorable Ernest F. Hollings Chairman The Honorable John C. Danforth Ranking Minority Member Committee on Commerce, Science,
and Transportation United States Senate
In July 1990 we reported that airline passengers paid substantially higher fares at major airports where only one or two airlines provided most of the service, compared with airports where there was more competition.’ Since then, Eastern, Pan Am, Braniff, and Midway airlines have ceased operations. In addition, America West and Trans World Airways (TWA) are operating under bankruptcy protection, and Continental recently emerged from bankruptcy. The current financial distress of the airline industry could adversely affect competition, leading to even higher fares and reduced service at airports that end up with less competition.
In response to your concern that some airlines may be charging higher fares at airports where they handle most of the passenger traffic, we updated our previous study on the effects of market dominance on fares and service at major U.S. airports. Our objectives were to (1) compare fares at major airports served primarily by one or two airlines with fares at airports where there is more competition; (2) assess factors other than market dominance that could explain any differences in fares; (3) determine changes in airport concentration since our previous study; and (4) assess changes in the level of service at airports dominated by one or two airlines. We examined levels of service in terms of the number of destinations with direct service from the concentrated airports and the number of airlines competing for traffic on direct routes from these airpOI-tS2
Using the criteria we employed in our previous study, we examined airline yields-the fare per passenger mile-at 49 of the nation’s busiest airports on the basis of enplanements using data from April 1991 through March 1992 (the most recent data available at the time of our review). We
‘Airline Competition: Higher Fares and Reduced Competition at Concentrated Airports (GAO/RCED-90402, July 11, 1990).
2For our analysis of levels of service, “direct service” includes both nonstop service to destinations and one-stop service that does not require the passenger to change planes.
Page 1 GAO/RCED-93-171 Airfares at Concentrated Airports

B-238198
classified 14 airports-where one airline handled at least 60 percent of the enplaning passengers or two airlines handled at least 85 percent of the enplaning passengers-as “concentrated.“3 We compared yields for originating passengers at these concentrated airports with yields at the 35 remaining airports where there was more competition. Our analysis covers fares paid by about 240 million travelers. In both studies, we excluded airports in the Baltimore/Washington, Chicago, Dallas/Forth Worth, Houston, Los Angeles, New York City, and San Francisco areas because competition from airlines serving different airports in the same area might offset, to some extent, the effects of concentration.
In updating our 1990 study, we relined some of the methods that we had used to calculate yields and to account for differences in distances flown from the two groups of airports. We made these changes to refine the yield estimates and to respond to suggestions by industry analysts. (These refinements are discussed in detail in app. I.)
Results in Brief Although deregulation has created a more competitive airline industry and has led to lower air fares overall, airline passengers generally pay higher fares at 14 concentrated airports than at airports with more competition.4 We found that for the year ending March 31,1992, fares at concentrated airports were about 22 percent higher than fares at 35 less concentrated airports when we accounted for differences in the distances flown. Our earlier assessment found that, in 1933, fares at concentrated airports were about 21 percent higher.
When we did not adjust for distances flown, fares were about 34 percent higher at concentrated airports; they were about 27 percent higher in our previous study. Charlotte had the highest fares-more than 70 percent higher than those charged at unconcentrated airports. In comparison, El Paso was the only concentrated airport with lower fares than the comparison group.
For the most part, factors such as the use of frequent-flyer benefits and the ability to obtain higher quality service in terms of more direct flights from concentrated airports had little effect on the difference in yields between concentrated and unconcentrated airports. For example, when we (1) included $0 tickets used to redeem frequent-flyer benefits and
3At Denver, two airlines handled 84 percent of the enplaning passengers in 1992. We considered it concentrated.
Throughout the “Results in Brief’ we use the terms “fare” and “yield” interchangeably.
Page 2 GAO/WED-93-171 Airfares at Concentrated Airports
1
. , ;
,’

B-238198
(2) simultaneously adjusted for trip distances, we found that yields at concentrated airports were still 19.8 percent higher than yields at unconcentrated airports.
Dominant airlines increased their market share at nine concentrated airports between 1988 and 1992. Passengers flying on the dominant airline at eight of these airports may be paying more than passengers on
’ competing airlines. In some cases, airlines were able to increase their market share because competitors went out of business. For example, in Atlanta, Delta increased its market share from 58 percent in 1988 to 88 percent in 1992 after Eastern ceased operating in January 1991.
Overall, the number of airports receiving direct service from the 13 airports that were concentrated throughout the period of our two reviews increased from 1,359 locations in 1988 to 1,414 locations in 1992.6 This increase, however, was not spread out evenly among the 13 airports. In fact, direct air service declined at seven airports. This decline was more than offset by relatively large increases in service at Nashville and Charlotte and by moderate increases at four other airports.
Over the same period, competition on routes might have lessened at the concentrated airports, continuing the trend we reported in 1990. The number of destinations served directly by only one airline rose respectively from 56 percent to 59 percent to 64 percent from 1985 to 1988 to 1992, while the number of destinations served by three or more airlines fell respectively from 19 percent to 14 percent to 11 percent. In some cases, the increase in the number of routes served by one airline may indicate an increase in service by that airline at that airport which would benefit travelers. For example, there were 33 more routes served by one airline from Charlotte in 1992 than in 1933, while the number of routes served by two or more airlines decreased by only 3 routes.
The industry’s increased consolidation as a result of its current financial distress could result in reduced competition on routes and even higher fares at certain airports. Given the possibility of continuing consolidation, eliminating barriers to successful competition may be especially important since a number of new airlines are starting up operations and could become potential competitors of the existing airlines.
6For our analysis of fares, “direct service” includes both nonstop service to destinations and service with stops that do not require the passenger to change planes.
Page 3 GAO/RCED-93-171 Airfares at Concentrated Airports

B-238198
Background Deregulation of the U.S. airline industry, which began in 1978, allowed new airlines to enter the industry and existing airlines to serve new routes and to change fares and service levels without obtaining approval from government regulators. This flexibility has created a more competitive airline industry, which has led to lower fares.
Since deregulation, many airlines have reconfigured their route systems into “hub and spoke” networks. These networks allow airlines to channel most of their flights into a few airports (hubs) and connect other airports (spokes) in the system via service through a hub. In recent years, about 70 percent of domestic air travel by major airlines has been through hub airports. Airlines schedule flights to bring in travelers from many cities to hubs where passengers are transferred to other planes and sent to their fmal destinations in a relatively short amount of time. This system provides travelers with more departure and arrival choices and generally allows the airlines to use their airplanes and other equipment more efficiently.
The creation of hub-and-spoke systems, however, has also led to less competition at some airports where one or two airlines handle most of the traffic. In addition, competition in the airline industry has been reduced significantly since 1987 as a result of mergers and bankruptcies. At the end of 1987,18 airlines with significant market share offered scheduled passenger servicea By the end of 1992, only 10 airlines still had significant shares of scheduled passenger service.
The financial distress of the airline industry threatens effective competition. At the same time, as we have reported previously,’ it is difficult for other airlines to enter new markets and challenge the dominant positions of incumbent airlines because of barriers to entry that restrict airport access (such as limited access to gates because of long-term, exclusive-use leases). In addition, marketing strategies (such as code-sharing agreements) inhibit airlines from offering service in new markets.* We have made various suggestions and recommendations to the
6We defined significant market shares to be at least 0.5 percent of scheduled passenger service.
TAirline Competition: Industry Operating and Marketing Practices Limit Market Entry (GAO/RCED-90-147, Aug. 29,199O).
*Code-sharing agreements are partnerships between two airlines that agree to use the same two-letter airline code so that a connecting flight between the airlines appears to the passenger to be a change of planes on the same airline. Airline Competition: Industry Operating and Marketing Practices Limit Market Entry (GAO/RCED-90-147, Aug. 29,199O).
Page 4 GAO/WED-93-171 Airfares at Concentrated Airports

B-238198
Congress and DOT for dealing with these physical and marketing barriers.9 In the first few months of 1993, a number of new, start-up airlines have begun service, and they could become potential competitors of the remaining airlines. As we have reported previously, the probability of their success could be enhanced if barriers to competition were removed or at least lowered. lo
In related work, we have also (1) evaluated the effect that competition on individual routes had on fares; (2) described changes in fares at small and medium-sized communities since deregulation; and (3) assessed the effect that competition had on fares and concentration at airports in small communities.” (A list of related GAO products appears at the end of this report.)
Fares Still Higher at When we examined fare data for travel taken during the 12-month period
Concentrated Airports ending March 31,1992, we found that yields were 22.3 percent? higher at th e concentrated airports when we accounted for differences in the distribution of trip lengths flown from the two groups of airports. This finding is consistent with our previous study, which found that yields were 21 percent higher at concentrated airports when we accounted for distance.13
It was necessary to account for distance because the traffic patterns from the concentrated airports, which are mainly hubs, differ from the trafllc patterns from the unconcentrated airports. Because hub airports offer many connecting flights and are centrally located, they may tend to have a larger proportion of direct or nonstop flights that are shorter than flights from nonhub airports. Since yields-the fares per mile-decline as trips get longer, we needed to account for the difference in the distribution of trips by trip length from the concentrated and unconcentrated airports.
@Barriers to Competition in the Airline Industry (GAO/l’-RCED-89-66, Sept. 20,1989); Airline Competition: Effects of Airline Market Concentration and Barriers to Entry on Airfares (GAOiRCEDBl-lOI, Apr. 26,1991); and Computer Reservation Systems: Action Needed to Better Monitor the CRS Industry and Eliminate CRS Biases (GAO/RCED-92-130, Mar. 20,1992).
“Airline Competition: Options for Addressing FhmnciaI and Competition Problems (GAOR-RCED-93-62, June 1,1993).
“Airline Competition: Effects of Airline Market Concentration and Barriers to Entry on Airfares (Gfiand Medium-Sized Communities (GAO/RCED-91-13, Nov. 8,199O); and Airline Competition: Fares and Concentration at Small-City Airports (GAO/RCEDBl-U, Jan. 18,199l).
*?he sampling error is f 0.2 percent at the 9bpercent confidence level.
‘$We used a different method to adjust for distance in our 1990 study than we used in this analysis. See apP. I.
Page 6 GAO/WED-93-1’71 Airfares at Concentrated Airport.8

B-238198
Otherwise, we could be inferring that differences in fares are due to airport concentration when, in fact, they are due to the greater proportion of short-distance trips from the concentrated airports. In our previous study, we controlled for the difference in trip distances between the two . groups of airports by choosing a subgroup of the unconcentrated airports where the average trip distances were similar to those at the concentrated airports. We believe that our current approach provides a more precise adjustment. (The adjustments we made are discussed in more detail in m. I.>
When we did not adjust for distance, we found that the overall yield was 34 percent higher at 14 airports that were dominated by one or two airlines than at 35 au-ports where there was more competition (see table 1).14 In 1990, we reported that the overall yield was 27 percent higher at concentrated airports than at unconcentrated airports on the basis of our analysis of 1988 fares.
14As we did in the 1990 study, we excluded fares that were either too high or too low, including $0 fares reported for redeeming frequent-flyer credits. See app. I for a more detailed discussion of fares that we excluded.
Page 6 GAO/RCED-93-171 Airfares at Concentrated Airporta

B-238198
Table 1: Yields at 14 Concentrated Airports and Percent by Which They Differ From Overall Yield at Unconcentrated Airports
Airport Charlotte Atlanta Raleigh-Durham
Memphis Cincinnati
Yield (in Percent different from overall cents) unconcentrated yield
28.1 71.4 27.7 69.2 25.7 56.7 25.5 55.8 25.3 54.4
Pittsburgh 23.3 42.4
Nashville 23.1 40.9
Davton 21.4 30.8 I
Minneapolis/St. Paul
Salt Lake Citv
21.3 30.3
20.1 22.7
Denver 19.3 17.9 Detroit 18.9 15.2 St. Louis 18.4 12.4 El Paso 14.6 -10.7
Overalla 21.9 33.6
Note 1: The overall yield at the unconcentrated airports was 16.4 cents.
Note 2: See appendix II for sampling errors associated with the yields and percentage difference in yields.
*In comparison, the overall yield at the concentrated airports was 20.0 cents after adjusting for distance. Individual airports would be affected differently, depending on the distribution of traffic at that airport.
Source: GAO’s analysis of DOT’s data.
In 1992, Atlanta, Charlotte, Cincinnati, Memphis, and Raleigh/Durham had yields that were more than 50 percent higher than the yield at the unconcentrated airports (see table 1). At Charlotte, yields were more than 70 percent higher than at unconcentrated airports. Only El Paso airport had a lower yield than the overall yield at unconcentrated airports (see fig. 1). El Paso is dominated by Southwest Airlines, whose operation is substantially different from the other major airlines’ operations. It offers low-cost, “no frills” service and specializes in high-frequency, point-to-point flights rather than the hub-and-spoke flights provided by other major airlines.
Page 7 GAOIBCED-93-171 Airfares at Concentrated Airports

B-238198
Figure 1: Yields at 14 Concentrated Airports 30.0 Cents
$ $
$ $ $ 25.0
$ $ -----------------------------
20.0 $
$ $ $ $ ’
$
Concentrated airports
-- Overall yield at 14 concentrated airports - Overall yield at 35 unconcentrated airports
Source: GAO’s analysis of DOT’s data
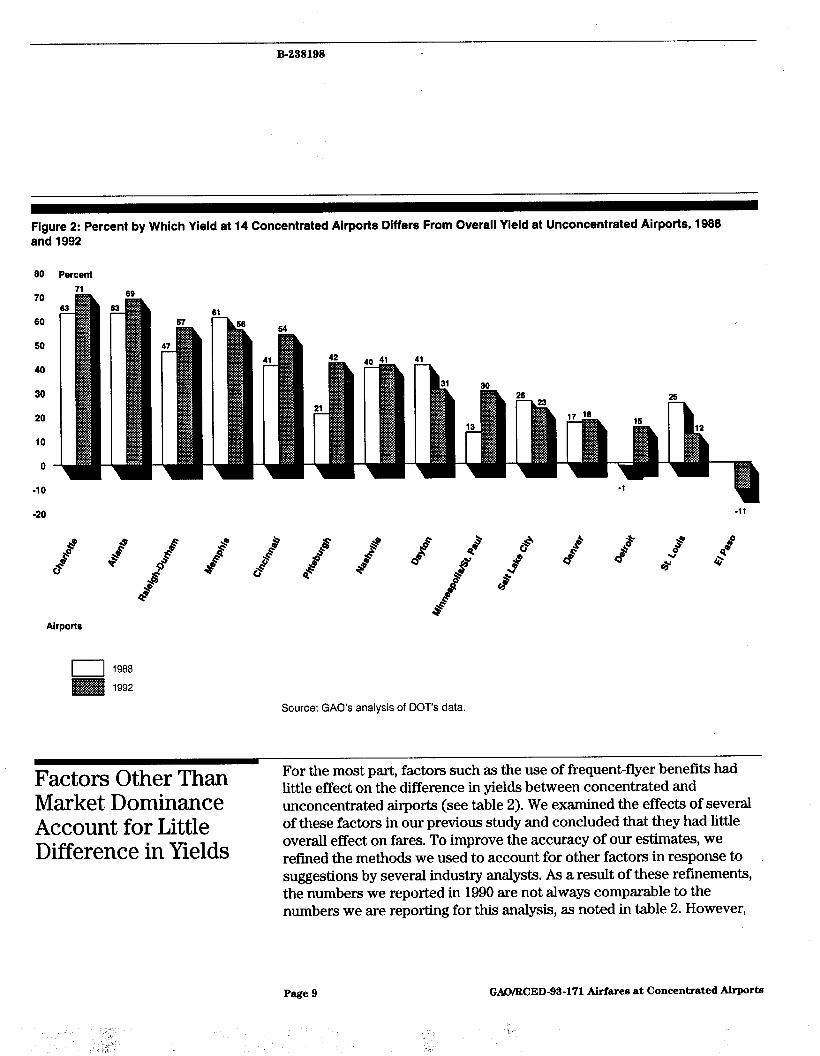
Furthermore, the difference between yields at 9 concentrated airports and the overall yield at unconcentrated airports is wider now than it was in 1988 (see fig. 2). The largest increase in yield relative to the unconcentrated airports occurred in Pittsburgh, where the yield was 21 percent higher than the yield at unconcentrated airports in 1988, while it was 42 percent higher in 1992.
Page 8 GAO/RCED-93-171 Airfares at Concentrated Airports
B-238198
Figure 2: Percent by Which Yield at 14 Concentrated Airports Differs From Overall Yield at Unconcentrated Airports, 1988 and 1992
80 Percent 71
Airports
Source: GAO’s analysis of DOT’s data.
I Factors Other Than Market Dominance
little effect on the difference in yields between concentrated and unconcentrated airports (see table 2). We examined the effects of several
Account for Little Difference in Yields
of these factors in our previous study and concluded that they had little overall effect on fares. To improve the accuracy of our estimates, we refined the methods we used to account for other factors in response to suggestions by several industry analysts. As a result of these refinements, the numbers we reported in 1990 are not always comparable to the numbers we are reporting for this analysis, as noted in table 2. However,
Page 9 GAO/WED-93-171 Airfares at Concentrated Airports
L’
B-238198
the findings from both studies are consistent. The changes in our methodology are described below.
Table 2: Differences in Yields at Concentrated and Unconcentrated Airports in 1988 and 1992
Basis for comparison All fares
Percentage of Percentage of difference in difference in
yields in 1988. yields in f992 27.2 ’ 33.6
All fares, adjusting for distanceb 21.0 22.3
Adjusting for distance and including $0 fares for frequent-flyer benefits
Including only direct or nonstop trips that did not require change of plane
c 19.8
c 27.4
Note 1: Sampling errors for all 1992 estimates are f 0.2 percent at the 95-percent confidence level. The differences in yields in 3988 were statistically significant at the .OOl level.
Note 2: We excluded $0 fares except as noted.
aOur 1988 calculations used weighted yield data. We did not weight the 1992 yields. See appendix I.
%Ve used different methods to adjust for distance. See appendix I,
cWe did not make comparable estimates for the 1988 data, although we did examine the effects of including $0 fares and including only direct trips.
Source: GAO’s analysis of DOT’s data.
Including $0 Faxes Earned To determine the effect of frequent-flyer plans on fares, we recalculated in Frequent-Flyer the yields at concentrated and unconcentrated airports including $0 fares Programs Has Little Effect and adjusting for trip distances. l6 We found that yields at concentrated
on Yield Differences airports were still 19.8 percent higher than yields at unconcentrated airports (see table 2). This finding is consistent with our 1990 analysis, which showed that the difference in yields generally stayed the same when we included $0 fares. That analysis, however, did not simultaneously adjust for distance and $0 fares. Some analysts include $0 fares because they believe that free travel earned in frequent-flyer programs should be included in calculating the average fare for travel out of an airport. We excluded $0 fares because our interest was in examining fares actually paid for individual trips. Nonetheless, frequent-flyer programs affect competition at an airport by increasing the loyalty of business passengers
16As noted in appendix I, we excluded $0 fares from our calculations, except when specifically noted. According to a DOT official. the $0 fares reoorted bv airlines mav include travel by more than one passenger. It is not possible; however, to determine-the number of passengers using a $0 ticket, according to DOT. Since we assumed that each $0 fare was used by one passenger, our calculations that include $0 fares may overestimate the yield.
Page 10 GAO/RCED-93-171 Airfares at Concentrated Airporta

B-238198
to the dominant airline, making it more difficult for new airlines to compete successfully in some markets.
Direct Service Has Small We found that the yields were 27.4 percent higher at concentrated airports Effect on Yield Differences than at unconcentrated airports when we limited our analysis to the fares
paid for direct or nonstop trips that did not require change of planes (see table 2).16 The difference in the yields at the two groups of airports is 6.2 percentage points smaller than the difference we observed when we made no adjustments. Since travelers typically prefer nonstop or direct service over connecting service, some industry analysts believe that travelers may be willing to pay more for this type of service. Our calculations, however, show that direct service has only a small effect on the fares.
We did not calculate the effect of direct service on yields for our previous study. Instead, we compared the number of coupons per traveler out of the concentrated airports with the number out of the unconcentrated airports and found virtually no difference.17 Therefore, we did not expect direct service to account for differences in yields. Our current study attempts a more direct estimation of the effect of direct or nonstop service on fares.
Industry Analysts Have Some industry analysts believe that our previous study should not have Suggested That Changing excluded 19 airports in metropolitan areas served by more than one the Airports We Analyzed airport, because these airports account for a large proportion of domestic
Would Account for Greater air travel. We do not believe it is appropriate to include these airports
Fare Differences because competition from airlines serving nearby airports might offset, to some extent, the effects of concentration. (We discuss the effect of excluding these airports in app. I.)
In addition, some observers suggested that the concentrated airports used in our previous study are mostly hubs primarily patronized by business travelers, while our comparison airports included many leisure destinations. Because fares to tourist locations tend to be lower, fares from them might be lower also. Including leisure destinations in our comparison group, therefore, might explain some of the difference in
“jWhen we included only direct or nonstop flights, the distribution of flight distances changed enough so that we did not need to adjust for trip distance.
Woupons are the ticket portions issued for individual segments of a flight. Passengers who change planes are issued a separate ticket coupon to board each plane.
Page 11 GAO/RCED-93-171 Airfares at Concentrated Airporta

B-238198
yields between the two groups of airports. We believe that because we focused on originating traffic, the fact that these places are tourist destinations should not affect our results. In fact, we would expect tourist destinations to have the same effect on travel from both concentrated and . unconcentrated airports, since passengers from both groups would be traveling to these destinations. Therefore, we made no change in our methodology on the basis of this concern.
Increases in Dominant airlines have increased their market share at 9 of the 13 airports
Concentration Led to that were concentrated in both 1933 and 1992. In some cases, airlines were able to increase their market share because competitors went out of
Higher Fares at Some business. For example, the largest increase in market share by the
Major Airports dominant airline occurred at Atlanta. There, Delta increased its market share of originating traffic by 30 percent following the shutdown of Eastern in January 1991. For the most part, the financially weakest airlines-Continental, Northwest, TWA, and USAir+xperienced decreased market shares or only modest increases at airports where they dominate (see table 3).
Page 12 GAO/WED-93-171 Airfares at Concentrated Airporta

B-238198
Table 3: Chanaes in Market Share for Dominant Air&es at Airports That Were Concentrated in 1988 and 1992
Market Market Change in share of share of market
dominant dominant share airline(s) in airline(s) in (percentage
Dominant 1988 (in 1992 (in point ’ Airport airline percent) percent) difference) Atlanta Delta Eastern 58 36 88 a +30 a
Nashville American 62 77 *15
Detroit Northwest 59 73 +14
Raleigh-Durham American 69 82 +13
Cincinnati Delta 78 88 +lO
Salt Lake City Delta 80 84 +4
Pittsburgh USAir 87 90 +3
Charlotte USAir 93 96 +3
Minneapolis/St. Paul Northwest 78 81 +3
Memphis Northwest 83 81 -2
Denver United and Continental 87 83 -4
Dayton USAir 79 72 -7
St. Louis TWA 82 75 -7
Note: Greensboro and Syracuse are not included in this table. Although they were concentrated airports in our 1990 study, they were no longer concentrated in 1992. El Paso is not included because it was not concentrated in our prior analysis. See app. I for further information.
aEastern ceased operations in January 1991.
Source: GAO’s analysis of DOT’s data.
At eight of the nine airports where concentration increased, passengers flying on the dominant airline may be paying more than passengers on competing airlines. We found the largest difference in yields between the dominant airline and its competitors at Atlanta, where Delta’s yield was 68 percent greater than that of other airlines (see fig. 3). In 1933, by comparison, Delta’s yield was 49 percent higher than its competitors in Atlanta. Dominant airlines may be charging higher fares, in part, because their operations out of hub airports may be substantially different from their competitors. For example, a dominant airline might have a larger portion of shorter flights from its hub airport than its competitors, which would incur higher costs. We do not know, however, the extent to which differences in operations affect the airlines’ costs.
Page 13 GAO/WED-93-171 Airfares at Concentrated Airports

B-238198
Figure 3: Percent by Which Dominant Airlines’ Yields Differed From Competitors’ Yields in 1988 and 1992
50 Percent
70
60
50
40
30
20
10
0
-10
Airports
Note 1: Dominant airlines that increased their market share between 1988 and 1992 are indicated with an asterisk (see table 3).
Note 2: See appendix III for the yields, percentage difference in yields, and the sampling errors associated with each for 1992. See our 1990 report for similar information for 1988.
Note 3: Yields for Eastern and Continental were combined in 1988 when both operated as subsidiaries to Texas Air. Eastern ceased operation in January 1991.
Note 4: El Paso is not included because it was not concentrated in 1988.
Source: GAO’s analysis of DOT’s data.
Page 14
.
GAO/WED-93-171 Airfares at Concentrated Airports
3

B-238198
Airlines Fly Directly to More Destinations From Concentrated Airports, but Competition on Routes Continues to Decline offered direct service to more destinations in 1992 than they did in 1985.
Direct service from Memphis remained the same, and service from Atlanta, Denver, and St, Louis declined (see fig. 4). Atlanta and Denver were both dominated by two airlines, and in both cases one of the a&es has been financially ailing during the time span of our two studies. Traffic at the Atlanta airport was dominated by Delta and Eastern in 1985. Eastern ceased operations in January 1991. Denver airport was dominated by Continental and United during the periods of both of our reviews. Continental, however, was under bankruptcy protection from December 1990 until April 1993. Similarly, St. Louis has been dominated by TWA, which is currently under bankruptcy protection.
Overall, airlines provided direct service to more destinations in 1992 than they provided in 1985.‘* Direct service includes both nonstop service to destinations and one-stop service that does not require the passenger to change planes. In 1992,1,414 locations received direct service from the 13 airports that were concentrated during both our studies. In 1988,1,359 locations were served dire&v. compared to 1,235 locations in 1985.‘O “, Nine of the 13 airports that were concentrated during both our studies I
‘“Our previous study examined changes in service at concentrated airports for the month of May from 1985 to 1988.
‘RThese numbers are slightly lower than we reported in 1990. We used different methods to calculate direct service in this report and in our previous report. These differences are explained in appendix I. Throughout this report, we have recalculated service data for 1985 and 1988 to be consistent with the method used to analyze 1992 data.
Page 16 GAO/RCED-93-171 Airfares at Concentrated Airports

B-238198
Figure 4: Number of Destinations From Concentrated Airports With Direct Scheduled Service-1985,1988, and 1992
Number of destinations with direct service
150
140
130
120
110
100
90
60
70
60
50
40
30
20
IO
0
16
Atlanta Concentrated airports
Cincinnati Dayton Detroit
Page 16 GAO/RCED-93-171 Airfares at Concentrated Airports

B-238198
Minneapolis Nashville Pittsburgh Raleigh-Durham Salt Lake City St. Louis
Note: We have recalculated the information presented for 1985 and 1988 to be consistent with the information calculated for 1992. See app. I for additional information.
Source: Back Associates, Inc.
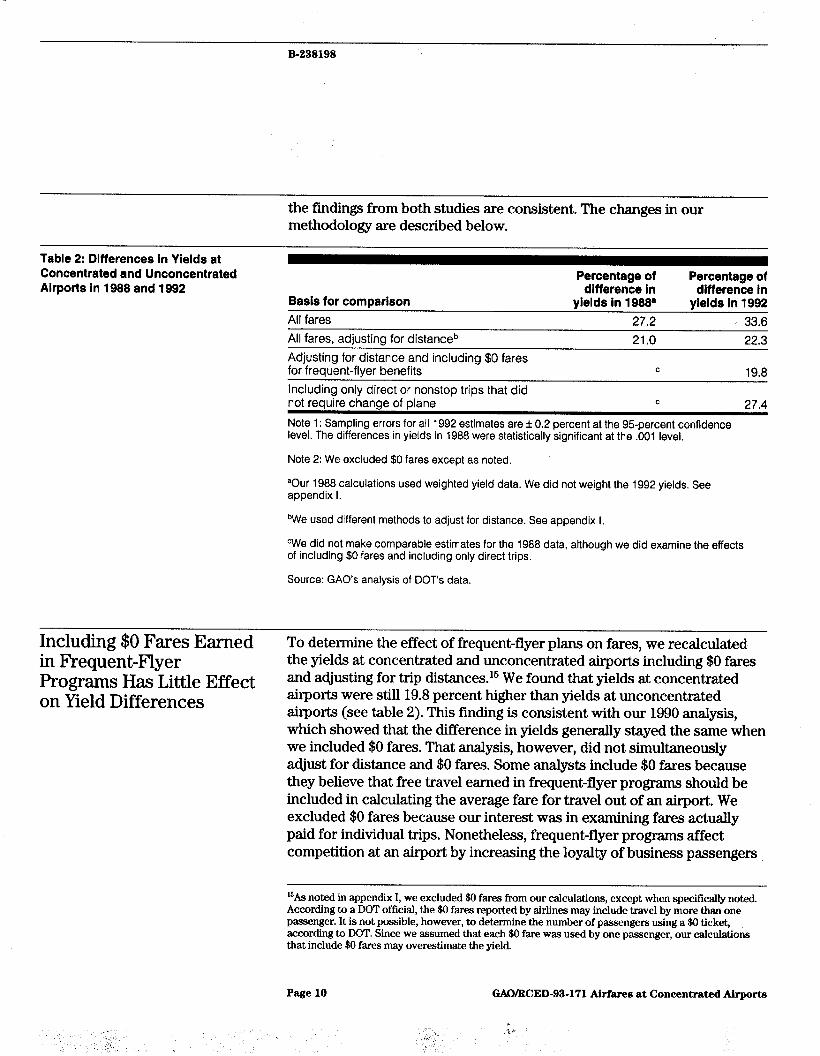
Nonetheless, since 1988 the number of destinations that can be reached by direct air service has decreased at seven concentrated airports and increased at six airports. The largest changes in direct air service occurred in Charlotte and Nashville, where the number of destinations with direct service increased by more than 30 percent. The largest decreases in direct air service during this period occurred in Dayton, Memphis, and Salt Lake City (see table 4).
Page 17 GAO/RCED-93-171 Airfares at Concentrated Airport.9
B-238198
Table 4: Number of U.S. Destinations With Direct Service From 13 Concentrated Airports During May 1988 and May 1992
Airport Nashville
1988’ 77
1992 104
Percentage change
35
Charlotte 89 119 34 Pittsburgh 123 138 12
Raleigh-Durham 79 88 11
Minneapolis/St. Paul 125 132 j 6
Cincinnati 97 101 4
Atlanta 142 140 -1
Denver 140 139 -1
St. Louis 125 121 -3 Detroit 114 110 -4
Dayton 57 53 -7
Memphis 97 88 -9
Salt Lake City 94 81 -14
Total 1.359 1.414 4
aWe have recalculated the information presented for 1988 to be consistent with the information calculated for 1992. See app. I for additional information.
Source: Back Associates, Inc.
Competition on Routes From Concentrated Airports Continues to Decrease
Overall, we found a 12-percent increase in the number of direct routes from concentrated airports that were served by only one airline from 1988 to 1992. This finding continues the trend we observed in our previous report-we estimated a E-percent increase from 1985 to 1988 in the number of routes served by one airIine.20 Furthermore, since 1985 many more destinations are served by only one airline than by competing airlines. In 1992,64 percent of the destinations from concentrated airports were served by only one airline. In 1985 and 1988,56 percent and 59 percent, respectively, of the destinations were served by only one airline (see fig. 5).
2”we have recalculated the information presented for 1986 and 1988 to be consistent with the information calculated for 19!%!. See app. I for additional information.
Page 18 GAO/WED-93-171 Airf’ares at Concentrated Airports

B-238198
Figure 5: Percent of Direct Routes From Concentrated Airports Served by Percent of direct routea 1,2,3,and4or 1988, and 1992
More Airlines-l 985, 166
so
60
70
60
60
40
30
20
10
0
1965 1965 Years Years
1966 1992
I Routes served by 4 or n-tore airlines
Routes served by 3 airlines Routes served by 2 airlines
Routes served by 1 airline
Note: We have recalculated the information presented for f985 and 1988 to be consistent with the information calculated for 1992. See app. I for additional information.
Source: Back Associates, Inc.
Another indication that competition on routes from concentrated airports has declined since 1985 is the overall decrease in the number of routes served by more than one airline. The number of destinations served by three or more airlines fell from 19 percent to 14 percent to 11 percent for 1985,1988, and 1990, respectively. (App. IV shows the change in the number of routes served by one, two, three, and four or more airlines at each concentrated airport.)
When we examined the change in the number of airlines serving routes from each concentrated airport, we found that, in some cases, the increase in the number of routes served by one airline may indicate an increase in
Page 19 GAO/WED-93-171 Airfares at Concentrated Airporta

B-239198
service by that airline at its hub, which would benefit travelers from that airport. For example, one airline served 33 more routes from Charlotte in 1992 than in 1983, while the number of routes served by two or more airlines decreased by 3. Demand for service on some of these new routes may not justify service by more than one airline. At other locations, such as Atlanta and Minneapolis, the increase in the number of routes served by one airline has coincided with a relatively large decrease in the number of competitive routes. Therefore, even though a relatively small change has occurred in the total number of direct routes at those airportqzl there is much less competition on those routes (see table 5).
Table 5: Net Change in the Number of Competitive Routes and Those With No Competition-l 988 to 1992
Airport Atlanta Charlotte Cincinnati
Dayton Denver
Detroit
Memphis
Net change Net change Net change Net change in number in number in number in number
of routes of routes of routes of with no with 2 or 3 with 4 or competitive
competition airlines more airlines routes +23 -15 -10 -25 +33 -2 -1 -3 +4 -1 +l 0 +5 -9 0 -9 +l +2 -4 -2 - +7 -4 -7 -11
-7 -2 0 -2
Minneapolis/St. Paul +19 -14 +2 -12
Nashville +26 +3 -7 +l
Pittsburgh Fialeiah-Durham
+8 +8 -1 +7 +13 -3 -1 -4
Salt Lake City -15 +3 -1 +2
St. Louis -9 +2 +3 t5
Overall change +108 -32 -21 -53
Note 1: The net change in the number of competitive routes is a summation of the change in routes served by 2,3, and 4 or more airlines.
Note 2: We have recalculated the information presented for 1985 and 1988 to be consistent with the information calculated for 1992. See app. I for additional information.
Source: Back Associates, inc.
Wrom 1988 to 1992, the number of direct flights from Atlanta declined from 142 to 140 (a l-percent decrease), and the number of flights from Minneapolis increased from 126 to 132 (a 6percent increase).
Page 20 GAO/RCED-93-171 Airfares at Concentrated Airports

B-238198
We do not know the specific effect that reduced competition on some routes has had on fares from concentrated airports. Our analysis has examined the effect of airport dominance on airfares, independent of competition on specific routes. In other work, however, we found that an airline’s market share on a route had a statistically significant effect on fares for that route. For each lo-percent increase in route market share, fares were estimated to be 1 percent higher. In addition, we found that when an airline has a hub at either the originating or destination airport, fares are higher for routes that include those airportsn
Conclusions lower air fares. Deregulation also allowed airlines to reconfigure their route networks into hub-and-spoke systems, and as a result some airports have become dominated by one or two airlines. Air fares for flights from these relatively concentrated airports are substantially higher than fares for travel from airports where there is more competition. While factors other than airport dominance explain some of the fare differential, most of the difference appears to reflect a lack of effective competition.
Although, overall, passengers can fly to more destinations directly from concentrated airports than they did in 1988, travellers have fewer choices among airlines as more routes are being served by a single airline.
If the current financial distress of the airline industry leads to additional failures among the major airlines, competition could be reduced and there could be more airports and more routes dominated by only one or two airlines. Less competition, in turn, could lead to higher fares and/or reduced service at some airports. We believe that the solutions to the industry’s problems lie in taking steps to promote and protect competition in the airline industry and eliminating barriers to successful competition. We have addressed these issues in previous work and plan to issue a report summarizing this work and offering our recommendations later this year. Eliminating barriers to successful competition may be especially important since a number of new airlines are starting up operations and could become potential competitors of the existing airlines. The success of these new airlines could bode well for the future of competition in the industry.
%4irline Competition: Effects of Airline Market Concentration and Barriers to Entry on Airfares (GAO/RCEDBblOl, Apr. 26, 1991).
Page 21 GAO/BCED-93-171 Airfares at Concentrated Airports

B-238198
Agency Comments We met with representatives from DOT’S Office of the Secretary and the Research and Special Programs Administration to discuss our findings on airline fares and concentration levels. They generally concurred with the information presented. However, as requested, we did not obtain written agency comments on the draft report.
As agreed with your offices, unless you publicly announce its contents earlier, we plan no further distribution of this report until 15 days after the date of this letter. At that time, we will send copies to the Secretary of Transportation and to other interested parties.
We performed our work between July 1992 and June 1993 in accordance with generally accepted government auditing standards. If you have any questions about this report, please contact me at (202) 512-2834. Major contributors to this report are listed in appendix V.
Kenneth M. Mead Director, Transportation Issues
Page 22 GAWRCED-93-171 Airfares at Concentrated Airports

Page 23 GAWRCED-93-171 Airfares at Concentxated Airporta
3 I.., h,

Contents
Letter Appendix I Objectives, Scope, and Methodology
Appendix II Yields and Sampling Errors for Concentrated and Unconcentrated AirpOrts
Data Airport Selection AldpiS
1
28 28 30 33 38
Appendix III Yields and Sampling Errors for Dominant and Nondominant Airlines at Concentrated Airports Appendix IV Number of Routes Served by 1,2,3, and 4 or More Airlines From Concentrated Airports, 1988 and 1992
40
41
Appendix V Major Contributors to This Report
43
Page 24 GAO/WED-93-171 Airfares at Concentrated Airports

Contents
Related GAO Products 44
Tables Table 1: Yields at 14 Concentrated Airports and Percent by Which They Differ From Overall Yield at Unconcentrated Airports
Table 2: Differences in Yields at Concentrated and Unconcentrated Airports in 1988 and 1992
Table 3: Changes in Market Share for Dominant Airlines at Airports That Were Concentrated in 1988 and 1992
Table 4: Number of U.S. Destinations With Direct Service From 13 Concentrated Airports During May 1988 and May 1992
Table 5: Net Change in the Number of Competitive Routes and Those With No Competition-1988 to 1992
Table I. 1: Criteria for Excluding Yields Table 1.2: Concentrated and Unconcentrated Airports Used in the
Previous and Current Studies Table 1.3: Market Shares at Concentrated Airports, by Total
Passenger Traffic and Originating Traffic Table 1.4: Comparison of Differences in Yields at Concentrated
and Unconcentrated Airports When Multiple Airport Cities Are Excluded and Included in the Analysis
Table II. 1: Yields and Sampling Errors for the 14 Concentrated Airports and Percent Different From OveraIl Unconcentrated Yield
Table 11.2: Yields and Sampling Errors for the 35 Unconcentrated AilpOrts
Table IV.l: Number of U.S. Destinations to Which Only One Airline Flew Directly From 13 Concentrated Airports, 1988 and 1992
Table lV.2: Number of U.S. Destinations to Which Two Airlines Flew Directly From 13 Concentrated Airports, 1988 and 1992
Table IV.3: Number of U.S. Destinations to Which Three Airlines Flew Directly From 13 Concentrated Airports, 1988 and 1992
Table IV.4: Number of U.S. Destinations to Which Four or More Airlines Flew Directly From 13 Concentrated Airports, 1988 and 1992
7
10
13
18
20
29 31
33
36
38
38
41
41
42
42
Figures Figure 1: Yields at 14 Concentrated Airports 8 Figure 2: Percent by Which Yield at 14 Concentrated Airports 9
Differs From Overall Yield at Unconcentrated Airports, 1988 and 1992
Page 26 GAO/WED-93-171 Airfares at Concentrated Airporta

Content9
F’igure 3: Percent by Which Dominant Airlines’ Yields Differed from Competitors’ Yields in 1988 and 1992
Figure 4: Number of Destinations From Concentrated Airports With Direct Scheduled Service-1985,1988, and 1992
Figure 5: Percent of Direct Routes F’rom Concentrated Airports Served by 1,2,3, and 4 or More Airlines-1985,1988, and 1992
14
16
19’
Abbreviations
DOT Department of Transportation GAO General Accounting Office TWA Trans World Airways
Page 26 GAO/WED-93-171 Airfares at Concentrated Airport8
-2 C’

Page 27 GAO/WED-93-171 Airfares at Concentrated Airports
_1 2’

Appendix I
Objectives, Scope, and Methodology
Data
This analysis was designed to update the findings of our 1990 study of air fares at concentrated airports. Our objectives were to (1) compare fares at major airports served primarily by one or two airlines with fares at airports where there is more competition; (2) assess factors other than market dominance that could explain any differences in fares; and (3) determine changes in concentration since our previous study;’ and (4) assess changes in the level of service at airports dominated by one or two airlines.
In our earlier study, we analyzed yields-the fare per passenger mile-from January 1985 through June 1989. For this update, we analyzed yields from April 1991 through March 1992, the most recent data available at the time of our review. We used the Origin and Destinations Survey data collected quarterly by the Department of Transportation (DOT) in its lO-percent sample of airline tickets to make our yield comparisons. The airlines report detailed information on every 10th ticket to DOT and, after processing the data, DOT makes the data available for public use. The sampling errors for our analysis of these data are given throughout the letter or in appendixes.
We excluded yields that were either too high or too low using criteria to exclude yields similar to criteria that we developed for our previous study (see table I. 1). Among the yields we excluded were $0 fares reported for redeeming frequent-flyer coupons.
‘Airline Competition: Higher Fares and Reduced Competition at Concentrated Airports (GAO/RCED-90402, July l&1990).
Page 28 GAOiRCED-93-171 AirPares at Concentrated Airports

Appendix I Objectives, Scope, and Methodology
Table 1.1: Criteria for Excluding Yields Exclude if yield is
less than greater than Mileage category cents/mile cents/mile l-99 8 300
loo-199 4 255
200-299 3 160
300-399 3 '125
400-499 3 115
500-699 3 105
700-999 3 80
l,OOO-1,299 3 70 1,300-1,599 3 60
1,600-1,899 3 55
1.900andabove 3 45
Our prior study used fare data spanning 5 years so that we could evaluate trends in fares at concentrated airports over time as well as differences between concentrated and unconcentrated airports. We therefore weighted the fare data to take into account changes in the distribution of traveler destinations, changes in the proportions of one-way and round-trip tickets in the sample, and changes in the proportions of trips taken on the dominant and nondominant airlines. We wanted changes in yields to reflect fare changes and not changes in the trips taken. Therefore, for each combination of fare type (one-way or round-trip), type of airline (dominant or nondominant), and destination, we calculated the average yield for each quarter. We weighted the average yield for each combination according to the average amount of traffic for that combination over the 18 quarters. For example, if one-way trips from Denver to Chicago on United Airlines averaged 0.1 percent of all trips on United over the 18 quarters, we weighted the results for each quarter so that the proportion was always the same.
While this weighting is appropriate for the previous study, it was not necessary for this update since we were not analyzing changes over time. All estimates that we made using 1992 data, therefore, are not weighted.
We also used route data from the automated version of the Official Airline Guide provided by Back Associates, Inc., to examine changes in the levels of service at concentrated airports. We used route data for scheduled
Page 29 GAO/WED-93-171 Airfares at Concentrated Airport8

Appendix I Objectives, Scope, and Methodology
airline service for the month of May 1992. To redo analyses of service from our previous report, we used data for May 1985 and May 1988.
Airport Selection We used the same criteria for selecting airports that we used in our previous study. We selected airports from among the 75 busiest airports (by number of enplaning passengers) in the United States during 1991. We excluded 19 airports in metropolitan areas served by more than one major commercial airport and 7 airports in Alaska, Guam, Hawaii, and Puerto Rico. We excluded airports in the Baltimore/Washington, Chicago, Dallas/Fort Worth, Houston, Los Angeles, New York City, and San Francisco areas because competition from airlines serving the other airport(s) in these cities might offset, to some extent, the effects of concentration. We excluded the other seven airports because of their unusual geographic characteristics.
At 14 of the 49 remaining airports, one or two airlines handled most of the enplaning passengers. We defined these airports as concentrated if either one airline handled at least 60 percent of the passengers enplaning at that airport or two airlines handled at least 85 percent.2 For our 1990 report, 15 airports met out definition of concentrated and 38 remained in our comparison group.
For the most part, the same airports were included in our 1990 and current analyses (see table 1.2). Changes in market share and overall levels of airport traffic since our earlier study, however, led us to drop several airports from our analysis or change their concentration status:
l Hancock International Airport in Syracuse was concentrated in our earlier analysis because USAir handled 61 percent of the enplaning passengers. In our current analysis, Syracuse was unconcentrated because USAir handled 53 percent of the enplaning passengers.
l The airports at Greensboro (concentrated in our earlier analysis) and Birmingham, Little Rock, Louisville, and Richmond (unconcentrated in our earlier analysis) were not among the nation’s 75 busiest airports during the period analyzed. They were excluded from this analysis.
. The airport at El Paso was not concentrated in our previous analysis. However, it was concentrated in 1991, when Southwest handled 60 percent of the enplaning passengers.
we defined Denver as concentrated, even though two airlines handled 84 percent of the enplaning tG3fiiC.
Page 30 GAO/WED-93-171 Airfares at Concentrated Airport8
a
i

Appendix I Objectives, Scope, and Methodology
Table 1.2: Concentrated and Unconcentrated AirDOI’tS Used in the Previous and Current Studies
Airport Airport status in previous study
Concentrated Unconcentrated Airport status in current study Concentrated Unconcentrated
Atbuquerque Atlanta
Austin Birminahama
X .
X .
X .
X
Boston Buffalo
X .
X .
Charlotte
Cincinnati
Cleveland Columbus
X .
X .
X .
X .
Dayton Denver
X .
X .
Detroit X .
El Paso Ft. Lauderdale Ft. Mvers
X .
X .
X .
Greensboro/ Highpoint/ Winston-Salema Hartford
X X .
Indianapolis
Jacksonville
Kansas City Las Veoas
Little Rocka ILouisvillf9
Memphis
Miami
Milwaukee Minneapolis/St. Paul
Nashville
New Orleans Norfolk/ Virginia Beach
Oklahoma City
Omaha
Orlando
Philadelphia Phoenix
X .
X .
X .
X .
X X
.
.
.
.
.
.
.
.
.
(continued)
Page 31 GAO/RCED-93-171 Airfares at Concentrated Airports

Appendix I Objectives, Scope, and Methodology
Airport Pittsburgh
Portland
Airport status in previous study Airport status in current study Concentrated Unconcentrated Concentrated Unconcentrated
X .
X .
Providenceb
Raleigh-Durham
.
X .
Reno X .
Richmonda
Rochester X
X .
Sacramento X .
St. Louis Salt Lake Citv
X .
X .
San Antonio X .
San Dieao X .
Seattle Syracuse
X .
X .
Tamoa X .
Tucson X .
Tulsa
West Palm Beach X .
X .
Total 15 38 14 35
aNot among busiest 75 airports in our current analysis.
bNot among busiest 75 airports in previous analysis.
Some industry analysts suggested that the market share of originating passengers and not the share of total enplanements should be used to decide whether an airport is concentrated. An airline using an airport as a hub will have many more enplaning passengers than originating ones because of the large number of travelers who are transferring at that airport. We chose enplanements as the basis for defining dominance because we believe that it better reflects the dominant presence of an airline at its hub.
Nonetheless, we analyzed data on originating enplanements at the concentrated airports and found that the same airlines dominate these airports. At the 14 concentrated airports, the dominant airline(s) accounted for more than 50 percent of the originating traffic, and their market share was always substantially larger than that of the next largest airline serving the airport (see table 1.3).
Page 32 GAO/RCED-93-171 Airfares at Concentrated Airport.8

Appendix I Objectives, Scope, and Methodology
Table 1.3: Market Shares at Concentrated Airports, by Total Passenger Traffic and Originating Traffic Percent
originating traffic of
Percent Percent next total originating dominant
Airport Dominant airline(s) enplanements traffic only Next most dominant airline airline Atlanta Delta 88 71 American ’ 6 Charlotte USAir 96 79 Delta 8
Cincinnati Delta 88 70 USAir 9 Dayton USAir 72 51 Delta 13
Denver United 46 40 Delta 8
Continental 37 31 Detroit Northwest 73 57 American 10 El Paso Southwest 61 58 American 17
Memphis Northwest 81 56 Delta 22
Minneapolis/St. Paul Northwest 81 67 United 8 Nashville American 77 56 Southwest 11 Pittsburgh USAir 90 73 American 7 Raleigh-Durham American 82 55 USAir 22
Salt Lake City Delta 84 60 United 10 St. Louis TWA 75 50 Southwest 15
Source: GAO’s analysis of DOT’s data.
Analysis To address the first objective, we contrasted trends in yields on routes from the 14 concentrated airports with yields on routes from the comparison group of 35 unconcentrated airports. We did not include in our analyses passengers who did not pay a fare, such as travelers using frequent-flyer coupons, except as specifically noted.
Adjustment Made for Differences in Distance FlOVVIl
To adjust for differences in trip distance between the two groups of airports in our previous study, we compared yield changes at the 15 concentrated airports with yield changes at a subset of our comparison group of airports; this subset excluded airports where average trip lengths were much longer than those of the concentrated airports. We excluded 16 unconcentrated airports with average trip distances greater than 900 miles, leaving 22 airports in our comparison group.
Page 33
6 .’
GAO/WED-93-171 Airfares at Concentrated Airport8
a

Appendix I Objectives, Scope, and Methodology
For this study, we changed the method that we used to adjust for distance in response to interviews with analysts at the Air Transport Association of America and Dr. Steven A. Morrison, Northeastern University, in which they pointed out that part of the difference in yields between the airports is due to the distribution of trip lengths flown from concentrated and unconcentrated airports. We found that concentrated airports had a larger proportion of passenger miles flown on flights of less than 1,000 miles than the other group of airports. It was necessary, therefore, to adjust the data to account for this situation because shorter trips spread fixed costs over fewer miles so that yields are generally higher for shorter flights than longer ones.
To adjust the data for this situation, we first grouped tickets into 21 distance categories on the basis of the one-way straight-line miles between the origin and destination airports. We established 20 categories of lOOmile intervals for flights up to 2,000 miles and 1 category for flights exceeding 2,000 miles. We then created concentrated and unconcentrated distributions of total miles flown, by grouping tickets into these distance categories.
Within each distance category, we calculated the yield for concentrated airports as the ratio of the total revenue to the total miles flown by passengers on tickets in that category as follows:
Concentrated revenue Yield = Concentrated miles flown
Then we multiplied this concentrated yield estimate by the total miles flown from the unconcentrated airports on tickets in that category. This adjusted revenue estimates the revenue that airlines at concentrated airports would have received had they flown trips that were the same distances as trips flown from the unconcentrated airports. We calculated an adjusted revenue for each distance category, and then summed them, as follows:
Adjusted revenue = Yield x Unconcentrated miles flown
This calculation gave an estimate of the total revenue the airlines serving concentrated airports would have received, given their yields, had they flown flights with the same distribution of distances as at the unconcentrated airports.
Page 34 GAO/RCED-93-171 Airfares at Concentrated Airports

Appendix I Objectives, Scope., and Methodology
We then divided the total adjusted revenue by the total miles flown from the unconcentrated airports, to estimate the concentrated yields on the basis of the unconcentrated airports distribution of miles flown, as follows:
Adjusted Total adjusted revenue yield = Total unconcentrated miles flown
To estimate the variance of this adjusted concentrated yield, we assumed that the miles flown from unconcentrated airports-within each distance category and overall-were constant. When comparing the yields between concentrated and unconcentrated an-ports using this adjusted concentrated yield, we made the same assumption in estimating the variance for the unconcentrated yield.
Analysis of Other Factors That Could Affect Yield Differences
To better assess how concentration affects yields, we analyzed several factors in addition to market dominance-our second objective. These factors included the increased ability of passengers to receive direct service at concentrated hub airports and to earn and use frequent-flyer benefits at these airports, which could lead to higher fares at concentrated airports. Where possible, we also adjusted for trip distance when we estimated the effect that these factors had on yields.
To analyze the effect that differences in quality of service had on yields, we created new comparison groups comprised of routes that had only a single stop between the journey’s origin and its destination city or two stops for the round-trip. We compared yields at the concentrated and the unconcentrated airports using these new data. We analyzed the effect of frequent-flyer plans on yields by including all $0 yields.
We identified these factors and obtained suggestions for analyzing their effect from aviation analysts at the Air Transport Association of America and Steven A. Morrison, Northeastern University.
Effect of Excluding Multiple Airport Cities
Some industry analysts believe that our previous study should not have excluded the 19 airports in metropolitan areas served by more than one airport, because these airports account for a large proportion of domestic air travel. Nine of these airports were concentrated (Baltimore/Washington, Dallas/Fort Worth, Dallas/Love Field, WashingtonDulles, Houston Intercontinental, Houston/Hobby, Midway,
Page 35 GAO/WED-93-171 Airfares at Concentrated Airports

Appendix I Objectives, Scope, and Methodology
O’Hare, and San Jose), and 10 airports were unconcentrated (Burbank, New York/Kennedy, New York/La Guardia, Los Angeles, Newark, Oakland, Ontario, San Francisco, Santa Ana, and Washington National).
We do not believe it is appropriate to include these airports because competition from airlines serving nearby airports might offset, to some extent, the effects of concentration. Nonetheless, to better understand the effect these airports have on yields, we added them to our original groups of concentrated and unconcentrated airports and then calculated yield differences at the two new groups of 23 concentrated and 45 unconcentrated airports. We also analyzed the effects of other factors on the two new groups (see table 1.4). Other analysts we spoke with believed that including airports in metropolitan areas served by more than one airport along with the other factors would account for nearly all the difference in yields between concentrated and relatively unconcentrated airports. For the most part, however, competition from nearby airports appears to be responsible for a 3- to 7-percentage point difference in yields at concentrated airports.
Table 1.4: Comparison of Differences in Yields at Concentrated and Unconcentrated Airports When Multiple Airport Cities Are Excluded and Included in the Analysis
Percentage of Percentage of difference in yields difference in yields
when multiple airport when multiple airport Basis for comparison cities excluded cities included All fares 33.6 f 0.2 29.5 f 0.1
All fares, adjusting for distance 22.3 k 0.2 15.7 k 0.1
Adjusting for distance and including $0 fares for frequent-flyer benefits 19.8 f. 0.2 14.1 fO.l
Including only direct or nonstop trips that did not require change of plane 27.4 + 0.2 24.3 + 0.1
Note 1: Sampling errors are calculated at the 9.5percent confidence level.
Note 2: We excluded $0 fares except as noted.
Source: GAO’s analysis of DOT’s data.
Analysis of Changes in Concentration
To determine changes in market concentration since our previous study-our third objective-we compared changes in the dominant airline’s share of enplaning traffic at the 13 airports that were concentrated in 1938 and 1992.3 To further understand the effects of
3E1 Faso was concentrated only in 1992. Greensboro and Syracuse were concentrated only in 1988.
Page 36 GAO/RCED-93-171 Airfares at Concentrated Airports

Appendix I Objectives, Scope, and Methodology
market dominance, we compared the yields earned by the dominant airline at each concentrated airport with the yields earned by the other airlines serving the airport. We compared these differences in yields at the airports that experienced increased market concentration from 1988 to 1992.
Analysis of Changes in Air To address our fourth objective-assessing changes in service levels at I Passenger Service at concentrated airports-we examined trends in the number of U.S. Concentrated Airports destinations with direct, scheduled service from the concentrated airports
and the number of airlines competing for traffic on direct routes from these airports. Direct service includes both nonstop service to destinations and service with one stop that does not require the passenger to change planes. We assessed changes in service levels for the 13 airports that were concentrated during the years analyzed for our previous and current studies.
Our previous study assessed changes in service levels for the month of May from 1985 to 1933. For the current study, we added service level data for the month of May 1992. We used different methods to calculate direct service in this report and in our previous report to obtain a more accurate count of the number of airlines serving individual routes. In our previous report, we counted routes flown under code-sharing agreements by an airline other than the one listed in the Official Airline Guide as if they were flown by the airline listed in the guide.4 For this update, however, we counted code-shared routes based on the airline that actually served the route. Throughout this report, we have recalculated service data for 1985 and 1988 to count routes and measure competition based on the airlines that actually served code-shared routes. As a result of our recalculations, the numbers we report for 1985 and 1988 were usually slightly lower than the numbers included in our 1990 study.
41n a code-sharing agreement between two airlines, a smaller commuter airline uses the same two-letter airline code as the larger airline so that a connecting Bight between the two airlines appears to the passenger to be a change of planes on the same airline. The purpose of the agreements is to deliver passengers to the larger airline’s flights, allowing the larger airline to support flights to a wider range of destinations.
Page 37 GAO/RCED-93-171 Airfares at Concentrated Airports
, I,: ., .’ ’

Appendix II
Yields and Sampling Errors for Concentrated and Unconcentrated Airports
Table 11.1: Yields and Sampling Errors for the 14 Concentrated Airports and Percent Different From Overall Unconcentrated Yield
Percent different from overall Sampling error
Sampling error unconcentrated for percent Airport Yield (in cents) for yield (in cents) yield difference Atlanta 27.7 zfzOo.078 69.2 M.5 Charlotte 28.1 i0.174 71.4 fl.1 Cincinnati 25.3 M.129 54.4 %I.8 Dayton 21.4 ztO.149 30.8 da.9 Denver 19.3 a.054 17.9 a.3 Detroit 18.9 HI.057 15.2 a.4 El Paso 14.6 M.056 -10.7 XI.4 Membhis 25.5 H.149 55.8 L-o.9 Minneapolis/St. Paul 21.3 zHI.068 30.3 HI.4 Nashville 23.1 M.ll3 40.9 &Of7 Pittsburah 23.3 THI.107 42.4 a.7 Raleigh-Durham 25.7 ztO.152 56.7 zto.9 Salt Lake City 20.1 rto.104 22.7 XI.6 St. Louis 18.4 so.063 12.4 M.4
Overall 21.9 M.024 33.6 Note: Sampling errors were calculated at the 95percent confidence level.
a.2
Source: GAO’s analysis of DOT’s data.
for the 35 Unconcentrated. Airports (Yields in cents) Airport Yield Sampling error Albuauerauea 14.5 fo.053
Austina 16.7 rto.069 Rnhvl 17.2 MO.046
Buffalo 20.4 H.131
Cleveland 19.5 MO.084
Columbus 19.2 koo.105
Fort Lauderdale Fort Myers
Hartford
15.6 SO68
15.0 iO.103
17.7 ztO.077
Indianapolis 17.7
Jacksonville 21.9
Kansas City 16.0
ti.073 IKI.155
HI.054 (continued)
Page 38 GAO/RCED-93-171 Airfares at Concentrated Airports
3 i”
‘.

Appendix II Yields and Sampling Errors for Concentrated and Unconcentrated Airports
(Yields in cents) Airport Las Vegas
Yield Sampling error 13.6 iO.045
Miami 15.3 M.053
Milwaukee
New Orleans
18.5 kO.089
17.7 zfzO.072
Norfolk 20.1 ztIO:t37
Oklahoma City8 17.5 x).076
Omaha
Orlando
16.8 M.099
18.3 fl.077
Philadelphia 18.9 a.058
Phoenixa 12.8 M.029
Portland 15.6 M.069
Providence
Renoa
17.2 M.lll
14.8 Ito.095
Rochester 21.7 M.152
Sacramentoa 13.6 XI.060
San Diegoa San Antonioa
12.8 zfzOo.037 15.1 rto.057
Seattle 14.6 M.043
Syracuse Tampa
19.4 z!zOo.147
17.8 HI.068
Tucson 15.0 M.093
Tulsaa
West Palm Beach
18.5 M.089
16.1 M.080
Overall 16.4 a.012
Note 1: Sampling errors were calculated at the 95-percent confidence level.
Note 2: The overall yield at the unconcentrated airports was 14.5 cents in our previous study and 16.4 cents in our current study.
%outhwest, a low-cost airline, has at least 20 percent of the market share at this airport.
Source: GAO’s analysis of DOT’s data.
Page 39 GAOIBCED-93-171 Airfares at Concentrated Airports

Appendix III
Yields and Sampling Errors for Dominant and Nondominant Airlines at Concentrated Airports
Airport Atlanta Charlotte
Yield and Yield and Percent sampling error for sampling error for difference
dominant nondominant and sampling airline(s) (in cents) airlines (in cents) error
30.8 f 0.094 18.3 f 0.109 67.9 f 1.125
30.4 f 0.210 20.7 f 4 0.260 7.0 f 2.107 Cincinnati 25.4 f 0.142 24.7 rt 0.302 2.6 fl.384 Dayton 24.2 f 0.224 19.1 rt 0.191 26.6 f 1.719 Denver 20.7 ic 0.087a 18.3 f0.106 12.ga f 0.809
18.2 rt 0.085b -0.5b f 0.742 Detroit 20.6 -I: 0.083 16.2 5~ 0.069 27.1 f 0.744 El Paso 13.5 f 0.030 15.9f0.113 -14.9 z!z 0.635 Memphis 25.1 f 0.197 26.1 f 0.227 -3.7 f 1.129 Minneapolis/St. Paul 22.9 f 0.086 17.1 f 0.097 34.1 H.911 Nashville 24.6 + 0.156 20.7 kO.157 18.8 k 1.175 Pittsburah 25.3 + 0.133 17.7 * 0.159 42.8 f 1.485 Raleigh-Durham 25.4 f 0.186 26.1 rt 0.261 -3.0 f 1.202 Salt Lake Citv 21.6 f 0.135 16.8 + 0.145 28.6 zt 1.365
St. Louis 19.6 rt 0.095 16.8 + 0.079 16.8 f 0.784
Note: Sampling errors were calculated at the 95-percent confidence level.
aEstimate for United Airlines.
bEstimate for Continental Airlines.
Source: GAO’s analysis of DOT’s data.
Page 40 GAO/RCED-93-171 Airfares at Concentrated Airport.9
‘,? .“. 1, “ip- q a”/ c.;i

Appendix IV
Number of Routes Served by 1,2,3, and 4 or More Airlines From Concentrated Airports, 1988 and 1992
Table IV.1 : Number of U.S. Destinations to Which Only One Airline Percentage Flew Directly From 13 Concentrated Airport 1988 1992 change 19891992 Airports, 1988 and 1992 Atlanta 55 78 42
Charlotte 58 91 57
Cincinnati 61 ii5 7
Dayton 31 36 16
Denver 68 69 1
Detroit fin 67 12
Memphis 78 71 -9
Minneapolis/St. Paul 70 89 27
Nashville A7 7.1 55
Pittsburgh 86 94 9
Raleigh-Durham Salt Lake Citv
45 58 29 67 A7 -24
St. Louis 82 73 -11
Total 803 911 13 Source: Back Associates, Inc.
Table IV.2: Number of U.S. Destinations to Which Two Airlines Flew Directly From 13 Concentrated Airports, 1988 and 1992
Airport 1988 Atlanta 50
Percentage 1992 change 1988-1992
A6 -8
Charlotte 26 24 -8
Cincinnati 23 26 13
Davton 31 11 -48
Denver 45 39 -13
Detroit 26 26 0
MemDhis 15 1A -7
Minneapolis/St. Paul 38 26 -32
Nashville 21 21 0
Pittsburah 25 33 32 Raleigh-Durham 22 23 5
Salt Lake City
St. Louis
Total Source: Back Associates, Inc.
21 24 14
29 29 0
362 342 -6
Page 41 GAO/RCED-93-171 Airfares at Concentrated Airport8
2 8: I

Appendix IV Number of Boutee Served by 1,2,3, and 4 or More Airlines From Concentrated Airports, 1988 and 1992
Table IV.3: Number of U.S. Destinations to Which Three Airlines Flew Directly From 13 Concentrated Airports, 1988 and 1992
Airport 1988 Atlanta 22
Charlotte 3
Percentage 1992 change 1988-1992
11 -50
3 0 Cincinnati 10 6 -40
Dayton 3 4 33 Denver 13 21 62 Detroit 16 12 -25
2 1 -50 Memphis Minneapolis/St. Paul 14 12 -44
Nashville 5 8 60
Pittsburah 9 9 0 Raleigh-Durham 9 5 -44
Salt Lake City 8 8 0
St. Louis 12 14 17
Total 126 114 -10 Source: Back Associates, Inc.
Table IV.4: Number of U.S. Destinations to Which Four or More Airlines Flew Directly From 13 Concentrated Airports, 1988 and 1992
Airport 1988 Atlanta 15
Percentage 1992 change 1988-l 992
5 -67
Charlotte 2 1 -50
Cincinnati 3 4 33
Dayton 2 2 0
Denver 14 10 -29
Detroit 12 5 -58 Memphis 2 2 0
Minneapolis/St. Paul 3 5 67
Nashville 4 2 -50 Pittsburah 3 2 -33
Raleigh-Durham 3 2 -33 Salt Lake Citv 3 2 -33
St. Louis 2 5 150
Total 68 47 -31
Source: Back Associates, Inc.
Page 42 GAO/WED-93-171 Airfares at Concentrated Airports

Appendix V
Major Contributors to This Report
Resources, John H. Anderson, Jr., Associate Director
Community, and Francis P. Mulvey, Assistant Director Teresa F. Spisak, Assignment Manager
Economic Christopher H. Knauer, Evaluator-in-Charge
Development Thomas F. Noone, Senior Systems Analyst Sara-Ann W. Moessbauer, Staff Operations Research Analyst
Division, Washington, D.C.
Page 43 GAO/FWED-93-171 Airfares at Concentrated Airport8

Related GAO Products
Computer Reservation Systems: Action Needed to Better Monitor the CRS Industry and Eliminate CRS Biases (GAo/RcED-92-130, Mar. 20,1992).
Airline Competition: Fares and Concentration at Small-City Airports (GAO/F&TED-91-61, Jan. 18, 1991).
Airline Competition: Effects of Airline Market Concentration and Barriers to Entry on Airfares (GAoiwED8b101, Apr. 26, 1991).
Airline Competition: Higher Fares and Reduced Competition at Concentrated Airports (GAOIRCED-90-102, July 11,199O).
Airline Competition: Industry Operating and Marketing Practices Limit Market Entry (GAOmED-w-147, Aug. 29,199O). - . -
Airline Deregulation: Trends in Airfares at Airports in Small and Medium-Sized Communities (GAO/RCED81-13, Nov. 8. 1990).
Barriers to Competition in the Airline Industry (GAOR'-~~~~89-66, Sept. 20, 1989).
(341336) Page 44 GAO/RCED-93-171 Airfares at Concentrated Airports
Id- ;= j _, :,

Ordering Information
The first copy of each GAO report and testimony is free. Additional copies are $2 each. Orders should be sent to the following address, accompanied by a check or money order made out to the Superintendent of Documents, when necessary. Orders for 100 or more copies to be mailed to a single address are discounted 25 percent.
Orders by mail:
US. General Accounting Office P.O. Box 6015 Gaithersburg, MD 20884-6015
or visit:
Room 1000 700 4th St. NW (corner of 4th and G Sts. NW) U.S. General Accounting Office Washington, DC
Orders may also be placed by calling (202) 512-6000 or by using fax number (301) 258-4066.
PRINTED ON &$ RECYCLED PAPER

First Class Mail Postage & Fees Paid
GAO