
Air Ticket Sales as Bids from Airline Alliances · PDF fileAir Ticket Sales as Bids from...
31
Air Ticket Sales as Bids from Airline Alliances Marc Ivaldi * , Milena Petrova † , Miguel Urdanoz ‡ December 8, 2014 Abstract Motivated by the higher price sensitivity and service homogenisation in the airline industry in recent years, we propose a new methodology to deal with transaction prices and to estimate the effect of alliances in the US domestic market. The assumption that airlines compete on price allows us to take advantage of the observational equivalence between Bertrand competition and the reverse English auction. We then apply an MLE method, developed by Paarsch (1997) for esti- mating auctions, to recover the distributional characteristics of air fares using a sample of airline tickets from the US domestic market. This procedure allows us to benefit from the heterogeneity of individual prices while most studies have used average prices, which would have involved a loss of information and a potential bias. We find that an alliance operating in a market is associated with prices on average 18.9 percent higher. Additionally, we find the standard deviation of ticket prices to be 4.3 percent higher, which is likely related to more efficient revenue management practice by alliance partners operating together in the same market. JEL classification : R48, L40, L93. Keywords : airlines, alliances, airfares. * Toulouse School of Economics; [email protected] † PhD Candidate, Toulouse School of Economics; [email protected] ‡ Toulouse Business School; [email protected] The authors would like to thank David Salant, Darin Lee, Diego Escobari and Paul Scott for their invaluable comments and suggestions. We are also thankful to the participants at the 2014 EARIE Conference in Milan, the 2014 ITEA Conference in Toulouse, and the 2014 TSE Student Workshop in Toulouse. Any remaining errors are our own.
Transcript of Air Ticket Sales as Bids from Airline Alliances · PDF fileAir Ticket Sales as Bids from...

Air Ticket Sales as Bids from Airline Alliances
Marc Ivaldi∗, Milena Petrova†, Miguel Urdanoz‡
December 8, 2014
Abstract
Motivated by the higher price sensitivity and service homogenisation in the airlineindustry in recent years, we propose a new methodology to deal with transactionprices and to estimate the effect of alliances in the US domestic market. Theassumption that airlines compete on price allows us to take advantage of theobservational equivalence between Bertrand competition and the reverse Englishauction. We then apply an MLE method, developed by Paarsch (1997) for esti-mating auctions, to recover the distributional characteristics of air fares using asample of airline tickets from the US domestic market. This procedure allows usto benefit from the heterogeneity of individual prices while most studies have usedaverage prices, which would have involved a loss of information and a potentialbias. We find that an alliance operating in a market is associated with prices onaverage 18.9 percent higher. Additionally, we find the standard deviation of ticketprices to be 4.3 percent higher, which is likely related to more efficient revenuemanagement practice by alliance partners operating together in the same market.
JEL classification: R48, L40, L93.
Keywords : airlines, alliances, airfares.
∗Toulouse School of Economics; [email protected]†PhD Candidate, Toulouse School of Economics; [email protected]‡Toulouse Business School; [email protected]
The authors would like to thank David Salant, Darin Lee, Diego Escobari and Paul Scott for theirinvaluable comments and suggestions. We are also thankful to the participants at the 2014 EARIEConference in Milan, the 2014 ITEA Conference in Toulouse, and the 2014 TSE Student Workshop inToulouse. Any remaining errors are our own.

1 Introduction
An airline alliance is an agreement between two or more carriers that allows them tocooperate. More specifically, alliance partners can market their partner’s tickets andcollaborate in supplying a product (what is known as codeshare), they can coordi-nate their schedules, and they can share frequent-flyer programmes and promotionalcampaigns. International alliances, such as SkyTeam, Star and OneWorld, are verywell-known but they are different in a number of crucial ways from the US domesticmarket alliances. Access to international markets is regulated, hence partnering with aforeign competitor allows an airline to reach the foreign market and this is complemen-tary to its home country operations. Additionally, these type of agreements generallyreceive anti-trust immunity.2 The US domestic market, on the other hand, is not reg-ulated and any carrier is free to provide service between any two cities. The networksof alliance carriers can overlap and market access and complementarity of service areno longer arguments for alliance formation. A number of concerns have been raised asregarding to the potential anti-competitive effects of alliances, namely their effects onprices, traffic and market entry. Alliance proponents have argued that improved oper-ating efficiency, frequency of service and network reach would compensate consumersfor any potential anti-competitive effects. The Department of Justice does not grantdomestic alliances anti-trust immunity and has followed their operation closely sincetheir formation in the 1980’s. In this paper, we would like to focus on one particu-lar competition aspect, the prices of alliance partners in overlapping markets, and toprovide a new methodology that we believe is useful for understanding this importantmatter.
While there exists previous academic work on the effect of airline alliances on prices,we believe that the more dynamic conditions in recent years in the US domestic mar-ket oblige us to revisit the issue and previous results. Moreover, we propose a newmethodology that is motivated by the increasing competitiveness of this market, anissue that has received much attention from industry experts.3 Our model emphasizesthe homogenisation of service and the increased price sensitivity in the airline market.We assume the ticket sales process is adequately approximated by Bertrand competi-tion, where the consumer makes his choice based on price and the competing airlinestry to offer the best price they can. Our methodology exploits the strategic equivalencebetween the Bertrand game and a reverse English auction. A reverse English auctionhas the ”inverse” set-up of a regular English auction - the auctioneer is the buyer, andsellers compete in offering prices at which they would be willing to supply the good orservice. This interpretation allows us to consider the observed air fares as winning bids
2For example, the Department of Justice gives anti-trust immunity to the following SkyTeamairlines: Delta/Air France-KLM/Alitalia/Czech/Korean.
3To be discussed at length in the following pages.
2

and we propose to analyse their distribution by methods pertaining to the econometricsof auctions.
Our methodology is different from what has been done previously, and we believe itcontributes to the literature by allowing for a more comprehensive treatment of the pricedata. While previous empirical studies on the impact of airline alliances investigateaverage fares, that is to say fares aggregated over passengers, per airline, per marketand per period, we work with individual transaction prices. The proposed auction gameallows us to model the distribution of prices and this way our analysis benefits from theinformation we can extract from the full distribution rather than just the mean. Weavoid the risk of distorting the results that using an aggregated variable could createwhen one is not always able to control for the impact of averaging in the estimationmethod. We implement our method on the DB1B data direct service duopoly marketsoperated by legacy carriers during Q3 of 2008. We find that the presence of an alliancein a duopoly market (i.e., the two players in that market are in an alliance) is associatedwith a 18.9 percent higher fares. Additionally, we find a positive effect of alliances onthe standard deviation of prices of 4.3 percent, demonstrating an improved ability ofthe alliance partners to price discriminate.
In the rest of this section, we briefly discuss how the DB1B data has been used inthe literature, we review the research on airline alliances, and we describe the recentchanges in the competitive environment of the airline industry motivating our model.
The DB1B survey
The US Department of Transportation (DOT) publishes a comprehensive data source,the Airline Origin and Destination Survey (DB1B), since 1993. It is a 10 percent sampleof all airline tickets sold in the US domestic market with information on the price, theorigin and destination, and the itinerary details of the passengers. The DB1B, thus,is the standard data set used for analysing any issue that pertains to the US airlineindustry.
Each observation in the DB1B data set corresponds to an actual individual sale. Themain feature of the data is that while the observation contains the fare paid for the sale(the transaction price), only the market4 and product5 characteristics of the ticket sale
4The relevant market is defined as the directional city pair: the origin and the destination of theflight.
5The product characteristics are the operating airline, and whether the flight is direct or connecting.
3
are recorded. The flight6 characteristics and advance purchase7 for that ticket sale arenot available in the DB1B. To illustrate this issue, consider the following example. Let’stake the sale of a direct return ticket by United Airlines between Chicago and Seattlesold 5 days in advance for a 9 AM outbound flight on Monday and 6 PM inbound flighton Wednesday. From the DB1B, we are not able to tell if the outbound flight was onMonday or on Wednesday, at 9 AM or at 9 PM, and similarly for the inbound flight.We are also not be able to tell of the ticket was purchased 15 or 5 days in advance.However, we do know the relevant market (Chicago to Seattle), the operating carrier(United) and that the flight is direct.
The DB1B has been used extensively to analyse different market and product featuresof the US domestic industry as it is freely available and standardised by aggregatingprices at the market or product levels, respectively. Airline alliances on the US domesticmarket have also been analysed using the DB1B, with some studies focusing on theirmarket impact as in Gayle (2008) and some - on the different kinds of alliance productsas in Ito and Lee (2007). We discuss this work with more detail in the next section.8
Domestic alliances in the literature
A large portion of the literature on domestic airline alliances uses the DB1B pricesaggregated at the market level when estimating the impact of alliances. This means
6The flight is characterised by the hour and day of the week of take-off for the outbound andinbound flights.
7Advance purchase provides the number of days between the date of purchase and the date oftake-off.
8A different branch of literature is concerned with the variation of prices, or price dispersion, thatis partially due to the unobserved flight features and advance purchase in the DB1B data set. Thisvariation is generally seen as evidence of the airline to price discriminating between customers basedon flight characteristics and inter-temporally. The ability to price discriminate may be related to anumber of factors, such as the level of competition or stochastic demand. The price dispersion literaturetypically uses the Gini coefficient as a measure of the variation, following the early work by Borensteinand Rose (1994). More recently, data with flight-level and advance purchase characteristics has becomepublicly available for collection through online marketing of tickets by the airlines themselves andby online travel agents. Escobari (2012) uses data from Expedia to study the dynamic pricing ofinventories with uncertain demand and over a finite horizon. Similarly, Lazarev (2012) and Williams(2013) examine the issue of dynamic pricing in a structural framework. The structural approachapplied to data collected from online sources has great potential for discovering more about airlinedynamic pricing. However, the data collection process should be carefully considered for externalvalidity. Moreover, structural models using this kind of data so far are limited to the monopoly casebecause of the high complexity of modelling competition in this framework. This is the case in bothWilliams (2013) and Lazarev (2012). Additionally, there is the issue of the ownership of the data andairlines may not be willing to grant access to it, as experienced by McAfee and te Velde (2006) withAmerican Airlines.
4
the impact of an alliance is the difference in prices between markets with and without analliance, before and after the alliance entry or cross-sectionally. One of the first studiesof alliances in the US domestic market is Bamberger, Carlton and Neumann (2004), whouse a before-after approach to compare fares and traffic in connecting markets where thealliances operate relative to non-alliance interline9 markets. Similarly, Armantier andRichard (2006) use panel data methods to estimate the effect of the presence of allianceproducts on markets when the markets are segmented based on whether at least onecarrier already offers a non-stop service. Lastly, Gayle (2008) focuses on own (alliancemembers only) and market price and traffic effects of the Continental-Northwest-Deltaalliance, again using a before-after approach. These early studies find higher faresin markets where the alliance partners operate, but they also find increase in trafficvolume in many markets. Armantier and Richard (2006) attribute the increased pricesto alliance partners being able to price discriminate and manage the stochastic demandmore profitably.
Another strand of the literature emphasizes the type of cooperation between alliancepartners as a feature of the offered product. Ito and Lee (2007) analyse differentitineraries10 within a market, and distinguish between virtual code-shared products(where one partner operates the flight, and the other can sell tickets on that flight) andtraditional code-shared products (where both partners are involved in the operationof the flight and both can sell tickets).11 Their conclusion is that alliance productsare seen as inferior by consumers in comparison pure online flights (flights operatedand marketed by the same airline), and used by airlines to price-discriminate betweenconsumers with different willingness to pay. Gayle (2008) performs a somewhat similarexercise, but he focuses on the market price effect of the presence of traditional andvirtual code-share flights. More recently, Urdanoz and Sampaio (2012) use panel dataextracted from the DB1B database to explore the persistence of gaps in the fares ofdifferent kinds of alliance and non-alliance products over a period of six years and findthat these gaps are diminishing over time.
While the empirical evidence on the competitive effect of alliances is rich, it is difficultto draw unilateral conclusions. For example, Gayle (2008) and Ito and Lee (2007)both look at the same time period, but the effects they estimate are different. The firstexamine the impact that each cooperation type has on the market-level fares and traffic.The second, on the other hand, focus on cooperation type as a product characteristic.
9Internline products or markets are such that the service is performed by two carriers with noagreement, hence the service of each carrier is independently provided.
10Their definition of itinerary is what we call here products, or prices identified by a combinationof market and operating and marketing carrier.
11It is also interesting to note that traditional code-sharing, which takes advantage of the comple-mentarity of the networks of alliance partners, is not as widespread as some might believe. In fact, Itoand Lee (2007) report that 85 percent of their products are virtual code-shares and 70 percent exhibitoverlap of service between alliance partners.
5

Another difference is that Gayle (2008) performs a before and after estimation, whileIto and Lee (2007) look at a cross-sectional difference in price between different typeof cooperation products. As a result, comparison between empirical studies can bedifficult. While Gayle (2008) finds a positive price effect of the presence of virtualcode-shared products in a market (on both the market fare and the alliance carrierfare), Ito and Lee (2007) show that virtual code-shared products are sold at a discountcompared to online products.
The degree of competition in the airline industry
The US airline industry was regulated until 1978, and the major carriers of the period(the so-called legacy carriers) had exclusive rights to operation in certain regions of theUS market and prices were set by the Civilian Aeronautics Board. During the regulatedperiod carriers put emphasis on continuously improving the quality of service. Afterderegulation, the market was open to entry and price competition. Legacy carriersstarted forming alliances with international carriers in the early 90’s, and these typeof agreements were soon extended to other domestic legacy carriers, the first being theagreement between Northwest (NW) and Continental (CO) in 1998. While the majorityof early research work on the industry focused on competition and network formation inthe post-deregulation period, recently the industry has experienced a number of otherdevelopments. The entry and increased market share of low cost carriers (LCCs),the economic crises, advances in aviation technology, higher oil costs, and transparentinternet ticket sales have all put pressure on the market players, and the industry haswitnessed quite a few bankruptcies in the 2000’s. These changes have been explored inthe literature that we summarize below.
Intense competitive pressure in the airline industry has led to lowered emphasis onquality and increased product homogenisation. In their recent study of determinants ofairline profitability in the years between 1999 and 2006, Berry and Jia (2010) find thatlegacy carriers have reduced their services and started to compete more intensively onprices. Brueckner, Lee and Singer (2012) suggest that service homogenisation is linkedto competition from of LCCs, who have significantly expanded their operations in thelast decade. An additional contributor to this effect, noted by Borenstein and Rose(2013), is the elimination of search costs by internet ticket sales. The different kinds oftools that have recently become available on the internet (e.g. Kayak, Expedia, Orbitz,Google Flights) facilitate search based on ticket parameters, and the comparison ofprices and characteristics. This has reduced the demand for full-fare unrestricted ticketsand induced the ”unbundling” of services that are now available at additional fees (e.g.meals and check-in luggage).
6

Price elasticity has also increased considerably in the recent period. Berry and Jia(2010) find an increase in aggregate price elasticity by 8 percent between 1999 and 2006,with both business and tourist-specific elasticities rising. The authors credit the dot-com bust and internet ticket sales for this trend, and demonstrate that these changes indemand explain roughly 50 percent of the observed reduction in legacy carrier profits inthe examined period. In their study of LCCs and adjacent airports, Brueckner, Lee andSinger (2012) similarly discuss how in recent years internet ticket sales have increasedprice transparency and business travellers have become more prudent, resulting in theincrease of price sensitivity of customers.
Lastly, there has been higher provision of direct flights resulting from a combination ofincreased consumer sensitivity to connections, higher fuel price and aviation technologyimprovements. Berry and Jia (2010) find a 13 percent increase in direct passengersand a 23 decrease in connecting passengers over the period between 1999 and 2006.The semi-elasticity of connection has increased by 17 percent, as consumers can moreeasily compare and asses the relative merit of direct and connecting flights using onlinetools. Additionally, the cost advantages of connecting flights have disappeared withmore efficient smaller aircraft coming in use and higher fuel prices that make multipletake-offs and landings are too costly. This has likely brought about the recent trend inde-hubbing by legacy carriers, for example Delta de-hubbing at Memphis and Southwestat Atlanta (Berry and Jia (2010)).
Overall, the current economic conditions of the US domestic market seems to have put arather strong competitive pressure on legacy airlines, through increased price sensitivity,homogenisation of the service, and low demand for connecting flights. These trends areimportant in the recent strategic environment of the airline industry and they motivateour assumptions and data selection. Our model emphasises price competition betweencarriers offering homogeneous service, and we focus on direct markets.
The next section presents the structural model we propose, and how it will use theDB1B data in a new way to estimate the effect of airline alliances on both the mean andstandard deviation of prices. Next, in Section 3 we introduce the data and covariatesused in the estimation. Lastly, Section 4 discusses the estimation results and robustnesschecks.
7

2 Bidding for travellers
We now provide an overview of the model, briefly describe the derivation of the maxi-mum likelihood estimator, and then discuss how we use the DB1B data set to estimatethe distribution of reservation costs and the effect of airline alliances.
Overview
As we already discussed in the introduction, an important consideration about workingwith the DB1B data set is that flight level and advance purchase information are notobserved. For this reason, most work aggregates (by averaging) the observed fares atthe product or market level. This kind of approach may be potentially problematic,and it ignores the issue of price variability in airline markets. In addition, workingwith average product or market prices weighs each market equally in the estimation ofa given effect, but the correct weight might be at the ticket sale level to account fordifferent levels of demand.12
We propose a different framework that we believe is appropriate in the current economicenvironment faced by airlines. The recent trends in the industry, specifically servicehomogenisation and high price elasticity, motivate our assumption that firms competeby setting prices. For example, consider two airlines that offer a flight from New Yorkto Chicago leaving on Monday morning, returning Wednesday afternoon; the consumerinterested in these particular flight characteristics will buy the cheapest ticket on offer.13
Assumption 1. The observed transaction price (ticket fare) is the winning price in areverse English auction between airlines.
This assumption is based on the following argument. Given the particular travel char-acteristics he is interested in, the consumer chooses the cheapest ticket on offer. The
12To the best of our knowledge, the only study which uses the DB1B data at the flight level isArmantier and Richard (2008)’s discrete choice model. A potential problem in working with the dataat the flight level may come from not acknowledging the difference in the set of altrnatives (and prices)faced by each consumer. Armantier and Richard (2008) warn against using the average product fareas a proxy for the unobserved alternative prices because that would create measurement error. Theirproposed solution to this problem is innovative yet rather challenging as it requires an auxiliary dataset and a significant number of modelling assumptions.
13We let aside entry and exit issues, which are studies by Berry (1992). However, we control forthe potential bias that we could face by including market fixed effects.
8

competitive pressure on the price causes airlines to undercut each other’s price until itis no longer profitable to do so. This set-up describes Bertrand competition but alsothe reverse English auction, as the two games are strategically and outcome equivalent(Vives (2002)).14 The dominant strategy in this kind of game for each airline is tolower their price up to the point where it reaches their reservation cost, below whichthe airline would not be willing to make the sale. Take, for example, two airlines withreservation costs which are two random draws from a probability distribution. Theequilibrium strategy implies that the airlines will undercut each other’s prices until theone with the lower reservation cost (the player with the competitive advantage) slightlyundercuts the price of its rival. The airline with the higher cost is not willing to lowerits price further. Hence, the airline with the lower reservation cost wins the game andmakes the sale at a price equal to the higher reservation cost.
Our model is in line with the widely spread yield management method of bid pricecontrol. Y ield or revenue management is a variable pricing strategy that allows airlinesto increase revenues in an environment with fixed capacity with an expiration date(the take-off of a plane) and uncertain demand. In practice, there are a number oftechniques that the airline can use to achieve this, some of which involve the estimationof a marginal cost of each seat on a plane. One such method is bid price control,where this marginal cost is used as a bid - an optimum cut-off required to accept abooking. These bids correspond to reservation costs in our model, below which airlinesare unwilling to sell tickets. Bid prices are dynamically adjusted over time to reflectthe changing reservation costs under dynamic demand.15
In our framework, the reservation cost for a ticket sale is determined by the operatingcost of providing the service, but also by its opportunity cost. The operating cost canbe explained by the distance, and the economies of scale and scope, which are constantfor all flights in a given market. Operating costs on a market need not be constant- multiple flights scheduled on the same market may have different operational costsdepending on the departure time or day of the week. For example, flights at more busyhours may be more costly both in terms of the airline’s own aircraft and personnelallocation and in terms of the airport-related costs. The reservation cost is also basedon the ticket’s opportunity cost, which is the value an airline places on selling the ticketnow relative to selling is closer to the departure date with uncertainty but for a higher
14A reverse auction is when the auctioneer is a buyer and and the participants are sellers whocompete by offering the prices (their bids) at which they are willing to provide the service. An openauction of this kind, known as an English auction, is when competitors can observe each other’s bidsand react to them, as is the case when firms compete Bertrant-style. Note that in a sealed-bid auctionthe players cannot revise their bids after observing the bids of their competitors, even if they wouldlike to. The English auction is strategically and outcome equivalent to the famous Vickrey auction (asecond-price sealed-bid auction) in the case when players’ valuations are independent (private).
15This practice has been analysed in the operations management literature by Talluri and VanRyzin (1998) and Adelman (2007), among others.
9
price. For a given flight, the opportunity cost varies over time because it is related tothe remaining capacity on the flight and on competing flights at the current moment,and the expectation of demand in future moments before take-off. The opportunity costalso incorporates the ability of an airline to price discriminate over time. In the presentversion of our empirical model it is not possible to estimate separately the opportunityand operating costs because of data limitations, however it is important to make clearthe concept of the reservation cost and its underlying components.16,17
Given our assumption that airlines compete on price, we develop an empirical modelbased on the observational equivalence between Bertrand competition and the reverseEnglish auction. This observational equivalence between the two models allows us toapply an MLE method developed by Paarsch (1997) for estimating the parameters inauction models. In particular, we find this method appealing because we can estimatethe parametric effect of available covariates on the mean and standard deviation of thereservation costs and transaction prices (the observed fares). We treat our sample ofticket sales as realisations of repeated auction games. In each round of this game, weassume that the airlines offer a product with similar flight features and compete onprice, and the consumer chooses the cheapest ticket for the service. Each observationin the data represents the result of a different game, where the reservation costs havebeen re-drawn.
The model
In this section, we outline the equilibrium bidding strategy in the reverse English auctionin the symmetric independent private values paradigm. We begin by assuming that thecompetition in this market can be modelled as a non-cooperative game. We identify theplayers, characterize the information each player has, describe the strategies availableto the players, describe how each player is rewarded, and characterize the equilibrium.
16The proposed cost concepts are very close to the systematic and stochastic peak-load pricingdescribed in the seminal paper on airline ticket price dispersion by Borenstein and Rose (1994). Theauthors distinguish between systematic peak-load pricing (the mean variation in the expected shadowcost of capacity that is known at the scheduling of the flight) and stochastic peak-load pricing (whichis related to demand uncertainty and the pricing flexibility of a firm after capacity is set). The conceptof systematic peak − load pricing is close to our operating costs component which depends on flightcharacteristics such as time and day of the week of take-off. Similarly, the concept of stochastic peak−load pricing is not unlike our definition of opportunity cost that depends on current market conditions,demand expectation and the competitive structure of the market. Borenstein and Rose (1994) notethe difficulty in identifying these two effects using the DB1B data.
17A complete model of the operating costs would be possible if we had information available onthe flight characteristics of each sale (day and hour of take-off of both inbound and outbound flights).To identify the dynamic opportunity cost, we would need to know the time of sale of each ticket, theremaining capacity of the carriers, and any information related to the anticipated level of demand.
10

We consider auctions at which a single buyer wishes to purchase one ticket from twosellers (a duopoly). Each player i is assumed to know his cost of providing the ticket cibut not those of his opponents. The heterogeneity in costs is resulting from cost C beinga continuous random variable with probability density function fC(c) and cumulativedistribution FC(c). The costs of players are assumed to be independent draws from thesame distribution fC(c). Together, the above assumptions constitute an independent,private costs auction game where the players are also symmetric.
Assumption 2. Reservation costs are private, independent and ex-ante symmetric.
The strategies available to the buyers are their bids as a function of the cost: pi = σ(ci).Bidding at a reverse English auction was modelled by Milgrom and Weber (1982). Wedescribe the proceedings of the Bertrand game as follows: given that the consumerwants to buy the cheapest ticket, the players will react to each other’s prices and try toundercut the price of the competitor. The equilibrium strategy is to lower one’s priceup to pi = ci, and stop after. The winner is the player with the lowest reservationcost, and he is paid the price is the cost of his opponent (the player with the highestreservation cost).
Let us take a closer look at the symmetric private costs framework, and how it is mo-tivated by some observations on airline markets and ticket sales. In the private valuesframework, the ci of each player i is private information and it also has private rele-vance, in the sense that if it is revealed it would not make other players re-evaluatetheir cost estimates.18 The private values framework does allow for the inclusion ofcommon, deterministic reservation costs components. For example, characteristics re-lated to the operating costs like the market distance are clearly known to the airlinesoperating in the market and they affect them in the same way.19 Many opportunity costdeterminants are also common and deterministic, for example the time left before thetake-off date but also how much capacity remains on own and competitor planes. Webase this assumption on the observation that airlines have access to ample amounts ofhistorical and real time information concerning their own and their competitor’s salesand operations, and they use very sophisticated techniques to asses this information.20
18This is different from a common cost framework, where the cost draw for each player carriersinformation for the final, interdependent cost.
19Such costs, for example the cost of distance, are the same to all carriers to be consistent with thesymmetric framework.
20For example, Sabre Airline Solutions, a major airline software developer and consultancy, statesthat their fare management tools have the following capabilities: ”Our pricing solution equips airlineswith the ability to manage fares in a competitive and timely manner. The systems powerful data querytools help pricing analysts examine relative market data including competitors changes to make theright decisions at the right time.” Source: http://www.sabreairlinesolutions.com/.
11

Hence, at any given moment the reservation cost of an airline is determined by somecommon and observed components and a random component, which is private.21
Given the equilibrium strategy of the game, the observed winning price P is a functionof the reservation cost C - it is the highest out of two realisations of the random variableC. A ranked draw of a random variable is itself a random variable, known as an orderstatistic.22 The distribution FP (p) can be derived from the underlying reservation costdistribution FC(c) as follows:
FP (p) = Pr[P ≤ p] = Π2i=1Pr[Ci ≤ p] = F 2
C(p).23 (1)
Then, we find the probability density fC(c) by taking its derivative:
fP (p) = 2FC(p)fC(p). (2)
The distribution of prices and underling costs are linked as above under the assumptionsof our model. In the next sub-section, we describe how we will use this relationship toestimate the model using the method of maximum likelihood, and how we will obtainthe effect of a number of cost covariates on both the cost and the price distribution.
Specification
We specify a parametric model of the type FC(c) = FC(c; θ), where θ is the vector ofparameters to be estimated. In our baseline specification, we assume the distribution
21Flight level characteristics and time of purchase, which are not observed in our data set, representunobserved heterogeneity that cannot be identified from the distribution of the random component(see Athey and Haile (2002)). However, there is no reason to believe they are correlated with thepresence of an alliance on a market, our covariate of interest, and their omission should not bias ourestimates.
22Order statistics and their distribution are important components of auction models, where thewinner is chosen based on a ranking of the bids and the bids are monotonic functions of the underlyingrandom costs or valuations. For more information and derivations, see Paarsch and Hong (2006) andparticularly Appendices 1 and 2.
23Consider two independent and identically distributed random variables, C1 and C2 with proba-bility cumulative distribution FC(c) and probability density fC(c). Let P be the largest of the two:P = max(C1, C2). P has a cumulative distribution FP (p) = Pr(P ≤ p). The probability that therandom variable P is less than some p requires the event (C1 ≤ p) ∩ (C2 ≤ p). When each Ci isindependent, (Ci ≤ p) are also independent events and their joint probability is the multiplication ofthe individual probabilities. Thus, we are able to construct FP (p) = Pr[C1 ≤ p]Pr[C2 ≤ p] = F 2
C(p).
12

of the costs C is log-normal, or the logged costs ln(C) are distributed as N(µ, σ), withθ = (µ, σ).24 The maximum likelihood estimation method allows us to estimate theparameters of the distribution θ by maximising the joint probability of the sample withrespect to the parameters. The likelihood of observing a sample of prices of size T isthe joint probability of the individual price observations, fP (p). We assume the sampleis coming from a set of independent auction events, the joint probability is simply themultiplied individual probabilities.
L = ΠTt=1fP (pt; θ) = ΠT
t=12FC(pt; θ)fC(pt; θ). (3)
The log-likelihood is used in the maximisation, do transform the multiplicative rela-tionships into additive ones and thus make maximisation easier:
l = Nln(2) +T∑t=1
ln
(Φ
(ln pt − µ
σ
))+
T∑t=1
ln
(1
σptφ
(ln pt − µ
σ
)). (4)
The set of auctions in the data are not identical - different markets have differentdistance and population demographics, for example, that would naturally affect thereservation costs distribution. To account for these deterministic differences in the esti-mation procedure, we specify the parameters of the reservation cost FC(c, θ) distributionas linear functions of covariates:
µ = αW and σ = βW, (5)
where α and β are the coefficient vectors for the covariates W . They represent themarginal effects of covariates on the mean and standard deviation, respectively. Itis important to note that the structural model will estimate the parameters θ of theunderlying reservation cost distribution FC(c, θ), but we are also interested how theseparameters affect the distribution of transaction prices actually paid by consumers.Let us denote the parameters of the price distribution γ = (m, s) and the parametrised
24In an alternative specification, we assume the reservation costs to be distributed according tothe Beta distribution. The Beta is defined on a compact set and bounded, which is appealing formodelling reservation costs as they should be positive. Additionally, the Beta can accommodateskewness and allows the dependent variable to be heteroskedastic in the sense that the dispersion mayvary for different costs of the mean. The results obtained using the Beta are similar to those from theestimation with the Normal, and are available upon request.
13

distribution FP (p, γ). Then, using theoretical derivations from the field of statistics25,we can express the parameters of the price distribution γ in terms of the parametersof the reservation cost distribution θ. The mean of the price m is a combination of thethe mean µ and standard deviation σ of the reservation cost distribution. The pricestandard deviation s is simply the scaled σ of the reservation cost. The marginal effectsof the covariates W on m and s can then be simply calculated using the marginal effectsα and β of the reservation cost distribution.
m = µ+σ√π
=(α +
β√π
)W = aW. (6)
s = σ
√π − 1
π= β
√π − 1
πW = bW. (7)
Note that since√
π−1π< 1, the marginal effect of the covariates W on s (the b) is lower
than that on σ (the β). The distribution of prices becomes more compact, because theprices are reservation costs that are selected away from small values. What happens tothe mean depends on the sings and relative magnitude of α and β. If they have the samesign, then the marginal effect on the mean a is augmented. If they have different signs,the overall effect depends on their relative magnitude and significance. For example, itis possible that both α and β are significant but of opposite sign and a is insignificant.
Next, we define a market as a directional (origin to destination) city pair as in Ito andLee (2007). Markets are heterogeneous in terms of characteristics W , which can bedefined at the market, origin or destination level. Let the market be indexed by jk,where j represents the city of origin and k represents the destination city. Let Xjk becovariates relevant to the market, Yj relevant to the origin and Zk to the destination.Then the mean µjk on a market jk and standard deviation σjk can be written thefollowing way:
µjk = αAAlliancejk + αXXjk + αY Yj + αZZk (8)
σjk = βAAlliancejk + βXXjk + βY Yj + βZZk (9)
25Our source is Nadarajah and Kotz (2008), although the exact forms of the different momentsof the distribution of order statistics have been known for a while and are available in many goodreference books such as David and Nagaraja (1970).
14

The alliance effect is at the market level - the market can either be an alliance market(Alliancejk = 1), or a non-alliance market (Alliancejk = 0). Our analysis focuseson direct markets and direct products (non-stop flights offered on these markets). Theliterature on alliances has approached the estimation of their effect in two different ways.Ito and Lee (2007) and Urdanoz and Sampaio (2012) look at the price of different typesof alliance products on the same market. Gayle (2008) and Bamberger, Carlton andNeumann (2004), on the other hand, look at the effect of an alliance product beingoffered in a given market. Our methodology similarly estimates how the presence of analliance agreement between the carriers in a market affects the prices in that market, butwe compare markets cross-sectionally rather than before and after the agreement. Weprefer comparing cross-sectionally because the before-after comparison is only possiblearound the date of the alliance agreement, and this means we should focus on an earlierperiod that may no longer be relevant given the new market conditions.
An important assumption in our approach is that markets where an alliance is presentmust be comparable to those without. In other words, there is no selection on marketsbased on unobservables such that, for example, the strategic choice of allied carriers isto enter in markets where price discrimination is more profitable and this would causethe alliance coefficient to be biased. To avoid this type of problem, Brueckner (2003)uses a model with entry. Another more direct approach that is used by Bruecknerand Whalen (2000) and Ito and Lee (2007) is to introduce fixed effects, which we willconsider in our sensitivity analysis.
3 Data and variables
The standard airline industry data base DB1B is published by the US Department ofTransportation and represents a 10 percent sample of all tickets sold within the USdomestic market. We use data for the third quarter (Q3) of 2008 and we work withall direct service duopoly markets. Direct ticket sales are a significant portion of allsales - they represent 36 percent of all ticket sales in 2008. Duopoly markets, in turn,represent 33 percent of competitive (non-monopoly) sales.
We focus on the analysis of direct products for the following reason. We model compe-tition between carriers offering identical products to the consumer. Connecting flightshave characteristics (connecting airport, time of layover, etc) which differentiate themin a number of dimensions and accounting for that is not feasible in our framework.Still, we believe direct markets are representative and increasingly relevant as demon-strated by the high demand sensitivity to connecting flights and provision of directservice in the recent years.
15
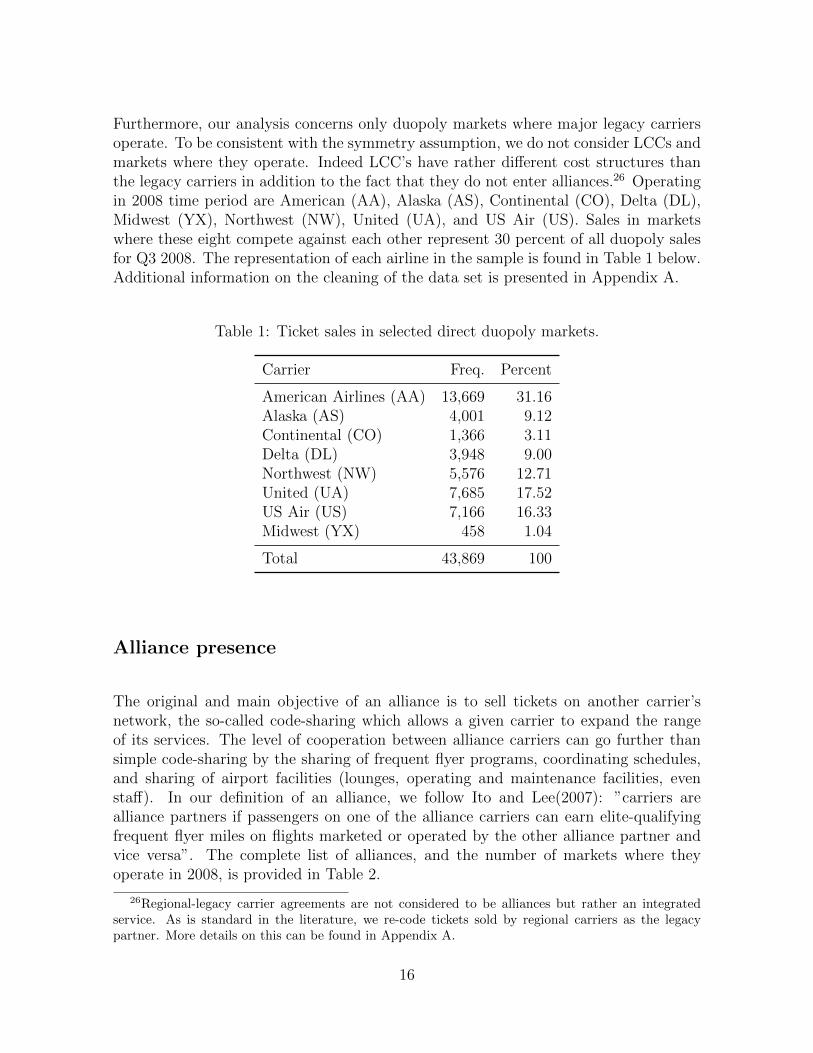
Furthermore, our analysis concerns only duopoly markets where major legacy carriersoperate. To be consistent with the symmetry assumption, we do not consider LCCs andmarkets where they operate. Indeed LCC’s have rather different cost structures thanthe legacy carriers in addition to the fact that they do not enter alliances.26 Operatingin 2008 time period are American (AA), Alaska (AS), Continental (CO), Delta (DL),Midwest (YX), Northwest (NW), United (UA), and US Air (US). Sales in marketswhere these eight compete against each other represent 30 percent of all duopoly salesfor Q3 2008. The representation of each airline in the sample is found in Table 1 below.Additional information on the cleaning of the data set is presented in Appendix A.
Table 1: Ticket sales in selected direct duopoly markets.
Carrier Freq. Percent
American Airlines (AA) 13,669 31.16Alaska (AS) 4,001 9.12Continental (CO) 1,366 3.11Delta (DL) 3,948 9.00Northwest (NW) 5,576 12.71United (UA) 7,685 17.52US Air (US) 7,166 16.33Midwest (YX) 458 1.04
Total 43,869 100
Alliance presence
The original and main objective of an alliance is to sell tickets on another carrier’snetwork, the so-called code-sharing which allows a given carrier to expand the rangeof its services. The level of cooperation between alliance carriers can go further thansimple code-sharing by the sharing of frequent flyer programs, coordinating schedules,and sharing of airport facilities (lounges, operating and maintenance facilities, evenstaff). In our definition of an alliance, we follow Ito and Lee(2007): ”carriers arealliance partners if passengers on one of the alliance carriers can earn elite-qualifyingfrequent flyer miles on flights marketed or operated by the other alliance partner andvice versa”. The complete list of alliances, and the number of markets where theyoperate in 2008, is provided in Table 2.
26Regional-legacy carrier agreements are not considered to be alliances but rather an integratedservice. As is standard in the literature, we re-code tickets sold by regional carriers as the legacypartner. More details on this can be found in Appendix A.
16
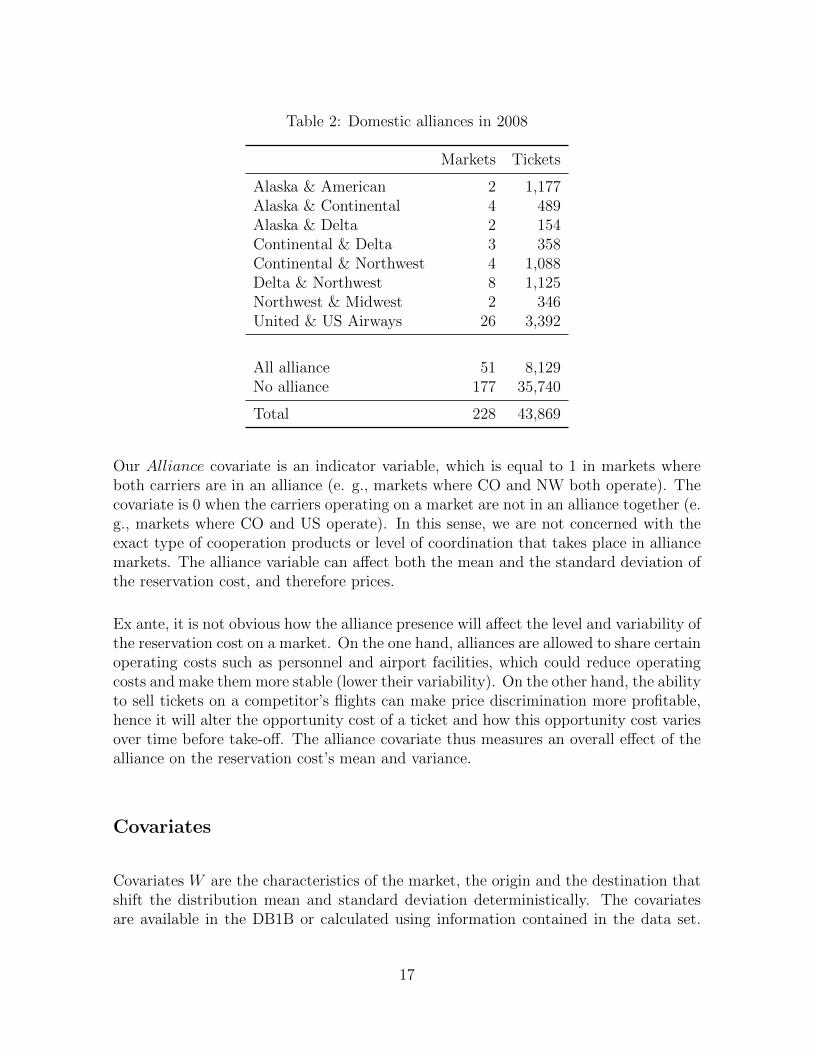
Table 2: Domestic alliances in 2008
Markets Tickets
Alaska & American 2 1,177Alaska & Continental 4 489Alaska & Delta 2 154Continental & Delta 3 358Continental & Northwest 4 1,088Delta & Northwest 8 1,125Northwest & Midwest 2 346United & US Airways 26 3,392
All alliance 51 8,129No alliance 177 35,740
Total 228 43,869
Our Alliance covariate is an indicator variable, which is equal to 1 in markets whereboth carriers are in an alliance (e. g., markets where CO and NW both operate). Thecovariate is 0 when the carriers operating on a market are not in an alliance together (e.g., markets where CO and US operate). In this sense, we are not concerned with theexact type of cooperation products or level of coordination that takes place in alliancemarkets. The alliance variable can affect both the mean and the standard deviation ofthe reservation cost, and therefore prices.
Ex ante, it is not obvious how the alliance presence will affect the level and variability ofthe reservation cost on a market. On the one hand, alliances are allowed to share certainoperating costs such as personnel and airport facilities, which could reduce operatingcosts and make them more stable (lower their variability). On the other hand, the abilityto sell tickets on a competitor’s flights can make price discrimination more profitable,hence it will alter the opportunity cost of a ticket and how this opportunity cost variesover time before take-off. The alliance covariate thus measures an overall effect of thealliance on the reservation cost’s mean and variance.
Covariates
Covariates W are the characteristics of the market, the origin and the destination thatshift the distribution mean and standard deviation deterministically. The covariatesare available in the DB1B or calculated using information contained in the data set.
17

To control for demographic characteristics, we added information on the populationand income at the origin and destination of the markets obtained from the US CensusBureau.
Distance is a market-level covariate, measured in number of miles between the originand destination cities. The distance between two cities relates to the level of operatingcosts, as longer distances require more fuel to reach. The effect on the standard devia-tion of the reservation cost, however, is undefined ex-ante. Consider the substitutabil-ity between air and land travel transport modes, which is quite high for short-distancetrips. Demand for last-minute trips, however, might be quite inelastic - business trav-ellers might find flights more convenient than driving when there is little time to planahead. A steeper price path might be optimal because early ticket sales are highlysubstitutable with land travel (and need to be prices low) while later ticket sales arerather inelastic. This kind of effect would show up in the data as a negative effect ofdistance on price variance.
The Market volume variable was constructed as a measure of traffic or scale on themarket: it is the number of ticket sales observed in that market. A higher volume iscorrelated with higher number of flights and/or larger plane size, which would allow theairlines to have lower average costs. Alternatively, each additional flight is a substitutefor the other flights the airline offers, and a larger number of flights may lead to smallerdifference between their prices, hence lower standard deviation.27
We construct the variables measuring the scale of operations - Origin volume andDestination volume - as the total number of ticket sales at the origin and destina-tion of the market. We also control for the location of the origin and destination inthe transport network, or how central is the market. To quantify this centrality we useOrigin connections and Destination connections. Origin connections counts the num-ber of cities directly accessible from the origin, while destination connections counts thenumber of cities from which one can fly to the destination. The centrality in a networkaffects operating costs through the alternative use of resources (planes, personnel) andthrough the opportunity cost changing with the stochastic demand in adjacent markets.
Our demographic measures - Population and Income - are measured at the origin anddestination cities. The effect of income is related to the opportunity cost of providingthe service. Higher income cities have both richer leisure travellers who do not needto plan too much in advance and more business travellers who book tickets in the lastdays before departure. The airline has a higher opportunity cost of a ticket sale, andpossibly a steeper price path is more profitable. Population, on the other hand, isanother measure of scale similar to market volume and it would be associated with
27We prefer to use volume and connections because ”scale” and ”scope” applies to operating costs,and here we could also have opportunity cost as contributing to the reservation cost.
18

lower reservation costs as larger-scale operations are more efficient.
Summary statistics
Below we present the summary statistics for the sub-samples for which Alliance = 1and Alliance = 0. The units of the variables are as follows. Price (airfare) and incomeare measured in US dollars, distance is in miles, population is in number of people,volumes are in number of tickets, and connections are number of origin/destinationcities. We notice that prices are higher for the alliance sub-sample, but so is distancewhich naturally increases costs. Price has a higher standard deviation in the alliancesubsample.
Table 3: Summary statisics
Alliance=0 Alliance=1
Obs: 35,740 Obs: 8,129Variable Mean Std. Mean Std.
Price 425 234 547 322Distance 1,773 992 2,560 1486Origin population 5,329,810 5,262,221 3,362,796 1,925,202Destination population 6,121,631 4,360,113 4,239,602 3,629,085Origin income 53,215 8,273 59,450 6,922Destination income 52,019 4,938 51,671 6,821Market volume 455 399 285 172Origin volume 19,692 13,621 16050 9,116Destination volume 16,929 11,783 14076 7,964Origin connecions 74 36 67 27Destination connections 70 34 64 26
Although the variables are presented here in levels, we consider their logarithmic valuesas it is common in the airline literature (see, for example, Ito and Lee (2007)). Togetherwith the assumption of log-Normality of the reservation cost, this allows us to interpretthe effect of the coefficients on the mean µ (the α’s) and standard deviation σ (the β’s)as elasticities. Hence, each estimated coefficient represents the percentage change in µor σ given one percent change in the relevant covariate. The alliance coefficient, on theother hand, is a semi-elasticity and is interpreted slightly different: to get the percentagechance of µ or σ when Alliance = 1, we multiply the estimated coefficient by 100. Thisinterpretation is also relevant for m and s, the mean and standard deviation of prices.The effects of the covariates on m and s, a and b respectively, will be constructed using
19

Equations (6) and (7).
As mentioned previously, there could be a potential selection bias on unobservables- alliance partners entering into markets based on unobserved (to the econometrician)factors. To evaluate the potential impact of this selection, we perform sensitivity tests ofour results by also running the regressions with fixed effects at the origin and destinationlevels.
4 Empirical results
The MLE methodology for auction data by Paarsch (1997) allows us to use the ob-served distribution of fares to infer the parametric effect of different covariates on theunderlying distribution of reservation costs, itself comprised of an operatic cost and anopportunity cost. Through the distributional relationship between the reservation costand the transaction price, we are able to derive how these covariates affect the leveland standard deviation of the observed fares.
Parameter estimates
We have assumed a log-Normal distribution for reservation costs, with mean µ = αWand standard deviation σ = βW . Our baseline model includes all discussed covariates asmean and standard deviation shifters. Table 5 has the results of the main estimation.28
We present the estimated effects on the parameters of the the reservation value (ourMLE results), and the effects on the parameters of the price that are constructed usingEquations (6) and (7).
We start the discussion of the results by looking at our main covariate of interest,the Alliance dummy. The results show a significant positive relationship between theexistence of alliance on a given market and both the mean and standard deviation ofthe reservation cost. It is unlikely that the positive mean shift of 9.8 percent would berelated to higher operating costs for alliance members, when in fact alliance members areable to share facilities and coordinate schedules in a way that should reduce operatingexpenses. Rather, this positive coefficient could be due to the alliance improving theability of an airline to price discriminate by allowing the selling of the partner’s tickets.Moreover, a higher standard deviation of 5.2 percent for alliance markets supports the
28As customary, different significance levels are denoted by an asterisk. We have the following: ***for significance at 1 percent, ** for significance at 5 percent, and * for significance at 10 percent.
20

hypothesis that alliance members can use the ability to sell each other’s tickets tosegment demand more effectively. As a result, we have prices that are 12.7 percenthigher and 4.3 percent more spread relative to non-alliance markets.
The estimated alliance coefficient is comparable to other results in the domestic airlineliterature. For example, Armantier and Richard (2006) find an increase of 10.7 percentfor ticket fares in markets through which CO and NW code-share using a before-afterapproach and data for 1998-2001. Gayle (2008) also finds a positive effect of an allianceoperating in a given market using a similar before-after approach for the DL/CO/NWalliance and data for 2002-2003, but of only 1.8 percent. In contrast, Bamberger,Carleton and Neumann (2004) find that the CO/HP and NW/Alaska alliances formedin the mid-90’s are associated with 7.5 and 3.9 lower fares, respectively, in connectingmarkets. One major difference between our results and previous analysis is that wework with all eight alliances operating in 2008.
The effect of Distance on reservation costs is positive (0.193 percent), which is notsurprising since distance is associated with higher operating costs. A larger distancebetween the origin and destination cities is associated with a lower price variation(-0.047 percent). This is possibly due to the substitution of shorter distance tripswith land transportation. For example, on shorter distances, the airlines may offer acombination of low priced tickets which would be competitive with respect to travellingby car, and high priced last-minute tickets for urgent business travels. Naturally, thiscauses higher variation of prices for flights of shorter distance. The overall effect ofdistance on the price mean is lower (0.166 percent) compared to that on the reservationvalue, because the effects on µ and σ go in the opposite direction.
Moving on to the demographic variables, Population has a significant negative effecton the mean reservation value (-0.057 percent for population at the origin and -0.036percent at the destination) but does not affect the standard deviation. A higher pop-ulation may lead to lower costs through higher demand and potentially more efficientlevels of operation. Given that the effect of population on the standard deviation is notsignificant, the effect of population on µ and m almost identical.
Origin and destination Income, on the other hand, have a significant and positive effecton the mean reservation cost (0.145 and 0.292 percent, respectively) and the standarddeviation (0.207 and 0.072 percent, respectively). Higher income at the origin can beassociated with richer leisure travellers, that would increase the opportunity cost of aticket. Rich leisure travellers may also be able to afford to not plan their trips toolong in advance, causing the opportunity cost of sales to increase over time and raisingthe observed dispersion. Higher income (both at the origin and the destination) isassociated with more business travel, that would also increase the opportunity cost ofa ticket. Business travel could make the opportunity cost more variable over the course
21

of selling tickets as it is uncertain and usually concentrated in the last moment beforetake-off. This causes capacity to be more filled in a more random manner, causing theopportunity cost of a ticket to have more variation over time. The mean elasticity ofthe price is higher than that of the reservation cost (0.261 for the origin and 0.331 forthe destination).
We have three different measures of V olume - at the market level, and the origin and atthe destination. All three lower the standard deviation of the reservation cost (by 0.018percent, 0.027 percent, and 0.023 percent, respectively). A higher scale of operation isusually associated with more optimised costs and more stable costs. An alternative andcomplementary explanation for this effect could be that more flights on a market woulddecrease ability to price discriminate because of the substitutability between them,hence leading to lower variability in the opportunity cost of the sale. The negativeeffect on σ translates to a negative effect on s. Additionally the destination volumeand market volume achieve a negative effect on price levels of 0.041 and 0.016 percentrespectively.
Lastly, origin and destination Connections measure the centrality of the origin or desti-nation to the travel network. Both are associated with higher reservation cost (by 0.05percent for the origin, and 0.07 percent for the destination), and higher standard devi-ation (0.051 and 0.037 percent, respectively). A market with more central origin anddestination airports may mean that the cost to the airline to service that market mustbe weighed against using its resources to service other adjacent markets, affecting theoperating costs. Alternatively, there may be dynamic demand spill-overs where moreconnections increase the variability of the stochastic demand, and make the opportunitycost more volatile.
Sensitivity analysis
To test the robustness of our results, we estimate the model with fixed effects at theorigin and destination levels. Naturally, the covariates specific to the origin and desti-nation are collinear with the fixed effects and they are excluded from this estimation.The covariates which remain are Distance, Marketvolume and Alliance. The resultsof the fixed effects estimation, displayed in Table 6, demonstrate that the significanceof the alliance indicator remains when controlling for unobserved factors. An Allianceis associated with a 11 percent increase in reservation cost mean, and a 4.8 increasein reservation cost standard deviation, both effects being comparable to the magni-tudes we have in the non-fixed effects regression. The corresponding semi-elasticitiesto alliance presence for the price are 13.6 percent for the mean and 3.9 percent for thestandard deviation. The effect of Distance is also consistent with what was estimated
22

Table 4: Estimation results with covariates
Reservation cost Price
µ σ m s
Coef./Std. Coef./Std. Coef./Std. Coef./Std.Alliance 0.098*** 0.052*** 0.127*** 0.043***
(0.008) (0.006) (0.007) (0.005)Distance 0.193*** -0.047*** 0.166*** -0.039***
(0.006) (0.005) (0.006) (0.004)Origin population -0.057*** 0.004 -0.055*** 0.004
(0.004) (0.004) (0.004) (0.003)Destination population -0.036*** -0.003 -0.037*** -0.003
(0.004) (0.003) (0.004) (0.003)Origin income 0.145*** 0.207*** 0.261*** 0.171***
(0.023) (0.020) (0.023) (0.016)Destination income 0.290*** 0.072** 0.331*** 0.06***
(0.030) (0.024) (0.028) (0.020)Market volume -0.031*** -0.018*** -0.041*** -0.015***
(0.005) (0.004) (0.005) (0.004)Origin volume 0.020* -0.027*** 0.005 -0.023***
(0.009) (0.008) (0.009) (0.006)Destination volume -0.003 -0.023** -0.016* -0.019***
(0.009) (0.008) (0.009) (0.006)Origin connections 0.050*** 0.051*** 0.078*** 0.042***
(0.010) (0.008) (0.010) (0.007)Destination connections 0.070*** 0.037*** 0.091*** 0.03***
(0.010) (0.008) (0.010) (0.007)Constant 0.373 -1.892*** -0.695* -1.562***
(0.431) (0.364) (0.415) (0.301)
Likelihood -109,780
23

previously. The Marketvolume coefficient, on the other hand, changes sign and thisindicates that there is bias in the main regression that affects this particular variable.
Table 5: Estimation results with fixed effects
Reservation cost Price
µ σ m s
Coef./Std. Coef./Std. Coef./Std. Coef./Std.Alliance 0.110*** 0.048*** 0.136*** 0.039***
(0.014) (0.012) (0.013) (0.010)Distance 0.139*** -0.020* 0.127*** -0.016**
(0.010) (0.008) (0.009) (0.007)Market volume 0.055*** -0.028*** 0.039*** -0.023***
(0.008) (0.007) (0.008) (0.006)Constant 4.530*** 1.067*** 5.132*** 0.881***
(0.097) (0.083) (0.094) (0.068)
Likelihood -106,756
We tested the sensitivity of our results by also looking at data for other years, notablyfor 2007 and 2009. A potential problem with 2009 is that many of the major alliances(UA-US and CO-NW-DL) ended by the end of that year as Continental merged withUnited in 2010 and Northwest merged with Delta also in 2010. It is not known howthese two events, known in advance, may have affected the carriers. The estimatedreservation cost coefficients for years 2007, 2008 and 2009 are available in Appendix B.The year 2009, just before the mergers and possibly at the height of the economic crisis,is somewhat inconsistent in the significance and signs of a number of coefficients, whileyears 2007 and 2008 are mostly consistent. The Alliance effect on µ is significant andof similar magnitude in all estimations: 10 percent in 2007, 9.8 in 2008, and 13.4 in2009. The effect of alliance on σ is actually negative (-1.6 percent) in 2007, indicatinga lower variance on alliance markets. In 2008 and 2009, it is significant, positive and ofsimilar magnitude (5.2 and 4.1, respectively). The effect on the price mean ranges from9.1 (for 2007) to 15.7 (for 2009), while the effect on price standard deviation - from -1.3percent (2007) to 4.3 percent (2009). Overall, the sensitivity analyses with respect tothe chosen time period produce results that are consistent with what we have obtainedin the main regression.
24

5 Conclusion
Our objective in this paper has been the following: to propose a new framework inregard to how airlines set prices for their tickets, and to use it to estimate the effectof domestic alliances in the US market. We are motivated by the increased competi-tiveness of the airline industry that has resulted in higher price sensitivity and producthomogenisation, which are well documented by academics who study this industry. Ourmodel is thus based on price competition between the airlines, also known as Bertrandcompetition. The observational equivalence between Bertrand competition and the re-verse English auction allows us to employ an MLE method from the auction literature.We fit our model on a subsample of flight-level price observations extracted from theDB1B data set, and we estimate the effect of covariates on both the mean and thevariance of prices. Our result from the main regression indicates that the presence ofan alliance in the market is associated with prices higher by 12.7 percent, and with a4.3 percent increase in the price standard deviation. We believe this result indicates animproved ability to price discriminate when alliance partners.
For simplicity, our analysis assumed an auction environment of private values and sym-metric players. A richer model should take into account of the difference in marketpresence of each competitor - their relative position in the market, or the origin anddestination of the market - and how this affects the operating costs, and the incentivesand ability to price discriminate. Incorporating asymmetry in reservation cost distri-bution is a direction that we would like to explore in the future, as from the auctiontheory literature we know that asymmetric private values models are identified as longas the transaction price and the identity of the winner are observed. Generalising theprivate values framework by assuming either affiliated values or common values can beproblematic, especially if one is to use the DB1B data set. Indeed, identification andtesting in such more general environments is not straightforward and can be achievedonly by employing more detailed data (Athey and Haile (2002)).
Our work is not without limitations, and this provides scope for future work on mod-elling competition in the airline industry. For example, we are not able to identifywhether the effect of the different covariates on the reservation cost distribution comesfrom the operating cost, the opportunity cost or both. To do that, one would needto construct a more complex structural model of competition that takes into accountdynamic pricing under demand uncertainty. As mentioned earlier, this type of modelsare of high complexity, and have typically been analysed only in the monopoly case.Moreover, estimation would require a more detailed data set than the DB1B with infor-mation on flight characteristics and time of purchase, as well as on capacity levels andsales at each point in time. We believe the framework we propose - an open competitiveenvironment where consumers make their choice based on the price and competitors
25

differ in their private costs - would be an appropriate starting point for a more complexmodel.
26

References
Adelman, D. (2007). Dynamic bid prices in revenue management. Operations Research,55(4), 647-661.
Armantier, O., and Richard, O. (2003). Exchanges of cost information in the airlineindustry. RAND Journal of Economics, 461-477.
Armantier, O., and Richard, O. (2006). Evidence on pricing from the ContinentalAirlines and Northwest Airlines code-share agreement. Advances in airline economics,1, 91-108.
Armantier, O., and Richard, O. (2008). Domestic airline alliances and consumer welfare.The RAND Journal of Economics, 39(3), 875-904.
Athey, S., and Haile, P. A. (2002). Identification of standard auction models. Econo-metrica, 70(6), 2107-2140.
Bamberger, G., D. Carlton, and L. Neumann. (2004). An Empirical Investigation ofthe Competitive Effects of Domestic Airline Alliances. Journal of Law and Economics,47, 195-222.
Berry, S. T. (1992). Estimation of a Model of Entry in the Airline Industry. Econo-metrica: Journal of the Econometric Society, 889-917.
Berry, S., and Jia, P. (2010). Tracing the woes: An empirical analysis of the airlineindustry. American Economic Journal: Microeconomics.
Borenstein, S., and Rose, N. L. (1994). Competition and Price Dispersion in the USAirline Industry. Journal of Political Economy, 102(4), 653-683. Chicago
Borenstein, S., and Rose, N. L. (2013). How airline markets work or do they? Regu-latory reform in the airline industry. In Economic Regulation and Its Reform: WhatHave We Learned?. University of Chicago Press.
Brueckner, J. K., Lee, D., and Singer, E. S. (2012). Airline competition and domesticUS airfares: A comprehensive reappraisal. Economics of Transportation.
David, H. A., and Nagaraja, H. N. (1970). Order statistics. John Wiley and Sons, Inc.
27

Escobari, D. (2012). Dynamic Pricing, Advance Sales and Aggregate Demand Learningin Airlines. The Journal of Industrial Economics, 60(4), 697-724.
Evans, W. N., and Kessides, I. N. (1993). Localized market power in the US airlineindustry. The Review of Economics and Statistics, 66-75.
Evans, W. N., and Kessides, I. N. (1994). Living by the” Golden Rule”: Multimarketcontact in the US airline industry. The Quarterly Journal of Economics, 341-366.
Gayle, P. G. (2008). An Empirical Analysis of the Competitive Effects of the Delta/Continental /Northwest Code-Share Alliance. Journal of Law and Economics, 51(4),743-766.
Ito, H., and Lee, D. (2007). Domestic code sharing, alliances, and airfares in the USairline industry. Journal of Law and Economics, 50(2), 355-380.
Lazarev, J. (2012). The welfare effects of intertemporal price discrimination: an em-pirical analysis of airline pricing in US monopoly markets. Working paper.
Nadarajah, S., and Kotz, S. (2008). Exact distribution of the max/min of two gaussianrandom variables. Very Large Scale Integration (VLSI) Systems, IEEE Transactionson, 16(2), 210-212.
Paarsch, H. J. (1997). Deriving an estimate of the optimal reserve price: an applicationto British Columbian timber sales. Journal of Econometrics, 78(1), 333-357.
Sampaio, R., and Miguel Urdanoz. (2011). Airlines’ Cooperation in the US DomesticMarket: Measuring the Evolution of Price Gaps. Working Paper.
Talluri, K., and Van Ryzin, G. (1998). An analysis of bid-price controls for networkrevenue management. Management Science, 44(11-part-1), 1577-1593.
Vives, X. (2002). Private information, strategic behavior, and efficiency in Cournotmarkets. RAND Journal of Economics, 361-376.
Williams, K. R. (2013). Dynamic Airline Pricing and Seat Availability. mimeo.
28

Appendix
A: Data cleaning
Regional ”feeder” or ”commuter” carriers are recoded as their major carrier partner. SeeTable 4 in Sampaio and Urdanoz (2012). Strong cooperation between such commutercarriers and the major carriers started in the 1980’s and in some cases this has resultedin vertical integration, for example American Eagle (AM) and American Airlines (AA).
Carriers with less than 15 passengers were deleted, since these probably reflect codingerrors. We also removed tickets with cost less than 50 USD and more than 3000USD. The majority of these happen to be tickets at 0 USD, representing frequent flyerpurchases. We also focus on markets with more than 9 passengers per quarter, as thatis equivalent to one passenger per day given that the sample represents 10 percent ofticket sales (Sampaio and Urdanoz (2012).
One other modification of the data set consists of grouping airports in the same metropoli-tan area. The six groups of airports are: Dallas-Fort Worth International and Love Fieldin Dallas, TX; Baltimore/ Washington International, Dulles, and National in Washing-ton, DC; Midway and OHare in Chicago, IL; Kennedy, LaGuardia, and Newark inNew York, NY; Los Angeles, Burbank, and Long Beach in Los Angeles, CA; San Fran-cisco, Oakland, and San Jose in San Francisco, CA. For example, Chicago Midway andChicago O’Hare International will represent the same market. Again, this is a standardtreatment in the literature that allows more properly to look at metropolitan areas withmultiple airports (Berry and Jia (2010, Sampaio and Urdanoz (2012)).
Lastly, following Evan and Kessides (1993, 1994), we count carriers as operating ina given market if their sales represent at least 1 percent of observations in the data,equivalently 1 percent of total sales.
29

B: Additional results
30

Tab
le6:
Est
imat
ere
sult
sfo
rre
serv
atio
nva
lue
coeffi
cien
ts20
07,
2008
and
2009
2007
2008
2009
µσ
µσ
µσ
Coef
./Std
.C
oef
./Std
.C
oef
./Std
.C
oef
./Std
.C
oef
./Std
.C
oef
./Std
.A
llia
nce
0.10
0***
-0.0
16**
0.09
8***
0.05
2***
0.13
4***
0.04
1***
(0.0
08)
(0.0
06)
(0.0
08)
(0.0
06)
(0.0
07)
(0.0
06)
Dis
tance
0.17
4***
-0.0
20**
*0.
193*
**-0
.047
***
0.13
4***
0.00
8(0
.006
)(0
.005
)(0
.006
)(0
.005
)(0
.006
)(0
.005
)O
rigi
np
opula
tion
-0.0
62**
*0.
030*
**-0
.057
***
0.00
4-0
.040
***
0.00
0(0
.005
)(0
.004
)(0
.004
)(0
.004
)(0
.004
)(0
.003
)D
esti
nat
ion
pop
ula
tion
-0.0
35**
*-0
.015
***
-0.0
36**
*-0
.003
0.01
0**
0.00
5*(0
.004
)(0
.003
)(0
.004
)(0
.003
)(0
.003
)(0
.003
)O
rigi
nin
com
e0.
150*
**0.
186*
**0.
145*
**0.
207*
**-0
.007
0.18
9***
(0.0
19)
(0.0
16)
(0.0
23)
(0.0
20)
(0.0
22)
(0.0
19)
Des
tinat
ion
inco
me
0.24
2***
0.21
8***
0.29
0***
0.07
2**
-0.0
370.
161*
**(0
.032
)(0
.027
)(0
.030
)(0
.024
)(0
.036
)(0
.028
)M
arke
tvo
lum
e-0
.029
***
-0.0
29**
*-0
.031
***
-0.0
18**
*0.
094*
**-0
.020
***
(0.0
05)
(0.0
05)
(0.0
05)
(0.0
04)
(0.0
06)
(0.0
05)
Ori
gin
volu
me
0.00
4-0
.009
0.02
0*-0
.027
***
-0.0
04-0
.022
**(0
.009
)(0
.007
)(0
.009
)(0
.008
)(0
.008
)(0
.007
)D
est
volu
me
-0.0
10-0
.002
-0.0
03-0
.023
**-0
.011
-0.0
36**
*(0
.009
)(0
.007
)(0
.009
)(0
.008
)(0
.009
)(0
.007
)O
rigi
nco
nnec
tion
s0.
074*
**0.
051*
**0.
050*
**0.
051*
**0.
004
0.03
2***
(0.0
10)
(0.0
08)
(0.0
10)
(0.0
08)
(0.0
11)
(0.0
09)
Des
tinat
ion
connec
tion
s0.
074*
**0.
032*
**0.
070*
**0.
037*
**0.
012
0.04
3***
(0.0
10)
(0.0
07)
(0.0
10)
(0.0
08)
(0.0
11)
(0.0
09)
Con
stan
t1.
092*
*-3
.922
***
0.37
3-1
.892
***
4.95
2***
-3.0
23**
*(0
.423
)(0
.368
)(0
.431
)(0
.364
)(0
.476
)(0
.372
)
Lik
elih
ood
-10
8,11
8-
109,
780
-94
,749
31