
Rating systems used in Brazil for soybean rust assessment · Cláudia V. Godoy José Tadashi...
28
Cláudia V. Godoy José Tadashi Yorinori Embrapa Soybean Rating systems used Rating systems used in Brazil for soybean in Brazil for soybean rust assessment rust assessment
Transcript of Rating systems used in Brazil for soybean rust assessment · Cláudia V. Godoy José Tadashi...
Cláudia V. GodoyJosé Tadashi Yorinori
Embrapa Soybean
Rating systems used Rating systems used in Brazil for soybean in Brazil for soybean
rust assessmentrust assessment
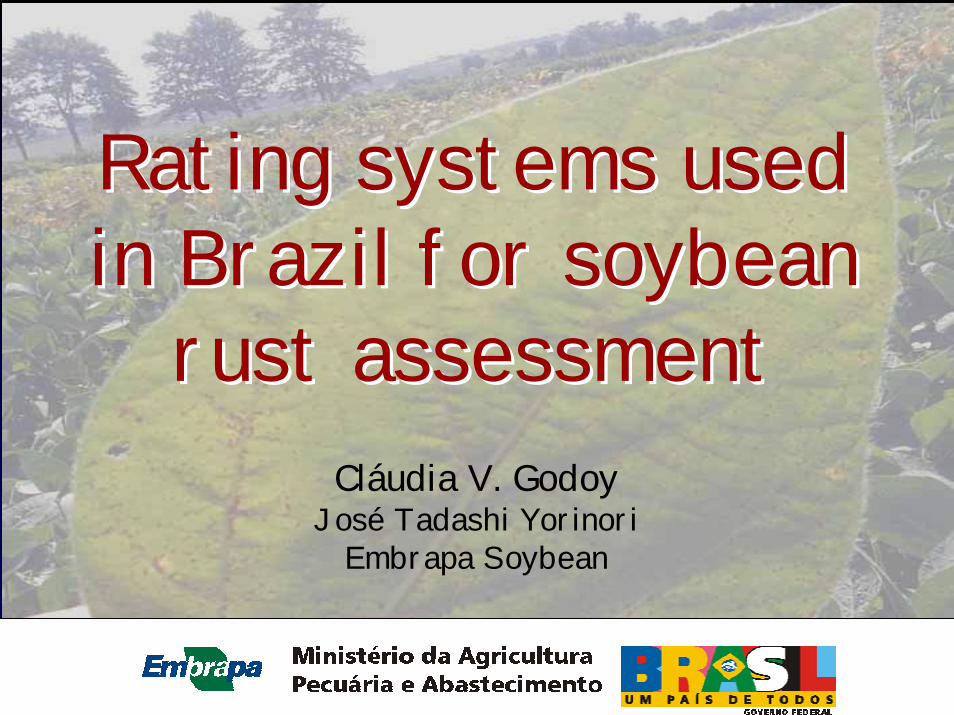
Choice of the method
Objective of the investigation
(resistance, epidemiology, screening)
Precision and accuracy required
Time/ work force available
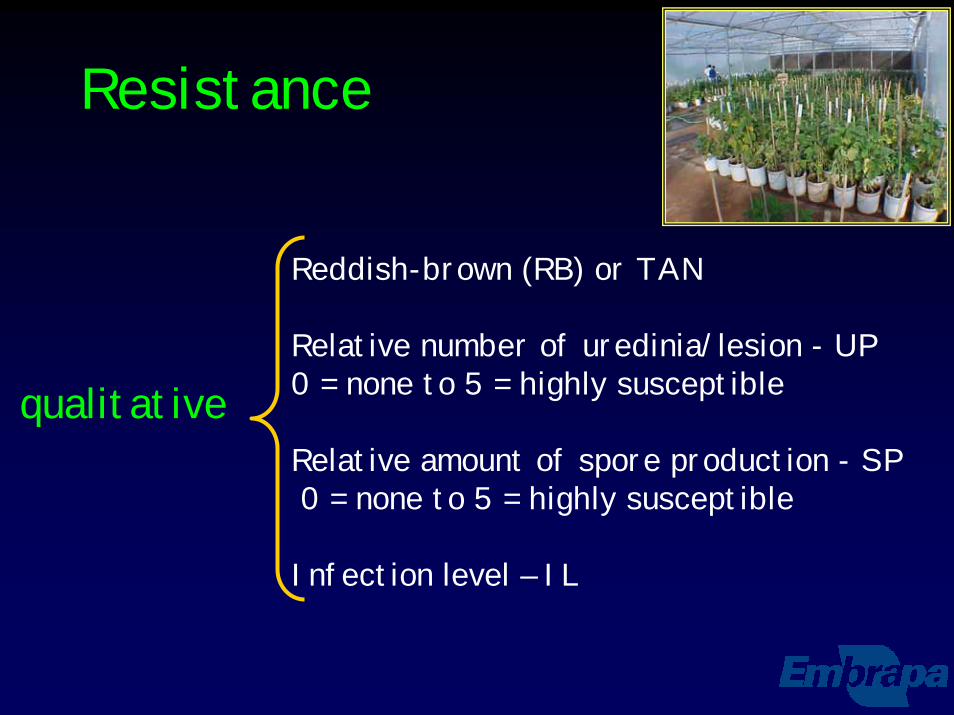
Resistance
qualitative
Reddish-brown (RB) or TAN
Relative number of uredinia/lesion - UP0 = none to 5 = highly susceptible
Relative amount of spore production - SP0 = none to 5 = highly susceptible
Infection level – IL

RB REACTION
LIMITED SPORULATION; SPORE PRODUCTION = 1
J.T. Yorinori
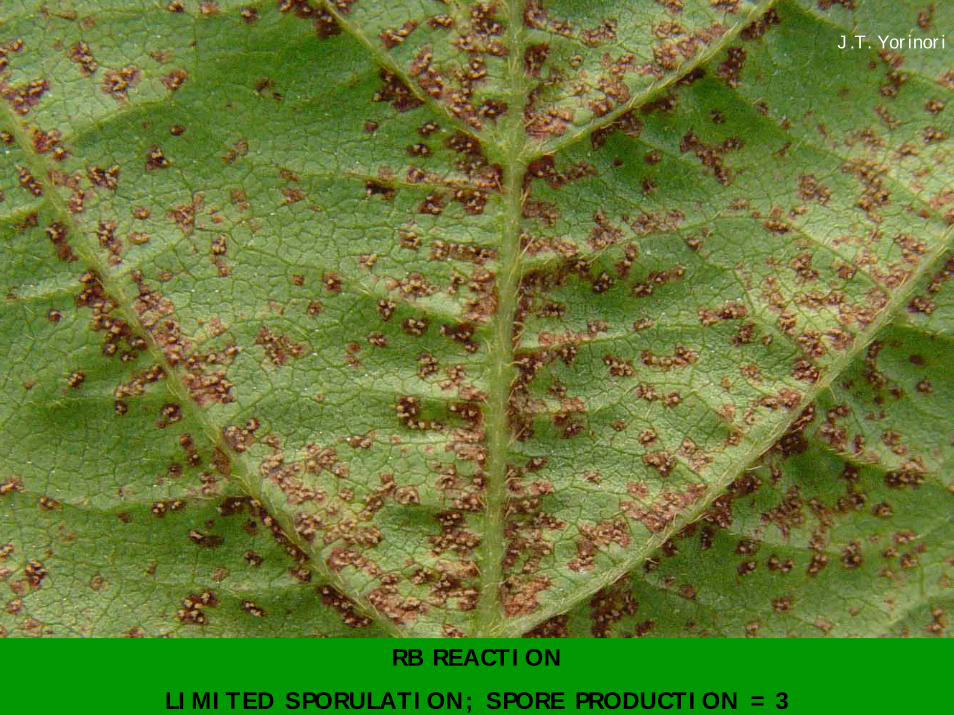
RB REACTION
LIMITED SPORULATION; SPORE PRODUCTION = 3
J.T. Yorinori
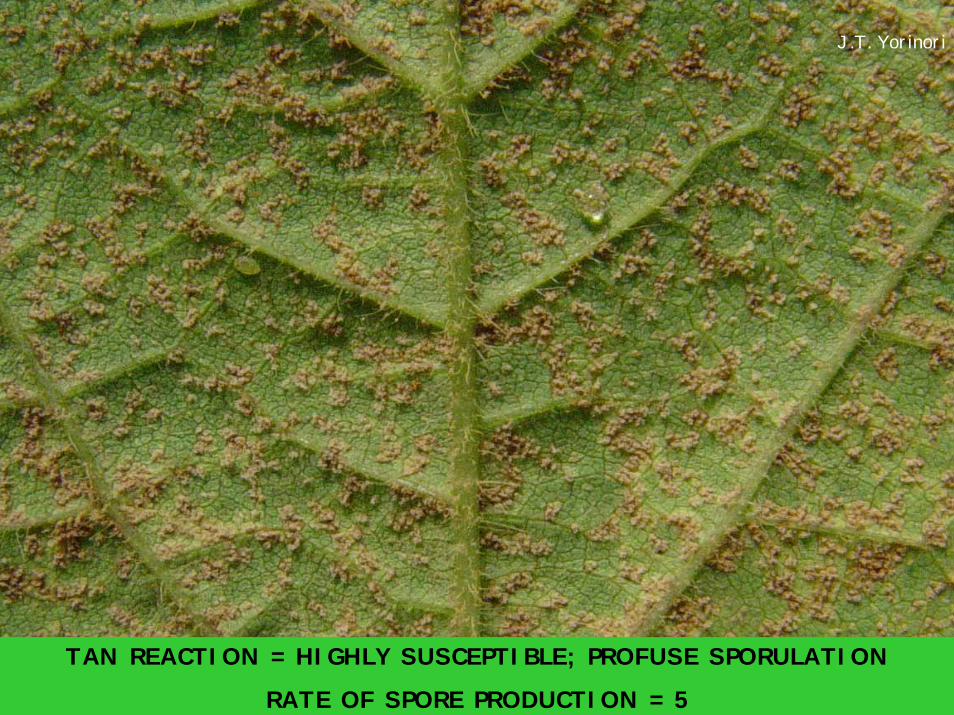
TAN REACTION = HIGHLY SUSCEPTIBLE; PROFUSE SPORULATION
RATE OF SPORE PRODUCTION = 5
J.T. Yorinori

J.T. Yorinori
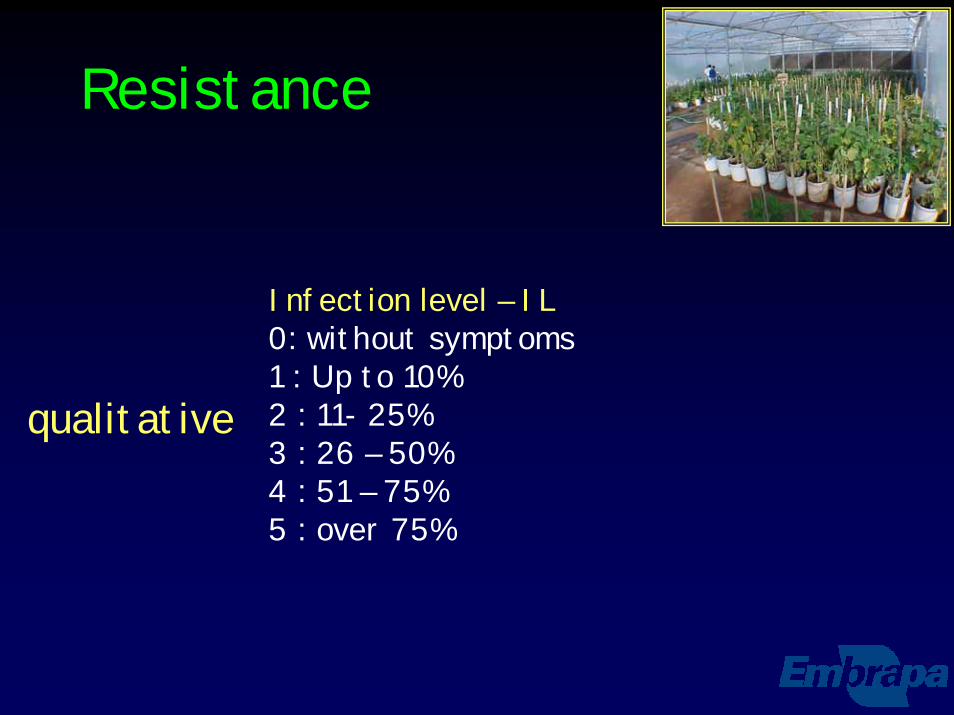
Resistance
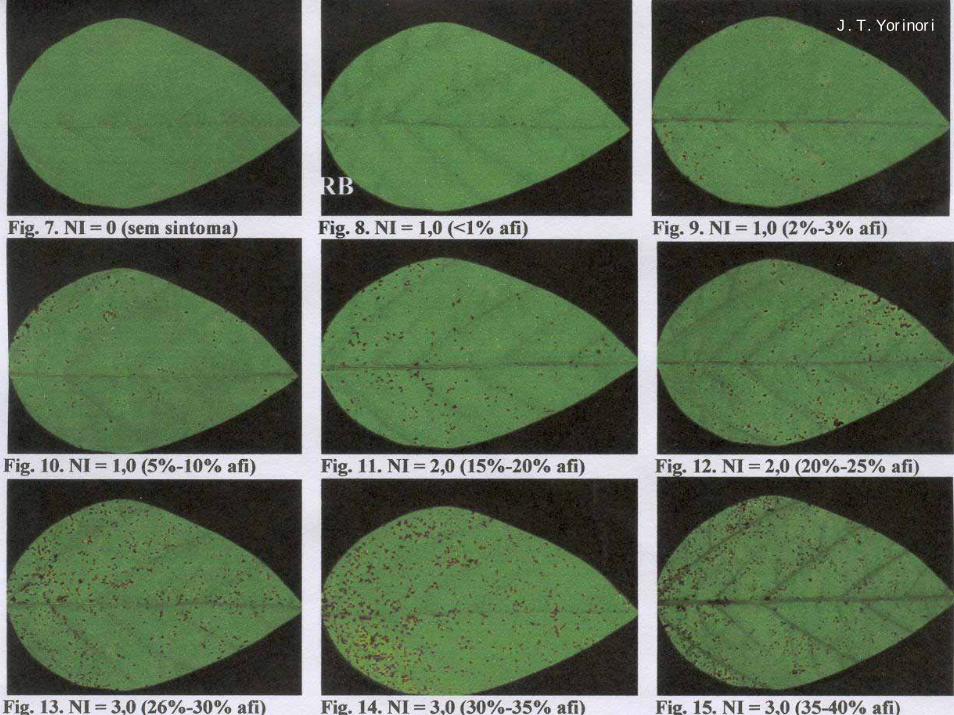
Infection level – IL0: without symptoms1 : Up to 10%2 : 11- 25%3 : 26 – 50%4 : 51 – 75%5 : over 75%
qualitative
J. T. Yorinori

J. T. Yorinori
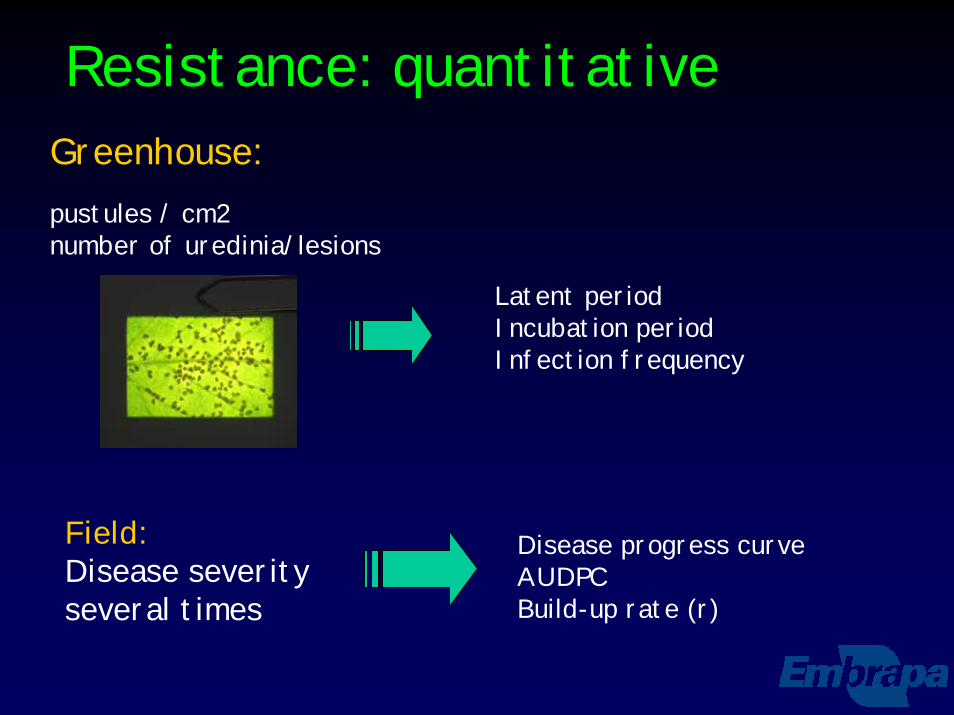
Resistance: quantitativeGreenhouse:pustules / cm2number of uredinia/lesions
Latent periodIncubation periodInfection frequency
Disease progress curveAUDPCBuild-up rate (r)
Field:Disease severity several times
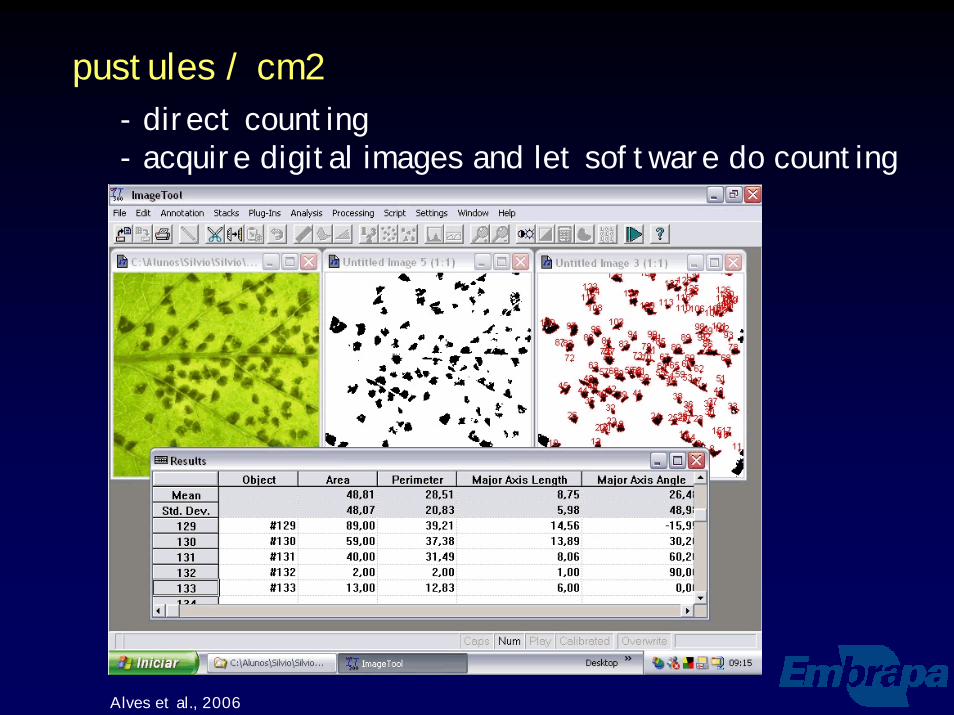
pustules / cm2- direct counting- acquire digital images and let software do counting
Alves et al., 2006
Disease severity:
Quantitative visual assessment keys
Simple - useful for epidemiology

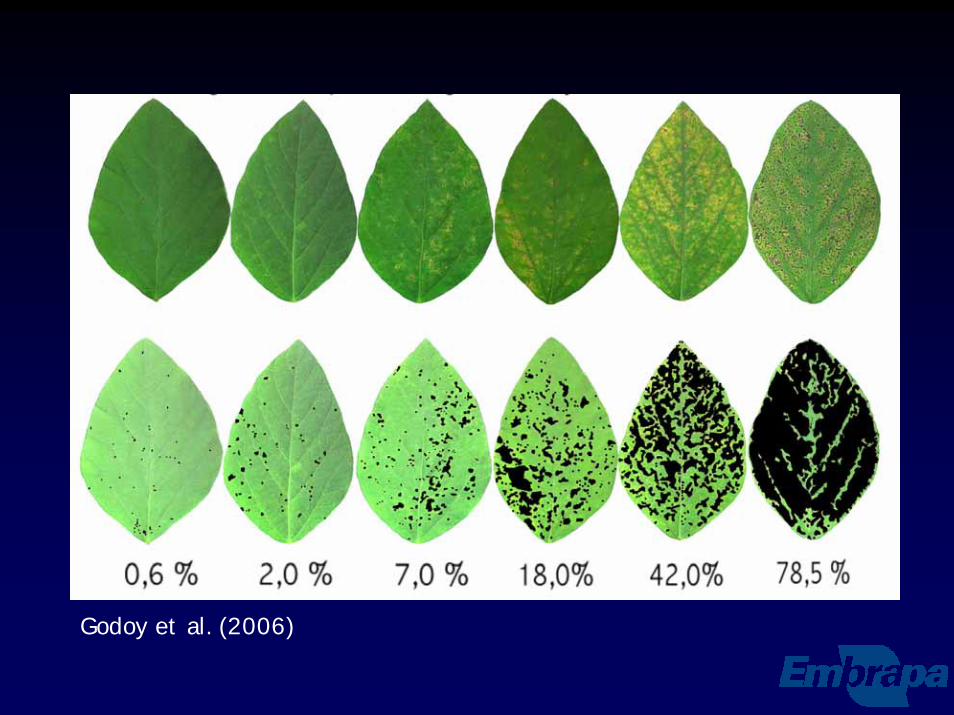
Godoy et al. (2006)
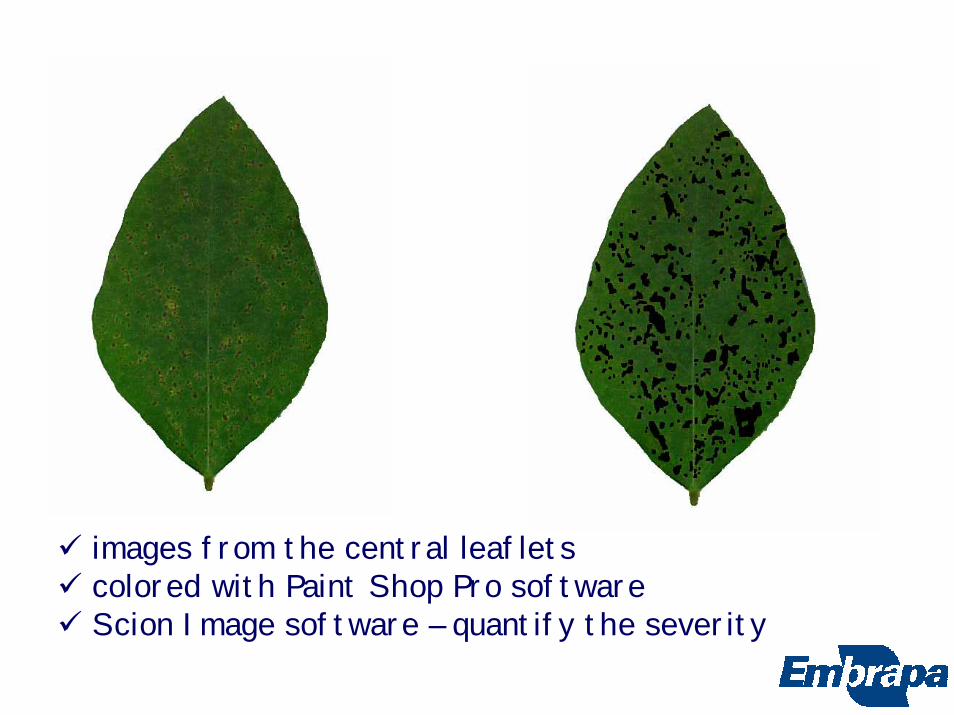
images from the central leafletscolored with Paint Shop Pro softwareScion Image software – quantify the severity
Godoy et al. (2006)
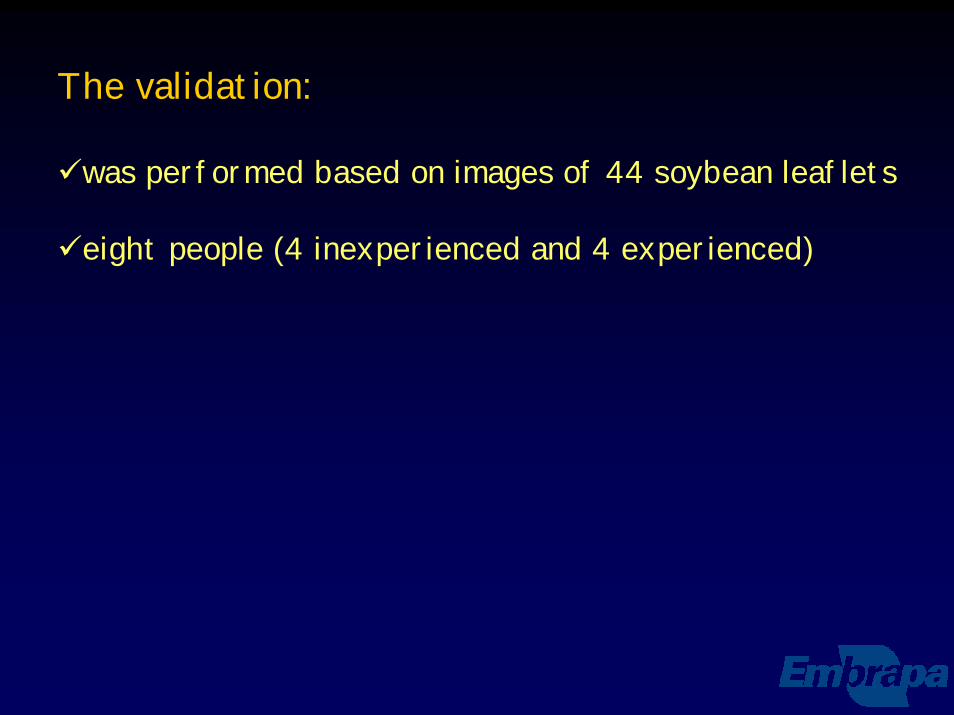
The validation:
was performed based on images of 44 soybean leaflets
eight people (4 inexperienced and 4 experienced)

020406080
100
020406080
100
Esti
mat
ed se
verit
y (%
)
020406080
100
020406080
100
0 20 40 60 80 100Actual severity (%)
0 20 40 60 80 100Actual severity (%)
rater 4
rater 3
rater 2
rater 1 rater 5
rater 6
rater 7
rater 8
without the use of the diagrammatic key
020406080
100
020406080
100
Esti
mat
ed se
verit
y (%
)
020406080
100
020406080
100
0 20 40 60 80 100Actual severity (%)
0 20 40 60 80 100Actual severity (%)
rater 4
rater 3
rater 2
rater 1 rater 5
rater 6
rater 7
rater 8
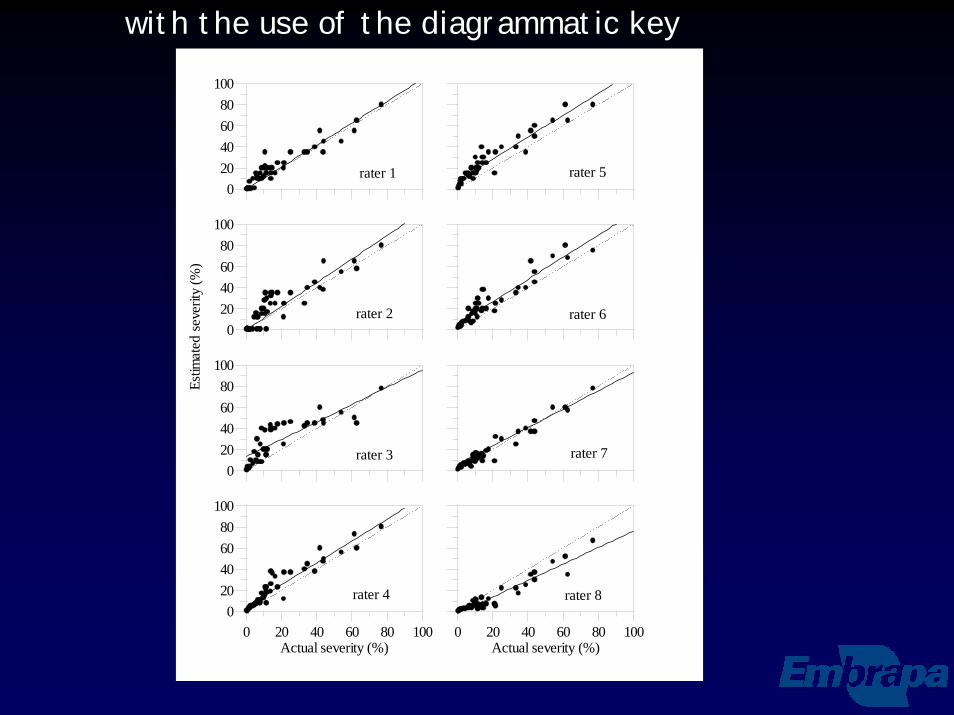
with the use of the diagrammatic key
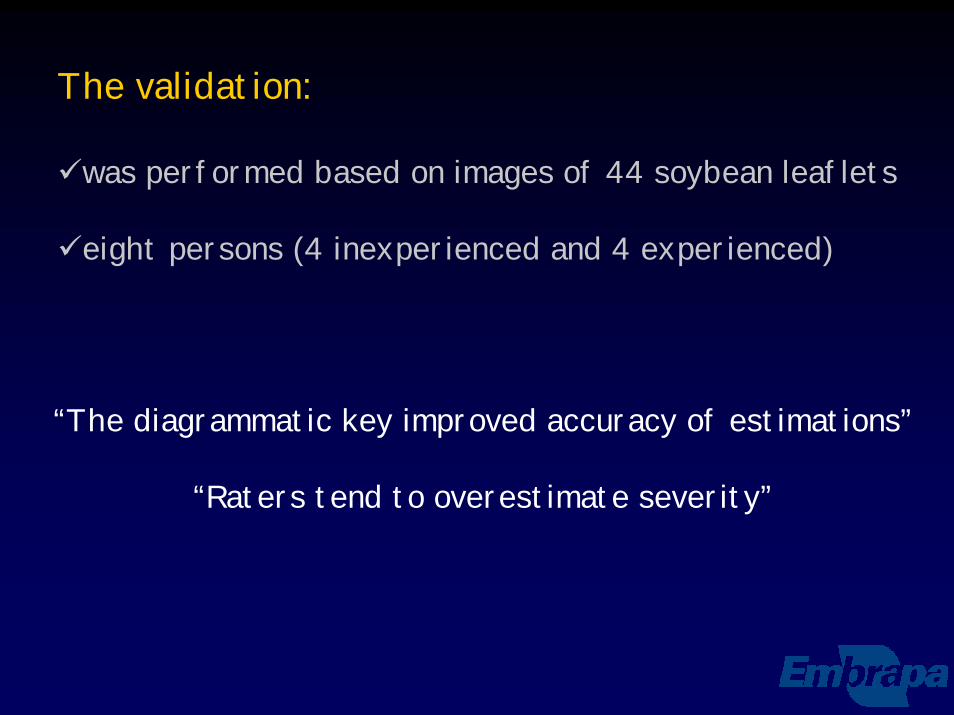
The validation:
was performed based on images of 44 soybean leaflets
eight persons (4 inexperienced and 4 experienced)
“The diagrammatic key improved accuracy of estimations”
“Raters tend to overestimate severity”
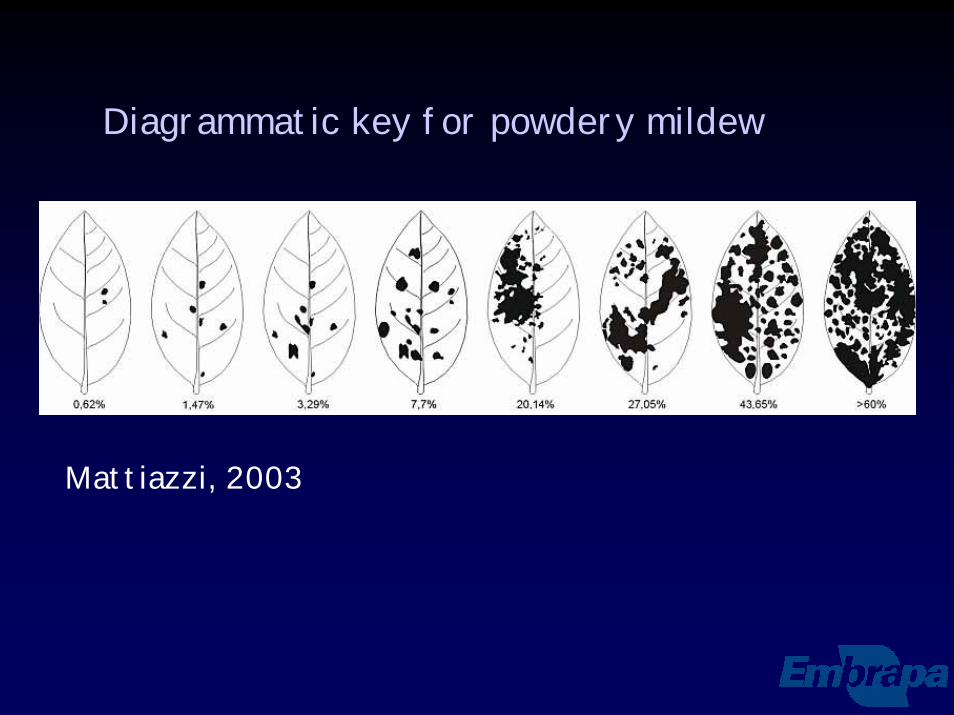
Diagrammatic key for powdery mildew
Mattiazzi, 2003

Diagrammatic key for late diseases
2,4% 15,2% 25,9% 40,5% 66,6%
Martins et al., 2004
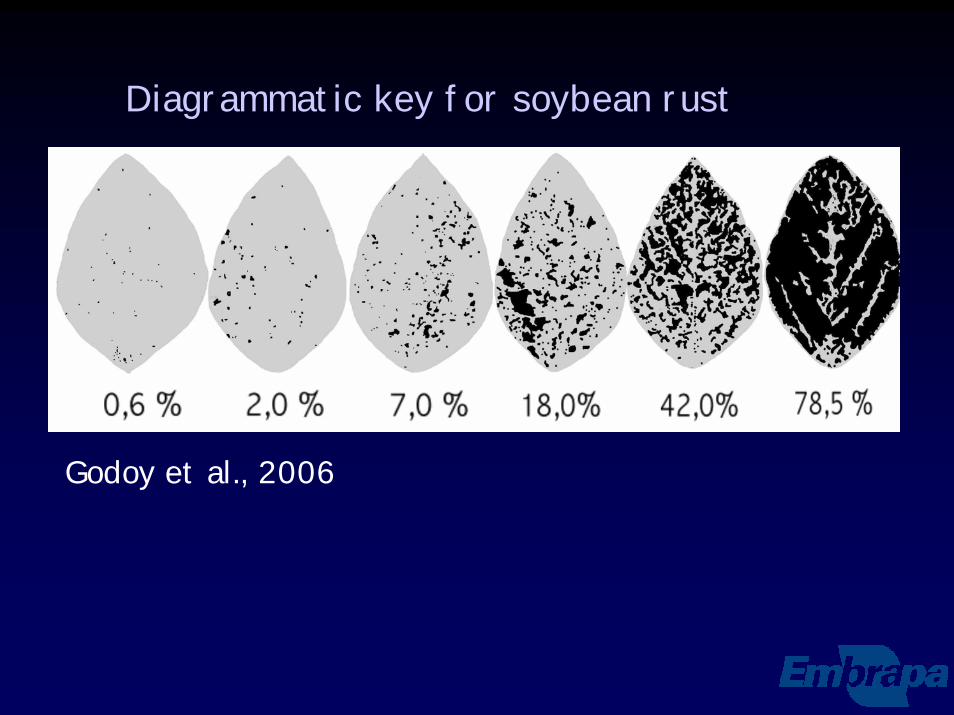
Diagrammatic key for soybean rust
Godoy et al., 2006

Disadvantages:
High costAssesses disease indirectly by measuring the plant’s stress
Advantages:
FastPrecise and accurateEasy to use
Remote Sensing
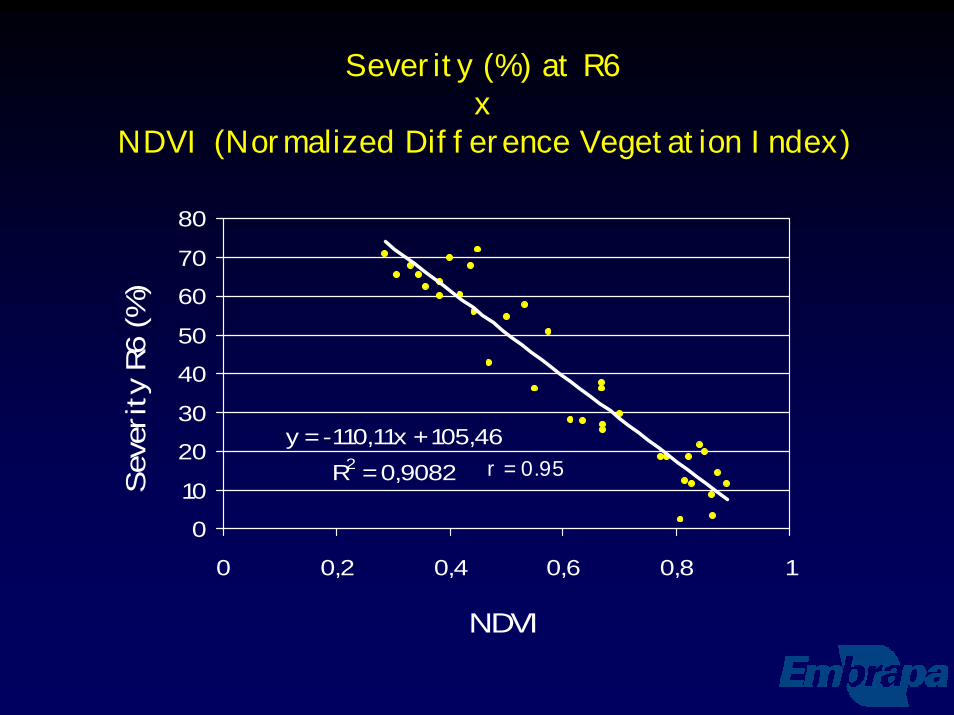
y = -110,11x + 105,46R2 = 0,9082
010
2030
4050
6070
80
0 0,2 0,4 0,6 0,8 1
NDVI
Sev
erit
y R6
(%)
Severity (%) at R6 x
NDVI (Normalized Difference Vegetation Index)
r = 0.95
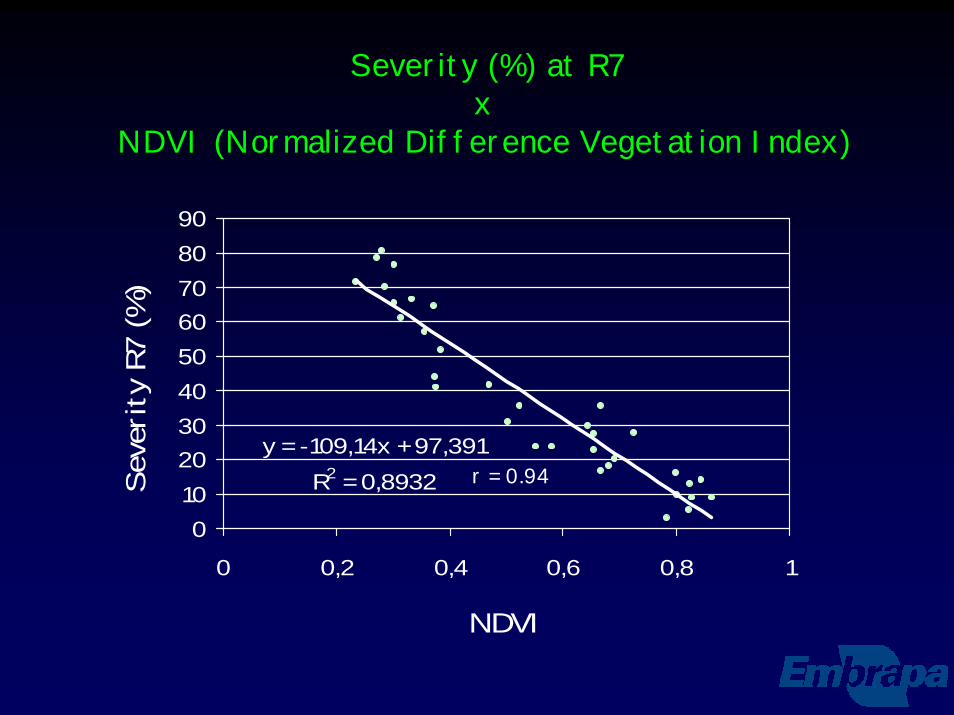
y = -109,14x + 97,391R2 = 0,8932
0102030405060708090
0 0,2 0,4 0,6 0,8 1
NDVI
Sev
erit
y R7
(%)
Severity (%) at R7x
NDVI (Normalized Difference Vegetation Index)
r = 0.94
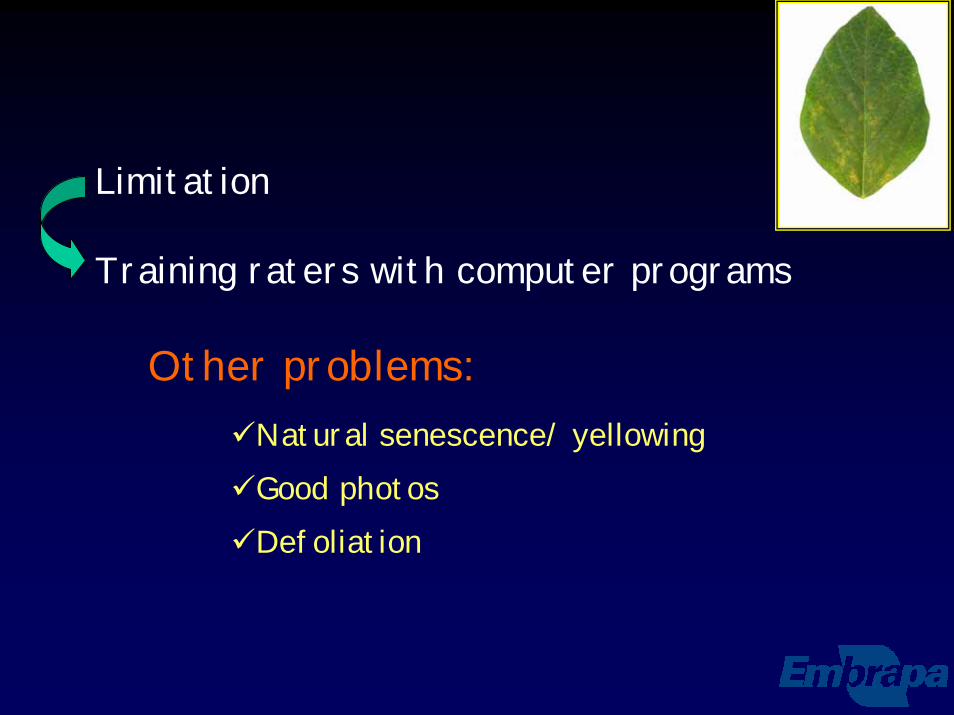
Limitation
Training raters with computer programs
Other problems:Natural senescence/ yellowingGood photosDefoliation