Rating report - Grupo Argos · May 13, 2016 Page 3 of 22 Grupo Argos S.A. We believe that the...
23
WWW.BRC.COM.CO May 13, 2016 Page 1 of 22 Colombia Rating report .......... ..... .......... .......... ..... ..... .......... .......... .... . ..... .... GRUPO ARGOS S.A. Technical Committee: May 13, 2016 Minute number: 947 Contacts: Alba Luz Buitrago Junco alba.buitrago@spglobal.com Ana María Carrillo Cárdenas ana.carrillo@spglobal.com
-
Upload
truongthuy -
Category
Documents
-
view
213 -
download
0
Transcript of Rating report - Grupo Argos · May 13, 2016 Page 3 of 22 Grupo Argos S.A. We believe that the...

WWW.BRC.COM.CO May 13, 2016 Page 1 of 22
Colombia
Rating report
.......... ..... .......... .......... ..... ..... .......... .......... .... . ..... ....
GRUPO ARGOS S.A.
Technical Committee: May 13, 2016
Minute number: 947
Contacts:
Alba Luz Buitrago Junco [email protected] Ana María Carrillo Cárdenas [email protected]

WWW.BRC.COM.CO May 13, 2016 Page 2 of 22
Grupo Argos S.A.
GRUPO ARGOS S.A.
PERIODIC REVIEW
ISSUER
AA+
Amounts in millions of Colombian pesos (COP) as of December 31, 2015
Rating history:
Assets: Liabilities: Equity: Minority interest: EBITDA: Controlled net income:
COP 41,775,013. COP 18,885,214. COP 14,792,611. COP 8,097,188. COP 2,640,274.
COP 301,000.
Periodic review May/2015: Initial rating May/2014:
‘AAA’ Negative Outlook ‘AAA’
INTRODUCTION
According to what is set forth in Law 1314 of 2009 and its regulatory decrees, industrial companies are required to converge from the generally accepted accounting principles of Colombia (COLGAAP) to the International Financial Reporting Standards (IFRS). The mandatory transition period for Grupo Argos and its subsidiaries began on January 1, 2014 and the first audited financial statements under IFRS were those for the year ended on December 31, 2015.
As in the previous rating reviews, this report is based on the consolidated financial statements of Grupo Argos (GA), given that unlike the individual figures of the conglomerate, these enable a clear and full understanding of the dynamics of the issuer and its affiliates and they isolate to a greater extent the volatility derived from the group’s strategic restructuring decis ions, of the acquisitions made for the expansion and internationalization of its businesses and of the disinvestments made to finance them. However, we have made available to readers the individual financial statements of GA in section IV.
I. BASIS FOR THE RATING
During its periodic review, the Technical Committee of BRC Investor Services S.A. SCV confirmed the Short Term Debt rating at BRC1+ and lowered the Long Term Debt rating to AA+ from AAA and withdrew the Negative Outlook from the Program to Issue and Place Ordinary Bonds and/or Commercial Paper of Grupo Argos S.A. for 1 billion Colombian pesos (COP).
Over the past three years, both the conglomerate and its cement and power affiliates have carried out aggressive investment plans aimed at venturing into the concessions business and expanding their operations abroad, respectively. Financing of these investments substantially increased the consolidated financial debt of GA, especially dollar-denominated debt. This fact, combined with the devaluation of the Colombian peso in 2015 and the temporary reduction of the profit margins of Celsia, produced considerable growth both of the group’s consolidated debt (13.24 billion of Colombian pesos [COP] in 2015 compared to COP 5.82 billion in 2013) and of its gross debt/EBITDA ratio, which reached an all-time high of 5.02 times (x) and surpassed not only our own, but the issuer’s forecasts.
Another variable that affected consolidated leverage was the incorporation of the figures of Odinsa starting in October, 2015. On the one hand, GA included the total debt of the new affiliate (COP 1.56 billion), but only recorded one quarter of its revenues and EBITDA (COP 294,360 million and COP 59,379 million, respectively, out of an annual amount of COP 902,924 million and COP 295,922 million). On the other hand, in December, 2015 this subsidiary took on new bank loans in the amount of US$279 million to acquire 47% of the shares of Quiport Holdings, the entity that controls the concession of the Mariscal Sucre Airport in Quito. For this reason, the figures for Odinsa only include one month of results for this concession, but they include the total debt of the acquisition. If the consolidated gross debt/EBITDA ratio for GA were normalized for 2015 with the inclusion of the total EBITDA that Odinsa and Quiport would have generated, it would have been 4.49 x.

WWW.BRC.COM.CO May 13, 2016 Page 3 of 22
Grupo Argos S.A.
We believe that the acquisitions made by Grupo Argos are aligned with its strategic direction and will contribute, in the long term, to the consolidation of its businesses in the region and to an increase in its revenues and EBITDA. However, the funding required for these investments weakened its consolidated indebtedness indicators in such a way that they are not in line with the indicators of companies with higher ratings. In our opinion, this trend will remain in the medium term, given that the resources derived from its strategic businesses (cement, power and concessions) will not be sufficient for the group to reduce, over the next three years, its consolidated leverage in a sustainable manner to values that are consistent with a ‘AAA’ rating (gross debt/EBITDA ratio between 2x and 3x). Thus, even though we forecast that this ratio will maintain the downward trend we identified in the last review, the change will be slower than we initially estimated, and consequently its average value is estimated at 3.8 x between 2016 and 2018. This is the main reason we have lowered the rating for the group and removed the negative outlook.
In September, 2015, the group acquired 54.75% of the shares of Odinsa, a company with broad-based experience in the development of road and airport concessions. The transaction cost COP 1.02 billion and was financed with a bank loan requested by the conglomerate in the amount of COP 550,000 million plus its own resources, including those derived from the sale of 5.34% of the ordinary shares of Cementos Argos (CA) for COP 600,000 million.
In this regard, it is important to mention that even though in 2015 the debt held by the conglomerate grew 63% as a result of the acquisition, its debt/EBITDA decreased to 3.24 x from the 4.58 x reported in 2014. This is primarily due to the greater revenues obtained by the holding company from the sale of part of its investment portfolio (which is non-recurrent) and the good performance of its real estate business. In upcoming years, this indicator should gradually improve thanks to the greater revenues to be received by the conglomerate based on the equity shareholdings method and the dividends produced from the good performance we expect from its five main businesses. The above is under the assumption that GA at the individual level does not need to increase its indebtedness to support its investments in the concessions business or to venture into new activities.
As of December, 2015, consolidated revenues of GA posted the greatest growth in its history (35.3%), reaching a total of COP 12.6 billion. These results are due to:
The outstanding performance of its cement business, which contributed 62.9% of total group sales and grew by 35.7% (Table 1).
The 42.6% increase in revenues from Celsia resulting from the incorporation of the operations of its affiliates in Central America, favorable trends in the distribution business and greater revenues from reliability charges.
The positive impact of the devaluation of the Colombian peso on sales abroad and dollar-denominated items.
The increase in portfolio revenues thanks to the good results of the ports and real estate businesses and sales by the conglomerate of its shareholdings in Sura, Bancolombia and Cementos Argos.
Table 1. Breakdown of the consolidated revenues of Grupo Argos
COLGAAP IFRS
Business 2012 2013 2014 2014 2015
Cement 4,380,393 4,968,414 5,833,482 5,831,489 7,911,400
Power 2,023,672 2,381,116 2,588,782 2,588,484 3,690,903
Concessions 0 0 0 0 294,360
Others and disposals -333,983 -245,400 -590,059 63,262 71,886
Portfolio and real estate 611,073 525,229 1,087,353 813,054 611,129
Total 6,681,155 7,629,359 8,919,558 9,296,289 12,579,678
Share of total business 2012 2013 2014 2014 2015
Cement 65.6% 65.1% 65.4% 62.7% 62.9%
Power 30.3% 31.2% 29.0% 27.8% 29.3%
Concessions 0.0% 0.0% 0.0% 0.0% 2.3%
Others and disposals -5.0% -3.2% -6.6% 0.7% 0.6%
Portfolio and real estate 9.1% 6.9% 12.2% 8.7% 4.9%
Total 100.0% 100.0% 100.0% 100.0% 100.0%

WWW.BRC.COM.CO May 13, 2016 Page 4 of 22
Grupo Argos S.A.
Growth by business 2012 2013 2014 2014 2015
Cement 19.4% 13.4% 17.4% 17.4% 35.7%
Power 9.7% 17.7% 8.7% 8.7% 42.6%
Concessions N/A N/A N/A N/A N/D
Others and disposals N/A -26.5% 140.4% N/A 13.6%
Portfolio and real estate 123.3% -14.0% 107.0% -125.8% -24.8%
Total 15.5% 14.2% 16.9% 21.8% 35.3%
Region 2012 2013 2014 2014 2015
Colombia 4,772,155 5,389,824 5,616,005 5,992,736 6,950,718
Central America & Caribbean 715,000 837,035 1,109,412 1,109,412 2,213,411
United States 1,194,000 1,402,500 2,194,141 2,194,141 3,415,549
Total 6,681,155 7,629,359 8,919,558 9,296,289 12,479,678
Share of total by region 2012 2013 2014 2014 2015
Colombia 71.4% 70.6% 63.0% 64.5% 55.3%
Central America & Caribbean 10.7% 11.0% 12.4% 11.9% 17.6%
United States 17.9% 18.4% 24.6% 23.6% 27.2%
Total 100.0% 100.0% 100.0% 100.0% 100.0%
-7.84% Growth by region 2012 2013 2014 2014 2015
Colombia 13.9% 12.9% 4.2% 11.2% 16.0%
Central America & Caribbean -8.2% 17.1% 32.5% 32.5% 99.5%
United States 46.0% 17.5% 56.4% 56.4% 55.7%
Total 15.5% 14.2% 16.9% 21.8% 35.3%
Source: Grupo Argos and affiliates. Amounts in millions of COP
For the 2016-2018 period we estimate that growth of consolidated revenues will be lower than the average recorded between 2013 and 2015 (23.8%), due to our expectations of a slowdown in the Colombian economy and the stabilization of the exchange rate at around an average of COP 3,200 per US$1. Even though we expect substantial sales by Odinsa in this period (an annual average of around COP 1.3 billion), its share of total group revenues will not be high (8% on average), as a result of the continued positive trend in the revenues of Cementos Argos (which will continue to contribute 60% of the revenues of GA), and the normalization we expect in Celsia results starting in 2017 as a result of the end of the El Niño phenomenon and adjustments to its long-term contracting policies.
In terms of contribution by region, Colombia will remain the largest revenue generator for the group with a 55.3% share; however, this percentage has decreased in recent years due to the growth of its operations in United States and Central America & Caribbean. In the medium term we expect the contributions of each region to be 52%, 30% and 18%, respectively.
By leveraging the increase in revenues and searching for operating efficiencies in its cement business, GA achieved in 2015 COP 2.6 billion in EBITDA, the highest in its history. We highlight the importance in this year of the group’s diversification of its investments by industry, geography and currency, as this partially mitigated the under-performance of the profits of its electric power generation business in Colombia through the better results of its cement subsidiary, of its Businesses under development and of its power assets in Central America. In this manner, consolidated EBITDA Margin only fell 290 basis points to 21%, while the generation business (which in 2014 accounted for 28.4% of the group’s total EBITDA) fell to 9% in 2015 from 38.5% in 2014.
This diversification is the result of a strategic restructuring process launched by the group in 2005 and that has enabled it to evolve from an organization focused only on the cement business and the Colombian market to having investments in five businesses (cement, power, concessions, ports and real estate – Graph 1) and three regions (Colombia, United States and Central America & Caribbean).

WWW.BRC.COM.CO May 13, 2016 Page 5 of 22
Grupo Argos S.A.
The situation faced by the power business in 2015 and the favorable evolution of the cement operation are the reasons that explain the Celsia’s lower share of consolidated EBITDA to 26.6 % from 38.1% in 2014, while that of Cementos Argos increased to 57.7 % from the 44.1 % recorded the previous year (Table 2).
Source: Grupo Argos.
Table 2. Breakdown of consolidated EBITDA of Grupo Argos
COLGAAP IFRS
Business 2012 2013 2014 2014 2015
Cement 791,190 978,108 987,997 981,343 1,523,092
Power 731,174 864,563 848,137 846,901 702,731
Concessions 0 0 0 0 58,380
Others and disposals -346,887 -291,970 -411,614 16,730 11,075
Portfolio and real estate 440,066 356,320 647,851 379,643 344,996
Total 1,615,543 1,907,021 2,072,371 2,224,617 2,640,274
% of tot. Business 2012 2013 2014 2014 2015
Cement 49.0% 51.3% 47.7% 44.1% 57.7%
Power 45.3% 45.3% 40.9% 38.1% 26.6%
Concessions 0.0% 0.0% 0.0% 0.0% 2.2%
Others and disposals -21.5% -15.3% -19.9% 0.8% 0.4%
Portfolio and real estate 27.2% 18.7% 31.3% 17.1% 13.1%
Total 100.0% 100.0% 100.0% 100.0% 100.0%
Growth by business 2012 2013 2014 2014 2015
Cement 16.1% 23.6% 1.0% 0.3% 55.2%
Power 2.4% 18.2% -1.9% -2.0% -17.0%
Concessions N/A N/A N/A N/A N/D
Others and disposals N/D -15.8% 41.0% -105.7% -33.8%
Portfolio and real estate 106.9% -19.0% 81.8% 6.5% -9.1%
Total -0.8% 18.0% 8.7% 16.7% 18.7%
EBITDA Margin 2012 2013 2014 2014 2015
Cement 18.1% 19.7% 17.0% 16.9% 19.3%
Power 36.1% 36.3% 32.8% 32.7% 19.0%
Concessions N/A N/A N/A N/A 19.8%
Others and disposals N/A N/A N/A N/A N/A
Portfolio and real estate 72.0% 67.8% 59.6% 46.7% 56.5%
Total 24.2% 25.0% 23.2% 23.9% 21.0%
Graph 1
Results of the group’s diversification strategy
53% Cement 16% Land Bank 12% Power 11% Concessions 4% Rental Properties 4% Other

WWW.BRC.COM.CO May 13, 2016 Page 6 of 22
Grupo Argos S.A.
Region 2012 2013 2014 2014 2015
Colombia 1,468,543 1,687,0036 1,621,100 1,773,346 1,627,533
Central America & Caribbean 160,000 192,008 314,274 314,274 664,673
United States -13,000 28,010 136,997 136,997 348,068
Total 1,615,543 1,907,021 2,072,371 2,224,617 2,640,274
Percent of total by Region 2012 2013 2014 2014 2015
Colombia 90.9% 88.5% 78.2% 79.7% 61.6%
Central America & Caribbean 9.9% 10.1% 15.2% 14.1% 25.2%
United States -0.8% 1.5% 6.6% 6.2% 13.2%
Total 100.0% 100.0% 100.0% 100.0% 100.0%
Growth by region 2012 2013 2014 2014 2015
Colombia -1.2% 14.9% -3.9% 9.4% -8.2%
Central America & Caribbean -17.5% 20.0% 63.7% 63.7% 111.5%
United States -75.0% -315.5% 389.1% 389.1% 154.1%
Total -0.8% 18.0% 8.7% 16.7% 18.7%
Source: Grupo Argos. Amounts in millions of COP
Even though in upcoming years the concessions business will only account on average for 8% of total revenues, its contribution to consolidated EBITDA will be of 14.5%, because its EBITDA Margin is higher than the cement and power businesses (33.15% on average in 2013 and 2015 compared to 18.5% for cement and 29.9% for power). Even though the share of Cementos Argos in EBITDA is expected to fall in 2016 and 2018 due to the inclusion of Odinsa in GA’s investment portfolio, it will continue to be the group’s most important affiliate in this regard, contributing approximately 50%.
In terms of the contribution of each region to consolidated EBITDA, we expect Colombia to maintain a share of around 60% because close to 45% of the EBITDA of Odinsa would be derived from its local operation. This is despite the fact that we expect an increase in EBITDA generated in United States due to the impact of the operating leverage of the cement business. We also expect the importance of Central America & Caribbean to increase in this item due to the consolidation of the results of the concessions in Dominican Republic in the financial statements of Odinsa and our expectation on the continuation of the good performance of the cement and power assets in that region.
In 2015, Cementos Argos achieved exceptional growth in its three regions (Colombia, 18.6%; United States, 55.7%; and Central America & Caribbean, 36.8% - Table 3). In addition to the devaluation of the Colombian peso, other aspects that explain these results are the effectiveness of its marketing strategy, the recovery of its market share in the northern area of Colombia, the reactivation of the US economy, stronger construction growth in Honduras, maintaining of competitive prices and costs and a focus on innovative products. These factors also translated into an increase of 14% and 4%, respectively, of the volumes of cement and concrete sold by the company in 2015 (Graph 2).
For 2016 we estimate double-digit growth in CA revenues, as the expected reduction in sales in Colombia due to slower growth in the country will be offset by good performance in the other regions (USA and Central America & Caribbean). This is derived from the greater growth of the construction business in the states covered by Cementos Argos in United States and the reactivation of infrastructure projects in Panama. In 2017 and 2018, sales in Colombia should increase due to demand from 4G Concessions projects. USA and Central America & Caribbean, on their part, should display stable growth due to the development of new infrastructure projects and favorable demographic trends.
In 2015, Cementos Argos generated the greatest EBITDA in its history (COP 1.52 billion) and increased its EBITDA Margin to 19.2% from 16.6% posted in 2014. This was achieved thanks to the greater sales, the concentration of efforts in consolidating its recently acquired operations, the improvements in energy efficiency and the transmission of best practices between countries. According to our forecast, EBITDA Margin will be around 20% between 2016 and 2018 as a result, primarily, of the operating leverage on the company’s figures of the greater volumes sold in United States, given that it has already reached its break-even point in that region.

WWW.BRC.COM.CO May 13, 2016 Page 7 of 22
Grupo Argos S.A.
Table 3. Breakdown of revenues and EBITDA of Cementos Argos by region
Colombia
2012 2013 2014 2015
Revenues 2,287,000 2,551,493 2,510,019 2,977,169
EBITDA 806,000 906,801 667,631 876,982
Growth in Revenues 19.5% 11.6% -1.6% 18.6%
EBITDA Margin 35.2% 35.5% 26.6% 29.5%
Growth in EBITDA 34.8% 12.5% -26.4% 31.4%
United States
2012 2013 2014 2015
Revenues 1,194,000 1,402,500 2,194,141 3,415,549
EBITDA -13,000 28,010 114,531 303,436
Growth in Revenues 46.0% 17.5% 56.4% 55.7%
EBITDA Margin -1.1% 2.0% 5.2% 8.9%
Growth in EBITDA -75.0% 115.5% 308.9% 164.9%
Central America & Caribbean
2012 2013 2014 2015
Revenues 715,000 837,035 1,083,485 1,482,177
EBITDA 160,000 192,000 317,497 459,071
Growth in Revenues -8.2% 17.1% 29.4% 36.8%
EBITDA Margin 22.4% 22.9% 29.3% 31.0%
Growth in EBITDA -17.5% 20.0% 65.4% 44.6%
TOTAL
2012 2013 2014 2015
Revenues 4,380,393 4,968,414 5,817,129 7,912,003
EBITDA 791,190 978,108 968,147 1,517,701
Growth in Revenues 24.8% 13.4% 17.1% 36.0%
EBITDA Margin 18.1% 19.7% 16.6% 19.2%
Growth in EBITDA 6.9% 23.7% -1.0% 56.8%
Share of total Revenues 2012 2013 2014 2015
Colombia 52.2% 51.4% 43.1% 37.6%
USA 27.3% 28.2% 37.7% 43.2%
Central America & Caribbean 16.3% 16.8% 18.6% 18.7%
Share of total EBITDA 2012 2013 2014 2015
Colombia 101.9% 92.7% 69.0% 57.8%
USA -1.6% 2.9% 11.8% 20.0%
Central America & Caribbean 20.2% 19.6% 32.8% 30.2%
Source: Cementos Argos. Amounts in millions of COP

WWW.BRC.COM.CO May 13, 2016 Page 8 of 22
Grupo Argos S.A.
Source: Cementos Argos.
The strong draught since the fourth quarter of 2014 substantially reduced rainfall in the country in 2015 (graph 3), which increased demand for generation from thermal plants by the National Electricity System. Given the high proportion of plants of this type in the assets of Celsia (48%), this situation enabled to company to increase its total revenues by 42.6% that year. Other contributing factors were the adequate performance of its power plants in Central America (which accounted for 17% of this item and which benefitted from the devaluation) and the positive trends of the distribution business in Colombia, which grew by 14% and contributed 25.9% of sales (Table 4).
Source: Celsia.
Table 4. Breakdown of revenues and EBITDA of Celsia by region
Revenues
2013 2014 2015
Generation Colombia 1,303,758 1,426,415 1,669,322
Reliability charge (COP) 221,617 214,145 308,703
Colombia Total Revenues –Generation 1,525,375 1,640,560 1,978,025
Growth % 38.5% 7.6% 20.6%
Revenues Colombia –Distribution 767,676 837,700 954,739
Graph 2
Volumes of cement and concrete sold by CA in 2014 and 2015
Graph 3
Rainfall in Colombia

WWW.BRC.COM.CO May 13, 2016 Page 9 of 22
Grupo Argos S.A.
Growth % 4.0% 9.1% 14.0%
Revenues Colombia COP 2,381,116 2,562,856 3,064,109
Growth Colombia 1457.2% 7.6% 19.6%
Revenues CCA –COP 0 25,927 627,589
Total revenues 2,381,116 2,588,783 3,691,698
Growth Total revenues 17.7% 8.7% 42.6%
EBITDA 2013 2014 2015
EBITDA Colombia –Generation 605,426 631,644 177,418
Growth EBITDA N/D 4.3% -71.9%
EBITDA Margin 39.7% 38.5% 9.0%
EBITDA Colombia –Distribution 259,137 276,624 312,514
Growth EBITDA N/D 6.7% 13.0%
EBITDA Margin 33.8% 33.0% 32.7%
EBITDA Central America 0 -3,223 193,612
Growth EBITDA N/A N/A N/A
EBITDA Margin N/A -12.4% 30.9%
EBITDA Total 864,563 905,045 683,544
Growth EBITDA 18.24% 4.7% -24.5%
EBITDA Margin 36.3% 35.0% 18.5%
Source: Celsia. Amounts in millions of COP
The low rainfall levels in Colombia will continue to affect the results of Celsia during 2016 because, according to specialists on this matter, this weather phenomenon is expected to continue until the end of the first half of the year. We estimate that revenue growth will stabilize after 2017 due to the reestablishment of normal rainfall patterns and the start up of new assets in the system. Central America, on its part, will maintain the positive trends observed in 2015 and will contribute close to 17% of the total revenues of Celsia by the end of 2018.
The increase in Celsia revenues in 2015 was not reflected in its EBITDA, which dropped 24.5% in 2015 and implied a drop in margin to 18.5% from 35% posted in 2014. The main causes for this drop are the greater purchases of power that the company had to buy in the trading market in order to fulfill its contractual obligations, the increase in generation costs of the thermal power plants and the partial recognition under the current regulatory framework of the Colombian power industry of the cost of generating fuel-based power (through a scarcity price). We forecast a recovery of this indicator after 2017, based on the company’s lower contractual exposure to climate change and the greater expected profitability of its distribution business and its operations in Central America.
It is important to mention that Celsia has defined a new five-year strategic plan that focuses on addressing customer needs through three business units (cities, companies and households). The effectiveness of this plan in reducing the volatility of the company’s profitability indicators will be an aspect we will follow up on in upcoming reviews for inclusion in our forecasts.
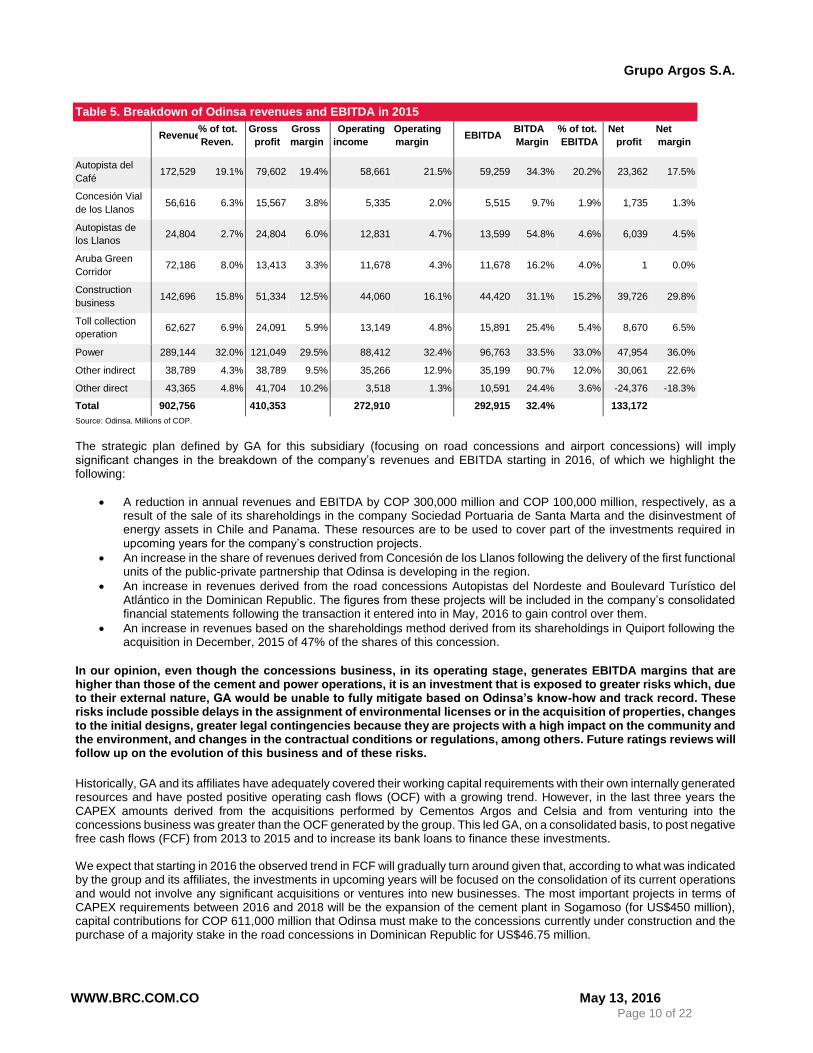
Odinsa revenues in 2015 totaled COP 902,924 million, equivalent to annual growth of 15.4%. Of these, GA only included in its financial statements COP 294,360 million, which were the sales of the last quarter of the year, given that the acquisition was completed in September that year. The annual increase in this item is primarily the result of the good performance of average daily traffic on Autopistas del Café (Coffee Highway) (19.1% of sales), the positive results of its power affiliates (32% of revenues) and adequate performance of its construction and concessions businesses that are consolidated through the shareholdings method, such as Opain and Hatovial (Table 5). We highlight in this regard that close to 55% of the operating revenues of this business in 2015 were generated outside of Colombia.
WWW.BRC.COM.CO May 13, 2016 Page 10 of 22
Grupo Argos S.A.
Table 5. Breakdown of Odinsa revenues and EBITDA in 2015
Revenues % of tot.
Reven.
Gross
profit
Gross
margin
Operating
income
Operating
margin
EBITDA EBITDA
Margin
% of tot.
EBITDA
Net
profit
Net
margin
Autopista del
Café
172,529
19.1%
79,602
19.4%
58,661
21.5%
59,259
34.3%
20.2%
23,362
17.5%
Concesión Vial
de los Llanos
56,616
6.3%
15,567
3.8%
5,335
2.0%
5,515
9.7%
1.9%
1,735
1.3%
Autopistas de
los Llanos
24,804
2.7%
24,804
6.0%
12,831
4.7%
13,599
54.8%
4.6%
6,039
4.5%
Aruba Green
Corridor
72,186
8.0%
13,413
3.3%
11,678
4.3%
11,678
16.2%
4.0%
1
0.0%
Construction
business
142,696
15.8%
51,334
12.5%
44,060
16.1%
44,420
31.1%
15.2%
39,726
29.8%
Toll collection
operation
62,627
6.9%
24,091
5.9%
13,149
4.8%
15,891
25.4%
5.4%
8,670
6.5%
Power 289,144 32.0% 121,049 29.5% 88,412 32.4% 96,763 33.5% 33.0% 47,954 36.0%
Other indirect 38,789 4.3% 38,789 9.5% 35,266 12.9% 35,199 90.7% 12.0% 30,061 22.6%
Other direct 43,365 4.8% 41,704 10.2% 3,518 1.3% 10,591 24.4% 3.6% -24,376 -18.3%
Total 902,756 410,353 272,910 292,915 32.4% 133,172
Source: Odinsa. Millions of COP.
The strategic plan defined by GA for this subsidiary (focusing on road concessions and airport concessions) will imply significant changes in the breakdown of the company’s revenues and EBITDA starting in 2016, of which we highlight the following:
A reduction in annual revenues and EBITDA by COP 300,000 million and COP 100,000 million, respectively, as a result of the sale of its shareholdings in the company Sociedad Portuaria de Santa Marta and the disinvestment of energy assets in Chile and Panama. These resources are to be used to cover part of the investments required in upcoming years for the company’s construction projects.
An increase in the share of revenues derived from Concesión de los Llanos following the delivery of the first functional units of the public-private partnership that Odinsa is developing in the region.
An increase in revenues derived from the road concessions Autopistas del Nordeste and Boulevard Turístico del Atlántico in the Dominican Republic. The figures from these projects will be included in the company’s consolidated financial statements following the transaction it entered into in May, 2016 to gain control over them.
An increase in revenues based on the shareholdings method derived from its shareholdings in Quiport following the acquisition in December, 2015 of 47% of the shares of this concession.
In our opinion, even though the concessions business, in its operating stage, generates EBITDA margins that are higher than those of the cement and power operations, it is an investment that is exposed to greater risks which, due to their external nature, GA would be unable to fully mitigate based on Odinsa’s know-how and track record. These risks include possible delays in the assignment of environmental licenses or in the acquisition of properties, changes to the initial designs, greater legal contingencies because they are projects with a high impact on the community and the environment, and changes in the contractual conditions or regulations, among others. Future ratings reviews will follow up on the evolution of this business and of these risks.
Historically, GA and its affiliates have adequately covered their working capital requirements with their own internally generated resources and have posted positive operating cash flows (OCF) with a growing trend. However, in the last three years the CAPEX amounts derived from the acquisitions performed by Cementos Argos and Celsia and from venturing into the concessions business was greater than the OCF generated by the group. This led GA, on a consolidated basis, to post negative free cash flows (FCF) from 2013 to 2015 and to increase its bank loans to finance these investments.
We expect that starting in 2016 the observed trend in FCF will gradually turn around given that, according to what was indicated by the group and its affiliates, the investments in upcoming years will be focused on the consolidation of its current operations and would not involve any significant acquisitions or ventures into new businesses. The most important projects in terms of CAPEX requirements between 2016 and 2018 will be the expansion of the cement plant in Sogamoso (for US$450 million), capital contributions for COP 611,000 million that Odinsa must make to the concessions currently under construction and the purchase of a majority stake in the road concessions in Dominican Republic for US$46.75 million.

WWW.BRC.COM.CO May 13, 2016 Page 11 of 22
Grupo Argos S.A.
As of December, 2015, 53% of the group’s consolidated financial debt was primarily denominated in dollars. The group mitigated its foreign exchange exposure through the revenues and EBITDA derived from its operations in United States and Central America (which are also tied to the dollar) and the use of currency hedging when required. We do not expect changes in this aspect in the medium term.
On a consolidated basis, the group has a high concentration of debt payments in 2016 because both the loan taken out by Celsia to acquire assets in Central America and some of the bank loans of Cementos Argos come due. Additionally, these two subsidiaries will have to amortize part of their bonds outstanding in the market in the same year. We do not believe there is any risk of non-payment derived from this situation, because the group and its member companies have the financial flexibility required to extend the terms of these obligations without much difficulty.
The group’s financial flexibility is reflected in its negotiating power with the banks, its experience in issuing and placing securities and shares in the Colombian market, the size, tradability and continued revaluation of its non-strategic investment portfolio (the value of which as of end-2015 was COP 6.09 billion), the possibility it has of divesting part of its strategic portfolio without losing control over the companies, and the option it has of selling part of its land bank (valued at COP 3 billion as of December, 2015).
II. OPPORTUNITIES AND THREATS
What might lead us to raise the rating BRC Investor Services S.A. SCV identified the following opportunities that might lead us to improve the current rating:
Manage to reduce the consolidated level of leverage of the group above our forecast in such a manner that the gross debt/EBITDA ratio is located in the range of 2x to 3x in a sustainable manner over the next three years.
Manage to take EBITDA levels for the group’s three strategic businesses (cement, power and concessions) above our forecast over the next three years.
A greater impact than estimated in the development of infrastructure projects in the countries where group affiliates supply their goods and services.
The achievement of the synergies expected by the group in its concessions business.
Continued revaluation and tradability of its strategic and non-strategic investment portfolios.
Fulfillment of the revenue forecasts of its businesses under development (ports and real estate).
The use of alternative sources of financing that would enable the group and its affiliates to obtain additional resources to those derived from the operation of its strategic businesses in order to reduce its current levels of indebtedness.
What might lead us to lower the rating BRC Investor Services S.A. SCV has identified the following aspects for improvement and/or follow-up of the company and/or the industry that could affect the current rating:
Increases in levels of financial debt or undertaking of new acquisitions that generate additional pressure on the group’s indebtedness indicator in such as manner that its consolidated gross debt/EBITDA ratio is greater than 4x.
A greater impact than we have estimated in the slowdown of the Colombian economy on the group’s operations.
Delays in construction of 4G concession projects that would reduce or delay their impact on the Colombian economy.
Worsening of the El Niño phenomenon in Colombia in such a manner that current forecasts are exceeded and that the poor performance of Celsia’s generation business in the country continues to perform poorly.
The establishment of a long-term contracting policy at Celsia that creates exposure to climate risk similar to that of 2015.
Non-performance of the permanent regulatory adjustments to the scarcity price to resolve the inconsistencies that were observed in 2015 in this regard in the Colombian electric power market.

WWW.BRC.COM.CO May 13, 2016 Page 12 of 22
Grupo Argos S.A.
Delays in the works of the construction projects in progress awarded to Odinsa that would generate delays in the
delivery of the functional units and, consequently, in the reception of revenues.
Capital contributions to the construction projects that are greater than those estimated by Odinsa.
Deterioration of the organization’s liquidity levels.
III. THE ISSUER AND ITS BUSINESS
Grupo Argos S.A. is a company of sustainable investments with strategic businesses in infrastructure in the following industries: cement, power and road, airport and port concessions. In addition to its strategic businesses, GA has stakes in the coal and real estate businesses; it owns land banks for urban development and has a solid investment portfolio in the financial and food products industries (Graph 4). The value of the group’s both strategic and non-strategic investment portfolio as of December, 2015 was COP 18.3 billion.
Source: Grupo Argos
Cement Power Concessions Urban Development Ports Coal
Weight of
investments
Weight of portfolio
investments
Graph 4
Breakdown of the investment portfolio of Grupo Argos
Strategic Portfolio
Cement
Real Estate
Power Urban Development
Concessions Financial Sector*
Ports Food Products Industry*
*Consolidated holdings of common shares by parent company and subsidiaries

WWW.BRC.COM.CO May 13, 2016 Page 13 of 22
Grupo Argos S.A.
The main shareholders of GA are Grupo Nutresa and Grupo Sura (Graph 5), which are companies that specialize in the food products and financial sector, respectively. Given that these three entities hold cross-shareholdings with each other, both Sura and Nutresa form part of the non-strategic portfolio of Grupo Argos (Graph 4). Other major shareholders include pension funds with 11.4% and foreign funds with 10.78%.
The organizational structure of Grupo Argos is headed by the Assembly of Shareholders, which meets ordinarily once a year, followed by the Board of Directors comprised by seven members, all of them principals, of whom five fulfill the criteria of independence according to Colombian law and the Governance Code. The Board has three support committees (Auditing, Finance and Risks; Sustainability and Corporate Governance; and Appointments and Remuneration), and meets every two months. Its members are elected by the Assembly for two-year terms.
Source: Grupo Argos. Ordinary shares.
Strategic businesses
Cementos Argos S.A.
This80-year-old company is the oldest subsidiary of the group. It primary business is production of cement, concrete and derived products. It participates in three regions: Colombia, Central America (primarily Panama and Honduras) and in southeastern United States in the states of Florida, Georgia, South Carolina, North Carolina, Arkansas, Alabama, Mississippi, Virginia and Texas. As of December, 2015 it had installed capacity of 21 million metric tons of cement and 18 million cubic meters of cement.
The company is the fifth-largest cement producer in Latin America. It is the industry leader in Colombia, the second-largest cement and concrete producer in southeastern United States and one of the two main players in the Central American industry (Graph 6).
Graph 5
Grupo Argos Shareholders
Grupo Sura Grupo Nutresa Pension Funds Foreign Funds Minority shareholders

WWW.BRC.COM.CO May 13, 2016 Page 14 of 22
Grupo Argos S.A.
Source: Cementos Argos.
Graph 6
Distribution of Cementos Argos assets by region
Colombia Caribbean & Central America
9 cement plants 1 cement plant
59 concrete plants
13 concrete plants
1 port/terminal 6 clinker mills
36 distribution centers
11 ports/terminals
682 mixer trucks 15 distribution centers
4,976 employees 170 mixer trucks
1,120 employees
United States
3 cement plants 1,734 mixer trucks (40 running on natural gas)
304 concrete plants 985 train wagons
3 clinker mills 3,151 employees
12 ports/terminals
18 distribution centers

WWW.BRC.COM.CO May 13, 2016 Page 15 of 22
Grupo Argos S.A.
Celsia S.A. ESP
Its line of business is the supply of electric power generation and commercialization services. As of December, 2015, Celsia was in fourth place in the generation segment (in terms of installed capacity in MW) and in fifth place in distribution (demand by Network Operator in GWh) in the Colombian electric power market, and was the second-largest generator in Panama and the fifth-largest in Costa Rica.
Source: Celsia.
27 power plants
21 hydraulic
5 thermal
1 wind
2 generation projects
Transmission and Distribution Business Installed generation capacity (%)
Hydraulic 50%
Thermal 48%
Wind 2%
274 km of transmission networks (< 220 kV)
20,069 km of distribution networks (< 220 kV)
6 transmission and distribution projects
Odinsa S.A.
This company, incorporated in the 1990s, is in the business of structuring, promoting, managing and developing large infrastructure projects in Latin America and the Caribbean. GA acquired it through several transactions in the Colombian Securities Exchange (BVC by its acronym in Spanish) that were completed in September of 2015. For this reason, the consolidated financial statements of GA only include the results of the last quarter of that year.
Graph 7
Asset distribution of Celsia

WWW.BRC.COM.CO May 13, 2016 Page 16 of 22
Grupo Argos S.A.
Source: Odinsa.
9 highways 1,346 kilometers
1.9 billion backlog
34 million vehicles/year
2 plants
246 MW
2 airports 316,000 m2 of usable area 36 million passengers per year
1 port
30,000 m2
Odinsa has two business units: road concessions in Colombia, Aruba and Dominican Republic; and airport concessions in Colombia and Ecuador. As of December, 2015 it also had investments in power assets (one thermal plant in Chile and another in Panama) and in ports (shareholdings in the port of Barranquilla), which are to be sold in 2016.
Businesses under development
Compas S.A.: It was established in December, 2012 as a result of the merger of the ports business of Grupo Argos with the investment fund Southern Port Holding Corp, each with a 50% stake. The company is consolidated into GA through the equity shareholdings method. Control over it is shared and decisions are made jointly.
The entity provides comprehensive international trade logistics services in Colombia, Panama and United States through nine ports, six of them in Colombia (Tolú, Barranquilla, Buenaventura, Cartagena, Buenavista and Tamalameque), two abroad (Panama and Houston, Texas) and one under development (the river port of Buenaventura) with transportation capacity of 13 million tons. It has three business units: bulk food, coal and liquids, and containers and general cargo.
As of December, 2015 this company generated revenues of COP 160,000 million and EBITDA of COP 60,249 million, equivalent to a margin of 37.7%.
Urban Development: this business is managed by a department of Grupo Argos and consequently is 100% consolidated into
group figures. Its business is to engage in real estate land development projects through road infrastructure, public utility networks and green areas, among others. Its land portfolio holds over 2,500 hectares located primarily in Barranquilla and Barú Island.
Pactia: real estate fund established in August, 2015 through a joint venture between GA and Conconcreto. Its objective is to develop and expand the rental properties line. It has assets worth COP 2.1 billion and gross leasable area of 435,000 m2, with the expectation of developing an additional 300,000 m2 over the next four years. It is present in Colombia and Panama through five business lines: retail, industry, offices, hotels and self-storage.
Graph 8
Distribution of assets of Odinsa

WWW.BRC.COM.CO May 13, 2016 Page 17 of 22
Grupo Argos S.A.
The financial information included in this report is based on: 1) the audited financial statements (in COLGAAP for fiscal years
2012 and 2013 and in IFRS for fiscal years 2014 and 2015) of Grupo Argos (consolidated and individual) and of its main
affiliates: Cementos Argos S.A., Celsia S.A. ESP and Odinsa S.A., 2) the management reports of the group and its affiliates
published on its investor website and 3) the forecasts prepared by GA of the financial statements of the Group, the holding
company and its affiliates for the 2016-2018 period.
BRC Investor Services does not perform any auditing, and consequently the entity’s management is fully responsible for the
integrity and truthfulness of all the information that was provided and that was the basis for preparing this report. Additionally,
the rating agency reviewed publicly available information and compared it with the information provided by the rated entity /
the rated issuer.
A risk rating issued by BRC Investor Services S.A. –Sociedad Calificadora de Valores– is a technical opinion and at no time
is it intended as a recommendation to buy, sell or hold a given investment and/or security, and does not imply any assurance
of payment of the security, but an assessment on the probability that the principal and its yields will be paid in a timely manner.
The information contained in this publication has been obtained from sources that are presumed to be reliable and precise;
consequently, we shall not be held responsible for any errors or omissions or for any results derived from the use of this
information.
If you have any questions regarding the indicators included in this document, please see the glossary available at
www.brc.com.co.
To see the definitions of our ratings, please see www.brc.com.co or click here.

WWW.BRC.COM.CO May 13, 2016 Page 18 of 22
Grupo Argos S.A.
IV. FINANCIAL STATEMENTS
General Balance Sheet ASSETS Cash and Tradable investments Cash with restrictions for use Trade accounts receivable Other accounts receivable Inventories Pre-paid expenses Other current assets Total Current assets Net accounts receivable Inventories Permanent investments, net PPE, net Deferred and intangible assets, Net Investment properties Other assets Asset revaluation, net Total Non-Current Assets TOTAL ASSETS LIABILITIES Financial debt, S.T. Bonds and commercial paper Accounts payable Taxes duties and levies Labor obligations Estimated liabilities & provisions Other current liabilities Current liabilities Financial debt, L.T. Bonds outstanding Bonds Convertible into Shares Taxes duties and levies Labor obligations Accounts payable Other liabilities Non-Current Liabilities TOTAL LIABILITIES Total Shareholders’ Equity Minority interest Liabilities + S. Equity
Consolidated financial statements Amounts in Millions of COP Vertical anal. Horizontal anal.
IFRS IFRS COLGAAP IFRS

WWW.BRC.COM.CO May 13, 2016 Page 19 of 22
Grupo Argos S.A.
Income Statement Operating revenues Cement and concrete Power Real estate business Portfolio Concessions Others and disposals Cost of sales CS goods and services DA in Cost of sales Gross profit GO (Admin and Sales) DA in Expenses Other revenues/expenses Wealth tax Operating profit Other Revenues Financial Dividends and Stakes of Int Diff. in FX translation Other Other Expenses Financial Diff. in FX translation Other Pre-tax Profit Total Taxes Shareholdings Minority Int. Profit/loss disc. oper. Net Profit EBITDA
CASH FLOW Net Profit Adjustment to reconcile net profit with net cash provided by operations Cash generated in operations Changes in operating assets and liabilities Net cash provided by operations
Changes in PPE Changes in permanent invest. Deferred assets Other Net cash after investment activities Net dividends Changes in financial debt Financial expenses, net Other Non-operating cash flow
Vertical anal. Horizontal anal. IFRS IFRS COLGAAP IFRS
IFRS DA: Depreciation & Amortization

WWW.BRC.COM.CO May 13, 2016 Page 20 of 22
Grupo Argos S.A.
Consolidated financial indicators
PROFITABILITY
Net sales
EBITDA
Sales growth
EBITDA growth
Gross Margin
Operating Margin
Net Margin
EBITDA Margin
Sales/ Assets
ROA
ROE
ACTIVITY
KTNO
Productivity KNTO (Sales/KNTO)
AR Turnover
AP Turnover
Inventories Turnover
Cash cycle
Liquidity
Cash
Current Ratio
Acid Test
Indebtedness
Gross debt
Net debt
S.T. Debt (Amount)
S.T. Debt (%)
L.T. Debt
L.T. Debt (%)
Debt /Equity
Fin. debt / Total Liabilities
Leverage (Liabilities/ Equity)
Hedging
Interest/ Sales
EBITDA / Interest
EBITDA / Fin. Debt
Gross debt / EBITDA
Net debt / EBITDA
Debt service
FCO/ Debt Service
Ebitda/ Debt Service
IFRS

WWW.BRC.COM.CO May 13, 2016 Page 21 of 22
Grupo Argos S.A.
General Balance Sheet ASSETS Cash Temporary investments Net accounts receivable Inventories Pre-paid expenses Other assets Total current assets Net accounts receivable Permanent investments, net Investment properties PPE, net Inventories Deferred charges, net Other assets Asset revaluation, net Total Non-Current Assets TOTAL ASSETS LIABILITIES Financial debt S.T Bonds and commercial paper Accounts payable Taxes duties and levies Labor obligations Dividends payable Other current liabilities Current liabilities Financial debt, L.T. Bonds and commercial paper Taxes duties and levies Labor obligations Other liabilities Non-Current Liabilities Total Liabilities Total Shareholders’ Equity Liabilities + S. Equity
Vertical anal. Horizontal anal. IFRS IFRS COLGAAP IFRS
INDIVIDUAL Amounts in millions of $

WWW.BRC.COM.CO May 13, 2016 Page 22 of 22
Grupo Argos S.A.
Income Statement Operating revenues Revenues from sale of investments Shareholdings Method Dividends Real estate business Other Cost of sales Cost of sale of investments Cost of real estate business Gross profit GO (Admin and Sales) DA Expenses Other Wealth tax Operating profit Other Revenues Other Expenses Financial Diff. in FX translation Other Pre-tax profit Taxes Net Profit EBITDA
CASH FLOW Net Profit Adjustment to reconcile net profit with net cash provided by operations Cash generated in operations Changes in operating assets and liabilities Net cash provided by operations
Changes in PPE Changes in permanent invest. Deferred assets Other Net cash after investment activities
Dividends Changes in financial debt Financial expenses, net Other Non-operating cash flow
DA: Depreciation & Amortization
Vertical anal. Horizontal anal. IFRS IFRS COLGAAP IFRS

WWW.BRC.COM.CO May 13, 2016 Page 23 of 22
Grupo Argos S.A.
Individual financial indicators
V. MEMBERS OF THE TECHNICAL COMMITTEE
The profiles of the members of the Ratings Technical Committee are available at our website
www.brc.com.co
PROFITABILITY
Net sales
EBITDA
Sales growth
EBITDA growth
Gross Margin
Operating Margin
Net Margin
EBITDA Margin
Sales/ Assets
ROA
ROE
ACTIVITY
KTNO
Productivity KNTO (Sales/KNTO)
AR Turnover
AP Turnover
Inventories Turnover
Cash cycle
Liquidity
Cash
Current Ratio
Acid Test
Indebtedness
Gross debt
Net debt
S.T. Debt (Amount)
S.T. Debt (%)
L.T. Debt
L.T. Debt (%)
Debt /Equity
Fin. debt / Total Liabilities
Leverage (Liabilities/ Equity)
Hedging
Interest/ Sales
EBITDA / Interest
EBITDA / Fin. Debt
Gross debt / EBITDA
Net debt / EBITDA
Debt service
FCO/ Debt Service
Ebitda/ Debt Service
IFRS