Rates of reportable STDs among young people 15-24 … of Reportable STDs among Young People 15 - 24...
28
Rates of Reportable STDs among Young People 15 - 24 Years of Age Minnesota, 2008 Chlamydia Rates by County Rate (per 100,000 population) <=1000.0 1000.1-3000.0 >3000.0 Gonorrhea Rates by County Rate (per 100,000 population) <=300.0 300.1-600.0 >600.0 P&S Syphilis Rates by County Rate (per 100,000 population) <=2.2 2.21-10.0 >10.0 Cases and Rates per 100,000 Cases Rate Chlamydia 9888 1349.8 Gonorrhea 1788 244.1 P&S Syphilis 27 3.7 Data Source: National Electronic Telecommunications System for Surveillance, Centers for Disease Control and Prevention. November 2009 CDC/NCHS 2007 bridged population estimates, derived from US Census data, used for rate denominators.
Transcript of Rates of reportable STDs among young people 15-24 … of Reportable STDs among Young People 15 - 24...
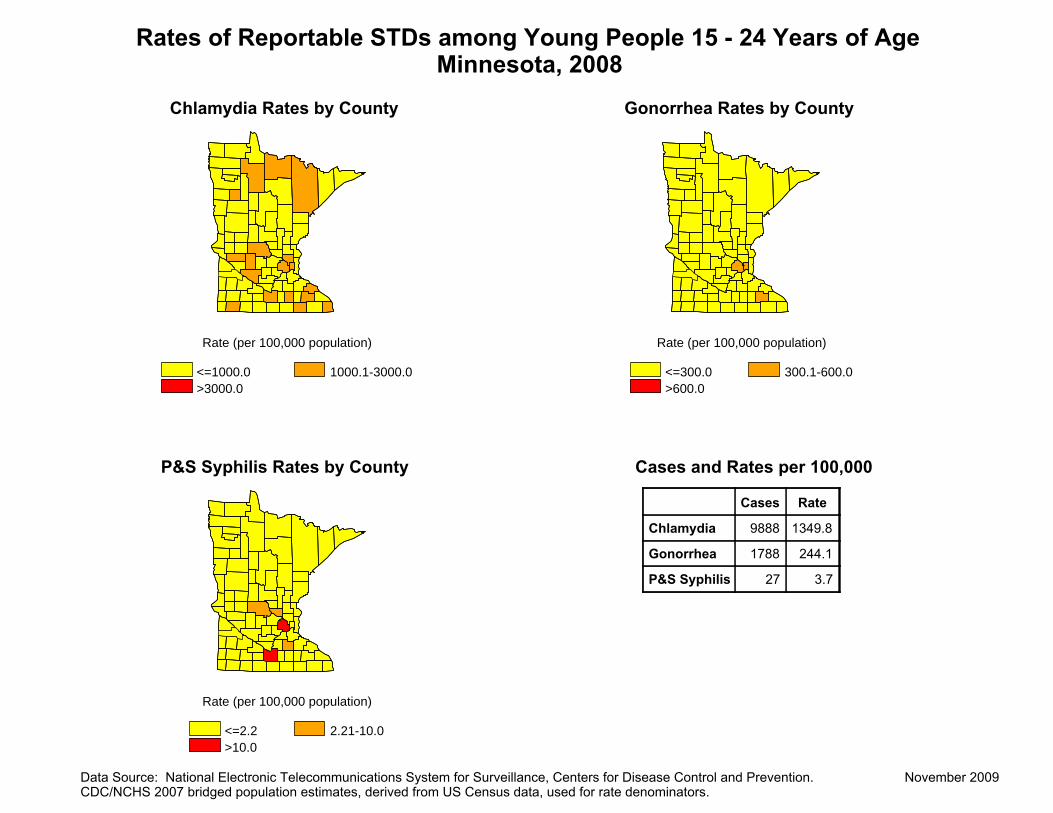
Rates of Reportable STDs among Young People 15 - 24 Years of AgeMinnesota, 2008
Chlamydia Rates by County
Rate (per 100,000 population)
<=1000.0 1000.1-3000.0 >3000.0
Gonorrhea Rates by County
Rate (per 100,000 population)
<=300.0 300.1-600.0 >600.0
P&S Syphilis Rates by County
Rate (per 100,000 population)
<=2.2 2.21-10.0 >10.0
Cases and Rates per 100,000
Cases Rate
Chlamydia 9888 1349.8
Gonorrhea 1788 244.1
P&S Syphilis 27 3.7
Data Source: National Electronic Telecommunications System for Surveillance, Centers for Disease Control and Prevention. November 2009 CDC/NCHS 2007 bridged population estimates, derived from US Census data, used for rate denominators.
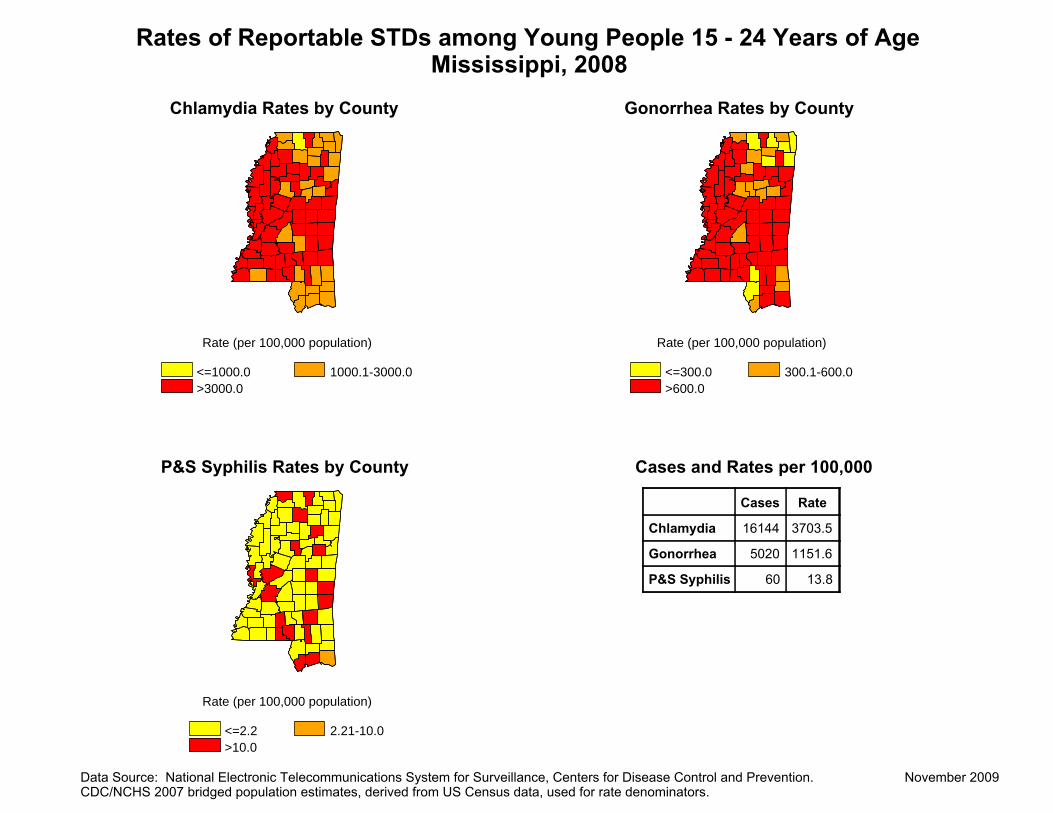
Rates of Reportable STDs among Young People 15 - 24 Years of AgeMississippi, 2008
Chlamydia Rates by County Gonorrhea Rates by County
Rate (per 100,000 population) Rate (per 100,000 population)
<=1000.0 1000.1-3000.0 <=300.0 300.1-600.0 >3000.0 >600.0
P&S Syphilis Rates by County Cases and Rates per 100,000
Cases Rate
Chlamydia 16144 3703.5
Gonorrhea 5020 1151.6
P&S Syphilis 60 13.8
Rate (per 100,000 population)
<=2.2 2.21-10.0 >10.0
Data Source: National Electronic Telecommunications System for Surveillance, Centers for Disease Control and Prevention. November 2009 CDC/NCHS 2007 bridged population estimates, derived from US Census data, used for rate denominators.
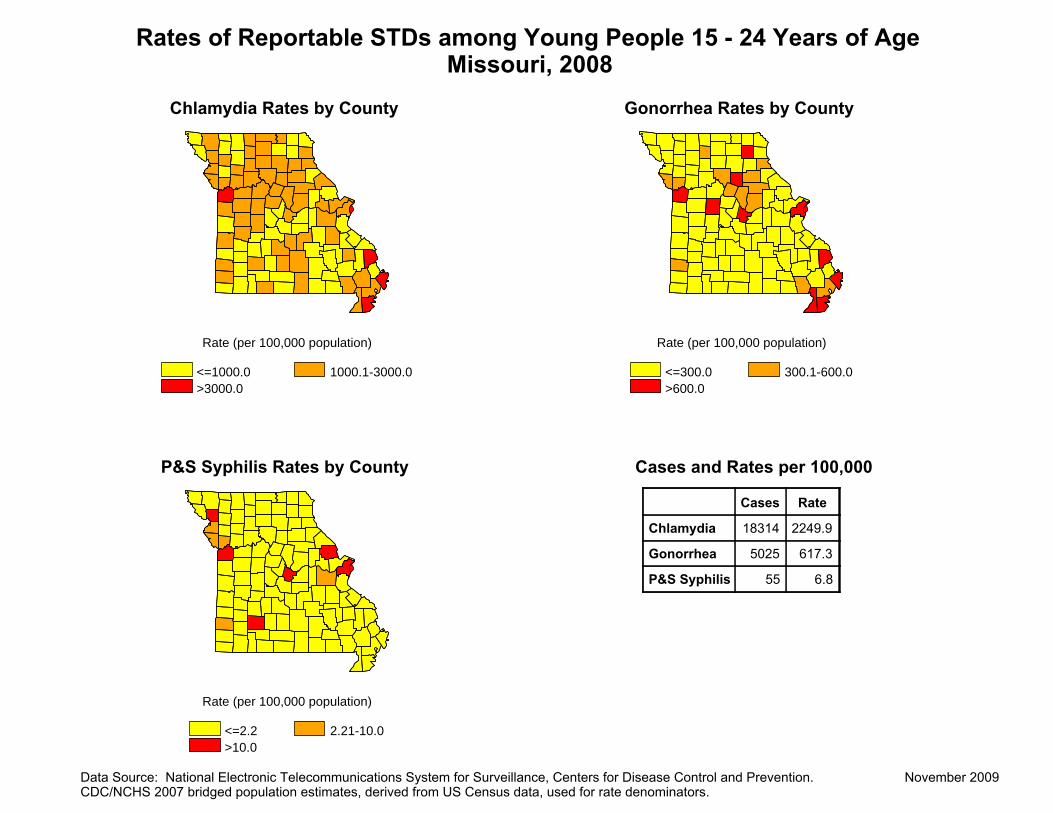
Rates of Reportable STDs among Young People 15 - 24 Years of AgeMissouri, 2008
Chlamydia Rates by County Gonorrhea Rates by County
Rate (per 100,000 population) Rate (per 100,000 population)
<=1000.0 >3000.0
1000.1-3000.0 <=300.0 >600.0
300.1-600.0
P&S Syphilis Rates by County Cases and Rates per 100,000
Cases Rate
Chlamydia
Gonorrhea
18314
5025
2249.9
617.3
P&S Syphilis 55 6.8
Rate (per 100,000 population)
<=2.2 2.21-10.0 >10.0
Data Source: National Electronic Telecommunications System for Surveillance, Centers for Disease Control and Prevention. November 2009 CDC/NCHS 2007 bridged population estimates, derived from US Census data, used for rate denominators.
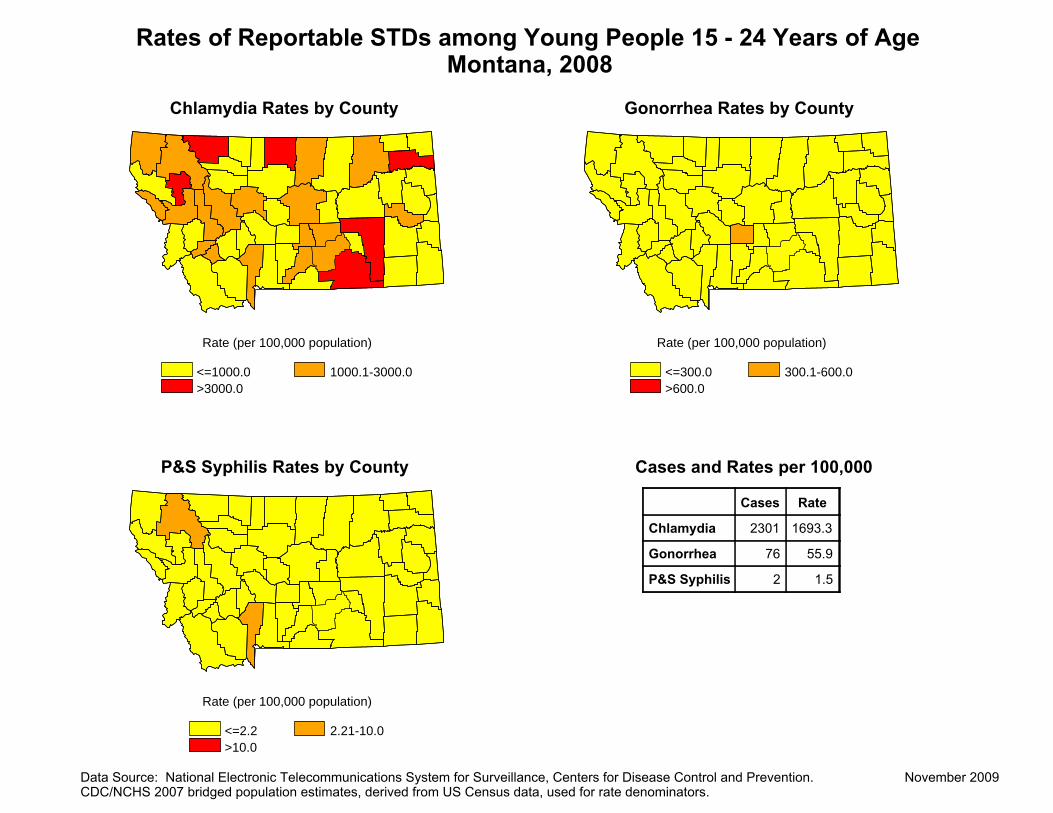
Rates of Reportable STDs among Young People 15 - 24 Years of AgeMontana, 2008
Chlamydia Rates by County Gonorrhea Rates by County
Rate (per 100,000 population)
<=1000.0 1000.1-3000.0 >3000.0
Rate (per 100,000 population)
<=300.0 300.1-600.0 >600.0
P&S Syphilis Rates by County Cases and Rates per 100,000
Cases Rate
Chlamydia 2301 1693.3
Gonorrhea 76 55.9
P&S Syphilis 2 1.5
Rate (per 100,000 population)
<=2.2 2.21-10.0 >10.0
Data Source: National Electronic Telecommunications System for Surveillance, Centers for Disease Control and Prevention. November 2009 CDC/NCHS 2007 bridged population estimates, derived from US Census data, used for rate denominators.

Rates of Reportable STDs among Young People 15 - 24 Years of AgeNebraska, 2008
Chlamydia Rates by County Gonorrhea Rates by County
Rate (per 100,000 population) Rate (per 100,000 population)
<=1000.0 1000.1-3000.0 <=300.0 300.1-600.0 >3000.0 >600.0
P&S Syphilis Rates by County Cases and Rates per 100,000
Cases Rate
Chlamydia 4059 1535.6
Gonorrhea 959 362.8
P&S Syphilis 1 0.4
Rate (per 100,000 population)
<=2.2 2.21-10.0 >10.0
Data Source: National Electronic Telecommunications System for Surveillance, Centers for Disease Control and Prevention. November 2009 CDC/NCHS 2007 bridged population estimates, derived from US Census data, used for rate denominators.

Rates of Reportable STDs among Young People 15 - 24 Years of AgeNevada, 2008
Chlamydia Rates by County Gonorrhea Rates by County
Rate (per 100,000 population) Rate (per 100,000 population)
<=1000.0 1000.1-3000.0 <=300.0 300.1-600.0 >3000.0 >600.0
P&S Syphilis Rates by County Cases and Rates per 100,000
Cases Rate
Chlamydia 6537 2056.3
Gonorrhea 1222 384.4
P&S Syphilis 16 5.0
Rate (per 100,000 population)
<=2.2 2.21-10.0 >10.0
Data Source: National Electronic Telecommunications System for Surveillance, Centers for Disease Control and Prevention. November 2009 CDC/NCHS 2007 bridged population estimates, derived from US Census data, used for rate denominators.
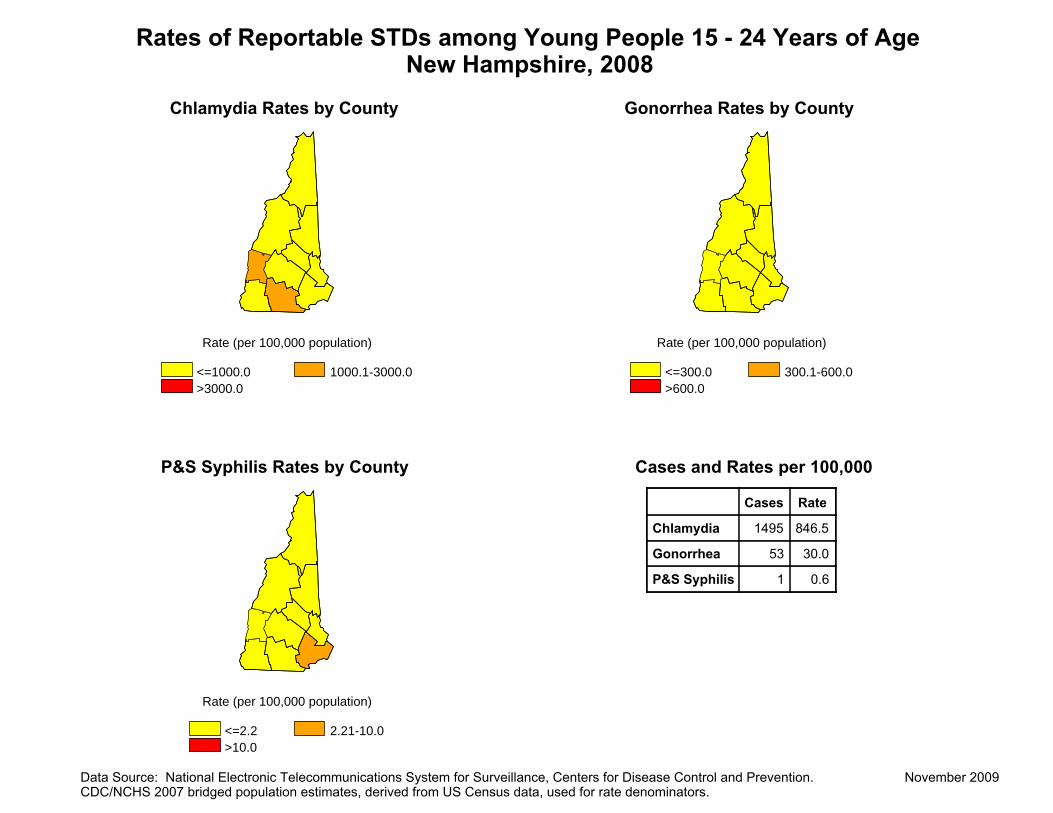
Rates of Reportable STDs among Young People 15 - 24 Years of AgeNew Hampshire, 2008
Chlamydia Rates by County Gonorrhea Rates by County
Rate (per 100,000 population) Rate (per 100,000 population)
<=1000.0 1000.1-3000.0 <=300.0 300.1-600.0 >3000.0 >600.0
P&S Syphilis Rates by County Cases and Rates per 100,000
Cases Rate
Chlamydia 1495 846.5
Gonorrhea 53 30.0
P&S Syphilis 1 0.6
Rate (per 100,000 population)
<=2.2 2.21-10.0 >10.0
Data Source: National Electronic Telecommunications System for Surveillance, Centers for Disease Control and Prevention. November 2009 CDC/NCHS 2007 bridged population estimates, derived from US Census data, used for rate denominators.

Rates of Reportable STDs among Young People 15 - 24 Years of AgeNew Jersey, 2008
Chlamydia Rates by County Gonorrhea Rates by County
Rate (per 100,000 population) Rate (per 100,000 population)
<=1000.0 1000.1-3000.0 <=300.0 300.1-600.0 >3000.0 >600.0
P&S Syphilis Rates by County Cases and Rates per 100,000
Cases Rate
Chlamydia 15854 1396.9
Gonorrhea 3328 293.2
P&S Syphilis 54 4.8
Rate (per 100,000 population)
<=2.2 2.21-10.0 >10.0
Data Source: National Electronic Telecommunications System for Surveillance, Centers for Disease Control and Prevention. November 2009 CDC/NCHS 2007 bridged population estimates, derived from US Census data, used for rate denominators.

Rates of Reportable STDs among Young People 15 - 24 Years of AgeNew Mexico, 2008
Chlamydia Rates by County Gonorrhea Rates by County
Rate (per 100,000 population)
<=1000.0 1000.1-3000.0 >3000.0
Rate (per 100,000 population)
<=300.0 300.1-600.0 >600.0
P&S Syphilis Rates by County Cases and Rates per 100,000
Cases Rate
Chlamydia 6244 2136.1
Gonorrhea 911 311.7
P&S Syphilis 7 2.4
Rate (per 100,000 population)
<=2.2 2.21-10.0 >10.0
Data Source: National Electronic Telecommunications System for Surveillance, Centers for Disease Control and Prevention. November 2009 CDC/NCHS 2007 bridged population estimates, derived from US Census data, used for rate denominators.

Rates of Reportable STDs among Young People 15 - 24 Years of AgeNew York, 2008
Chlamydia Rates by County Gonorrhea Rates by County
Rate (per 100,000 population) Rate (per 100,000 population)
<=1000.0 1000.1-3000.0 <=300.0 300.1-600.0 >3000.0 >600.0
P&S Syphilis Rates by County Cases and Rates per 100,000
Cases Rate
Chlamydia 59354 2126.8
Gonorrhea 9902 354.8
P&S Syphilis 246 8.8
Rate (per 100,000 population)
<=2.2 2.21-10.0 >10.0
Data Source: National Electronic Telecommunications System for Surveillance, Centers for Disease Control and Prevention. November 2009 CDC/NCHS 2007 bridged population estimates, derived from US Census data, used for rate denominators.

Rates of Reportable STDs among Young People 15 - 24 Years of AgeNorth Carolina, 2008
Chlamydia Rates by County Gonorrhea Rates by County
Rate (per 100,000 population)
<=1000.0 1000.1-3000.0 >3000.0
P&S Syphilis Rates by County
Rate (per 100,000 population)
<=300.0 300.1-600.0 >600.0
Cases and Rates per 100,000
Cases Rate
Chlamydia 27800 2260.0
Gonorrhea 9670 786.1
P&S Syphilis 85 6.9
Rate (per 100,000 population)
<=2.2 2.21-10.0 >10.0
Data Source: National Electronic Telecommunications System for Surveillance, Centers for Disease Control and Prevention. November 2009 CDC/NCHS 2007 bridged population estimates, derived from US Census data, used for rate denominators.

Rates of Reportable STDs among Young People 15 - 24 Years of AgeNorth Dakota, 2008
Chlamydia Rates by County Gonorrhea Rates by County
Rate (per 100,000 population)
<=1000.0 1000.1-3000.0 >3000.0
Rate (per 100,000 population)
<=300.0 300.1-600.0 >600.0
P&S Syphilis Rates by County Cases and Rates per 100,000
Cases Rate
Chlamydia 1412 1286.2
Gonorrhea 93 84.7
P&S Syphilis 0 0.0
Rate (per 100,000 population)
<=2.2 2.21-10.0 >10.0
Data Source: National Electronic Telecommunications System for Surveillance, Centers for Disease Control and Prevention. November 2009 CDC/NCHS 2007 bridged population estimates, derived from US Census data, used for rate denominators.

Rates of Reportable STDs among Young People 15 - 24 Years of AgeOhio, 2008
Chlamydia Rates by County Gonorrhea Rates by County
Rate (per 100,000 population) Rate (per 100,000 population)
<=1000.0 1000.1-3000.0 <=300.0 300.1-600.0 >3000.0 >600.0
P&S Syphilis Rates by County Cases and Rates per 100,000
Cases Rate
Chlamydia 35383 2248.1
Gonorrhea 10732 681.9
P&S Syphilis 98 6.2
Rate (per 100,000 population)
<=2.2 2.21-10.0 >10.0
Data Source: National Electronic Telecommunications System for Surveillance, Centers for Disease Control and Prevention. November 2009 CDC/NCHS 2007 bridged population estimates, derived from US Census data, used for rate denominators.

Rates of Reportable STDs among Young People 15 - 24 Years of AgeOklahoma, 2008
Chlamydia Rates by County Gonorrhea Rates by County
Rate (per 100,000 population)
<=1000.0 1000.1-3000.0 >3000.0
Rate (per 100,000 population)
<=300.0 300.1-600.0 >600.0
P&S Syphilis Rates by County Cases and Rates per 100,000
Cases Rate
Chlamydia 11098 2107.1
Gonorrhea 3290 624.7
P&S Syphilis 24 4.6
Rate (per 100,000 population)
<=2.2 2.21-10.0 >10.0
Data Source: National Electronic Telecommunications System for Surveillance, Centers for Disease Control and Prevention. November 2009 CDC/NCHS 2007 bridged population estimates, derived from US Census data, used for rate denominators.

Rates of Reportable STDs among Young People 15 - 24 Years of AgeOregon, 2008
Chlamydia Rates by County Gonorrhea Rates by County
Rate (per 100,000 population) Rate (per 100,000 population)
<=1000.0 1000.1-3000.0 <=300.0 300.1-600.0 >3000.0 >600.0
P&S Syphilis Rates by County Cases and Rates per 100,000
Cases Rate
Chlamydia 7341 1495.0
Gonorrhea 567 115.5
P&S Syphilis 3 0.6
Rate (per 100,000 population)
<=2.2 2.21-10.0 >10.0
Data Source: National Electronic Telecommunications System for Surveillance, Centers for Disease Control and Prevention. November 2009 CDC/NCHS 2007 bridged population estimates, derived from US Census data, used for rate denominators.
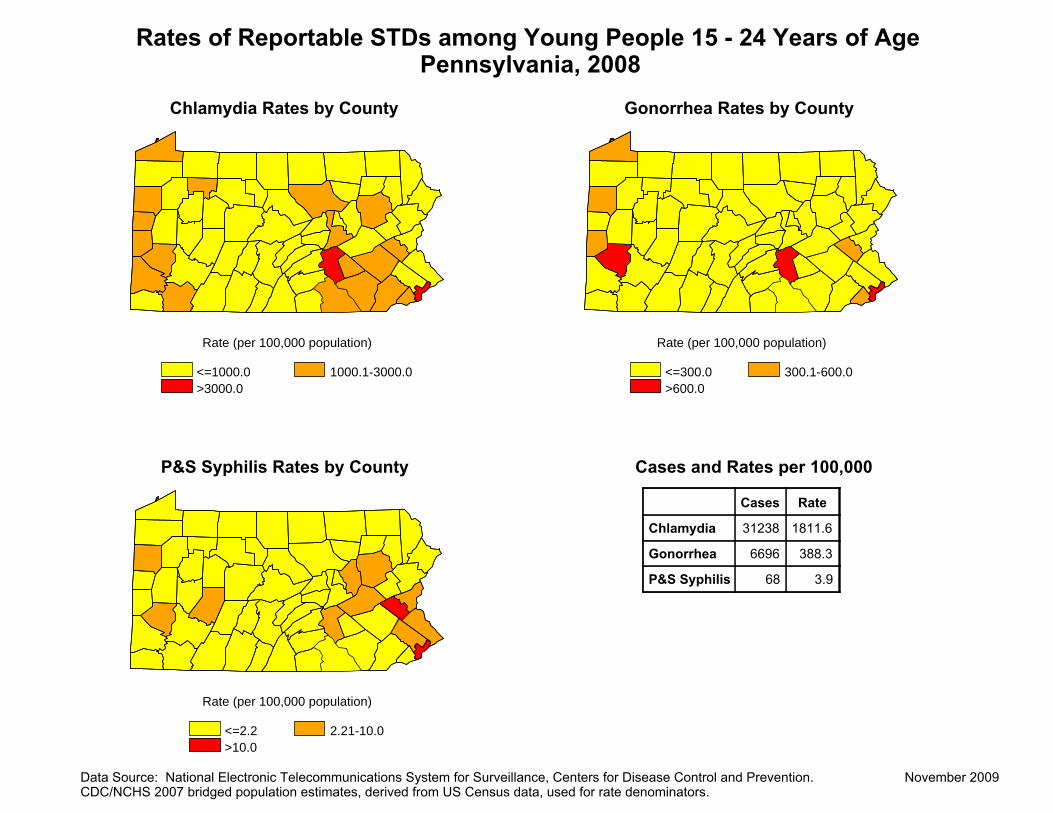
Rates of Reportable STDs among Young People 15 - 24 Years of AgePennsylvania, 2008
Chlamydia Rates by County Gonorrhea Rates by County
Rate (per 100,000 population) Rate (per 100,000 population)
<=1000.0 1000.1-3000.0 <=300.0 300.1-600.0 >3000.0 >600.0
P&S Syphilis Rates by County Cases and Rates per 100,000
Cases Rate
Chlamydia 31238 1811.6
Gonorrhea 6696 388.3
P&S Syphilis 68 3.9
Rate (per 100,000 population)
<=2.2 2.21-10.0 >10.0
Data Source: National Electronic Telecommunications System for Surveillance, Centers for Disease Control and Prevention. November 2009 CDC/NCHS 2007 bridged population estimates, derived from US Census data, used for rate denominators.

Rates of Reportable STDs among Young People 15 - 24 Years of AgeRhode Island, 2008
Chlamydia Rates by County Gonorrhea Rates by County
Rate (per 100,000 population) Rate (per 100,000 population)
<=1000.0 1000.1-3000.0 <=300.0 300.1-600.0 >3000.0 >600.0
P&S Syphilis Rates by County Cases and Rates per 100,000
Cases Rate
Chlamydia 2357 1486.3
Gonorrhea 168 105.9
P&S Syphilis 3 1.9
Rate (per 100,000 population)
<=2.2 2.21-10.0 >10.0
Data Source: National Electronic Telecommunications System for Surveillance, Centers for Disease Control and Prevention. November 2009 CDC/NCHS 2007 bridged population estimates, derived from US Census data, used for rate denominators.

Rates of Reportable STDs among Young People 15 - 24 Years of AgeSouth Carolina, 2008
Chlamydia Rates by County Gonorrhea Rates by County
Rate (per 100,000 population)
<=1000.0 1000.1-3000.0 >3000.0
Rate (per 100,000 population)
<=300.0 300.1-600.0 >600.0
P&S Syphilis Rates by County Cases and Rates per 100,000
Cases Rate
Chlamydia 19313 3113.4
Gonorrhea 6166 994.0
P&S Syphilis 31 5.0
Rate (per 100,000 population)
<=2.2 2.21-10.0 >10.0
Data Source: National Electronic Telecommunications System for Surveillance, Centers for Disease Control and Prevention. November 2009 CDC/NCHS 2007 bridged population estimates, derived from US Census data, used for rate denominators.

Rates of Reportable STDs among Young People 15 - 24 Years of AgeSouth Dakota, 2008
Chlamydia Rates by County Gonorrhea Rates by County
Rate (per 100,000 population)
<=1000.0 1000.1-3000.0 >3000.0
Rate (per 100,000 population)
<=300.0 300.1-600.0 >600.0
P&S Syphilis Rates by County Cases and Rates per 100,000
Cases Rate
Chlamydia 2127 1812.9
Gonorrhea 219 186.7
P&S Syphilis 1 0.9
Rate (per 100,000 population)
<=2.2 2.21-10.0 >10.0
Data Source: National Electronic Telecommunications System for Surveillance, Centers for Disease Control and Prevention. November 2009 CDC/NCHS 2007 bridged population estimates, derived from US Census data, used for rate denominators.

Rates of Reportable STDs among Young People 15 - 24 Years of AgeTennessee, 2008
Chlamydia Rates by County Gonorrhea Rates by County
Rate (per 100,000 population) Rate (per 100,000 population)
<=1000.0 1000.1-3000.0 <=300.0 300.1-600.0 >3000.0 >600.0
P&S Syphilis Rates by County Cases and Rates per 100,000
Cases Rate
Chlamydia 20577 2545.7
Gonorrhea 5568 688.9
P&S Syphilis 108 13.4
Rate (per 100,000 population)
<=2.2 2.21-10.0 >10.0
Data Source: National Electronic Telecommunications System for Surveillance, Centers for Disease Control and Prevention. November 2009 CDC/NCHS 2007 bridged population estimates, derived from US Census data, used for rate denominators.

Rates of Reportable STDs among Young People 15 - 24 Years of AgeTexas, 2008
Chlamydia Rates by County Gonorrhea Rates by County
Rate (per 100,000 population) Rate (per 100,000 population)
<=1000.0 >3000.0
1000.1-3000.0 <=300.0 >600.0
300.1-600.0
P&S Syphilis Rates by County Cases and Rates per 100,000
Cases Rate
Chlamydia
Gonorrhea
71587
19931
2044.0
569.1
P&S Syphilis 455 13.0
Rate (per 100,000 population)
<=2.2 2.21-10.0 >10.0
Data Source: National Electronic Telecommunications System for Surveillance, Centers for Disease Control and Prevention. November 2009 CDC/NCHS 2007 bridged population estimates, derived from US Census data, used for rate denominators.

Rates of Reportable STDs among Young People 15 - 24 Years of AgeUtah, 2008
Chlamydia Rates by County Gonorrhea Rates by County
Rate (per 100,000 population) Rate (per 100,000 population)
<=1000.0 1000.1-3000.0 <=300.0 300.1-600.0 >3000.0 >600.0
P&S Syphilis Rates by County Cases and Rates per 100,000
Cases Rate
Chlamydia 4000 883.8
Gonorrhea 211 46.6
P&S Syphilis 4 0.9
Rate (per 100,000 population)
<=2.2 2.21-10.0 >10.0
Data Source: National Electronic Telecommunications System for Surveillance, Centers for Disease Control and Prevention. November 2009 CDC/NCHS 2007 bridged population estimates, derived from US Census data, used for rate denominators.

Rates of Reportable STDs among Young People 15 - 24 Years of AgeVermont, 2008
Chlamydia Rates by County Gonorrhea Rates by County
Rate (per 100,000 population) Rate (per 100,000 population)
<=1000.0 1000.1-3000.0 <=300.0 300.1-600.0 >3000.0 >600.0
P&S Syphilis Rates by County Cases and Rates per 100,000
Cases Rate
Chlamydia 894 1017.1
Gonorrhea 20 22.8
P&S Syphilis 1 1.1
Rate (per 100,000 population)
<=2.2 2.21-10.0 >10.0
Data Source: National Electronic Telecommunications System for Surveillance, Centers for Disease Control and Prevention. November 2009 CDC/NCHS 2007 bridged population estimates, derived from US Census data, used for rate denominators.

Rates of Reportable STDs among Young People 15 - 24 Years of AgeVirginia, 2008
Chlamydia Rates by County Gonorrhea Rates by County
Rate (per 100,000 population)
<=1000.0 1000.1-3000.0 >3000.0
P&S Syphilis Rates by County
Rate (per 100,000 population)
<=300.0 300.1-600.0 >600.0
Cases and Rates per 100,000
Cases Rate
Chlamydia 22424 2078.9
Gonorrhea 6545 606.8
P&S Syphilis 90 8.3
Rate (per 100,000 population)
<=2.2 2.21-10.0 >10.0
Data Source: National Electronic Telecommunications System for Surveillance, Centers for Disease Control and Prevention. November 2009 CDC/NCHS 2007 bridged population estimates, derived from US Census data, used for rate denominators.

Rates of Reportable STDs among Young People 15 - 24 Years of AgeWashington, 2008
Chlamydia Rates by County Gonorrhea Rates by County
Rate (per 100,000 population) Rate (per 100,000 population)
<=1000.0 1000.1-3000.0 <=300.0 300.1-600.0 >3000.0 >600.0
P&S Syphilis Rates by County Cases and Rates per 100,000
Cases Rate
Chlamydia 14453 1653.3
Gonorrhea 1594 182.3
P&S Syphilis 24 2.7
Rate (per 100,000 population)
<=2.2 2.21-10.0 >10.0
Data Source: National Electronic Telecommunications System for Surveillance, Centers for Disease Control and Prevention. November 2009 CDC/NCHS 2007 bridged population estimates, derived from US Census data, used for rate denominators.

Rates of Reportable STDs among Young People 15 - 24 Years of AgeWest Virginia, 2008
Chlamydia Rates by County Gonorrhea Rates by County
Rate (per 100,000 population)
<=1000.0 1000.1-3000.0 >3000.0
Rate (per 100,000 population)
<=300.0 300.1-600.0 >600.0
P&S Syphilis Rates by County Cases and Rates per 100,000
Cases Rate
Chlamydia 2578 1122.0
Gonorrhea 460 200.2
P&S Syphilis 4 1.7
Rate (per 100,000 population)
<=2.2 2.21-10.0 >10.0
Data Source: National Electronic Telecommunications System for Surveillance, Centers for Disease Control and Prevention. November 2009 CDC/NCHS 2007 bridged population estimates, derived from US Census data, used for rate denominators.

Rates of Reportable STDs among Young People 15 - 24 Years of AgeWisconsin, 2008
Chlamydia Rates by County Gonorrhea Rates by County
Rate (per 100,000 population) Rate (per 100,000 population)
<=1000.0 1000.1-3000.0 <=300.0 300.1-600.0 >3000.0 >600.0
P&S Syphilis Rates by County Cases and Rates per 100,000
Cases Rate
Chlamydia 15025 1896.7
Gonorrhea 4002 505.2
P&S Syphilis 13 1.6
Rate (per 100,000 population)
<=2.2 2.21-10.0 >10.0
Data Source: National Electronic Telecommunications System for Surveillance, Centers for Disease Control and Prevention. November 2009 CDC/NCHS 2007 bridged population estimates, derived from US Census data, used for rate denominators.

Rates of Reportable STDs among Young People 15 - 24 Years of AgeWyoming, 2008
Chlamydia Rates by County Gonorrhea Rates by County
Rate (per 100,000 population)
<=1000.0 1000.1-3000.0 >3000.0
Rate (per 100,000 population)
<=300.0 300.1-600.0 >600.0
P&S Syphilis Rates by County Cases and Rates per 100,000
Cases Rate
Chlamydia 1138 1506.7
Gonorrhea 82 108.6
P&S Syphilis 1 1.3
Rate (per 100,000 population)
<=2.2 2.21-10.0 >10.0
Data Source: National Electronic Telecommunications System for Surveillance, Centers for Disease Control and Prevention. November 2009 CDC/NCHS 2007 bridged population estimates, derived from US Census data, used for rate denominators.