Rate variation and estimation of divergence times using ...
12
METHODOLOGY ARTICLE Open Access Rate variation and estimation of divergence times using strict and relaxed clocks Richard P Brown 1* and Ziheng Yang 2 Abstract Background: Understanding causes of biological diversity may be greatly enhanced by knowledge of divergence times. Strict and relaxed clock models are used in Bayesian estimation of divergence times. We examined whether: i) strict clock models are generally more appropriate in shallow phylogenies where rate variation is expected to be low, ii) the likelihood ratio test of the clock (LRT) reliably informs which model is appropriate for dating divergence times. Strict and relaxed models were used to analyse sequences simulated under different levels of rate variation. Published shallow phylogenies (Black bass, Primate-sucking lice, Podarcis lizards, Gallotiinae lizards, and Caprinae mammals) were also analysed to determine natural levels of rate variation relative to the performance of the different models. Results: Strict clock analyses performed well on data simulated under the independent rates model when the standard deviation of log rate on branches, s, was low (≤0.1), but were inappropriate when s>0.1 (95% of rates fall within 0.0082-0.0121 subs/site/Ma when s = 0.1, for a mean rate of 0.01). The independent rates relaxed clock model performed well at all levels of rate variation, although posterior intervals on times were significantly wider than for the strict clock. The strict clock is therefore superior when rate variation is low. The performance of a correlated rates relaxed clock model was similar to the strict clock. Increased numbers of independent loci led to slightly narrower posteriors under the relaxed clock while older root ages provided proportionately narrower posteriors. The LRT had low power for s = 0.01-0.1, but high power for s = 0.5-2.0. Posterior means of s 2 were useful for assessing rate variation in published datasets. Estimates of natural levels of rate variation ranged from 0.05-3.38 for different partitions. Differences in divergence times between relaxed and strict clock analyses were greater in two datasets with higher s 2 for one or more partitions, supporting the simulation results. Conclusions: The strict clock can be superior for trees with shallow roots because of low levels of rate variation between branches. The LRT allows robust assessment of suitability of the clock model as does examination of posteriors on s 2 . Background Dating divergences between populations/taxa is of con- siderable value in phylogenetic/phylogeographic studies because of the importance of an absolute time-scale when assessing hypotheses of lineage diversification, e.g., [1-5]. Bayesian Markov Chain Monte Carlo (MCMC) methods have become widely used for this purpose [6-8]. The Bayesian approach is well-suited to dating because it naturally incorporates different sources of information and associated uncertainties through the priors. Most significantly, time calibrations are incorpo- rated through the prior on divergence times. This repre- sents a more robust solution to that offered by current maximum likelihood alternatives, which do not appear to correctly account for all sources of uncertainty and therefore underestimate confidence interval widths on divergence times [[9,10] pp248-251]. Bayesian MCMC dating incorporates models that allow the rate of molecular evolution to vary across the tree, through the prior on substitution rates. To date, rate variation is generally modelled using a relaxed or local clock approach in which the rate on a branch is either correlated with the rate on its ancestral branch or is independent of rates on other branches [11-13]. (Note * Correspondence: [email protected] 1 School of Natural Sciences & Psychology, Liverpool John Moores University, Liverpool L3 3AF, UK Full list of author information is available at the end of the article Brown and Yang BMC Evolutionary Biology 2011, 11:271 http://www.biomedcentral.com/1471-2148/11/271 © 2011 Brown and Yang; licensee BioMed Central Ltd. This is an Open Access article distributed under the terms of the Creative Commons Attribution License (http://creativecommons.org/licenses/by/2.0), which permits unrestricted use, distribution, and reproduction in any medium, provided the original work is properly cited.
Transcript of Rate variation and estimation of divergence times using ...

METHODOLOGY ARTICLE Open Access
Rate variation and estimation of divergence timesusing strict and relaxed clocksRichard P Brown1* and Ziheng Yang2
Abstract
Background: Understanding causes of biological diversity may be greatly enhanced by knowledge of divergencetimes. Strict and relaxed clock models are used in Bayesian estimation of divergence times. We examined whether:i) strict clock models are generally more appropriate in shallow phylogenies where rate variation is expected to below, ii) the likelihood ratio test of the clock (LRT) reliably informs which model is appropriate for dating divergencetimes. Strict and relaxed models were used to analyse sequences simulated under different levels of rate variation.Published shallow phylogenies (Black bass, Primate-sucking lice, Podarcis lizards, Gallotiinae lizards, and Caprinaemammals) were also analysed to determine natural levels of rate variation relative to the performance of thedifferent models.
Results: Strict clock analyses performed well on data simulated under the independent rates model when thestandard deviation of log rate on branches, s, was low (≤0.1), but were inappropriate when s>0.1 (95% of rates fallwithin 0.0082-0.0121 subs/site/Ma when s = 0.1, for a mean rate of 0.01). The independent rates relaxed clockmodel performed well at all levels of rate variation, although posterior intervals on times were significantly widerthan for the strict clock. The strict clock is therefore superior when rate variation is low. The performance of acorrelated rates relaxed clock model was similar to the strict clock. Increased numbers of independent loci led toslightly narrower posteriors under the relaxed clock while older root ages provided proportionately narrowerposteriors. The LRT had low power for s = 0.01-0.1, but high power for s = 0.5-2.0. Posterior means of s2 wereuseful for assessing rate variation in published datasets. Estimates of natural levels of rate variation ranged from0.05-3.38 for different partitions. Differences in divergence times between relaxed and strict clock analyses weregreater in two datasets with higher s2 for one or more partitions, supporting the simulation results.
Conclusions: The strict clock can be superior for trees with shallow roots because of low levels of rate variationbetween branches. The LRT allows robust assessment of suitability of the clock model as does examination ofposteriors on s2.
BackgroundDating divergences between populations/taxa is of con-siderable value in phylogenetic/phylogeographic studiesbecause of the importance of an absolute time-scalewhen assessing hypotheses of lineage diversification, e.g.,[1-5]. Bayesian Markov Chain Monte Carlo (MCMC)methods have become widely used for this purpose[6-8]. The Bayesian approach is well-suited to datingbecause it naturally incorporates different sources ofinformation and associated uncertainties through the
priors. Most significantly, time calibrations are incorpo-rated through the prior on divergence times. This repre-sents a more robust solution to that offered by currentmaximum likelihood alternatives, which do not appearto correctly account for all sources of uncertainty andtherefore underestimate confidence interval widths ondivergence times [[9,10] pp248-251].Bayesian MCMC dating incorporates models that
allow the rate of molecular evolution to vary across thetree, through the prior on substitution rates. To date,rate variation is generally modelled using a relaxed orlocal clock approach in which the rate on a branch iseither correlated with the rate on its ancestral branch oris independent of rates on other branches [11-13]. (Note
* Correspondence: [email protected] of Natural Sciences & Psychology, Liverpool John Moores University,Liverpool L3 3AF, UKFull list of author information is available at the end of the article
Brown and Yang BMC Evolutionary Biology 2011, 11:271http://www.biomedcentral.com/1471-2148/11/271
© 2011 Brown and Yang; licensee BioMed Central Ltd. This is an Open Access article distributed under the terms of the CreativeCommons Attribution License (http://creativecommons.org/licenses/by/2.0), which permits unrestricted use, distribution, andreproduction in any medium, provided the original work is properly cited.
that we use the term “relaxed clock” throughout thispaper to simultaneously refer to both independent andcorrelated rates models.) Under the independent ratesmodel, a rate is assigned to each branch from a singlelognormal distribution. The program MCMCTREE [14]assigns both the mean rate and the variance of the logtransformed rate, s2, from gamma distributions specifiedby the user. This model is also implemented in the pro-gram BEAST [15] although the standard deviation of lograte, rather than s2, is assigned from a user-defined dis-tribution. Under the correlated rates model, rates onbranches are dependent on branch durations and therate on the ancestral branch. The mean of the normaldistribution for log rate is obtained from the log of therate on the ancestral branch. The variance of this distri-bution is the product of the branch time duration and aparameter ν that is specified from a gamma distribution[12]. Hence, rates on shorter branches will show greatersimilarity with the rate on their ancestral branches thanrates on longer branches. Finally, strict clock modelsgenerally assign a single rate to the entire tree from alognormal distribution with a mean and variance speci-fied from a gamma or other distribution.A comparison of the models discussed here indicated
that the independent rates model performed well overallfor simulated data, possibly because it can accommodatehomogenous and correlated rates [7]. Nevertheless, thismodel contains more parameters and provides widerposterior intervals than the strict clock. Furthermore,the strict clock has been shown to perform well on datathat show quite clock-like evolution [7]. An investigationof the impact of increasing levels of rate variation on theperformance of the strict clock is therefore of consider-able practical use. The correlated rates model has alarge number of parameters but is also more restrictivethan the independent rates model. It may therefore be aless suitable option than the other two models, undermost conditions. Ho et al. [16] found that exponentialand lognormal independent rates models performed wellwhen rates were correlated or uncorrelated, but foundlittle support for the correlated rates model (see also[17]). In contrast, Lepage et al. [18] compared the fit ofseveral different models to three real datasets andargued for correlated rates particularly in large datasets(although their analyses did not use any calibrations andso did not fully reflect typical applications). Here, ourprimary aim was to compare independent rates withstrict clock models, but we also examine the perfor-mance of the correlated rates model. We achieve this byanalyzing divergence times of sequences using a strictphylogenetic approach, as opposed to divergence timesof species using a phylogenetic-coalescent approach[19]. Also, we use programs that were designed for dat-ing single topologies, rather than programs such as
BEAST [15], because integration over topological uncer-tainty can have undesirable effects on the specificationof priors on times [20]. Our approach attempts to sim-plify the analysis while still providing general findingsconcerning the suitability of the clock models and nat-ural levels of rate variation.This paper considers dating of shallow trees, which we
broadly define as phylogenies with a Miocene or morerecent root. There is good reason to believe that ratesshould be similar among recently diverged lineages.Rates may vary due to both stochastic effects and inher-ited or other lineage-correlated factors such as environ-ment. Among the inherited effects, body size [21-25],mass-specific metabolic rate [26], but see also [27] andgeneration time [28-30] have all been suggested as par-tial explanations of rate variation. The similarity of thesecharacteristics in closely related species leads to theexpectation of lower rate variation in these phylogenies,which may favour use of a strict clock.The decision to use a strict or relaxed clock needs to
be informed by a suitable test. Although new methodsare being developed [31], the likelihood ratio test (LRT)has traditionally been used for testing for clock-like evo-lution [32]. It compares a tree with no branch rate con-straints with the same tree in which rates on branchesare constrained to be equal. The LRT is powerful whenrates vary between, but not within, branches [33] asmodelled in the relaxed clock analysis. One disadvantageis that it may have low power when there are few taxaand sequences are short, leading to type II errors (incor-rect acceptance of the clock). In addition, it will notdetect rate variation if tips are all equidistant from theroot, which could occur for example if equivalent ratechanges occurred synchronously across all branches.There appears to be a paucity of detailed studies thatconsider the performance of the LRT. Hence, a second-ary aim of this work was to consider its performanceacross different levels of rate variation.This paper reports on the effects of rate variation on
the recovery of node ages using strict and relaxed clockapproaches as well as the ability of the LRT to detectthis rate variation.
ResultsSimulated data1) Rate heterogeneityThe relaxed and strict clock analyses recovered all inter-nal node ages on the tree in the majority of analyseswhen the sequences were evolved with s ≤ 0.1 (Figure1). Strict clock analyses performed poorly when s > 0.1.Note that we use the term ‘coverage probability’ todescribe the proportion of analyses that recover all nodeages on the tree (see Methods). Coverage probabilitiesfor relaxed clock analyses were high for all levels of s
Brown and Yang BMC Evolutionary Biology 2011, 11:271http://www.biomedcentral.com/1471-2148/11/271
Page 2 of 12

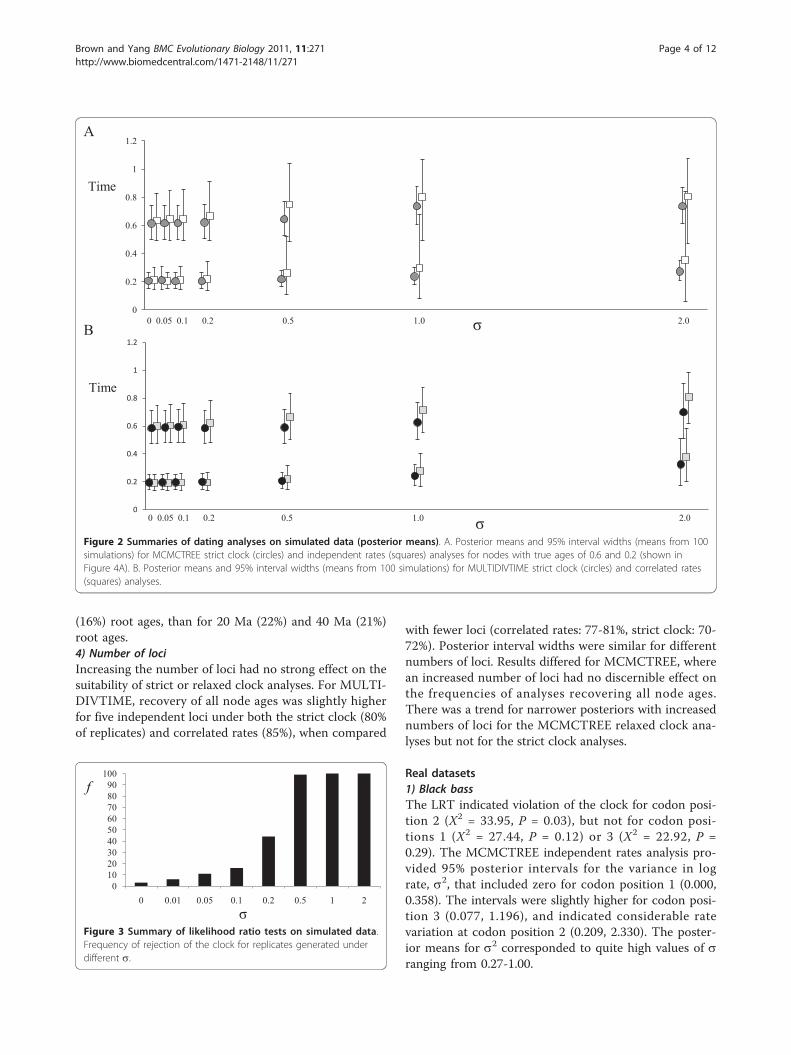
under the independent rates model (MCMCTREE), butwere significantly lower under the correlated ratesmodel (MULTIDIVTIME) when s>0.2. Posterior inter-vals on selected nodes were wider for relaxed clock ana-lyses, markedly so when s was high (Figure 2A, B). Thiseffect was more noticeable under the independent ratesthan the correlated rates model. In contrast, the inter-vals remained similarly narrow for all levels of rate var-iation when analysed using a strict clock inMCMCTREE (Figure 2A).MCMCTREE analyses of replicates simulated under s
= 2 that used the correlated rates instead of the inde-pendent rates model provided very similar results to thecorrelated rates MULTIDIVTIME analyses. Node ageswere recovered for all nodes on the tree in only 4% ofanalyses, compared with recovery by 5% of analyses inMULTIDIVTIME. This contrasts with a recovery of allnodes in 67% of analyses under the independent ratesmodel in MCMCTREE (Figure 1).The frequency of rejection of the clock by the LRT
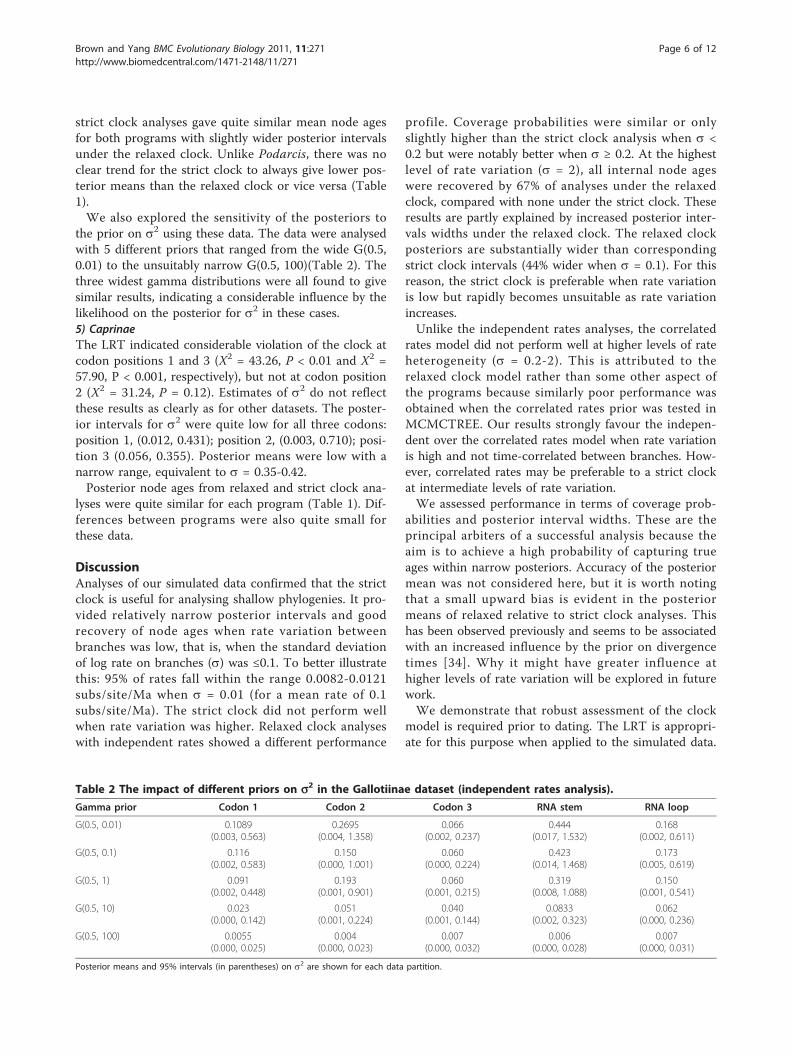
showed a sharp transition around s = 0.1-0.2, whichparalleled the performance of the strict clock analyses.The clock was rejected for less than 10% of the datasetsevolved with s < 0.2, but was almost always rejectedwhen s > 0.2 (Figure 3).2) Number of taxaThe independent rates analyses recovered all node agesin the 5 species tree for all replicates. Recovery of allnodes ages in the 10 species (97-100%) and the 20 spe-cies replicates (96-100%) was also high. The
corresponding recovery of node ages under the corre-lated rates model was generally lower (89-99% for 5 spe-cies and 93-100% for 10 and 20 species trees). Slightlylower recovery of node ages was obtained under thestrict clock, as would be expected given the previousresults. The LRT rejected the clock for 11% (5 taxa),16% (10 taxa) and 26% (20 taxa) of replicates.3) Age of rootThe performance of the strict clock implemented inMULTIDIVTIME was strongly dependent on root age,with lower recovery of all node ages for older roots(48% of replicates for 20 Ma root (Ma is an abbreviationof Mega-annum) and 29% of replicates for 40 Ma root).There was slightly poorer recovery of all node agesunder the correlated rates model at the oldest root age(69% of replicates) compared with trees with 5-20 Maroots (81-83% of replicates). The pattern was differentin MCMCTREE. Strict clock analyses seemed to per-form slightly better when the root age was older (5 Ma,all node ages recovered in 68% of replicates; 10 Ma,74%; 20 Ma, 85%; 40 Ma, 84%). The relaxed clock inde-pendent rates model performed more consistently overthe four root ages (93-97% replicates). However, cover-age probabilities were generally higher under relaxedcompared with strict clocks over all root ages, for bothprograms. Posterior intervals on nodes became nar-rower, as a proportion of node age, with increasing rootage under all relaxed clock analyses, but this trend wasclearer in MCMCTREE. The LRT rejected the clock onslightly fewer occasions for 5 Ma (19%) and 10 Ma
0
10
20
30
40
50
60
70
80
90
100
0 0.01 0.05 0.1 0.2 0.5 1 2σ
f
MCMCTREE strict clock
MCMCTREE relaxed clockMULTIDIVTIME strict clockMULTIDIVTIME relaxed clock
Figure 1 Summaries of dating analyses on simulated data (frequencies). Frequencies of recovery of all node ages by strict and relaxedclock analyses in MCMCTREE and MULTIDIVTIME, for different standard deviations of the log rate (s).
Brown and Yang BMC Evolutionary Biology 2011, 11:271http://www.biomedcentral.com/1471-2148/11/271
Page 3 of 12
(16%) root ages, than for 20 Ma (22%) and 40 Ma (21%)root ages.4) Number of lociIncreasing the number of loci had no strong effect on thesuitability of strict or relaxed clock analyses. For MULTI-DIVTIME, recovery of all node ages was slightly higherfor five independent loci under both the strict clock (80%of replicates) and correlated rates (85%), when compared
with fewer loci (correlated rates: 77-81%, strict clock: 70-72%). Posterior interval widths were similar for differentnumbers of loci. Results differed for MCMCTREE, wherean increased number of loci had no discernible effect onthe frequencies of analyses recovering all node ages.There was a trend for narrower posteriors with increasednumbers of loci for the MCMCTREE relaxed clock ana-lyses but not for the strict clock analyses.
Real datasets1) Black bassThe LRT indicated violation of the clock for codon posi-tion 2 (X2 = 33.95, P = 0.03), but not for codon posi-tions 1 (X2 = 27.44, P = 0.12) or 3 (X2 = 22.92, P =0.29). The MCMCTREE independent rates analysis pro-vided 95% posterior intervals for the variance in lograte, s2, that included zero for codon position 1 (0.000,0.358). The intervals were slightly higher for codon posi-tion 3 (0.077, 1.196), and indicated considerable ratevariation at codon position 2 (0.209, 2.330). The poster-ior means for s2 corresponded to quite high values of sranging from 0.27-1.00.
0102030405060708090
100
0 0.01 0.05 0.1 0.2 0.5 1 2σ
f
Figure 3 Summary of likelihood ratio tests on simulated data.Frequency of rejection of the clock for replicates generated underdifferent s.
0
0.2
0.4
0.6
0.8
1
1.2
Time
0 0.05 0.1 0.2 0.5 1.0 2.0 σ
0
0.2
0.4
0.6
0.8
1
1.2
σ
Time
0 0.05 0.1 0.2 0.5 1.0 2.0
A
B
Figure 2 Summaries of dating analyses on simulated data (posterior means). A. Posterior means and 95% interval widths (means from 100simulations) for MCMCTREE strict clock (circles) and independent rates (squares) analyses for nodes with true ages of 0.6 and 0.2 (shown inFigure 4A). B. Posterior means and 95% interval widths (means from 100 simulations) for MULTIDIVTIME strict clock (circles) and correlated rates(squares) analyses.
Brown and Yang BMC Evolutionary Biology 2011, 11:271http://www.biomedcentral.com/1471-2148/11/271
Page 4 of 12

Posterior node ages differed considerably between thestrict and relaxed clock analyses with 95% intervalsbeing wider and means lower under the relaxed clockfor both programs (Table 1). MULTIDIVTIME posteriormeans were lower under the strict clock and higherunder the correlated rates model, relative to the strictand independent rates models in MCMCTREE.2) Primate-sucking liceThe LRT did not indicate violation of the clock formtDNA codon positions 1-3: X2 = 4.29; P = 0.75; X2 =3.57, P = 0.83; X2 = 7.16, P = 0.41, respectively, or fornuclear codon positions 1 or 2 (X2 = 4.59, P = 0.71; X2
= 1.34, P = 0.99, respectively). However, the clock wasrejected for nuclear codon position 3 (X2 = 26.25, P <0.001) and the 18S rRNA gene (X2 = 21.74, P < 0.003).The lower posterior limit on s2 (MCMCTREE indepen-dent rates analysis) approximated to zero for mitochon-drial codon positions 1-3: (0.003, 0.840), (0.003, 0.794),(0.000, 1.987), and for nuclear codon positions 1 and 2:(0.003, 1.814), (0.000, 1.975). Evidence of higher ratevariation was detected for nuclear codon position 3(0.748, 4.247) and 18S rRNA (1.514, 6.182), closelyreflecting the LRT results. The posterior means corre-sponded to a range of s from 0.39-1.84.For MCMCTREE, the ages of the two selected nodes
differed between strict and independent rates analyses inthe same way that they differed for the Black bass data,i.e., higher posterior means and wider posterior intervalsfor independent rates (Table 1). Posterior node ageswere lower for both models in MULTIDIVTIME, rela-tive to MCMCTREE.3) Podarcisthe LRT did not support violation of the clock for anyof the partitions (cytochrome b, codon 1, X2 = 11.40, P
= 0.91; cytochrome b, codon 3, X2 = 20.04, P = 0.39;ND1 and ND2 codon 1, X2 = 14.43, P = 0.76; ND1 andND2 codon 3, X2 = 14.00, P = 0.78; 12S rRNA, X2 =2.92, P = 0.99; control region X2 = 8.40, P = 0.98). The95% posterior intervals on s2 also indicated low ratevariation with lower posterior limits tending to zero inall cases: cytochrome b, codon 1, (0.001, 0.989); cyto-chrome b, codon 3, (0.001, 0.653); ND1 and ND2 codon1, (0.005, 1.546); ND1 and ND2 codon 3, (0.002, 0.848);12S rRNA, (0.002, 1.322); control region (0.002, 1.205),respectively. Posterior means were equivalent to a rela-tively narrow range of s from 0.40-0.60.Relaxed clock analyses again provided slightly wider
posterior intervals on node ages than the strict clock(Table 1). Posterior means were lower under the strictclock compared with the relaxed clock but differencesbetween these clock models were smaller than found inthe Black bass and lice data. Again, posterior meannode ages were lower in MULTIDIVTIME than inMCMCTREE.4) The GallotiinaeSimilar to Podarcis, the LRT did not indicate violation ofthe clock for any of the mtDNA partitions (codon posi-tion 1, X2 = 21.65, P = 0.42; codon position 2, X2 = 12.69,P = 0.92; codon position 3, X2 = 21.47, P = 0.43, rRNAloops X2 = 20.96, P = 0.46, rRNA stems X2 = 17.04, P =0.71) which was consistent with the lower limits of theposteriors on s2: codon position 1, (0.002, 0.448); codonposition 2, (0.001, 0.901); codon position 3, (0.000,0.215); rRNA loops (0.008, 1.088); rRNA stems (0.001,0.541). Posterior means on s2 were quite low and equiva-lent to a relatively narrow range of s from 0.25-0.57.The posterior means showed generally the same pat-
terns as those detected for Podarcis, i.e., relaxed and
Table 1 MCMCTREE and MULTIDIVTIME strict and relaxed clock analyses of real datasets.
MCMCTREE MULTIDIVTIME
Strict Clock Relaxed Clock Strict Clock Relaxed Clock
1) Black Bass
Node 1 6.74 (5.67, 7.88) 7.85 (5.57, 10.71) 5.84 (4.85, 7.00) 9.33(6.54,12.84)
Node 2 2.62 (2.06, 3.25) 3.65 (2.14, 5.41) 2.06 (1.53, 2.64) 4.88 (2.67, 7.50)
2) Primate-sucking Lice
Node 1 1.96 (1.53,2.42) 2.65 (1.65, 4.04) 1.58 (1.12, 2.15) 1.45 (0.79, 2.45)
Node 2 0.71 (0.53,0.92) 0.85 (0.48,1.35) 0.34 (0.21, 0.50) 0.61 (0.27, 1.20)
3) Podarcis
Node 1 2.95 (2.32, 3.66) 3.20 (2.27, 4.49) 2.15 (1.25, 3.43) 2.31 (1.31, 3.94)
Node 2 1.14 (0.81, 1.52) 1.20 (0.79, 1.75) 0.65 (0.16, 1.32) 0.73 (0.06, 1.59)
4) Gallotiinae
Node 1 5.87 (4.64, 7.16) 6.11 (4.67, 7.72) 5.84 (4.30, 7.48) 6.07(4.16, 8.11)
Node 2 1.71 (1.20, 2.30) 1.78 (1.15, 2.51) 1.58 (0.89, 2.33) 1.34 (0.61, 2.33)
5) Caprinae
Node 1 6.01 (5.49, 6.78) 6.14 (5.41, 7.71) 5.69 (5.30, 6.91) 5.78 (5.31, 6.96)
Node 2 4.00 (3.21, 4.92) 4.48 (3.38, 5.87) 3.87 (2.82, 5.17) 4.47 (3.22, 5.95)
Posterior means and 95% intervals are given for nodes shown in Figs. 5A-E.
Brown and Yang BMC Evolutionary Biology 2011, 11:271http://www.biomedcentral.com/1471-2148/11/271
Page 5 of 12
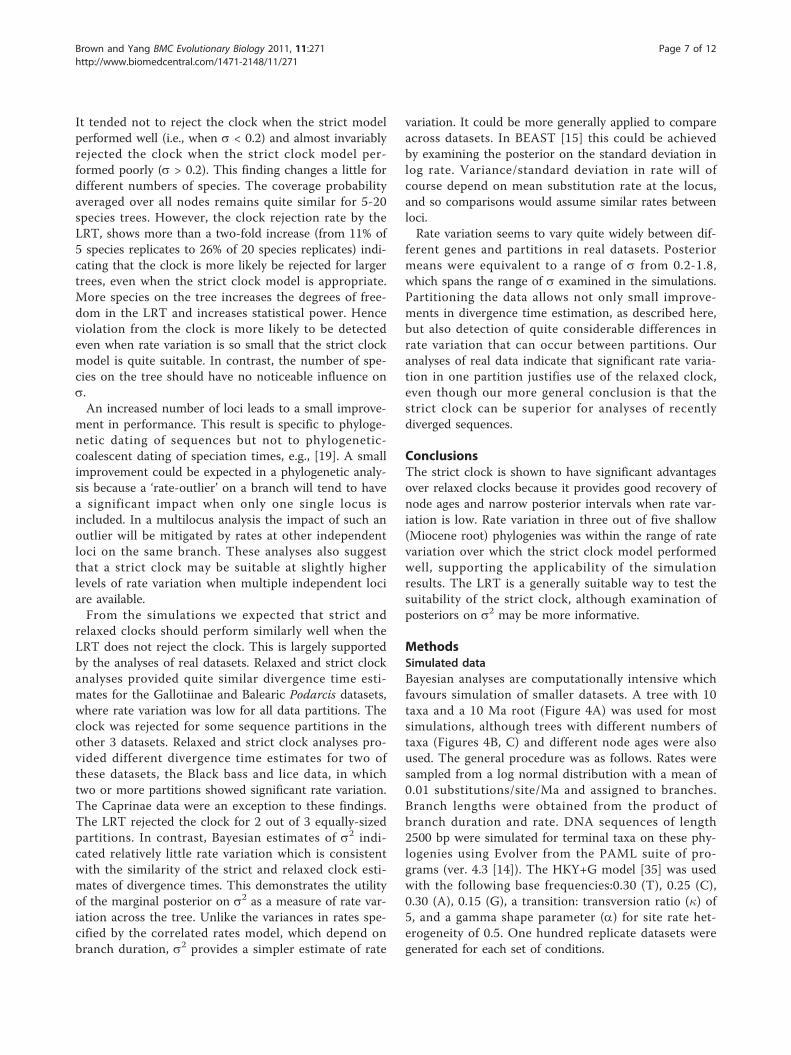
strict clock analyses gave quite similar mean node agesfor both programs with slightly wider posterior intervalsunder the relaxed clock. Unlike Podarcis, there was noclear trend for the strict clock to always give lower pos-terior means than the relaxed clock or vice versa (Table1).We also explored the sensitivity of the posteriors to
the prior on s2 using these data. The data were analysedwith 5 different priors that ranged from the wide G(0.5,0.01) to the unsuitably narrow G(0.5, 100)(Table 2). Thethree widest gamma distributions were all found to givesimilar results, indicating a considerable influence by thelikelihood on the posterior for s2 in these cases.5) CaprinaeThe LRT indicated considerable violation of the clock atcodon positions 1 and 3 (X2 = 43.26, P < 0.01 and X2 =57.90, P < 0.001, respectively), but not at codon position2 (X2 = 31.24, P = 0.12). Estimates of s2 do not reflectthese results as clearly as for other datasets. The poster-ior intervals for s2 were quite low for all three codons:position 1, (0.012, 0.431); position 2, (0.003, 0.710); posi-tion 3 (0.056, 0.355). Posterior means were low with anarrow range, equivalent to s = 0.35-0.42.Posterior node ages from relaxed and strict clock ana-
lyses were quite similar for each program (Table 1). Dif-ferences between programs were also quite small forthese data.
DiscussionAnalyses of our simulated data confirmed that the strictclock is useful for analysing shallow phylogenies. It pro-vided relatively narrow posterior intervals and goodrecovery of node ages when rate variation betweenbranches was low, that is, when the standard deviationof log rate on branches (s) was ≤0.1. To better illustratethis: 95% of rates fall within the range 0.0082-0.0121subs/site/Ma when s = 0.01 (for a mean rate of 0.1subs/site/Ma). The strict clock did not perform wellwhen rate variation was higher. Relaxed clock analyseswith independent rates showed a different performance
profile. Coverage probabilities were similar or onlyslightly higher than the strict clock analysis when s <0.2 but were notably better when s ≥ 0.2. At the highestlevel of rate variation (s = 2), all internal node ageswere recovered by 67% of analyses under the relaxedclock, compared with none under the strict clock. Theseresults are partly explained by increased posterior inter-vals widths under the relaxed clock. The relaxed clockposteriors are substantially wider than correspondingstrict clock intervals (44% wider when s = 0.1). For thisreason, the strict clock is preferable when rate variationis low but rapidly becomes unsuitable as rate variationincreases.Unlike the independent rates analyses, the correlated
rates model did not perform well at higher levels of rateheterogeneity (s = 0.2-2). This is attributed to therelaxed clock model rather than some other aspect ofthe programs because similarly poor performance wasobtained when the correlated rates prior was tested inMCMCTREE. Our results strongly favour the indepen-dent over the correlated rates model when rate variationis high and not time-correlated between branches. How-ever, correlated rates may be preferable to a strict clockat intermediate levels of rate variation.We assessed performance in terms of coverage prob-
abilities and posterior interval widths. These are theprincipal arbiters of a successful analysis because theaim is to achieve a high probability of capturing trueages within narrow posteriors. Accuracy of the posteriormean was not considered here, but it is worth notingthat a small upward bias is evident in the posteriormeans of relaxed relative to strict clock analyses. Thishas been observed previously and seems to be associatedwith an increased influence by the prior on divergencetimes [34]. Why it might have greater influence athigher levels of rate variation will be explored in futurework.We demonstrate that robust assessment of the clock
model is required prior to dating. The LRT is appropri-ate for this purpose when applied to the simulated data.
Table 2 The impact of different priors on s2 in the Gallotiinae dataset (independent rates analysis).
Gamma prior Codon 1 Codon 2 Codon 3 RNA stem RNA loop
G(0.5, 0.01) 0.1089(0.003, 0.563)
0.2695(0.004, 1.358)
0.066(0.002, 0.237)
0.444(0.017, 1.532)
0.168(0.002, 0.611)
G(0.5, 0.1) 0.116(0.002, 0.583)
0.150(0.000, 1.001)
0.060(0.000, 0.224)
0.423(0.014, 1.468)
0.173(0.005, 0.619)
G(0.5, 1) 0.091(0.002, 0.448)
0.193(0.001, 0.901)
0.060(0.001, 0.215)
0.319(0.008, 1.088)
0.150(0.001, 0.541)
G(0.5, 10) 0.023(0.000, 0.142)
0.051(0.001, 0.224)
0.040(0.001, 0.144)
0.0833(0.002, 0.323)
0.062(0.000, 0.236)
G(0.5, 100) 0.0055(0.000, 0.025)
0.004(0.000, 0.023)
0.007(0.000, 0.032)
0.006(0.000, 0.028)
0.007(0.000, 0.031)
Posterior means and 95% intervals (in parentheses) on s2 are shown for each data partition.
Brown and Yang BMC Evolutionary Biology 2011, 11:271http://www.biomedcentral.com/1471-2148/11/271
Page 6 of 12
It tended not to reject the clock when the strict modelperformed well (i.e., when s < 0.2) and almost invariablyrejected the clock when the strict clock model per-formed poorly (s > 0.2). This finding changes a little fordifferent numbers of species. The coverage probabilityaveraged over all nodes remains quite similar for 5-20species trees. However, the clock rejection rate by theLRT, shows more than a two-fold increase (from 11% of5 species replicates to 26% of 20 species replicates) indi-cating that the clock is more likely be rejected for largertrees, even when the strict clock model is appropriate.More species on the tree increases the degrees of free-dom in the LRT and increases statistical power. Henceviolation from the clock is more likely to be detectedeven when rate variation is so small that the strict clockmodel is quite suitable. In contrast, the number of spe-cies on the tree should have no noticeable influence ons.An increased number of loci leads to a small improve-
ment in performance. This result is specific to phyloge-netic dating of sequences but not to phylogenetic-coalescent dating of speciation times, e.g., [19]. A smallimprovement could be expected in a phylogenetic analy-sis because a ‘rate-outlier’ on a branch will tend to havea significant impact when only one single locus isincluded. In a multilocus analysis the impact of such anoutlier will be mitigated by rates at other independentloci on the same branch. These analyses also suggestthat a strict clock may be suitable at slightly higherlevels of rate variation when multiple independent lociare available.From the simulations we expected that strict and
relaxed clocks should perform similarly well when theLRT does not reject the clock. This is largely supportedby the analyses of real datasets. Relaxed and strict clockanalyses provided quite similar divergence time esti-mates for the Gallotiinae and Balearic Podarcis datasets,where rate variation was low for all data partitions. Theclock was rejected for some sequence partitions in theother 3 datasets. Relaxed and strict clock analyses pro-vided different divergence time estimates for two ofthese datasets, the Black bass and lice data, in whichtwo or more partitions showed significant rate variation.The Caprinae data were an exception to these findings.The LRT rejected the clock for 2 out of 3 equally-sizedpartitions. In contrast, Bayesian estimates of s2 indi-cated relatively little rate variation which is consistentwith the similarity of the strict and relaxed clock esti-mates of divergence times. This demonstrates the utilityof the marginal posterior on s2 as a measure of rate var-iation across the tree. Unlike the variances in rates spe-cified by the correlated rates model, which depend onbranch duration, s2 provides a simpler estimate of rate
variation. It could be more generally applied to compareacross datasets. In BEAST [15] this could be achievedby examining the posterior on the standard deviation inlog rate. Variance/standard deviation in rate will ofcourse depend on mean substitution rate at the locus,and so comparisons would assume similar rates betweenloci.Rate variation seems to vary quite widely between dif-
ferent genes and partitions in real datasets. Posteriormeans were equivalent to a range of s from 0.2-1.8,which spans the range of s examined in the simulations.Partitioning the data allows not only small improve-ments in divergence time estimation, as described here,but also detection of quite considerable differences inrate variation that can occur between partitions. Ouranalyses of real data indicate that significant rate varia-tion in one partition justifies use of the relaxed clock,even though our more general conclusion is that thestrict clock can be superior for analyses of recentlydiverged sequences.
ConclusionsThe strict clock is shown to have significant advantagesover relaxed clocks because it provides good recovery ofnode ages and narrow posterior intervals when rate var-iation is low. Rate variation in three out of five shallow(Miocene root) phylogenies was within the range of ratevariation over which the strict clock model performedwell, supporting the applicability of the simulationresults. The LRT is a generally suitable way to test thesuitability of the strict clock, although examination ofposteriors on s2 may be more informative.
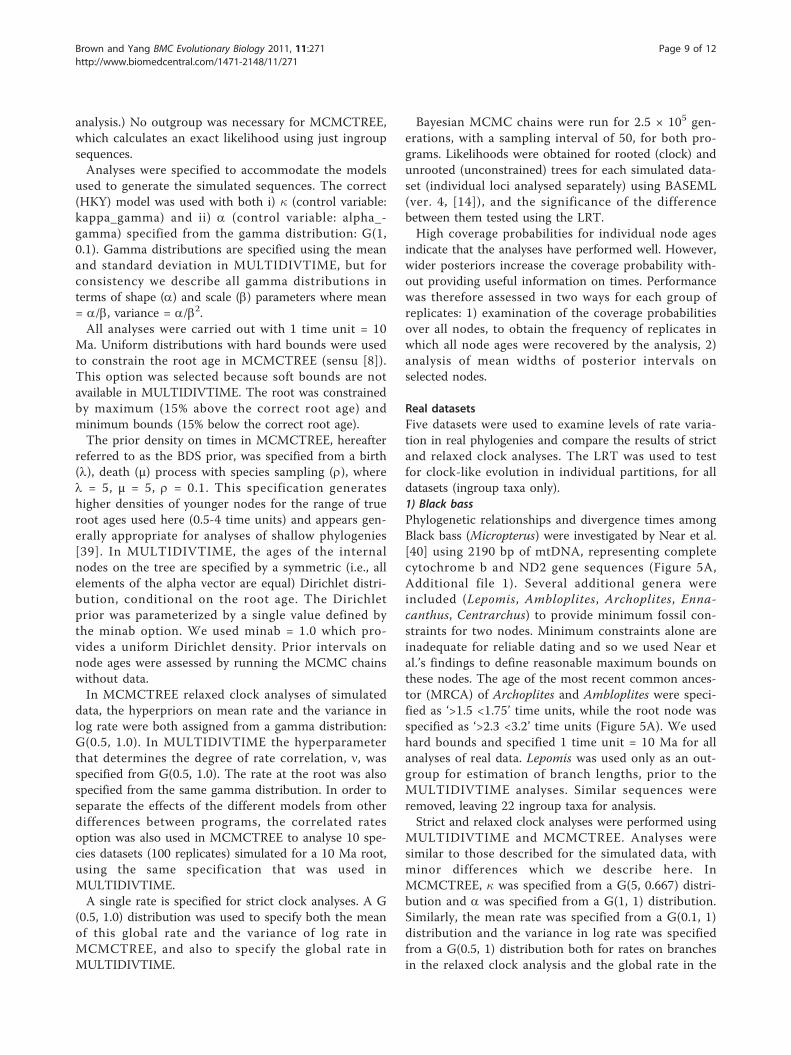
MethodsSimulated dataBayesian analyses are computationally intensive whichfavours simulation of smaller datasets. A tree with 10taxa and a 10 Ma root (Figure 4A) was used for mostsimulations, although trees with different numbers oftaxa (Figures 4B, C) and different node ages were alsoused. The general procedure was as follows. Rates weresampled from a log normal distribution with a mean of0.01 substitutions/site/Ma and assigned to branches.Branch lengths were obtained from the product ofbranch duration and rate. DNA sequences of length2500 bp were simulated for terminal taxa on these phy-logenies using Evolver from the PAML suite of pro-grams (ver. 4.3 [14]). The HKY+G model [35] was usedwith the following base frequencies:0.30 (T), 0.25 (C),0.30 (A), 0.15 (G), a transition: transversion ratio (�) of5, and a gamma shape parameter (a) for site rate het-erogeneity of 0.5. One hundred replicate datasets weregenerated for each set of conditions.
Brown and Yang BMC Evolutionary Biology 2011, 11:271http://www.biomedcentral.com/1471-2148/11/271
Page 7 of 12

1) Rate heterogeneityDifferent levels of rate variation were simulated usingthe standard deviation of the normal distribution (s)from which the natural logarithm of the rate wassampled. Replicate datasets were obtained for each ofthe following values of s: 0 (strict clock), 0.05, 0.1,0.2, 0.5, 1.0, 2.0. For illustration, the central 95% ofrates will be between (0.0091-0.0110), (0.0066-0.0145)and (0.0000-0.0682) for s = 0.05, 0.2 and 2.0,respectively.2) Number of taxaReplicates were simulated for phylogenies containing 5,10 and 20 species with s = 0.1 (Figures 4B,C).3) Age of rootReplicates were simulated for the 10 species topologywith the following root ages: 5 Ma, 10 Ma, 20 Ma, 40Ma (s = 0.1 in each case). The ages of other nodes onthese trees were proportional to their ages on the treewith the 10 Ma root.4) Multiple lociThe 2500 bp of sequence was assigned to different num-bers of partitions, each with a different rate but with s =
0.1. The multiple loci tested were: two (1250 bp each,with mean rates 0.005 and 0.015), three (833 bp, rate =0.005; 834 bp, rate = 0.010; 833 bp, rate = 0.015) andfive (500 bp each, with mean rates 0.0050, 0.0075,0.0100, 0.0125, and 0.0150) loci.
Analyses of simulated dataBayesian estimates of divergence times were obtainedfor each replicate using the programs MCMCTREE [14]and MULTIDIVTIME [36]. These programs wereselected because their statistical features have beendescribed and investigated quite extensively[6,8,12,33,36-39]. Details of the analyses are describedbelow.A multivariate normal approximation of maximum
likelihood (ML) estimates of branch lengths is used byMULTIDIVTIME. Calculation of these branch lengthsrequired assignment of an arbitrary outgroup to thesimulated datasets. This was simulated in the same wayas the other taxa, but with a divergence time that was10% older than the root on each tree. (The outgroupwas removed for the subsequent Bayesian dating
A
10 05Time units (before present)
B
10 05Time units (before present)
C
10 05Time units (before present)
Figure 4 Trees used in simulations. The 10 species (A), 5 species (B), and 20 species (C) trees used in the simulations. Posteriors on nodesmarked with filled circles are summarized in Figire 2.
Brown and Yang BMC Evolutionary Biology 2011, 11:271http://www.biomedcentral.com/1471-2148/11/271
Page 8 of 12
analysis.) No outgroup was necessary for MCMCTREE,which calculates an exact likelihood using just ingroupsequences.Analyses were specified to accommodate the models
used to generate the simulated sequences. The correct(HKY) model was used with both i) � (control variable:kappa_gamma) and ii) a (control variable: alpha_-gamma) specified from the gamma distribution: G(1,0.1). Gamma distributions are specified using the meanand standard deviation in MULTIDIVTIME, but forconsistency we describe all gamma distributions interms of shape (a) and scale (b) parameters where mean= a/b, variance = a/b2.All analyses were carried out with 1 time unit = 10
Ma. Uniform distributions with hard bounds were usedto constrain the root age in MCMCTREE (sensu [8]).This option was selected because soft bounds are notavailable in MULTIDIVTIME. The root was constrainedby maximum (15% above the correct root age) andminimum bounds (15% below the correct root age).The prior density on times in MCMCTREE, hereafter
referred to as the BDS prior, was specified from a birth(l), death (μ) process with species sampling (r), wherel = 5, μ = 5, r = 0.1. This specification generateshigher densities of younger nodes for the range of trueroot ages used here (0.5-4 time units) and appears gen-erally appropriate for analyses of shallow phylogenies[39]. In MULTIDIVTIME, the ages of the internalnodes on the tree are specified by a symmetric (i.e., allelements of the alpha vector are equal) Dirichlet distri-bution, conditional on the root age. The Dirichletprior was parameterized by a single value defined bythe minab option. We used minab = 1.0 which pro-vides a uniform Dirichlet density. Prior intervals onnode ages were assessed by running the MCMC chainswithout data.In MCMCTREE relaxed clock analyses of simulated
data, the hyperpriors on mean rate and the variance inlog rate were both assigned from a gamma distribution:G(0.5, 1.0). In MULTIDIVTIME the hyperparameterthat determines the degree of rate correlation, ν, wasspecified from G(0.5, 1.0). The rate at the root was alsospecified from the same gamma distribution. In order toseparate the effects of the different models from otherdifferences between programs, the correlated ratesoption was also used in MCMCTREE to analyse 10 spe-cies datasets (100 replicates) simulated for a 10 Ma root,using the same specification that was used inMULTIDIVTIME.A single rate is specified for strict clock analyses. A G
(0.5, 1.0) distribution was used to specify both the meanof this global rate and the variance of log rate inMCMCTREE, and also to specify the global rate inMULTIDIVTIME.
Bayesian MCMC chains were run for 2.5 × 10⁵ gen-erations, with a sampling interval of 50, for both pro-grams. Likelihoods were obtained for rooted (clock) andunrooted (unconstrained) trees for each simulated data-set (individual loci analysed separately) using BASEML(ver. 4, [14]), and the significance of the differencebetween them tested using the LRT.High coverage probabilities for individual node ages
indicate that the analyses have performed well. However,wider posteriors increase the coverage probability with-out providing useful information on times. Performancewas therefore assessed in two ways for each group ofreplicates: 1) examination of the coverage probabilitiesover all nodes, to obtain the frequency of replicates inwhich all node ages were recovered by the analysis, 2)analysis of mean widths of posterior intervals onselected nodes.
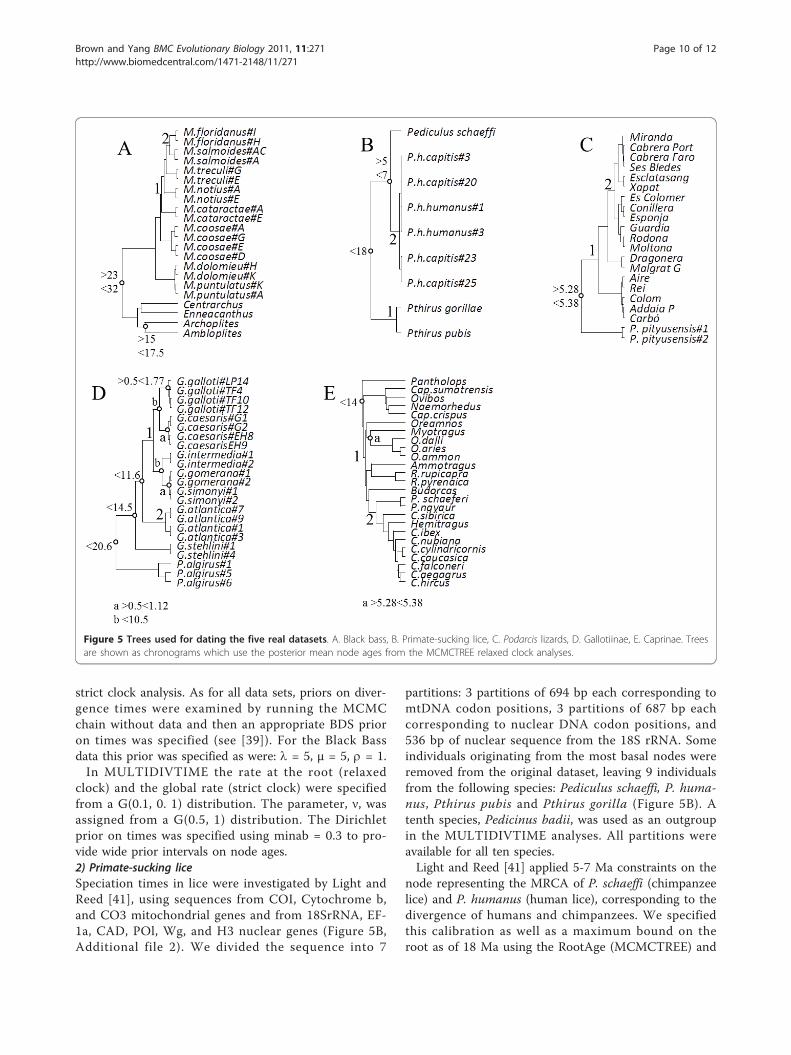
Real datasetsFive datasets were used to examine levels of rate varia-tion in real phylogenies and compare the results of strictand relaxed clock analyses. The LRT was used to testfor clock-like evolution in individual partitions, for alldatasets (ingroup taxa only).1) Black bassPhylogenetic relationships and divergence times amongBlack bass (Micropterus) were investigated by Near et al.[40] using 2190 bp of mtDNA, representing completecytochrome b and ND2 gene sequences (Figure 5A,Additional file 1). Several additional genera wereincluded (Lepomis, Ambloplites, Archoplites, Enna-canthus, Centrarchus) to provide minimum fossil con-straints for two nodes. Minimum constraints alone areinadequate for reliable dating and so we used Near etal.’s findings to define reasonable maximum bounds onthese nodes. The age of the most recent common ances-tor (MRCA) of Archoplites and Ambloplites were speci-fied as ‘>1.5 <1.75’ time units, while the root node wasspecified as ‘>2.3 <3.2’ time units (Figure 5A). We usedhard bounds and specified 1 time unit = 10 Ma for allanalyses of real data. Lepomis was used only as an out-group for estimation of branch lengths, prior to theMULTIDIVTIME analyses. Similar sequences wereremoved, leaving 22 ingroup taxa for analysis.Strict and relaxed clock analyses were performed using
MULTIDIVTIME and MCMCTREE. Analyses weresimilar to those described for the simulated data, withminor differences which we describe here. InMCMCTREE, � was specified from a G(5, 0.667) distri-bution and a was specified from a G(1, 1) distribution.Similarly, the mean rate was specified from a G(0.1, 1)distribution and the variance in log rate was specifiedfrom a G(0.5, 1) distribution both for rates on branchesin the relaxed clock analysis and the global rate in the
Brown and Yang BMC Evolutionary Biology 2011, 11:271http://www.biomedcentral.com/1471-2148/11/271
Page 9 of 12
strict clock analysis. As for all data sets, priors on diver-gence times were examined by running the MCMCchain without data and then an appropriate BDS prioron times was specified (see [39]). For the Black Bassdata this prior was specified as were: l = 5, μ = 5, r = 1.In MULTIDIVTIME the rate at the root (relaxed
clock) and the global rate (strict clock) were specifiedfrom a G(0.1, 0. 1) distribution. The parameter, ν, wasassigned from a G(0.5, 1) distribution. The Dirichletprior on times was specified using minab = 0.3 to pro-vide wide prior intervals on node ages.2) Primate-sucking liceSpeciation times in lice were investigated by Light andReed [41], using sequences from COI, Cytochrome b,and CO3 mitochondrial genes and from 18SrRNA, EF-1a, CAD, POl, Wg, and H3 nuclear genes (Figure 5B,Additional file 2). We divided the sequence into 7
partitions: 3 partitions of 694 bp each corresponding tomtDNA codon positions, 3 partitions of 687 bp eachcorresponding to nuclear DNA codon positions, and536 bp of nuclear sequence from the 18S rRNA. Someindividuals originating from the most basal nodes wereremoved from the original dataset, leaving 9 individualsfrom the following species: Pediculus schaeffi, P. huma-nus, Pthirus pubis and Pthirus gorilla (Figure 5B). Atenth species, Pedicinus badii, was used as an outgroupin the MULTIDIVTIME analyses. All partitions wereavailable for all ten species.Light and Reed [41] applied 5-7 Ma constraints on the
node representing the MRCA of P. schaeffi (chimpanzeelice) and P. humanus (human lice), corresponding to thedivergence of humans and chimpanzees. We specifiedthis calibration as well as a maximum bound on theroot as of 18 Ma using the RootAge (MCMCTREE) and
Figure 5 Trees used for dating the five real datasets. A. Black bass, B. Primate-sucking lice, C. Podarcis lizards, D. Gallotiinae, E. Caprinae. Treesare shown as chronograms which use the posterior mean node ages from the MCMCTREE relaxed clock analyses.
Brown and Yang BMC Evolutionary Biology 2011, 11:271http://www.biomedcentral.com/1471-2148/11/271
Page 10 of 12

Bigtime (MULTIDIVTIME) control variables. The maxi-mum bound on the root was specified using the poster-ior distribution published in the original study.In MCMCTREE we specified the BDS prior on times
as: l = 5, μ = 5, r = 3. In MULTIDIVTIME the priorroot age was specified from a G(4, 2.667) distribution.Other control variables were the same as thosedescribed for the Black bass analyses.3) Podarcis lizardsBrown et al. [34] analysed mtDNA from 21 P. pityusen-sis and P. lilfordi from different islands within the Balea-rics (Mediterranean sea) together with a P. siculaoutgroup (used here to estimate branch lengths forMULTIDIVTIME only)(Figure 5C, Additional file 3).The sequence (control region, cytochrome b, ND1,ND2, 12S rRNA, 3 tRNAs) was divided into six parti-tions: cytochrome b codon position 1 (271 bp) andcodon position 3 (270 bp), ND1/ND2 codon position 1(149 bp) and codon position 3 (149 bp), control region(481 bp), 12S loops (213 bp). Other parts of thesequence (e.g., codon position 2) were removed becausethey contained negligible phylogenetic information.The root node in the tree represents the MRCA of the
two recognized species of Balearic Podarcis. Speciationcoincided with the rapid refilling of the Mediterraneanbasin 5.33 Ma. Hence, Brown et al. [34] placed narrow5.32-5.33 Ma constraints on the root node. We allowedslightly greater uncertainty here by specifying ‘>0.528<0.538’ (time units) as minimum and maximum con-straints on the root. Other control variables were thesame as for the Black Bass analyses, although analyses ofpriors on times indicated that a l = 5, μ = 5, r = 3 BDSprior was more suitable in MCMCTREE.4) Gallotiinae lizardsCox et al [42] analysed 1786 bp mtDNA from 20 Gallo-tia lizards endemic to the Canary archipelago, and threeindividuals from the North African sister taxon, Psam-modromus. The sequence comprised 715 bp from thecytochrome b, 261 bp from cytochrome oxidase I, 414bp from the 16s rRNA and 396 bp from the 12S rRNAgenes (Figure 5D, Additional file 4). The lizard Timonlepidus was used as an outgroup in MULTIDIVTIME.Data were partitioned by codon position (cytochrome band cytochrome oxidase I) and by stem and loop sec-ondary structures (12S and 16S rRNA).Maximum constraints on eight node ages were deter-
mined from island ages. These ranged from <2.06 timeunits on the root, to <0.112 time units on nodes thatrepresent colonization of the youngest Canary Island, ElHierro. Arbitrary minimum constraints of >0.05 timeunits were also placed on the two (La Gomera, ElHierro) and the (Tenerife, La Palma) nodes, as in [42](Figure 5D). In MULTIDIVTIME, the prior on age ofthe root was specified from a G(16, 8) distribution.
5) CaprinaeLalueza-Fox et al. [43] examined mtDNA evolution withinthe Caprinae. Brown and Yang [39] used an updated ver-sion of this dataset to obtain Bayesian estimates of diver-gence times in 25 Caprinae (Figure 5E, Additional file 5).We re-examined the dataset used in [39]. The data consistof 1128 bp of the cytochrome b gene, after removal ofmissing data, and were partitioned by codon position (Fig-ure 5E). Twenty-five species were analysed, together withan outgroup for MULTIDIVTIME.Constraints were applied to two different nodes (Fig-
ure 5E). First, the constraint ‘>0.528 <0.538’ was placedon the (Myotragus, Ovis) node. This corresponds to thesame physical event that was described for BalearicPodarcis. Second, we added a ‘<1.4’ maximum bound onthe root, which Lalueza-Fox et al. [43] reported as theearliest likely time for the origin of this radiation. Thiswas specified using the RootAge control variable inMCMCTREE and the Bigtime variable in MULTIDIV-TIME. In MULTIDIVTIME the root age was specifiedfrom a G(4, 6.4516) distribution.
Additional material
Additional file 1: Black bass data. Sequences are in Phylip format.Partitions are in the order described in the manuscript.
Additional file 2: Primate-sucking Lice data. Sequences are in Phylipformat. Partitions are in the order described in the manuscript.
Additional file 3: Podarcis data. Sequences are in Phylip format.Partitions are in the order described in the manuscript.
Additional file 4: Gallotiinae data. Sequences are in Phylip format.Partitions are in the order described in the manuscript.
Additional file 5: Caprinae data. Sequences are in Phylip format.Partitions are in the order described in the manuscript.
AcknowledgementsThis work was carried out during a HEFCE sabbatical, funded through LJMU,to RPB. ZY was supported by a grant from BBSRC during this period. Thanksto Jose Castresana for the Caprinae data.
Author details1School of Natural Sciences & Psychology, Liverpool John Moores University,Liverpool L3 3AF, UK. 2Department of Genetics, Evolution and Environment,University College London, London WC1E 6BT, UK.
Authors’ contributionsRPB carried out the analyses and drafted the manuscript. ZY participated inits design and helped draft the manuscript. Both authors read and approvedthe final manuscript.
Received: 1 July 2011 Accepted: 26 September 2011Published: 26 September 2011
References1. Warren BH, Bermingham E, Bowie RCK, Prys-Jones RP, Thébaud C:
Molecular phylogeography reveals island colonization history anddiversification of western Indian Ocean sunbirds (Nectarinia:Nectariniidae). Mol Phy Evol 2003, 29:67-85.
Brown and Yang BMC Evolutionary Biology 2011, 11:271http://www.biomedcentral.com/1471-2148/11/271
Page 11 of 12

2. Wüster W, Ferguson JE, Quijada-Mascareñas JA, Pook CE, Salomão MG,Thorpe RS: Tracing an invasion: landbridges, refugia and thephylogeography of the Neotropical rattlesnake (Serpentes: Viperidae:Crotalus durissus). Mol Ecol 2005, 14:1095-1108.
3. Brown RP, Hoskisson PA, Welton JH, Báez M: Geological history andwithin-island diversity: a debris avalanche and the Tenerife lizardGallotia galloti. Mol Ecol 2006, 15:3631-3640.
4. Devitt TJ: Phylogeography of the western lyresnake (Trimorphodonbiscutatus): testing aridland biogeographical hypotheses across theNearctic-Neotropical transition. Mol Ecol 2006, 15:4387-4407.
5. Morris AB, Ickert-Bond SM, Brunson DB, Soltis DE, Soltis PS:Phylogeographical structure and temporal complexity in Americansweetgum (Liquidambar styraciflua; Altingiaceae). Mol Ecol 2008,17:3889-3900.
6. Thorne JL, Kishino H, Painter IS: Estimating the rate of evolution of therate of molecular evolution. Mol Biol Evol 1998, 15:1647-1657.
7. Drummond AJ, Ho SYW, Phillips MJ, Rambaut A: Relaxed phylogeneticsand dating with confidence. PLoS Biol 2006, 4:e88.
8. Yang Z, Rannala B: Bayesian estimation of species divergence timesunder a molecular clock using multiple fossil calibrations with softbounds. Mol Biol Evol 2006, 23:212-226.
9. Thorne JL, Kishino H: Estimation of divergence times from molecularsequence data. In Statistical methods in molecular evolution. Edited by:Nielsen R. New York, Springer-Verlag; 2005:233-256.
10. Yang Z: Computational molecular evolution Oxford, Oxford University Press;2006.
11. Sanderson MJ: A nonparametric approach to estimating divergencetimes in the absence of rate constancy. Mol Biol Evol 1997, 14:1218-1231.
12. Kishino H, Thorne JL, Bruno WJ: Performance of a divergence timeestimation method under a probabilistic model of rate evolution. MolBiol Evol 2001, 18:352-361.
13. Aris-Brosou S, Yang Z: Bayesian models of episodic evolution support alate pre-cambrian explosive diversification of the Metazoa. Mol Biol Evol2002, 20:1947-1954.
14. Yang Z: PAML 4: Phylogenetic analysis by maximum likelihood. Mol BiolEvol 2007, 24:1586-1591.
15. Drummond AJ, Rambaut A: BEAST: Bayesian evolutionary analysis bysampling trees. BMC Evol Biol 2007, 7:214.
16. Ho SYW, Philips MJ, Drummond AJ, Cooper A: Accuracy of rate estimationusing relaxed clock models with a critical focus on the early Metazoanradiation. Mol Biol Evol 2007, 22:1355-1363.
17. Ho SYW: An examination of phylogenetic models of substitution ratevariation among lineages. Biol Lett 2009, 5:421-424.
18. Lepage T, Bryant D, Philippe H, Lartillot N: A general comparison ofrelaxed molecular clock models. Mol Biol Evol 2007, 24:2669-2680.
19. McCormack JE, Heled J, Delaney KS, Peterson AT, Knowles LL: Calibratingdivergence times on species trees versus gene trees: implications forspeciation history of Aphelocoma Jays. Evolution 2010, 65:184-20.
20. Heled J, Drummond AJ: Calibrated Tree Priors for Relaxed Phylogeneticsand Divergence Time Estimation. Syst Biol 2011.
21. Martin AP, Palumbi SR: Body size, metabolic rate, generation time, andthe molecular clock. Proc Acad Nat Sci USA 1993, 90:4087-4091.
22. Bromham L, Rambaut A, Harvey PH: Determinants of rate variation inmammalian DNA sequence evolution. J Mol Evol 1996, 43:610-621.
23. Bromham L: Molecular clocks in reptiles: Life history influences rate ofmolecular evolution. Mol Biol Evol 2002, 19:302-309.
24. Lanfear R, Thomas J, Welch J, Brey T, Bromham L: Metabolic rate does notcalibrate the molecular clock. Proc Acad Nat Sci USA 2007,104:15388-15393.
25. Welch JJ, Bininda-Emonds OR, Bromham L: Correlates of substitution ratevariation in mammalian protein-coding sequences. BMC EvolutionaryBiology 2008, 8:53.
26. Gillooly JF, Allen AP, West GB, Brown JH: The rate of DNA evolution:effects of body size and temperature on the molecular clock. Proc AcadNat Sci USA 2005, 102:140-145.
27. Pereira SL, Baker AJ: A mitogenomic timescale for birds detects variablephylogenetic rates of molecular evolution and refutes the standardmolecular clock. Mol Biol Evol 2006, 23:1731-1740.
28. Wu CI, Li WH: Evidence for higher rates of nucleotide substitution inrodents than in man. Proc Acad Nat Sci USA 1985, 82:1741-1745.
29. Ohta T: An examination of the generation time effect on molecularevolution. Proc Acad Nat Sci USA 1993, 90:10676-10680.
30. Thomas JA, Welch JJ, Lanfear R, Bromham L: A generation time effect onthe rate of molecular evolution in invertebrates. Mol Biol Evol 2010,27:1173-1180.
31. Drummond AJ, Suchard MA: Bayesian random local clocks, or one rate torule them all. BMC Biology 2010, 8:114.
32. Felsenstein J: Evolutionary trees from DNA sequences: a maximumlikelihood approach. J Mol Evol 1981, 17:368-376.
33. Lanfear R: The local-clock permutation test: a simple test to comparerates of molecular evolution on phylogenetic trees. Evolution 2010,65:606-611.
34. Brown RP, Terrasa B, Pérez-Mellado V, Castro JA, Hoskisson PA, Picornell A,Ramon MM: Bayesian estimation of post-Messinian divergence times inBalearic Island lizards. Mol Phy Evol 2008, 48:350-358.
35. Hasegawa M, Kishino H, Yano T: Dating of the human-ape splitting by amolecular clock of mitchondrial DNA. J Mol Evol 1985, 22:160-174.
36. Thorne JL, Kishino H: Divergence time estimation and rate evolution withmultilocus datasets. Syst Biol 2002, 51:689-702.
37. Inoue J, Donoghue PCJ, Yang Z: The impact of the representation offossil calibrations on Bayesian estimation of species divergence times.Syst Biol 2010, 59:74-89.
38. Rannala B, Yang Z: Inferring speciation times under an episodicmolecular clock. Syst Biol 2007, 56:453-466.
39. Brown RP, Yang Z: Bayesian dating of shallow phylogenies with a relaxedclock. Syst Biol 2010, 59:119-131.
40. Near TJ, Kassler TW, Koppelman JB, Dillman CB, Philipp DP: Speciation inNorth American black basses, Micropterus (Actinopterygii: Centrarchidae).Evolution 2003, 57:1610-1621.
41. Light JE, Reed DL: Multigene analysis of phylogenetic relationships anddivergence times of primate sucking lice (Phthiraptera: Anoplura). MolPhy Evol 2009, 50:376-390.
42. Cox SC, Carranza S, Brown RP: Divergence times and colonization of theCanary Islands by Gallotia lizards. Mol Phy Evol 2010, 56:747-757.
43. Lalueza-Fox C, Castresana J, Sampietro L, Marques-Bonet T, Alcover JA,Bertranpetit J: Molecular dating of caprines using ancient DNAsequences of Myotragus balearicus, an extinct endemic Balearicmammal. BMC Evol Biol 2005, 5:70.
doi:10.1186/1471-2148-11-271Cite this article as: Brown and Yang: Rate variation and estimation ofdivergence times using strict and relaxed clocks. BMC EvolutionaryBiology 2011 11:271.
Submit your next manuscript to BioMed Centraland take full advantage of:
• Convenient online submission
• Thorough peer review
• No space constraints or color figure charges
• Immediate publication on acceptance
• Inclusion in PubMed, CAS, Scopus and Google Scholar
• Research which is freely available for redistribution
Submit your manuscript at www.biomedcentral.com/submit
Brown and Yang BMC Evolutionary Biology 2011, 11:271http://www.biomedcentral.com/1471-2148/11/271
Page 12 of 12