
Rapid Prototyping of NASA Next Generation Sensors N … · Rapid Prototyping of NASA Next...
12
1 Rapid Prototyping of NASA Next Generation Sensors with the Nonpoint-Source Pollution and Erosion Comparison Tool (N-SPECT) Justin Janaskie, Greg Easson, Lynn Francis University of Mississippi, University MS 38677 Executive Summary The purpose of this Rapid Prototyping Capability (RPC) experiment was to determine the compatibility of the current version of the Nonpoint-Source Pollution and Erosion Comparison Tool (N-SPECT) with a NASA next generation sensor relating to precipitation data by using the Tropical Rainfall Measuring Mission. By assessing the compatibility of N-SPECT with NASA next generation sensors, water resource managers in coastal and inland areas will have another source of precipitation measurements available to use in analyzing water quality issues. Currently, the recommended precipitation data for input into N-SPECT is annual or event scenarios using Parameter-elevation Regressions on Independent Slopes Model (PRISM) data or precipitation data from NOAA National Climatic Data Center. This experiment compares the results of N-SPECT output for erosion, runoff and sediment concentration by using a large, single precipitation event and applying it to three temporally different Coastal Change Analysis Program (C-CAP) datasets for basins on the Gulf coast of Mississippi to determine the validity of using a NASA next generation sensor as a substitute for the recommended precipitation datasets to successfully run N-SPECT. The project successfully demonstrated the compatibility of NASA next generation sensors, specifically simulated GPM precipitation data, with the N- SPECT model. 1.0 Introduction Coastal and freshwater environments are becoming more closely studied due to potential impacts caused by increased populations, land-use changes and climate change. These environments provide important regional and local resources than can support land or aquatic animal habitats, provide drinking water and create recreational areas for humans. Non-point source pollution is a major contributor to the decline in water quality in coastal areas. This type of erosion cannot be traced to a single point outlet, but rather to an area. In the rapidly developing coastal areas the source of the pollution may come from land development and land clearing, deforestation, agriculture, lawn fertilizers and farm practices. NOAA’s GIS based spatially distributed Nonpoint Source Pollution and Erosion Comparison Tool (N-SPECT) model was designed to compare the effects of different land cover and land use practices on pollutant yields. N-SPECT helps coastal managers and decision makers predict potential water quality impacts from non-point sources by predicting surface flow. Users must enter information about their area of interest such as a land use/land cover grid, digital elevation model, precipitation info, and a gridded soil map. The model uses variations of the Universal Soil Loss Equation (USLE) to
Transcript of Rapid Prototyping of NASA Next Generation Sensors N … · Rapid Prototyping of NASA Next...
1
Rapid Prototyping of NASA Next Generation Sensors with the Nonpoint-Source Pollution and Erosion Comparison Tool
(N-SPECT)
Justin Janaskie, Greg Easson, Lynn Francis University of Mississippi, University MS 38677
Executive Summary The purpose of this Rapid Prototyping Capability (RPC) experiment was to determine the compatibility of the current version of the Nonpoint-Source Pollution and Erosion Comparison Tool (N-SPECT) with a NASA next generation sensor relating to precipitation data by using the Tropical Rainfall Measuring Mission. By assessing the compatibility of N-SPECT with NASA next generation sensors, water resource managers in coastal and inland areas will have another source of precipitation measurements available to use in analyzing water quality issues. Currently, the recommended precipitation data for input into N-SPECT is annual or event scenarios using Parameter-elevation Regressions on Independent Slopes Model (PRISM) data or precipitation data from NOAA National Climatic Data Center. This experiment compares the results of N-SPECT output for erosion, runoff and sediment concentration by using a large, single precipitation event and applying it to three temporally different Coastal Change Analysis Program (C-CAP) datasets for basins on the Gulf coast of Mississippi to determine the validity of using a NASA next generation sensor as a substitute for the recommended precipitation datasets to successfully run N-SPECT. The project successfully demonstrated the compatibility of NASA next generation sensors, specifically simulated GPM precipitation data, with the N-SPECT model. 1.0 Introduction Coastal and freshwater environments are becoming more closely studied due to potential impacts caused by increased populations, land-use changes and climate change. These environments provide important regional and local resources than can support land or aquatic animal habitats, provide drinking water and create recreational areas for humans. Non-point source pollution is a major contributor to the decline in water quality in coastal areas. This type of erosion cannot be traced to a single point outlet, but rather to an area. In the rapidly developing coastal areas the source of the pollution may come from land development and land clearing, deforestation, agriculture, lawn fertilizers and farm practices. NOAA’s GIS based spatially distributed Nonpoint Source Pollution and Erosion Comparison Tool (N-SPECT) model was designed to compare the effects of different land cover and land use practices on pollutant yields. N-SPECT helps coastal managers and decision makers predict potential water quality impacts from non-point sources by predicting surface flow. Users must enter information about their area of interest such as a land use/land cover grid, digital elevation model, precipitation info, and a gridded soil map. The model uses variations of the Universal Soil Loss Equation (USLE) to
2
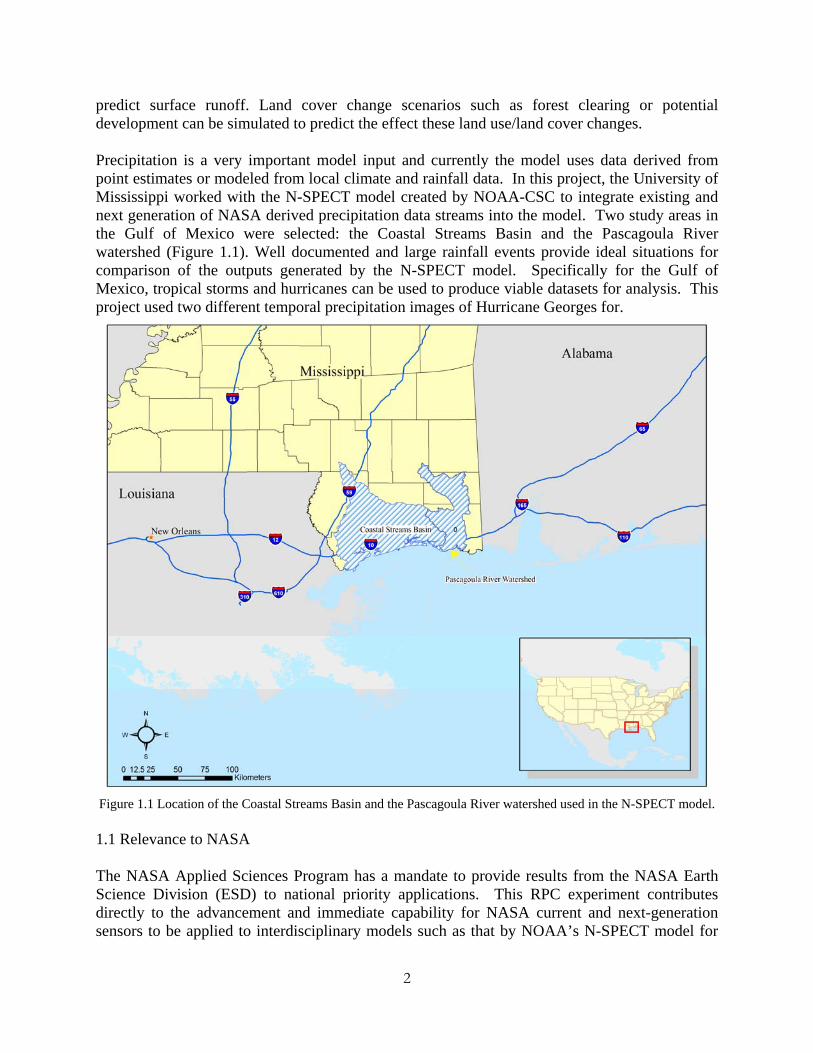
predict surface runoff. Land cover change scenarios such as forest clearing or potential development can be simulated to predict the effect these land use/land cover changes. Precipitation is a very important model input and currently the model uses data derived from point estimates or modeled from local climate and rainfall data. In this project, the University of Mississippi worked with the N-SPECT model created by NOAA-CSC to integrate existing and next generation of NASA derived precipitation data streams into the model. Two study areas in the Gulf of Mexico were selected: the Coastal Streams Basin and the Pascagoula River watershed (Figure 1.1). Well documented and large rainfall events provide ideal situations for comparison of the outputs generated by the N-SPECT model. Specifically for the Gulf of Mexico, tropical storms and hurricanes can be used to produce viable datasets for analysis. This project used two different temporal precipitation images of Hurricane Georges for.
Figure 1.1 Location of the Coastal Streams Basin and the Pascagoula River watershed used in the N-SPECT model. 1.1 Relevance to NASA The NASA Applied Sciences Program has a mandate to provide results from the NASA Earth Science Division (ESD) to national priority applications. This RPC experiment contributes directly to the advancement and immediate capability for NASA current and next-generation sensors to be applied to interdisciplinary models such as that by NOAA’s N-SPECT model for

3
use in aiding water resource managers from coastal and inland areas to monitor changes in erosion and runoff. This project also addresses the Earth Surface and Interior and Weather categories from the six National Focus Areas established by NASA ESD. 1.2 Introduction to the Model The N-SPECT model was developed by the NOAA Coastal Services Center (CSC) for use in GIS applications, specifically to be used as an extension in ESRI’s ArcGIS software. The original focus was for the Wai’anae Ecological Characterization on Oahu, Hawai’i. The model includes data for this region upon installation. The application of N-SPECT is not just limited to the Wai’anae area, but can be used anywhere that the minimum requirements for data inputs are available. The model works for both annual and event scenarios. The minimum required inputs for N-SPECT are:
• Land cover • Digital elevation model • Precipitation • Pollutant coefficients • Soil types • R-factor • Water quality standards
The last two inputs are specifically for management scenarios and for closely analyzing local effects. NOAA CSC recommends specific data sources for these inputs such as Parameter-elevation Regressions on Independent Slopes Model (PRISM) precipitation datasets from Oregon Climate Service and Coastal Change Analysis Program (C-CAP) data for land cover data to name a few examples. Although NOAA CSC recommends these data sources, the N-SPECT model is not limited to only using data from these sources. The model allows for numerous types of analyses to be performed for watershed studies. Although N-SPECT was developed for smaller sized coastal watershed, most medium to medium-large watersheds will work with the model. In some instances, watersheds could possibly be too large for the data preparation steps which will be discussed later. Depending on the data inputs and the scenario, annual or event precipitation, the following outputs will be created:
• Accumulated runoff • Pollutant loads
o Phosphorus, nitrogen, zinc, lead and suspended solids • Sediment loads • Pollutant concentration
These outputs are calculated using either the Revised Universal Soil Loss Equation (RUSLE) or Modified Universal Soil Loss Equation (MUSLE) depending on the scenario. These resultant datasets allow the coastal and inland managers and decision makers to evaluate possible effects from increased runoff, pollutant and sediment loads. By applying the model to different
4
temporal land cover datasets or using management scenarios to simulate future changes to land cover, trends and future increases or decreases in these output datasets can be recognized.
2.0 Data Preparation
All data necessary to run watershed analysis in the N-SPECT software for the Coastal Streams Basin and the lower Pascagoula sub-basin were collected and assembled according to the proper procedures outlined by NOAA CSC (NOAA, 2005). Land use/land cover C-CAP data and DEM data were acquired from the NOAA CSC Land Cover Analysis and United States Geological Survey (USGS) National Elevation Dataset websites, respectively. The soils data was acquired from the U.S. Department of Agriculture (USDA) Natural Resources Conservation Service (NRCS) Soil Survey Geographic Database. Although PRISM precipitation data is recommend, it is typically prepared as monthly or annual estimated total rainfall at a 4 km horizontal resolution. Due to the lack of temporal resolution from PRISM, a more frequent and global type of precipitation dataset was desired. TRMM 3b42 data provides the global coverage at 3 hourly totals, however at a 0.25°×0.25° resolution. With the future GPM mission, global coverage of 3 hours and better spatial resolution when compared to TRMM should be met. The resemblances of TRMM 3b42 to the related sensors on the GPM mission allow for a close comparison along with the ability for simulated GPM data to be generated. Hurricane Georges provides a large, single precipitation event that could be modeled in regards to runoff and erosion using N-SPECT. Hurricane Georges struck the Mississippi Gulf coast in September 1998. It was the second strongest storm of the Atlantic season making landfall near Biloxi, MS on September 28 as a Category One hurricane with an estimated 2.1-3.7 m storm surge and rainfall totals ranging from 250 to 500 mm around the Gulf coast (Pasch et al., 2001). TRMM 3b42 data was downloaded from the Goddard Earth Sciences Data and Information Services Center (GES DISC) for two different time periods occurring immediately after the landfall of Hurricane Georges. Due to the required input for generating proxy GPM data, NEXRAD data was also downloaded from the NOAA National Climatic Data Center (NCDC) for the corresponding times of the TRMM 3b42 data. The NEXRAD data was processed and exported to the ESRI ASCII grid format using the Java NEXRAD Viewer. The TRMM 3b42 data was processed and georeferenced to the ESRI ASCII grid format also due to the N-SPECT input requirements. Processing to resample TRMM to proxy GPM is described below.
2.2 Generating Proxy GPM Data using NEXRAD and TRMM 3b42 data products
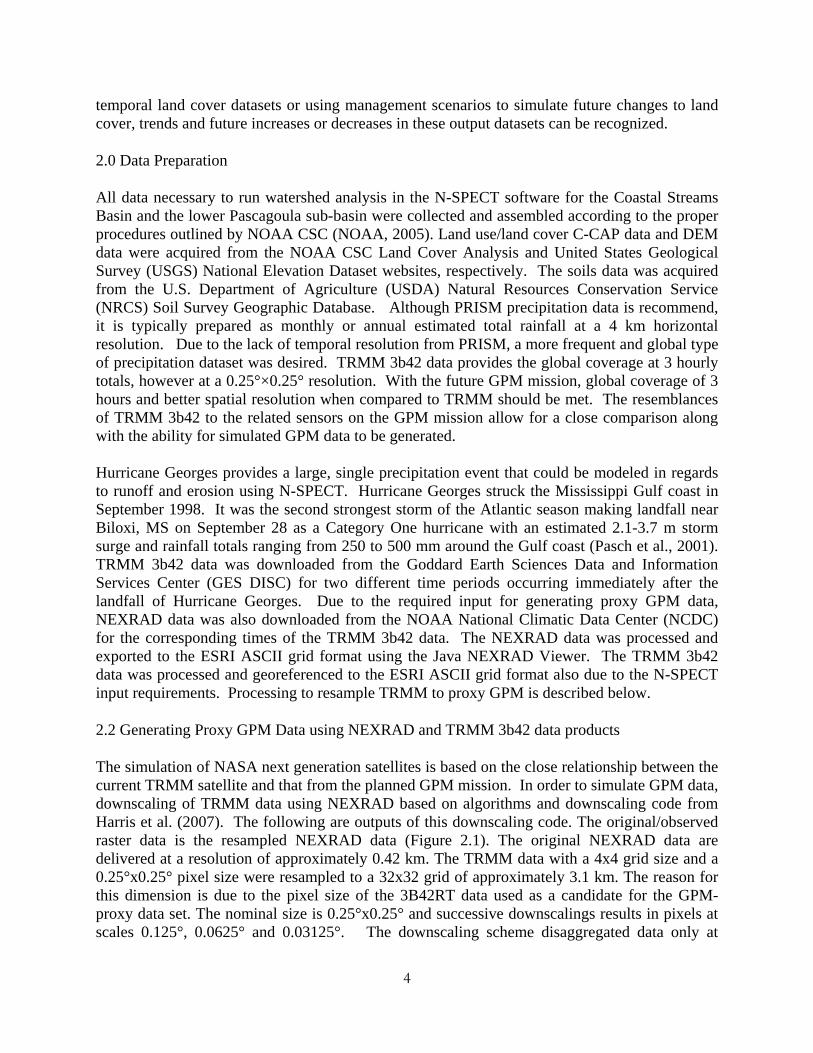
The simulation of NASA next generation satellites is based on the close relationship between the current TRMM satellite and that from the planned GPM mission. In order to simulate GPM data, downscaling of TRMM data using NEXRAD based on algorithms and downscaling code from Harris et al. (2007). The following are outputs of this downscaling code. The original/observed raster data is the resampled NEXRAD data (Figure 2.1). The original NEXRAD data are delivered at a resolution of approximately 0.42 km. The TRMM data with a 4x4 grid size and a 0.25°x0.25° pixel size were resampled to a 32x32 grid of approximately 3.1 km. The reason for this dimension is due to the pixel size of the 3B42RT data used as a candidate for the GPM-proxy data set. The nominal size is 0.25°x0.25° and successive downscalings results in pixels at scales 0.125°, 0.0625° and 0.03125°. The downscaling scheme disaggregated data only at
5
successively half scales (and hence the degree scales at 0.0125, 0.0625 and 0.03125). At the latitude of the study area, a 0.03125°x0.03125° pixel is approximately 3.03 km x 3.03 km. This scale is approximate to the proposed GPM pixel scale. Given the successful downscaling method of the TMPA-3B42RT product in current RPC experiments (Harris et al., 2007) the spatial downscaling scheme proposed by Perica and Foufoula-Georgiou (1996) was used for the rainfall disaggregation process. The validation of the scheme and MATLAB code is documented in Harris et al., (2007). The TMPA-3B41RT and TMPA-3B42RT products have been used as a proxy for the anticipated GPM precipitation products (personal communication with Dr. Huffman), yet the downscaling process lack the “structure” of the storm event while still preserving the statistics of the original pixel. During the decomposition process, the actual structure of the precipitation field is not known and only the greater-resolution NEXRAD precipitation data shows the structure of the storms. For the current RPC effort, the structure of the storm event was needed as an input to the N-SPECT model. Therefore the NEXRAD data was resampled to a 0.03125°x0.03125° grid with 32 x 32 elements. This was then compared to the simulated GPM product of 0.03125°x0.03125° grid with 32x32 elements derived from the TMPA product of 0.25°x0.25° with 4x4 elements. As shown in Figure 2.1, the resampled, observed data (NEXRAD) best retains the banding structure of the storm event at the anticipated scale for GPM. One of the other issues that are a result of the proxy GPM generated data is that of the over-estimation of precipitation values by TRMM. This was identified when comparing the NEXRAD data to the original TRMM data.
2.3 Populating the N-SPECT model with NEXRAD data
The procedure for generating proxy GPM data required raster precipitation datasets with n × n dimensions. The exact location of the landfall and shape of Hurricane Georges made the data preparation for all the two watersheds slightly difficult. Due to these constraints and the proximity of the watersheds, the NEXRAD data was processed based on the precipitation data present in the Pascagoula River watershed. This dataset was then shifted westward by 0.5° in order to replicate the landfall of Hurricane Georges for the Coastal Streams Basin of Mississippi (Figure 2.2). This was done to reduce the no-data areas that would have been present in the Coastal Streams Basin due to the common precipitation spiral bands that form in hurricanes and tropical storms (Guinn and Schubert, 1993). After all data processing was competed, the N-SPECT model was conducted using the two temporally different NEXRAD datasets for each of
Figure 2.1. NEXRAD original/observed datasets from Hurricane Georges used to produce the simulated GPM proxy data.

6
the two watersheds. Also, for each NEXRAD image and each watershed, multiple C-CAP datasets (1996, 2001 and
Figure 2.2 The shift of the precipitation grids by 0.5° was done due to the size and landfall location of Hurricane
Georges. By doing this, the same precipitation scenarios could be recreated for each time the N-SPECT model was run on the different study areas.
2005) were used in order to demonstrate the capabilities of the N-SPECT model for change detection illustrating the rapid temporal land cover changes that can affect erosion and runoff if a large single precipitation event were to occur.
2.4 Populating the N-SPECT model with proxy GPM data
Based on the procedure used for the NEXRAD datasets, the proxy GPM datasets were also shifted westward by 0.5° in order to replicate the landfall of Hurricane Georges for the Coastal Streams Basin of Mississippi. After all data processing was competed, the N-SPECT model was conducted using the two temporally different proxy GPM datasets for each of the two watersheds. Also, for each proxy GPM image and each watershed, multiple C-CAP datasets (1996, 2001 and 2005) were used in order to demonstrate the capabilities of the N-SPECT model

7
for change detection illustrating the rapid temporal land cover changes that can affect erosion and runoff if a large single precipitation event were to occur.
3.0 Application of the N-SPECT model to the Mississippi Gulf Coast Basins Originally it was planned for this project to use the N-SPECT model on both the Coastal Streams Basin and the Pascagoula River Basin. However, the Pascagoula River Basin was too large for N-SPECT to model the soil relationships in the data preparation stages (Figure 3.1). Because of this, the Pascagoula River watershed was selected to be of a more ideal size to run the model. The Coastal Streams Basin includes the Wolf, Jourdan, Big and Little Biloxi, and Tchoutacabouffa Rivers. The Pascagoula River Basin includes the Leaf, Chickasawhay and Pascagoula Rivers, while the lower Pascagoula River watershed includes the lower portions of the Pascagoula River. Aside from the impact of tropical storms and hurricanes on the Mississippii Gulf coast, other reasons for applying this project to this area include the fact that the Pascagoula River is one of the last unaltered river systems in the lower 48 states. This is a representative study area that shows the relationship between climate and a relatively unaltered river basin in the United States (Chapman & Reed, 2006).
Figure 3.1 The size differences between the Pascagoula River watershed and the Pascagoula River basin are easily
noticed. N-SPECT data preparation steps were unable to be completed for the Pascagoula River basin because of its extremely large size.
8
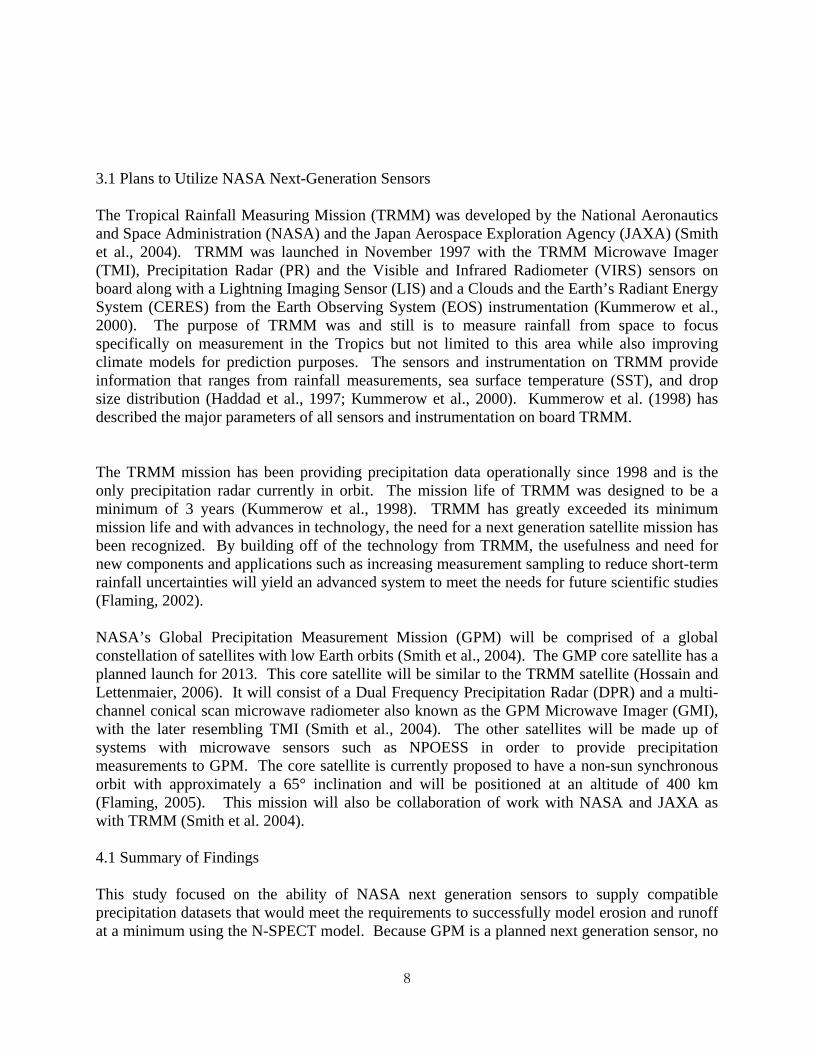
3.1 Plans to Utilize NASA Next-Generation Sensors The Tropical Rainfall Measuring Mission (TRMM) was developed by the National Aeronautics and Space Administration (NASA) and the Japan Aerospace Exploration Agency (JAXA) (Smith et al., 2004). TRMM was launched in November 1997 with the TRMM Microwave Imager (TMI), Precipitation Radar (PR) and the Visible and Infrared Radiometer (VIRS) sensors on board along with a Lightning Imaging Sensor (LIS) and a Clouds and the Earth’s Radiant Energy System (CERES) from the Earth Observing System (EOS) instrumentation (Kummerow et al., 2000). The purpose of TRMM was and still is to measure rainfall from space to focus specifically on measurement in the Tropics but not limited to this area while also improving climate models for prediction purposes. The sensors and instrumentation on TRMM provide information that ranges from rainfall measurements, sea surface temperature (SST), and drop size distribution (Haddad et al., 1997; Kummerow et al., 2000). Kummerow et al. (1998) has described the major parameters of all sensors and instrumentation on board TRMM. The TRMM mission has been providing precipitation data operationally since 1998 and is the only precipitation radar currently in orbit. The mission life of TRMM was designed to be a minimum of 3 years (Kummerow et al., 1998). TRMM has greatly exceeded its minimum mission life and with advances in technology, the need for a next generation satellite mission has been recognized. By building off of the technology from TRMM, the usefulness and need for new components and applications such as increasing measurement sampling to reduce short-term rainfall uncertainties will yield an advanced system to meet the needs for future scientific studies (Flaming, 2002). NASA’s Global Precipitation Measurement Mission (GPM) will be comprised of a global constellation of satellites with low Earth orbits (Smith et al., 2004). The GMP core satellite has a planned launch for 2013. This core satellite will be similar to the TRMM satellite (Hossain and Lettenmaier, 2006). It will consist of a Dual Frequency Precipitation Radar (DPR) and a multi-channel conical scan microwave radiometer also known as the GPM Microwave Imager (GMI), with the later resembling TMI (Smith et al., 2004). The other satellites will be made up of systems with microwave sensors such as NPOESS in order to provide precipitation measurements to GPM. The core satellite is currently proposed to have a non-sun synchronous orbit with approximately a 65° inclination and will be positioned at an altitude of 400 km (Flaming, 2005). This mission will also be collaboration of work with NASA and JAXA as with TRMM (Smith et al. 2004). 4.1 Summary of Findings This study focused on the ability of NASA next generation sensors to supply compatible precipitation datasets that would meet the requirements to successfully model erosion and runoff at a minimum using the N-SPECT model. Because GPM is a planned next generation sensor, no

9
real data from that sensor is available. However, using the TRMM 3b42 data coupled with NEXRAD data, proxy GPM data was simulated and processed allowing for input into N-SPECT. Although the simulated data loses any features such as the banding structures that were present in the input data, a precipitation grid was still generated that modeled a random rainfall event. After the processing of all data, including other inputs such as land cover, DEM's, and soils data, the N-SPECT model was successfully run. The output data that was generated from N-SPECT resulted in the expected datasets that are normally output whenever the model is run using the recommended precipitation datasets. The temporal resolution of the GPM data based on two periods during Hurricane Georges was not effective because of the loss of the original storm structure from the NEXRAD input data. As shown when the NEXRAD data was used to run the model, temporally different images that retained the structure of Hurricane Georges will show how the direction of a hurricane can affect a watershed in regards to runoff and erosion (Figure 4.1). Once GPM has launched and begins to produce, this will also be possible.
Figure 4.1 This image illustrates how N-SPECT handles precipitation grids that have areas without any measurable rainfall. For this study area the banding structures of Hurricane Georges determine where areas without rainfall will occur over a matter of hours. These rectangles (identified by arrows) that are present are dependent upon the pixel
size of the input precipitation grid. 4.2 Recommendations

10
From these results the following can be concluded: 1. Next-generation satellites that measure precipitation such as GPM will be compatible with the N-SPECT model from NOAA CSC. 2. The planned increase in resolution and coverage for GPM will provide a better alternative to be used as a precipitation grid that could become a recommended data input into the model. 3. Cooperative work between satellite development teams and other government agencies that provide software aimed at using precipitation data as an input should be encouraged and a continuous process throughout the satellite and even the software development stages. 4.3 Future Directions NOAA CSC plans to release N-SPECT version beta soon to address some issues with the National Land Class Datasets (NLCD). Next steps include testing the beta version to ensure that the compatibility with the N-SPECT model and simulated GPM data. Ideally, future versions of N-SPECT could greatly benefit from having a ground saturation modeling capability to add to the accuracy of estimating runoff and erosion. Generating additional proxy GPM datasets that vary in temporal scales such as monthly measurements could also provide additional verification of the compatibility for use within the N-SPECT model. The ability to apply the methodology for this study to other coastal and inland areas and other types of land classes will allow for a more in-depth analysis on the relationship between proxy GPM data and the N-SPECT model.
11
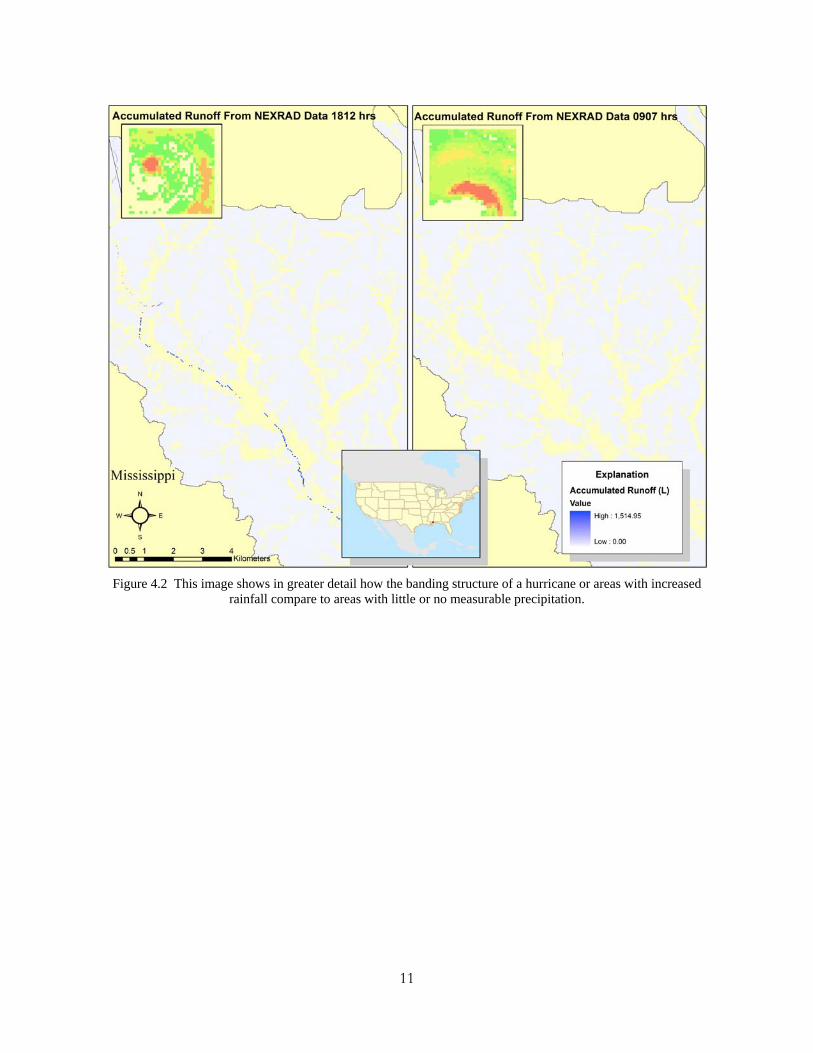
Figure 4.2 This image shows in greater detail how the banding structure of a hurricane or areas with increased
rainfall compare to areas with little or no measurable precipitation.
12
REFERENCES Chapman, P., and Reed, D., 2006. Advanced in coastal habitat restoration in the northern Gulf of
Mexico, Ecological Engineering, v. 26, p. 1-5. Flaming, M.G., 2002. Requirements for global precipitation measurement, IGARSS'02
Proceedings, Toronto, Canada, IEEE, v. 1, p. 269-271. Guinn, T.A., and Schubert, W.H., 1993. Hurricane spiral bands, Journal of the Atmospheric
Sciences, v. 50, p. 3380-3403. Harris, A., Rahman, S., Hossain, F., Yarbrough, L.D., Bagtzolgou, L.G., and Easson, G., 2007.
Satellite-based flood modeling using TRMM-based rainfall products and statistical downscaling, Sensors, v. 7, p. 3416–3427.
Hossain, F., and Lettenmaier, D.P., 2006. Flood prediction in the future: Recognizing hydrologic
issues in anticipation of the Global Precipitation Measurement mission, Water Resources Research, v. 42, doi:10.1029/2006WR005202.
Kummerow, C., and Barnes, W., 1998. The Tropical Rainfall Measuring Mission (TRMM)
sensor package, Journal of Atmospheric and Oceanic Technology, v. 15, p. 809-817. Kummerow, C., Simpson, J., Thiele, O., Barnes, W., Chang, A.T.C., Stocker, E., Adler, R.F.,
Hou, A., Kakar, R., Wentz, F., Ashcroft, P., Kozu, T., Hong, Y., Okamoto, K., Iguchi, T., Kuroiwa, H., Im, E., Haddad, Z., Huffman, G., Ferrier, B., Olson, W.S., Zipser, E., Smith, A., Wilheit, T.T., North, G., Krishnamurti, T., and Nakamura, K., 2004. The status of the Tropical Rainfall Measuring Mission (TRMM) after two years in orbit, Journal of Applied Meteorology, v. 39, p. 1965-1982.
Nijssen, B., and Lettenmaier, D.P., 2004. Effect of precipitation sampling error on simulated
hydrological fluxes and states: Anticipating the Global Precipiation Measurement satellites, Journal of Geophysical Research, v. 109, D02103.
Perica, S., and Foufoula-Goergiou, E., 1996. Model for multiscale disaggregation of spatial
rainfall based on coupling meteorological and scaling descriptions, Journal of Geophysical Research, v. 101, p. 26,347-26,361.
Smith, E.A., Asrar, G., Furuhama, Y., Ginati, A., Kummerow, C., Levizzani, V., Mugnai, A.,
Nakamura, K., Adler, R., Casse, V., Cleave, M., Debois, M., Durning, J., Entin, J., Houser, P., Iguchi, T., Kakar, R., Kaye, J., Kojima, M., Lettenmaier, D., Luther, M., Mehta, A., Morel, P., Nakazawa, T., Neeck, S., Okamoto, K., Oki, R., Raju, G., Shepherd, M., Stocker, E., Testud, J., and Wood, E., 2004. International Global Precipitation Measurement (GPM) program and mission: An overview, in Measuring Precipitation from Space: EURAINSAT and the Future, edited by V. Levizzani and F. J. Turk, Kluwer Academic Publishers, in press.


![Rapid Prototyping in PVS - NASA...Common Lisp code for a large set of PVS constructs [8]. The ground evaluator is a fundamental mechanism for rapid prototyping in PVS. How-ever, it](https://static.fdocuments.in/doc/165x107/5ed98f531b54311e7967c9e7/rapid-prototyping-in-pvs-nasa-common-lisp-code-for-a-large-set-of-pvs-constructs.jpg)

